rigless production monitoring- - spe-uk.org · pdf filerigless production monitoring- ......
TRANSCRIPT

1 THE WIRELESS DOWNHOLE PRODUCTION PROFILE Discover more • www.resman-themovie.com
Rigless Production Monitoring- Chemical Production Logging Technology
Dr. Christian A. Andresen Sr. Tracer Surveillance Analyst

2 THE WIRELESS DOWNHOLE PRODUCTION PROFILE
Outline
• Technology fundamentals – How It Works
• Case Study
• Flow loop verification
• Q&A

3 THE WIRELESS DOWNHOLE PRODUCTION PROFILE
Riskfree Downhole Surveillance

4 THE WIRELESS DOWNHOLE PRODUCTION PROFILE
Molecule Release Constant release rate
(Flow rate independent)
TRACER SYSTEM Up to 90 (50 oil + 40 water)
unique intelligent molecule IDs
Unique tracer molecule
Polymer Matrix
Integration to well completion
How it Works • Fundamentals
CARRIER ASSEMBLY Pup-joint or standard completion component
FLUID CONTACT Triggers oil or water tracer release

5 THE WIRELESS DOWNHOLE PRODUCTION PROFILE
How it Works • Sampling and Interpretation
Sample Production
Lab Analysis
Downhole Surveillance Information
Data Interpretation In house team of analysts

6 THE WIRELESS DOWNHOLE PRODUCTION PROFILE
How it Works • Integrating Tracers in Completion
Integration of RESMAN tracer rods into screens
Integration of RESMAN tracer filaments into premium mesh screens
RESMAN rods and filaments
integrated with carrier
Identification for well completion

7 THE WIRELESS DOWNHOLE PRODUCTION PROFILE
What can tracer technology provide ? Permanent Production Surveillance
• Inflow distribution
• Water influx detection
• Inflow assurance • Are all zones contributing ? • Are mechanical devices working ? • Are all wells/zones/laterals flowing ?
?

8 THE WIRELESS DOWNHOLE PRODUCTION PROFILE
ICD case study
5 1/2’’ Weatherford MaxFlo ICD screen
• Sub-sea development
• 19 km tie-back to platform
• Dual lateral ICD completed well
• 10 oil and 10 water tracer systems installed

9 THE WIRELESS DOWNHOLE PRODUCTION PROFILE
• Sample selection done by PVT analysis, compared to OLGA simulation
ICD case study – sampling and production data

10 THE WIRELESS DOWNHOLE PRODUCTION PROFILE
ICD case study – re-start tracer responses A) Steady-state released tracer from last production period
B) High concentration fluids from shut-in period
C) Steady-state response from stable production
All tracers detected and within expected levels: Production at toe of
both laterals confirmed, flow past all tracers confirmed
A
B
C

11 THE WIRELESS DOWNHOLE PRODUCTION PROFILE
Flush-out theory
• Shut-in fluids assumed stagnant
high concentration volumes form
• Once the well is started up
high tracer concentration cloud will be flushed-out
• The rate of decline in the tracer concentration is dependent on
the production past the tracer carriers
• Flow estimations are based on history-matching. A steeper
curve signifies a higher flow past the tracer systems and thus
higher production Q in the section
Q
2Q

12 THE WIRELESS DOWNHOLE PRODUCTION PROFILE
Tracer systems placed inside the ICD screen

13 THE WIRELESS DOWNHOLE PRODUCTION PROFILE
Systems come in contact with oil they release a unique chemical fingerprint (tracer) into the oil

14 THE WIRELESS DOWNHOLE PRODUCTION PROFILE
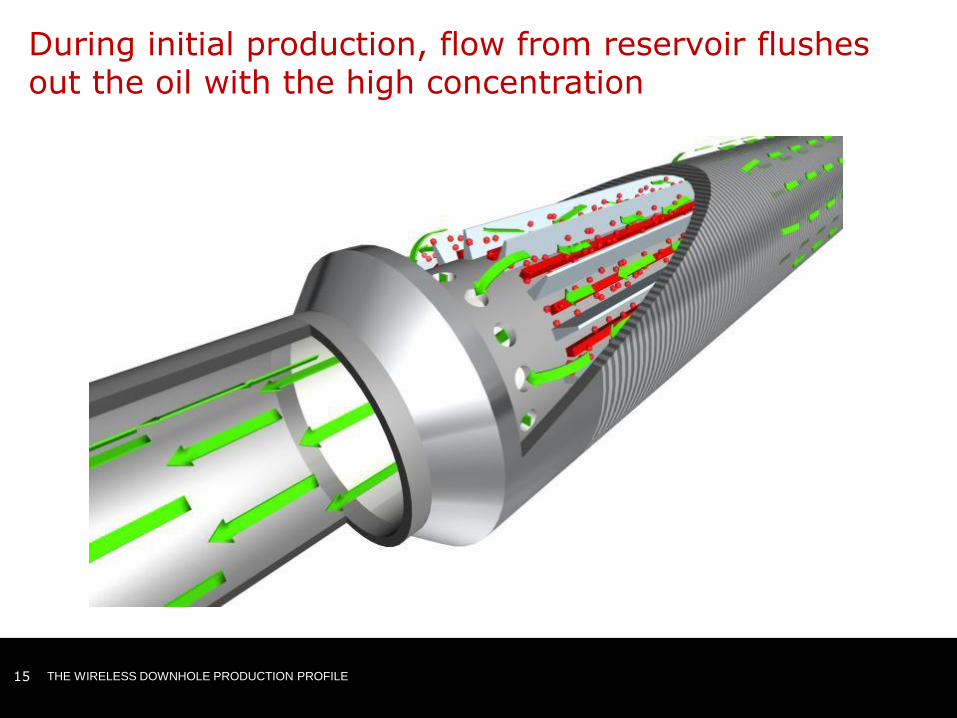
When well is in a static condition, the concentration of tracer builds up around the vicinity of screen
15 THE WIRELESS DOWNHOLE PRODUCTION PROFILE
During initial production, flow from reservoir flushes out the oil with the high concentration

16 THE WIRELESS DOWNHOLE PRODUCTION PROFILE
Inflow rate from the reservoir determines how fast the ICD is flushed out

17 THE WIRELESS DOWNHOLE PRODUCTION PROFILE
Oil with high concentration of tracer enters the main flow path and is carried to surface

18 THE WIRELESS DOWNHOLE PRODUCTION PROFILE
Eventually a steady state concentration occurs which is the result of the total flow rate and the tracer release rate
Q
2Q
19 THE WIRELESS DOWNHOLE PRODUCTION PROFILE
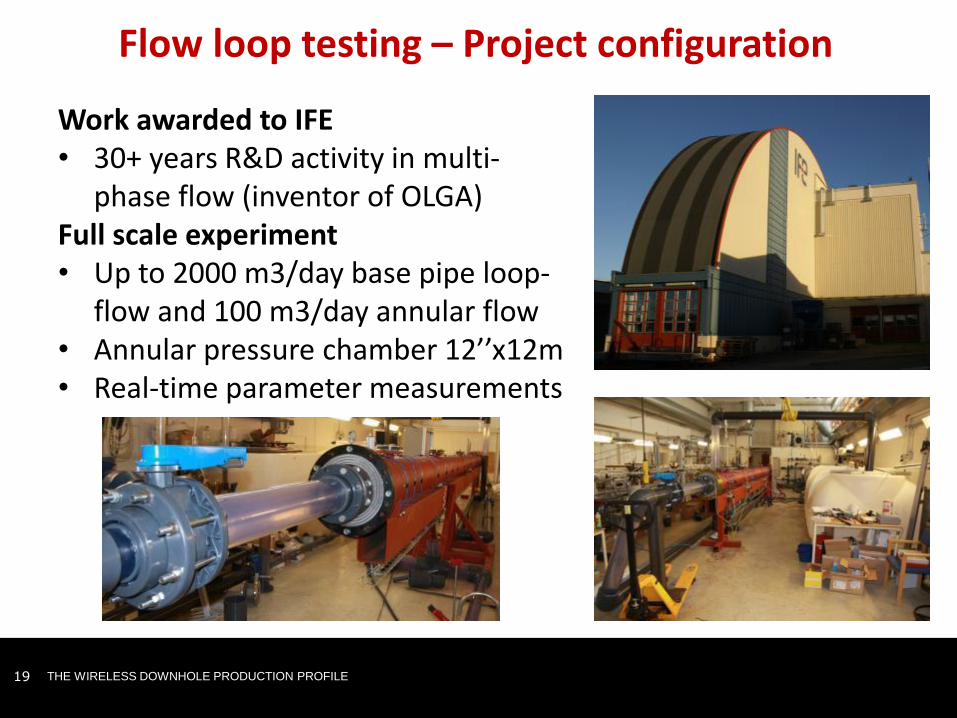
Flow loop testing – Project configuration
Work awarded to IFE • 30+ years R&D activity in multi-
phase flow (inventor of OLGA) Full scale experiment • Up to 2000 m3/day base pipe loop-
flow and 100 m3/day annular flow • Annular pressure chamber 12’’x12m • Real-time parameter measurements

20 THE WIRELESS DOWNHOLE PRODUCTION PROFILE
Flow loop testing – experimental lay-out
Annular reservoir
Main reservoir 15 m3
F
F
F F F
F Flourometer
Flowmeter

21 THE WIRELESS DOWNHOLE PRODUCTION PROFILE
Flow loop testing – experimental lay-out
Current configuration • 6 5/8” HALLIBURTON ww sandscreen testing • Basepipe flow: 100 – 2000 m3/day variations • Annular flow: 3 - 72 m3/day variations • Multiple inflow variations tested for model verifications

25 THE WIRELESS DOWNHOLE PRODUCTION PROFILE
Flow loop testing – Results changing annular flow rate

26 THE WIRELESS DOWNHOLE PRODUCTION PROFILE
Flow loop testing – Model fit vs. experimental values
Experimental flow rate
RE
SM
AN
mo
de
l e
sti
ma
te
RESMAN quantitative flow models are well suited for flowback interpretation

27 THE WIRELESS DOWNHOLE PRODUCTION PROFILE
RESMAN flush-out model shows
excellent fit to experimental data
Model incorporated into iRES
Flow loop testing – results

28 THE WIRELESS DOWNHOLE PRODUCTION PROFILE
Tracer Flush-out Curve Fittings
k9 = 1.00 k7 = 0.41
k10 = 0.45 k8 = 0.52
k4 = 0.38
k2 =
0.41
k5 = 0.59
k3 = 0.45 k6 = 0.52
k1 =
0.45
• Flush-out response fitted for cumulative produciton > 1000 m3

29 THE WIRELESS DOWNHOLE PRODUCTION PROFILE
Tracer Flush-out Production Estimates
• Production from both monitred and non-
monitored zones included

30 THE WIRELESS DOWNHOLE PRODUCTION PROFILE
Thank you for your time
www.resman.no and www.resman-themovie.com