right-sizing: the right move t in the airline business h c w. hamlin hamlin transportation...
TRANSCRIPT

George W. Hamlin
Hamlin Transportation Consulting
Fairfax, Virginia
Right-Sizing: The Right Move
in the Airline Business
December 11, 2012
Northwestern University
Icarus Society
HTCHTCTC 1

Fundamental Airline Economics
Which is more important?
• Unit Costs
• Yields
2

Two Ways to Make Money
COMMODITY:
Sell a large quantity at a low margin
DIFFERENTIATED PRODUCT:
Sell a small quantity at a high margin
3

0
5
10
15
20
25
RASM CASM RASM CASM
MARGIN
Two Ways to Make Money:
Unit Profitability
COMMODITY
DIFFERENTIATED PRODUCT
MARGIN
¢/ASM
4
In the Airline Business
The Love of Capacity
Is the Root of All Evil
5

U.S. Airline Net Profits 1947-2010
Source: ATA Data
$(30,000)
$(25,000)
$(20,000)
$(15,000)
$(10,000)
$(5,000)
$-
$5,000
$10,000
$15,000
$20,000
$25,000 1
94
7
19
49
19
51
19
53
19
55
19
57
19
59
19
61
19
63
19
65
19
67
19
69
19
71
19
73
19
75
19
77
19
79
19
81
19
83
19
85
19
87
19
89
19
91
19
93
19
95
19
97
19
99
20
01
20
03
20
05
20
07
20
09
U.S. Airline Profitability ($M)
Net Income
6

U.S. Airline Net Profit: Regulated Era
Source: ATA Data
$(400)
$(200)
$-
$200
$400
$600
$800
$1,000
$1,200
$1,400 19
47
1948
1949
1950
1951
1952
1953
1954
1955
1956
1957
1958
1959
1960
1961
1962
1963
1964
1965
1966
1967
1968
1969
1970
1971
1972
1973
1974
1975
1976
1977
1978
U.S. Airline Profitability ($M)
Net Income
7

What Caused the 1970 Losses?
8 Photo © George Hamlin

One Thing that Caused the 1970 Losses
0
10
20
30
40
50
60
70
80
90
100
1969197119731975197719791981198319851987198919911993199519971999200120032005200720092011
747 Deliveries
9 Source: The Airline Monitor, May 2012

An Extraordinary Chunk of Capacity
0.0%
5.0%
10.0%
15.0%
20.0%
25.0%
30.0%
747 Deliveries as a Percent of Total
10 Source: The Airline Monitor, May 2012

U.S. Airline Net Profit: Post-Deregulation
Source: ATA Data
-$30,000
-$25,000
-$20,000
-$15,000
-$10,000
-$5,000
$0
$5,000
$10,000
$15,000
$20,000
$25,0001
97
9
19
80
19
81
19
82
19
83
19
84
19
85
19
86
19
87
19
88
19
89
19
90
19
91
19
92
19
93
19
94
19
95
19
96
19
97
19
98
19
99
20
00
20
01
20
02
20
03
20
04
20
05
20
06
20
07
20
08
20
09
20
10
U.S. Airline Profitability ($M)
Net Income
11

1980s Right-Sizing: Problem
12 Photo © George Hamlin

1980s Right-Sizing: Solution
13 Photo © George Hamlin

Long-Haul, 1980s-Style
Transatlantic Transpacific
14 Photos © George Hamlin

Long-Haul, 1990s-Style
15 Photos © George Hamlin

The 1990s: Heyday of the RJ
16 Photos © George Hamlin
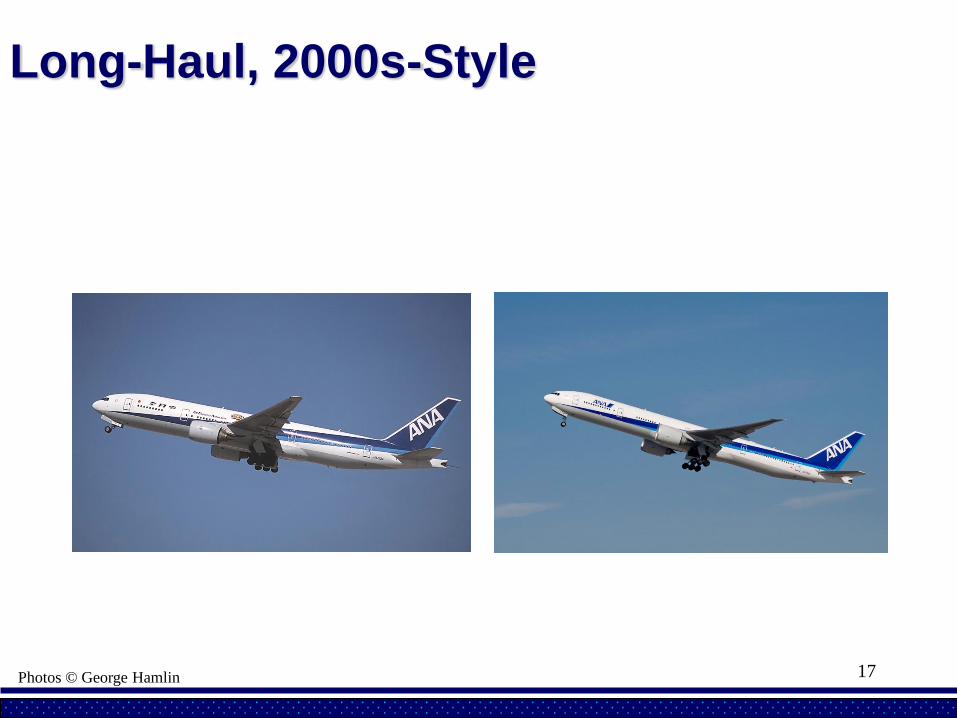
Long-Haul, 2000s-Style
17 Photos © George Hamlin

The Intercontinental A319
18 Photo © George Hamlin

And the First of Two Game-Changing
Aircraft is Now in Service
19 Photos © George Hamlin

Once, Pricing was Fairly Uniform,
and was Available in Print
20
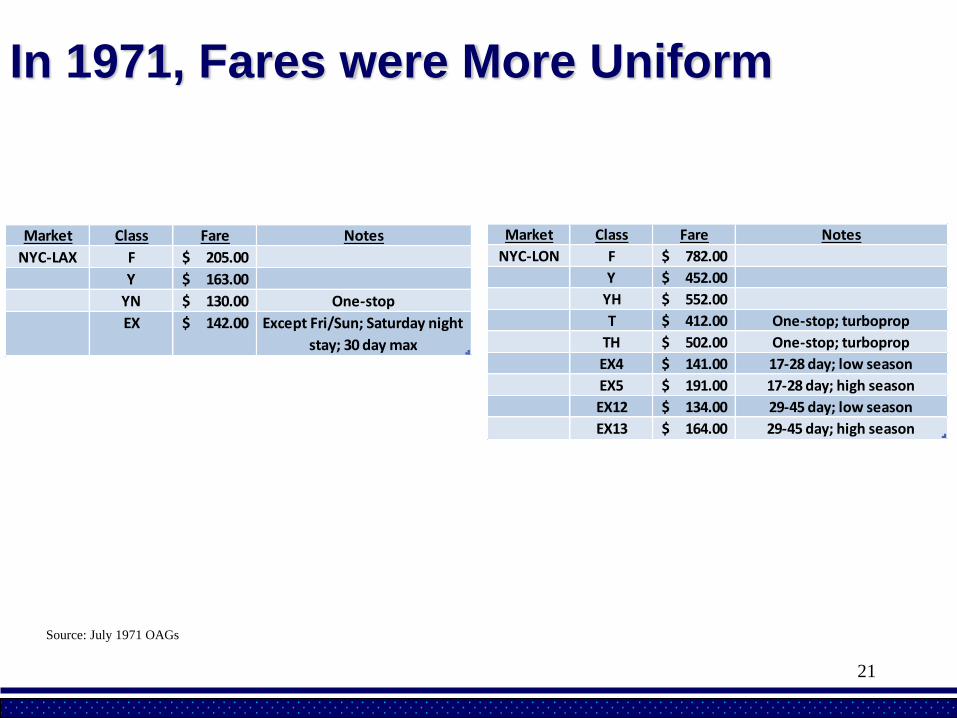
In 1971, Fares were More Uniform
Market Class Fare Notes
NYC-LAX F 205.00$
Y 163.00$
YN 130.00$ One-stop
EX 142.00$ Except Fri/Sun; Saturday night
stay; 30 day max
Market Class Fare Notes
NYC-LON F 782.00$
Y 452.00$
YH 552.00$
T 412.00$ One-stop; turboprop
TH 502.00$ One-stop; turboprop
EX4 141.00$ 17-28 day; low season
EX5 191.00$ 17-28 day; high season
EX12 134.00$ 29-45 day; low season
EX13 164.00$ 29-45 day; high season
Source: July 1971 OAGs
21

Preparing for the pricing challenge of
deregulation
22

9% of United’s passengers
produce 41% of the revenue.
Source: Gerald Greenwald, Former United CEO, in a speech at The Washington, D.C. Aero Club May 27, 1999
23

Effective Yield Management Can
Enhance Profitability
3 3
6 6
9 12
11
25 15
49
0
10
20
30
40
50
60
70
80
90
100
CR7 B737
Pas
sen
gers
pe
r D
ay
Sample Short-Haul Market: CR7 vs. B737 by Onboard Passenger Yield Band
> 50¢ 40¢ - 50¢ 30¢ - 40¢ 20¢ - 30¢ < 20¢
22.4¢ avg.
29.4¢ avg.
24 Source: Airline data

Higher-Yield Passengers are More
Valuable than Lower-Yield Traffic
Yield Band 737-800 CRJ 700
% of Passengers % of Revenue % of Passengers % of Revenue
< 20¢ 51.6% 28.5% 34.1% 14.4%
20¢ - 30¢ 26.5% 28.9% 26.4% 22.7%
30¢ - 40¢ 12.7% 19.5% 19.7% 22.8%
40¢ - 50¢ 6.3% 12.7% 13.9% 21.2%
> 50¢ 3.0% 10.4% 6.0% 18.9%
Total 100.0% 100.0% 100.0% 100.0%
Avg Yield 0.224$ 0.294$
25

Sometimes Less (Passengers) is
More (Higher Yield)
Type Passengers Yield
737-800 95 0.224$
CRJ 700 43 0.294$
26

Direct Operating Cost by Type
$-
$0.0200
$0.0400
$0.0600
$0.0800
$0.1000
$0.1200
$0.1400
$0.1600
$0.1800
$0.2000
737-800 CRJ 700 CRJ 1/200
Direct Cost per ASM: 350 Miles(Stage Length Adjusted)
Cost per ASM
27 Source: The Airline Monitor, August 2012

DOC Indexed to the 737
100%
113%
140%
0%
20%
40%
60%
80%
100%
120%
140%
160%
737-800 CRJ 700 CRJ 1/200
Direct Cost per ASM: 350 Miles Indexed to 737(Stage Length Adjusted)
Cost per ASM
28 Source: The Airline Monitor, August 2012

CRJ 700, Margin Improvement
CRJ 1/200, FAIL
100%
113%
140%
100%
131% 131%
0%
20%
40%
60%
80%
100%
120%
140%
160%
737-800 CRJ 700 CRJ 1/200
Revnue & Cost per ASM: 350 Miles Indexed to 737
(Cost Stage Length Adjusted)
Cost per ASM Revenue per ASM
29

All travelers are not
equal, from a
revenue perspective;
some should get left
behind
30

Airline Economics 101
Frequency
Share of High-Yield Traffic
Greater Profitability
Higher Return on Investment
31
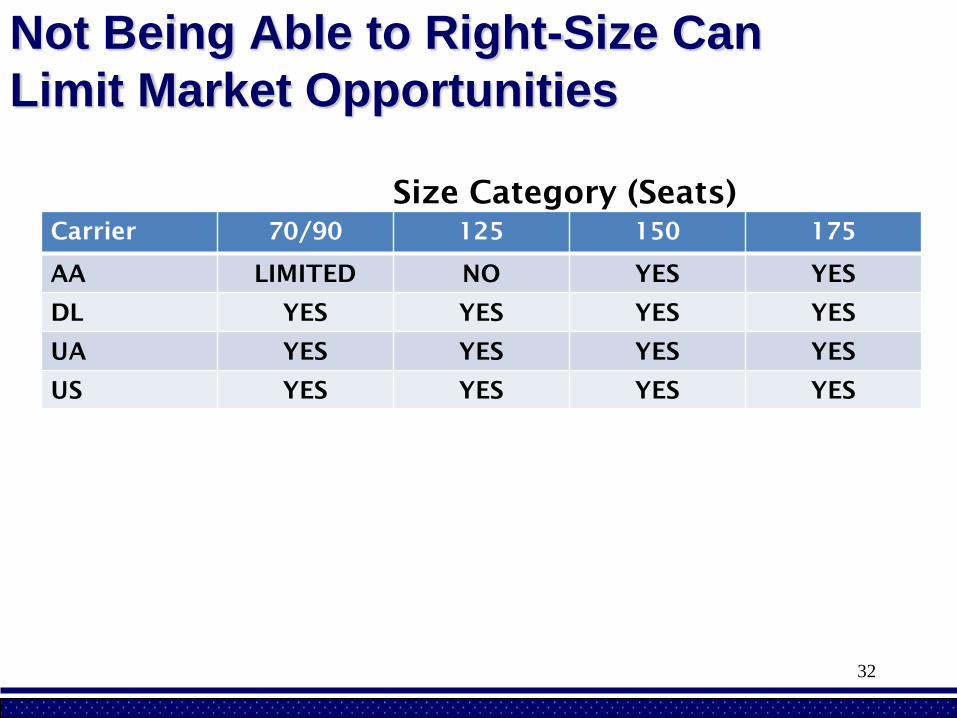
Not Being Able to Right-Size Can
Limit Market Opportunities
Carrier 70/90 125 150 175
AA LIMITED NO YES YES
DL YES YES YES YES
UA YES YES YES YES
US YES YES YES YES
Size Category (Seats)
32

At the Other End of the Size
Spectrum
33

Body Count vs. Revenue
Class
Seats
Load
Factor
Pax
Yield
Rev/
ASM
Rev/
Mile
Prem
125 70% 88 $0.40 $0.28 $35.00
Econ 430 70% 301 $0.10 $0.07 $30.10
Total 555 70% 389 $0.168 $0.117 $65.10
34

Body Count vs. Revenue
Class
Seats
Load
Factor
Pax
Yield
Rev/
ASM
Rev/
Mile
Prem
0 0% 0 $0.40 $0.00 $ 0.00
Econ 800 70% 560 $0.10 $0.07 $56.00
Total 800 70% 560 $0.10 $0.07 $56.00
35

Body Count vs. Revenue
Class
Seats
Load
Factor
Pax
Yield
Rev/
ASM
Rev/
Mile
Econ
400 70% 280 $0.10 $0.07 $28.00
Econ 400 70% 280 $0.05 $0.035 $14.00
Total 800 70% 560 $0.075 $0.053 $42.00
36

If it Were a Beer, it Might be Hard to
Sell… (Even a Kellogg Grad Might
Have a Difficult Time with This One)
37

More Filling…Less Taste
0
0.02
0.04
0.06
0.08
0.1
0.12
0.14
F/C/Y Y-Current Y-Realistic
RA
SM
(cen
ts)
0
10
20
30
40
50
60
70
Reven
ue p
er
Mil
e (
$)
RASM Rev per Mile
38

Very Large is Currently a Small Niche
0.0%
5.0%
10.0%
15.0%
20.0%
25.0%
30.0%
747, A380 Deliveries as a Percent of Total747 747 & A380
39 Source: The Airline Monitor, May 2012

He who dies with the
most market share…
40

He who dies with the
most market share…
Dies
41
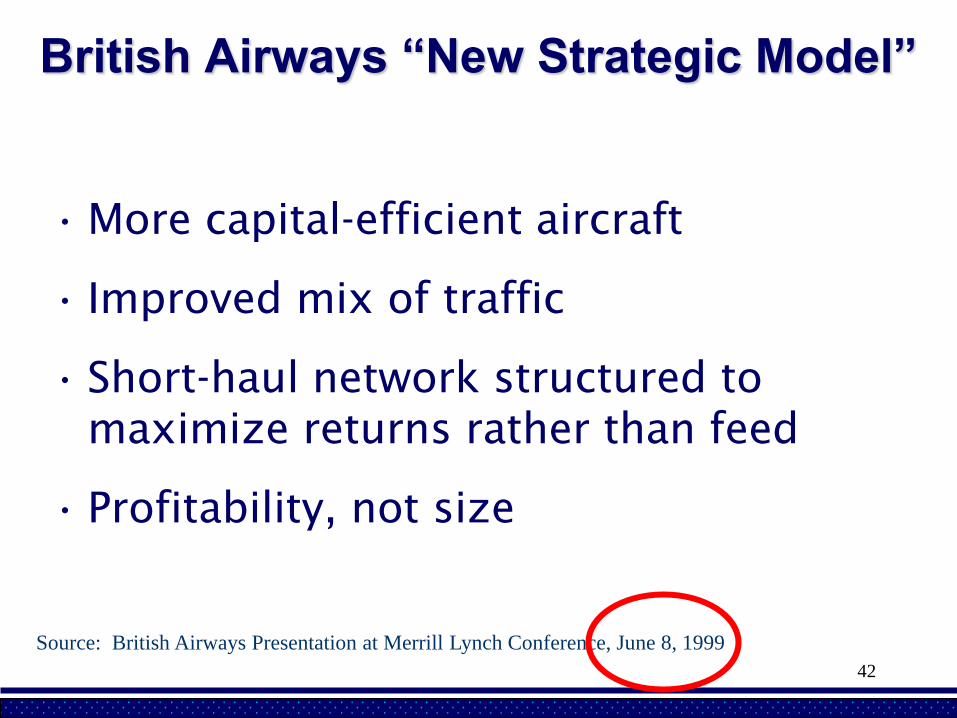
British Airways “New Strategic Model”
• More capital-efficient aircraft
• Improved mix of traffic
• Short-haul network structured to
maximize returns rather than feed
• Profitability, not size
Source: British Airways Presentation at Merrill Lynch Conference, June 8, 1999
42

Wonder which one has the higher
average yield…
Lufthansa’s 747-8 Intercontinentals
have about the same number of
premium seats as on the airline’s
A380 fleet: eight first class and 80
business, compared to eight and 98
on the Airbus double-decker.
However, in LH service the A380 has
considerably more economy seats:
420 versus 298 on the 747-8.
Source: Airways, August 2012, page 19 43

More Recently
Turkish Airlines said it’s close to
ordering 100 planes to provide short-
haul links from Istanbul while scrapping
plans to buy the biggest jumbo jets in
favor of more modestly sized wide-body
planes.
Source: Bloomberg November 28, 2012 “Turkish Air Seeks 100 Narrow-Body Jets After Ditching Jumbos
44

A Key Consideration
“Our biggest problem is the capacity and
the frequency,” the [Turkish] CEO said.
“We want to go to higher frequencies.
The 777 is big enough.” Possible plans
include switching daily services to cities
including Chicago and Hong Kong to
double-daily, he said.
Source: Bloomberg November 28, 2012 “Turkish Air Seeks 100 Narrow-Body Jets After Ditching Jumbos
45

Fundamental Airline Economics
Which is more important?
• Unit Costs
• Yields
46

Fundamental Airline Economics
The Answer:
• Neither
• What is most important:
Maximizing the difference
between total revenues
and total costs.
47

Critical Mass Size
Is Necessarily Better?
48

Big is not necessarily better
49 Photo © George Hamlin

Extremism in the Defense of Market
Share is No Virtue…
50

Summary & Conclusions
• Appropriate frequency enhances
profits
• Utilize the right aircraft size for the
market
– Too large can reduce yields
– Too small can increase unit costs
– Right-sizing benefits are largely
independent of competitive response
• Don’t follow the herd; optimize carrier
profitability, not market share
51

George W. Hamlin
Hamlin Transportation Consulting
Fairfax, Virginia
Right-Sizing: The Right Move
in the Airline Business
December 11, 2012
Northwestern University
Icarus Society
HTCHTCTC 52

Go Cats!
Beat
Mississippi
State 53

54