riggs park: indoor air, sub-slab vapor ... - washington, … vapor, soil vapor, soil, ... columbia...
TRANSCRIPT

������������ ���� ���������������������������
��������������������������
�� �����������
� � �!�����������
"�����#�������#
�����!��$
�
!��������%����&��'(�'�����������%�)�*��������
����'(�'�����������%�+����&

7944 Wisconsin Avenue, Bethesda, Maryland 20814-3620 (301) 718-8900
RIGGS PARK INDOOR AIR, SUB-SLAB VAPOR, SOIL
AND GROUNDWATER SAMPLING AND
ANALYSIS REPORT Prepared for: The District of Columbia Department of
Health and the District of Columbia Department of the Environment
Prepared by:
S.S. PAPADOPULOS & ASSOCIATES, INC. Environmental & Water-Resource Consultants
February 2009

Riggs Park Sampling & Analysis Report, February 2009 ES-1
Executive Summary This report presents results of a sampling program for indoor air, ambient outdoor air,
sub-slab vapor, soil vapor, soil, and groundwater in the Riggs Park neighborhood of northeast Washington DC. This study was undertaken in 2007 and 2008 on behalf of the District of Columbia Department of Health and the District of Columbia Department of the Environment. The work was completed by S.S. Papadopulos & Associates and its subcontractor Chesapeake GeoSciences. The investigation was prompted by a 1989 release of gasoline from a Chevron station on the corner of Eastern Ave. and Riggs Road in Chillum, Maryland. The plume of dissolved contamination from that release extends under the Riggs Park neighborhood for a distance of approximately 1400 feet. In addition to constituents associated with gasoline, other contaminants including tetrachloroethylene (PCE) have been detected persistently in groundwater under the neighborhood.
During the period from January through September 2008, the following samples were
obtained: 128 indoor air samples from 115 homes; 39 samples of ambient outdoor air concurrent with the indoor air samples; 378 samples from sub-slab vapor monitoring ports in 106 homes, collected over three consecutive quarters; and 151 samples of subsurface vapors from outdoor vapor monitoring ports at 66 homes, collected during two consecutive quarters. In addition, 69 soil samples and 14 groundwater samples were collected from direct-push borings installed using Geoprobe equipment. All vapor samples were collected in 6-liter Summa canisters, and analyzed for volatile organic compounds via USEPA method TO-15 (modified). All soil and groundwater samples were analyzed for volatile organic compounds via USEPA method 8260.
Up to 68 individual parameters were analyzed in each vapor sample. Duplicate samples
were sent to a secondary laboratory for confirmatory analysis. In the population of indoor air samples, forty-seven (47) different analytes were detected. Thirty-eight (38) analytes were detected in ambient air. For the subsurface samples, sixty-four (64) analytes were detected in the sub-slab samples, and forty-eight (48) were detected in the outdoor vapor monitoring port samples. Detection of any analytical parameter depends upon factors including the presence and concentrations of other compounds in each sample. In general, higher detection limits were associated with the outdoor soil vapor samples.
In the fourteen (14) groundwater samples, the compound most frequently detected was
MTBE. Concentrations of MTBE observed in groundwater were consistent with those from the ongoing groundwater monitoring program. The majority of soil samples were collected above the water table and yielded non-detects in the analysis. One soil sample collected at the water table (28 ft depth) from the alley between Oglethorpe St. and Eastern Ave yielded detections of xylenes (6,100 ug/kg), naphthalene (3,000 ug/kg), and MTBE (3 ug/kg). These results are consistent with the presence of residual contamination from liquid-phase hydrocarbons (gasoline). This indicates that in addition to dissolved contamination, liquid phase gasoline had migrated from Maryland to the DC side of Eastern Ave. This location is within "Area B" targeted for remediation under USEPA's Final Remedy.

Riggs Park Sampling & Analysis Report, February 2009 ES-2
For each volatile organic compound in the TO-15 analyte list, and for each group of
samples (ambient air, indoor air, sub-slab, and outdoor vapor monitoring port) the data population was examined. Statistical measures of the population were calculated for a select group of petroleum-related compounds (1,2,4-trimethylbenzene, 1,3,5-trimethylbenzene, benzene, toluene ethylbenzene, o-xylene, m,p-xylenes, MTBE, naphthalene, hexane, cyclohexane, and n-heptane), and chlorinated compounds (tetrachloroethylene (PCE), trichloroethylene, 1,1,1-trichloroethane, chloroform, chloromethane, and 1,4-dichlorobenzene). Maps of the indoor and subsurface distribution of these contaminants were also prepared. Many compounds detected in the TO-15 analyses are likely unrelated to any potential subsurface contamination (e.g. freons, various solvents and alcohol), and thus are not emphasized in the analysis.
Ambient air concentrations of benzene, toluene, and PCE are within ranges observed both
at Washington DC's McMillan Reservoir, and within ranges reported in the literature for other urban environments. For the petroleum-related and chlorinated compounds cited above, it is noted that concentrations of most contaminants are higher in indoor air than in outdoor (ambient air), consistent with other studies showing that in-home sources of contaminants may dominate indoor air concentrations.
For each of the petroleum-related and chlorinated analytes cited above, the detected
concentrations range over several orders of magnitude in each medium. The maximum benzene concentration detected in indoor air was 8.36 3/ mug (2.6 ppbV). The maximum benzene
concentration detected in subsurface vapors was 24.9 3/ mug (7.8 ppbV). The maximum
concentration of PCE detected in indoor air was 42.3 3/ mug (6.2 ppbV). The maximum
concentration of PCE detected in subsurface vapors was 929 3/ mug (137.0 ppbV). The contaminants observed in subsurface vapor samples are consistent with those
detected in groundwater at the site. Where the petroleum-related and chlorinated compounds cited above are detected both indoors and in the sub-slab, the ratios of sub-slab vapor to indoor air concentrations range from 182 to 0.004. For each of the petroleum-related compounds, the maximum sub-slab to indoor air concentration ratio exceeds 1 (is higher in the sub-slab location than in indoor air) in at least 20% of the homes. The ratios exceed 10 for benzene, toluene, n-heptane, m,p-xylenes, and cyclohexane. Similar results are observed for the chlorinated compounds. For homes with tetrachloroethylene (PCE) detections in both the sub-slab and indoor air samples, the maximum sub-slab to indoor air concentration ratio exceeds 1 in 72% of the homes.
Riggs Park Sampling & Analysis Report, February 2009 i
Table of Contents Page
List of Figures ................................................................................................................................ iii
List of Tables ................................................................................................................................. iv
List of Appendices .......................................................................................................................... v
List of Acronyms and Abbreviations............................................................................................. vi
Executive Summary .................................................................................................................. ES-1
Section 1 Introduction................................................................................................................ 1
Purposes of this Study................................................................................................ 1 Scope of Work ........................................................................................................... 2
Section 2 Site History ................................................................................................................ 4
Section 3 Summary of Previous Investigations ......................................................................... 7
Soil and Groundwater Investigations......................................................................... 7 Soil Vapor Investigations........................................................................................... 7 Indoor Air Investigations ........................................................................................... 8
Chevron Studies ................................................................................................. 9 USEPA Studies .................................................................................................. 9 DOH/BSEA Studies ........................................................................................... 9
Section 4 Current Site Conditions............................................................................................ 11
Geology.................................................................................................................... 11 Topography and Hydrology ..................................................................................... 11 Extent of Free Product and Source Area.................................................................. 12 Extent of Groundwater Contamination .................................................................... 13
Section 5 Project Methods and Materials ................................................................................ 15
Timeline ................................................................................................................... 15 Activities .................................................................................................................. 15
Contacting Homeowners and Obtaining Access Agreements ......................... 15 Pre-VMP Installation Survey ........................................................................... 16 Pre-Indoor Air Sampling Survey ..................................................................... 16 Sub-Slab Vapor Monitoring Port Installation .................................................. 17 Outdoor Vapor Monitoring Ports ..................................................................... 17
Sampling and Analysis Methods.............................................................................. 18
Riggs Park Sampling & Analysis Report, February 2009 ii
Indoor Air Sampling ........................................................................................ 19 Ambient Air Sampling ..................................................................................... 19 Vapor Monitoring Port Samples ...................................................................... 20
Section 6 Results...................................................................................................................... 21
Ambient Air Samples (AOA) .................................................................................. 21 Indoor Air Samples (INA) ....................................................................................... 22 Sub-Slab Vapor Monitoring Ports (VMPs).............................................................. 23 Outdoor Vapor Monitoring Ports (GMPs) ............................................................... 23 Soil Samples............................................................................................................. 24 Groundwater Samples .............................................................................................. 25 Data Validation ........................................................................................................ 26
Field QA/QC .................................................................................................... 26 Laboratory QA/QC........................................................................................... 26 Independent Laboratory Duplicates ................................................................. 26 Spatial Duplicates (VMPs)............................................................................... 27
Section 7 Evaluation of Air and Vapor Sample Results .......................................................... 28
Compounds Likely Unrelated to Subsurface Contamination .................................. 31 Data Population Analysis......................................................................................... 31 Comparison of Ambient Air Data from Other Studies ............................................ 33 Comparison of Vapor Data to Previous Studies ...................................................... 34 Comparison of Indoor Air Data to Ambient Air Data ............................................. 35 Geographic Distribution of Data.............................................................................. 35
Section 8 Information from Home Surveys ............................................................................. 37
Section 9 Ratios of Subsurface to Indoor Air Concentrations................................................. 38
Section 10 Conclusions............................................................................................................. 40
Discussion and Recommendations........................................................................... 41
Section 11 References............................................................................................................... 43
Figures
Tables
Appendices

Riggs Park Sampling & Analysis Report, February 2009 iii
List of Figures
Figure 1 Location of the Riggs Park Community
Figure 2 Map showing Locations of Monitoring Wells, Soil Borings, and Soil Vapor Sampling Points from Previous Investigations
Figure 3 Detections of Liquid-Phase Hydrocarbons
Figure 4 Concentrations of Benzene and MTBE in shallow soil vapor samples in 2002 to 2004
Figure 5 Shaded Relief Topographic Map of the Riggs Park Neighborhood
Figure 6 Groundwater Elevations in August 2004
Figure 7 Depth to Groundwater in August 2004
Figure 8 Benzene Concentrations in Shallow Monitoring Wells September 2005
Figure 9 Benzene Concentrations in Deep Monitoring Wells September 2005
Figure 10 Benzene Concentrations in Shallow Monitoring Wells March 2008
Figure 11 Benzene Concentrations in Deep Monitoring Wells March 2008
Figure 12 MTBE Concentrations in Shallow Monitoring Wells September 2005
Figure 13 MTBE Concentrations in Deep Monitoring Wells September 2005
Figure 14 MTBE Concentrations in Shallow Monitoring Wells March 2008
Figure 15 MTBE Concentrations in Deep Monitoring Wells March 2008
Figure 16 PCE Concentrations in Shallow Groundwater from Spring 2002 Investigation
Figure 17 PCE Concentrations in Deep Groundwater (at least 10 feet below water table) from Spring 2002 Investigation
Figure 18 Project Timeline
Figure 19 Frequency of Detections in Ambient Air Samples
Figure 20 Frequency of Detections Indoor Air Samples
Figure 21 Frequency of Detections in Sub-Slab VMP Samples
Figure 22 Frequency of Detections in Outdoor GMP Samples
Figure 23 Locations of Outdoor Vapor Monitoring Ports (GMPs) and Detections of Selected Compounds in Groundwater Samples
Figure 24 Scatter Plots of Concentrations in Duplicate Samples from Spectrum Analytical and Pace Laboratories (for Selected Analytes)

Riggs Park Sampling & Analysis Report, February 2009 iv
Figure 25 Scatter Plots of Concentrations in Samples from Homes with Pairs of Sub-Slab VMPs (for Selected Analytes)
Figure 26 Comparison of Detections between Indoor Air and Ambient Air Samples
Figure 27 Comparison of Detections between Indoor Air and Sub-Slab VMP Samples
Figure 28 Comparison of Detections between Indoor VMP Outdoor GMP Samples
Figure 29 Box-Whisker Plot Summarizing Detections of Selected Petroleum-Related Compounds in Vapor Samples
Figure 30 Box-Whisker Plot Summarizing Detections of Selected Chlorinated Compounds in Vapor Samples
Figure 31 Geographic Distribution of Selected Petroleum-Related Compounds in Indoor Air Samples (CONFIDENTIAL)
Figure 32 Geographic Distribution of Selected Petroleum-Related Compounds (maximum concentration) in Subsurface Vapor Samples (CONFIDENTIAL)
Figure 33 Geographic Distribution of Selected Chlorinated Compounds in Indoor Air Samples (CONFIDENTIAL)
Figure 34 Geographic Distribution of Selected Chlorinated Compounds (maximum concentration) in Subsurface Vapor Samples (CONFIDENTIAL)
Figure 35 Ratio of Sub-Slab to Indoor Air Concentrations for Selected Petroleum-Related Compounds
Figure 36 Ratio of Sub-Slab to Indoor Air Concentrations for Selected Chlorinated Compounds
List of Tables
Table 1 Summary of Vapor Sampling Conducted by Chevron, USEPA , and the District of
Columbia Department of Health (DOH)
Table 2 Detections of Organic Compounds in Groundwater Reported to the District of Columbia Department of Environment (DDOE) by Chevron
Table 3 List of Vapor Samples Collected During This Study (in Chronological Order)
Table 4 List of Vapor Samples By Home, Sample Type, and Quarter
Table 5 Analytes Detected in Vapor Samples
Table 6 Summary Statistics for Selected Petroleum-Related Compounds Analytes
Riggs Park Sampling & Analysis Report, February 2009 v
Table 7 Summary Statistics for Selected Chlorinated Analytes
Table 8 Soil and Groundwater Samples Collected During Second Quarter (Q2) Installation of Geoprobe Borings
Table 9 Analytes Detected in Soil and Groundwater Samples
Table 10 Duplicate Vapor Samples Collected
Table 11 Selected information from Home Surveys
List of Appendices
Appendix A Example Homeowner Information Package and Access Agreement
Appendix B Pre-VMP Installation Survey Forms (CONFIDENTIAL)
Appendix C Pre-Sampling Home Survey Forms (CONFIDENTIAL)
Appendix D Q1 Data Collection Forms
Appendix E Q2 Data Collection Forms
Appendix F Q3 Data Collection Forms
Appendix G Geoprobe Boring Logs
Appendix H Analytical Data - Level III Lab Reports, Spectrum Analytical Inc.
Appendix I Analytical Data - Level III Lab Reports, Pace Analytical Services, Inc.
Appendix J Analytical Data - Level III Lab Reports, Phase Separation Science, Inc.
Appendix K Analytical Data - Level IV Lab Reports, Spectrum Analytical Inc.
Appendix L Analytical Data - Level IV Lab Reports, Pace Analytical Services, Inc.
Appendix M Analytical Data - Level IV Lab Reports, Phase Separation Science, Inc.
Appendix N CD-ROM with Electronic Data Files from Laboratories
Appendix O Q1, Q2, and Q3 Monitoring Reports
Appendix P Cumulative Frequency Diagrams for All Analytical Parameters
Appendix Q Community Relations Reports
Appendix R Record of Contacts with Residents (CONFIDENTIAL)
Appendix S Signed Access Agreements (CONFIDENTIAL)
Appendix T Key to Home IDs and Addresses (CONFIDENTIAL)

Riggs Park Sampling & Analysis Report, February 2009 vi
List of Acronyms and Abbreviations kgug Microgram per kilogram
3/ mug Micrograms per cubic meter
lug Micrograms per liter 1,4-DCB 1,4-Dichlorobenzene 111-TCA 1,1,1-Trichloroethane 124-TMB 1,2,4-Trimethylbenzene 135-TMB 1,3,5-Trimethylbenzene AOA Identifier for an ambient outdoor air sample collected during this study ATSDR Agency for Toxic Substances and Disease Registry BSEA Building Sciences and Engineering Associates, Ltd. BTEX Benzene, toluene, ethylbenzene and toluene CGS Chesapeake GeoSciences, Inc. COC Contaminant(s) of Concern COTR Contracting Officer’s Technical Representative DC District of Columbia DDOE District Department of Environment DOH Department of Health of the District of Columbia DPE Dual-phase extraction GMP Outdoor Vapor Monitoring Port (Geoprobe-Installed Monitoring Port), or the
identifier for an outdoor vapor monitoring port sample collected during this study INA Identifier for an Indoor Air Sample collected during this study MCL Maximum Contaminant Level (a drinking water standard) MDE Maryland Department of the Environment MEK Methyl ethyl ketone (2-butanone) MIBK Methyl isobutyl ketone (4-Methyl-2-pentanone) MTBE Methyl-Tert-Butyl Ether ND Non-detect or not detected PCE Perchloroethylene, synonymous with Tetrachloroethylene and Tetrachloroethene Perc Perchloroethylene, synonymous with Tetrachloroethylene and Tetrachloroethene PID Photo-ionization detector ppb Parts per billion ppbV Parts per billion by volume ppm Parts per million ppmV Parts per million, by volume PVMP Identifier for a previously-installed sub-slab vapor monitoring port sampled
during this study QA/QC Quality Control / Quality Assurance QAPP Quality Assurance Project Plan RFP Request for Proposal SOW Scope of Work or Statement of Work SSP&A S.S. Papadopulos & Associates, Inc.

Riggs Park Sampling & Analysis Report, February 2009 vii
TAGA Trace Atmospheric Gas Analyzer TCE Trichloroethylene, synonymous with Trichloroethene TPH Total Petroleum Hydrocarbons TVH Total Volatile Hydrocarbons in the C5 to C12 range USACE United States Army Corp of Engineers USEPA United Stated Environmental Protection Agency UST Underground Storage Tank VMP Vapor Monitoring Port, or the identifier for a sub-slab vapor monitoring port
sample collected during this study

REPORT

Riggs Park Sampling & Analysis Report, February 2009 1
Section 1 Introduction
This report was completed by S.S. Papadopulos & Associates, Inc. (SSP&A) on behalf of the District of Columbia Department of Health (DOH) and the District Department of Environment (DDOE). Chesapeake GeoSciences, Inc. (CGS), as subcontractor to SSP&A, contributed to the data collection and analysis. Additional reports to be completed under the planned scope of work include individualized reports distributed to each participating homeowner. Other reports previously completed and submitted under this contract are included in the Appendices.
The data presented herein were collected from January through September 2008 by staff of SSP&A and CGS. All samples collected for this study were obtained in and around homes in the Riggs Park neighborhood of northeast Washington DC. Additional data from previous investigations and other monitoring sites are cited where appropriate.
This work was completed under District of Columbia contract GS-10F-0426M, DC Task
Order Number DCHC-2007-T-0022 and Purchase Order PO283733-KGO/DDOE/R0607/675-Riggs Park.
Purposes of this Study
A gasoline release from a Chevron station located at 5801 Riggs Road in Chillum, Maryland (Figure 1) was reported to the Maryland Department of the Environment (MDE) in October 1989. Under oversight of MDE, remedial activities including pump-and-treat and groundwater monitoring continued through 2001. At that time, it was reported that the plume of groundwater contamination had migrated across Eastern Avenue into the District of Columbia. In October 2001, U.S. Environmental Protection Agency (USEPA) Region III assumed responsibility for the site, providing oversight for Chevron’s ongoing remedial activities. USEPA entered into a cooperative agreement with the U.S. Army Corp of Engineers (USACE) for additional data collection, including soil vapor monitoring. During site investigations, the presence of tetrachloroethylene (PCE) in soil and groundwater was also detected. EPA began to investigate the PCE contamination in 2002.
Under Chevron’s and USEPA’s oversight, soil vapor and indoor air samples were
collected from homes in the Riggs Park community from 2002 through 2005. A number of investigations by, and on behalf of the U.S. Environmental Protection Agency (USEPA), the U.S. Army Corps of Engineers (USACE), and the Chevron Corporation were completed during this period. In February, 2006, the Council of the District of Columbia ordered additional in-home testing under Resolution 16-522.
The initial phase of the District's testing was completed by Building Sciences &
Engineering Associates (BSEA) in 2006. A total of 97 homes were tested in the spring and
Riggs Park Sampling & Analysis Report, February 2009 2
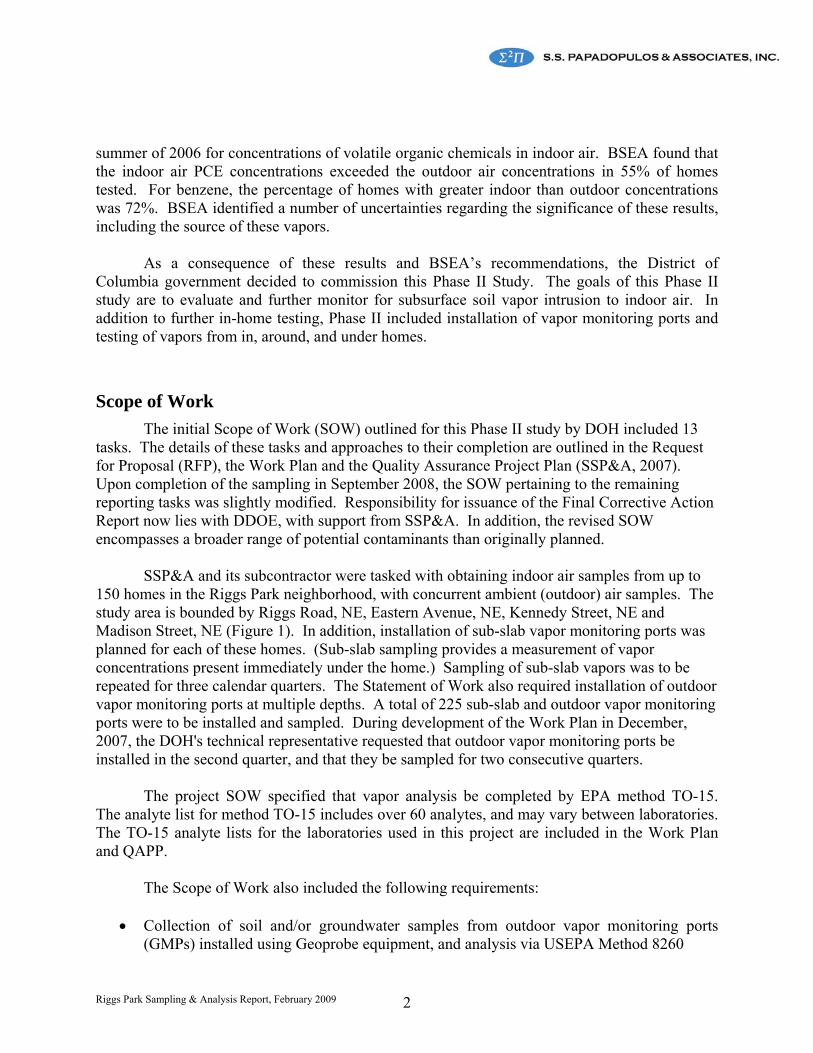
summer of 2006 for concentrations of volatile organic chemicals in indoor air. BSEA found that the indoor air PCE concentrations exceeded the outdoor air concentrations in 55% of homes tested. For benzene, the percentage of homes with greater indoor than outdoor concentrations was 72%. BSEA identified a number of uncertainties regarding the significance of these results, including the source of these vapors.
As a consequence of these results and BSEA’s recommendations, the District of
Columbia government decided to commission this Phase II Study. The goals of this Phase II study are to evaluate and further monitor for subsurface soil vapor intrusion to indoor air. In addition to further in-home testing, Phase II included installation of vapor monitoring ports and testing of vapors from in, around, and under homes.
Scope of Work
The initial Scope of Work (SOW) outlined for this Phase II study by DOH included 13 tasks. The details of these tasks and approaches to their completion are outlined in the Request for Proposal (RFP), the Work Plan and the Quality Assurance Project Plan (SSP&A, 2007). Upon completion of the sampling in September 2008, the SOW pertaining to the remaining reporting tasks was slightly modified. Responsibility for issuance of the Final Corrective Action Report now lies with DDOE, with support from SSP&A. In addition, the revised SOW encompasses a broader range of potential contaminants than originally planned.
SSP&A and its subcontractor were tasked with obtaining indoor air samples from up to
150 homes in the Riggs Park neighborhood, with concurrent ambient (outdoor) air samples. The study area is bounded by Riggs Road, NE, Eastern Avenue, NE, Kennedy Street, NE and Madison Street, NE (Figure 1). In addition, installation of sub-slab vapor monitoring ports was planned for each of these homes. (Sub-slab sampling provides a measurement of vapor concentrations present immediately under the home.) Sampling of sub-slab vapors was to be repeated for three calendar quarters. The Statement of Work also required installation of outdoor vapor monitoring ports at multiple depths. A total of 225 sub-slab and outdoor vapor monitoring ports were to be installed and sampled. During development of the Work Plan in December, 2007, the DOH's technical representative requested that outdoor vapor monitoring ports be installed in the second quarter, and that they be sampled for two consecutive quarters.
The project SOW specified that vapor analysis be completed by EPA method TO-15.
The analyte list for method TO-15 includes over 60 analytes, and may vary between laboratories. The TO-15 analyte lists for the laboratories used in this project are included in the Work Plan and QAPP.
The Scope of Work also included the following requirements:
Collection of soil and/or groundwater samples from outdoor vapor monitoring ports (GMPs) installed using Geoprobe equipment, and analysis via USEPA Method 8260

Riggs Park Sampling & Analysis Report, February 2009 3
Collection of duplicate vapor samples for analysis at a secondary laboratory for quality control purposes
This report addresses conditions in the Riggs Park neighborhood in the 2008 time frame.
No attempt is made to extrapolate indoor air, sub-slab, or ambient air data collected during this study to indoor air concentrations in previous years. Nonetheless, some data necessarily point to contaminant migration that may have occurred at an earlier time. These issues are discussed where appropriate.

Riggs Park Sampling & Analysis Report, February 2009 4
Section 2 Site History
In 1954, a Gulf service station was built and began operating at 5801 Riggs Road, Chillum, MD. Subsequently, after Gulf Oil Corporation merged with Chevron U.S.A., Inc., the Service Station became a Chevron-branded location. In June 1993, the service station was sold to an independent owner, with the land, buildings, underground storage tanks (USTs), and appurtenances included in the sale (Gannett Fleming, 2003a). This service station continues to operate at the present time. Currently it is branded as a Sunoco gasoline station.
Initial reports of a petroleum release from this station were filed with the Maryland
Department of the Environment (MDE) in October, 1989 (Gannett Fleming, 2003a). An initial assessment and installation of the first monitoring wells were completed the following month. Following detection of liquid-phase gasoline product in monitoring wells, a product recovery system was installed on-site in 1990 with MDE oversight (Gannett Fleming, 2003a). Through 2001, a number of modifications to the groundwater and gasoline recovery systems were implemented, including installation of dual phase extraction (DPE) wells and soil vapor extraction wells (Gannett Fleming, 2003a, 2006). The DPE system was further expanded in January 2005.
In 2001, Chevron discovered that the gasoline-contaminated groundwater had migrated
into the District under the Riggs Park neighborhood. Because the contaminated groundwater impacted two separate political jurisdictions (the State of Maryland and the District of Columbia), at the request of the District of Columbia City Council, USEPA assumed the lead investigatory role for the Facility (USEPA, 2007). A unilateral Administrative Order was issued by USEPA in December 2002 requiring Chevron to conduct further investigations, to perform interim measures to mitigate threats to human health and the environment, and to evaluate alternatives for corrective actions needed to protect human health and the environment (USEPA, 2007).
In 2002, Chevron implemented further investigation activities including direct push
(Geoprobe) investigation and sampling for soils and groundwater, soil vapor sampling, and collection of ambient air and basement sump samples. Additional monitoring wells were installed in the District of Columbia to monitor the groundwater (Figure 2). In addition, in 2005, Chevron completed sampling of indoor air in selected homes. Sampling of groundwater and vapors under Chevron's oversight has continued through the present day.
During the summer of 2002, ongoing site investigations found PCE in groundwater
commingled with gasoline-related contaminants. EPA concluded that the PCE was not related to the gasoline release, and therefore that the PCE contamination was not within the scope of EPA’s RCRA corrective action investigation (USEPA, 2007). An investigation of the PCE contamination was therefore begun independently, under USEPA's Superfund Division. In the summer of 2002, EPA began sampling soil, groundwater and indoor air to investigate the source
Riggs Park Sampling & Analysis Report, February 2009 5
of the PCE. In addition, USEPA requested that the Agency for Toxic Substances and Disease Registry (ATSDR) provide public health recommendations about the presence of PCE in the community.
Coincident with USEPA and Chevron investigations the District of Columbia DOH
began investigations of indoor air. In the summer of 2006, DOH oversaw indoor air and ambient (outdoor) air testing for 97 homes in the Riggs Park neighborhood (BSEA, 2006). All indoor air samples were collected in Summa canisters for 24 hours. Summa canisters were placed in the basement of each residence. Due to conditions in the access agreements signed by the residents, some of these results remain confidential, i.e. the addresses of the homes in which each sample was collected have not been released. Subsequently, DOH collected 12 additional indoor air samples and two additional outdoor air samples in March of 2007.
In 2007, the USEPA issued its proposed remedy for the Chevron gasoline release
(USEPA, 2007) and requested public comments. The proposed remedy consists of the following elements:
continued operation of the existing groundwater remediation system in Maryland (Area A on Figure 2)
expansion of the existing system by installing additional recovery wells at an angle across Eastern Ave. (Area B on Figure 2), and
installation of individual vapor mitigation systems in homes above the plume where measured vapor concentrations exceed EPA’s remedial standards for indoor air for
o Benzene (8 3/ mug ),
o MTBE (17 3/ mug ),
o Xylenes (100 3/ mug ),
o Ethybenzene (1,000 3/ mug ), and
o Toluene (5,000 3/ mug ). EPA's remedial standards represent the contaminant concentration that pose an excess
lifetime cancer risk to 3.5 people in 100,000 for benzene or 1 in 100,000 people for MTBE. For the non-carcinogens toluene, ethylbenzene and the xylenes, levels were established by adopting the concentrations corresponding to a Hazard Quotient of one.
As noted by USEPA in their response to comments (USEPA, 2008a), the design
objective of the existing and final remediation system is source removal, not hydraulic containment of the dissolved phase plume. Therefore, the capture zones of extraction wells do not encompass the entire 1,400-foot long dissolved phase plume. EPA anticipates that once the liquid gasoline source is eliminated, the dissolved phase plume will degrade rapidly to attain drinking water standards within a few years.
Based on comments received during the public comment period and evaluation of the
remedy selection criteria, USEPA (2008a) modified the proposed remedy to include

Riggs Park Sampling & Analysis Report, February 2009 6
the installation of an independent remediation system on the District of Columbia side of Eastern Avenue (Area B on Figure 2), and
the installation of an oxygen injection curtain to accelerate degradation of the dissolved phase plume (Area C on Figure 2).
In 2008, the ATSDR also released its Indoor and Outdoor Air Data Health Evaluation for
PCE contamination in the Riggs Park neighborhood (U.S. Department of Health and Human Services, 2008). The public comment period for that report closed in May of 2008. Comments included those of the District of Columbia (Government of the District of Columbia, 2008a).

Riggs Park Sampling & Analysis Report, February 2009 7
Section 3 Summary of Previous Investigations
In this section, the previous and ongoing investigations of soil, groundwater, and vapors at the Chillum gasoline and PCE release site are outlined. This section is intended as a brief reference to existing data sources and timeline of site activities. More detailed descriptions of each study can be found in the references cited.
Soil and Groundwater Investigations
The initial groundwater monitoring wells (MW-1 through MW-5) were installed on the station property by Chevron in 1989. Through the 1990s, additional wells were added and sampled. In addition to dissolved contamination in groundwater, liquid-phase petroleum was detected in a number of wells (Figure 3).
Following discovery of groundwater contamination in the District of Columbia in 2001,
the groundwater monitoring program was expanded. Between 2001 and 2005, Chevron's consultants installed and collected groundwater
samples from more than 200 direct-push (Geoprobe) sampling locations locations; (Figure 2)
Between 2001 and 2005, Chevron's consultants installed and sampled approximately 75 additional groundwater monitoring wells (Figure 2)
Periodic collection and analysis of groundwater samples from these wells has continued to the present time.
USEPA began to investigate the presence of PCE in groundwater in 2002. USEPA evaluated concentrations of PCE detected in groundwater during Chevron's
2002 Direct-Push Investigation (USEPA, 2002b), and from Summer 2004 monitoring well sampling (USEPA, 2004b)
In September 2003, USEPA collected a small number of tap water samples and groundwater samples from direct-push borings for analysis (USEPA, 2003a).
Soil Vapor Investigations
Soil vapor recovery has been implemented as a remedial measure in the source area, and continued management of this system has included sampling and analysis of vapor samples. The following discussion, however, focuses primarily on soil vapors in and around the residential neighborhood, not on vapor extraction wells in the source area. These are vapors potentially associated with the plume of contaminated groundwater under the residential areas. Table 1 presents a summary of these previously collected data.
Riggs Park Sampling & Analysis Report, February 2009 8
Chevron's consultants began investigating soil vapors in the Riggs Park neighborhood in 2002. These investigations included:
From January through December 2002, Chevron conducted several phases of soil vapor and ambient air sampling (Gannett Fleming, 2003b); soil vapor samples were collected at multiple depths from 68 residential properties on Eastern Ave, Eighth Street, and Oglethorpe St.
From March through August, 2004, Chevron collected soil vapor samples from direct-push location throughout the Riggs Park neighborhood; in addition 14 ambient air samples were collected in the neighborhood from February through April 2004
In October 2004, Chevron collected a total of 24 soil vapor samples from 22 residential properties on Nicholson St., Eastern Ave, and Eighth St. All soil vapor sample locations were laterally within 3 feet of the building (Gannett Fleming, 2004, 2006).
USEPA began collecting soil vapor data as part of the Chillum PCE investigation.
Sampling events included: In July 2003 sampling USEPA collected 11 soil vapor samples (U.S. Environmental
Protection Agency, 2003a); an additional two samples were collected in September 2003
Twenty-four (24) additional soil vapor samples (with associated ambient air samples) were collected from inside and outside Riggs Park homes in April 2004 (US Environmental Protection Agency, 2004b) for analysis via TO-15 in the EPA's Trace Atmospheric Gas Analyzer (TAGA) laboratory.
The USEPA and Chevron results were interpreted collectively by USEPA in 2004
(USEPA, 2004e). Benzene and MTBE concentrations in shallow soil (0 to 5 ft below the basement slab) were compared to Removal Action Levels of 220 3/ mug (benzene) and 1600
3/ mug (MTBE). None of the benzene or MTBE results in shallow soils were found to exceed these action levels (Figure 4).
As part of the concurrent PCE investigation, USEPA also evaluated PCE soil vapor
concentrations with regard to EPA's Removal Action Level of 630 3/ mug in air (USEPA,
2003b). This level was subsequently reduced to 310 3/ mug (USEPA, 2004g). Subsurface PCE results from four of the initial twelve homes tested were above action levels, requiring additional indoor air testing. Additional testing and analysis in 2004 (USEPA, 2004d) confirmed soil vapor samples results in exceedance of EPA soil vapor action levels, warranting additional indoor sampling.
Indoor Air Investigations
Indoor air sampling and investigation have been completed using both Summa canisters USEPA's on-site TAGA laboratory.
Riggs Park Sampling & Analysis Report, February 2009 9
Chevron Studies
Indoor and ambient air samples were collected by Chevron's consultants: From April through July 2005, Chevron collected indoor air samples from 21
locations and ambient air samples from 18 locations on Nicholson and Oglethorpe St. During 2007, Chevron's consultant collected indoor air, ambient air, and sub-slab
vapor samples from a single home that had been identified by USEPA as a target for re-sampling (Gannett Fleming, 2007b).
USEPA required Chevron to use the gasoline plume boundaries as a selection criterion
for identifying homes to be sampled for subsurface vapor intrusion (USEPA, 2007). The results are included with those reproduced on Table 1. Chevron's consultants concluded that the indoor air analytical results indicated non-detect or very low levels of hydrocarbons. The levels were below the EPA Target Indoor Air Action Levels and were similar to those observed in ambient air (Gannett Fleming, 2006).
USEPA Studies
USEPA investigations of indoor air date back to 2003. In April 2003 EPA sampled indoor air in four homes using Summa canisters (U.S.
Environmental Protection Agency, 2003a) A larger program of indoor air sampling using Summa canisters was completed in
July 2003. Forty-six indoor air samples were collected on the basement and first floor levels (Appendix F in Gannett Fleming, 2005)
Nearly 60 additional indoor air samples were collected in April 2004 from the basement and first floors (US Environmental Protection Agency, 2004a).
Subsequent indoor air sampling by EPA has also been directed at individual homes suspected of having elevated levels of VOCs.
Between 2003 and 2005, EPA's Superfund Removal program collected soil vapor and
indoor air samples from 35 homes in Riggs Park for its PCE investigation. The U.S. Army Corps of Engineer (USACE), on behalf of EPA, also generated split /quality control data (USEPA, 2007). The minimum and maximum results for selected compounds are included with those on Table 1. The maximum benzene concentration detected was 13 3/ mug . The maximum
PCE concentration was 23 3/ mug .
DOH/BSEA Studies
Independent sampling of indoor and outdoor air was completed by the District of Columbia Department of Health.
In 2006, the DC Department of Health oversaw indoor and ambient air testing for 97 homes (BSEA, 2006)

Riggs Park Sampling & Analysis Report, February 2009 10
Subsequently, follow-up testing was completed in 12 homes in March 2007. The first phase of DOH indoor air sampling was completed during the Summer of 2006
(BSEA, 2006). Indoor air samples were collected in 97 homes, together with contemporaneous ambient air samples. The results are summarized in Table 1. The maximum benzene detected was 26.8 3/ mug . The maximum PCE detected was 38.9 3/ mug . In this data set, 74% of the benzene detections and 62% of the PCE detections were qualified with a "J" value. Results flagged with a "J" are between the method detection limit and the reporting limit, and are considered estimated values.
The USEPA statistically evaluated the indoor air data collected from the intial 97 homes
(USEPA, 2007). They concluded that there are elevated benzene and MTBE vapor concentration in homes above the gasoline plume as compared to homes situated outside the plume boundaries, consistent with the likelihood of subsurface vapor intrusion associated with the gasoline plume. Based on USEPA's review of 151 indoor air samples they identified up to 5 homes above the gasoline plume where measured vapor concentration have exceeded EPA's remediation standards.

Riggs Park Sampling & Analysis Report, February 2009 11
Section 4 Current Site Conditions
A number of site investigations have been completed at the Riggs Park site since groundwater contamination was identified in 1989. The following discussion relies primarily upon site investigation documents produced by Chevron and its consultants, as well as the USEPA and the USACE.
Geology
The Riggs Park neighborhood and the Riggs Road Chevron are located within the Coastal Plain Physiographic Province. The Site overlies the Cretaceous Patuxent Formation, a fluvial non-marine deposit that directly overlies Precambrian and early Paleozoic bedrock and dips gently to the east to southeast (Gannett Fleming, 2006).
At the site, the Patuxent Formation is estimated to be 50 to 100 feet thick. Bedrock was
apparently encountered in one direct-push location, GP-14BR, located in the alley between Oglethorpe Street and Eastern Avenue, at a depth of approximately 78 feet. Bedrock may also have been encountered at 24.5 ft during the attempted installation of well MW-34C, located along Kennedy Street. The bedrock type is not known (Gannett Fleming, 2006).
Investigations at the Site indicated that silty sands comprised approximately 75 percent of
the materials encountered, while well-sorted sands comprised less than ten percent. The well-sorted sand layers could not be correlated among boreholes. They were therefore believed to be local in nature and not widespread (Gannett Fleming, 2006). Of 23 soil samples submitted for laboratory particle size testing, 14 were classified as silty sand (SM), while five other samples were given dual classifications including SM and one other class (i.e., either poorly graded sand [SP], clayey sand [SC], or well graded sand [SW]). Two samples were classified SP, and two samples were classified as cohesive soils sandy silt (ML) or silty clay (CL-ML) (Gannett Fleming, 2006).
Gannett Fleming (2006) identified a deposit of gray to black clay that could be correlated
between boreholes south of the Service Station. The northern edge of this deposit is located south of Eastern Avenue. Based on boring logs, the thickness of this deposit is believed to be six to ten feet; although most borings did not extend beneath the clay. This clay area is asymmetrical in shape, approximately 200 feet in breadth and 700 feet in length, with its longest axis running approximately parallel to the primary direction of groundwater flow.
Topography and Hydrology
The elevation of the Riggs Pak neighborhood generally decreases from north to south toward Nicholson Street, and from the west toward Nicholson Street (Figure 5). The former Chevron station is situated at an elevation of approximately 170 ft elevation above sea level.

Riggs Park Sampling & Analysis Report, February 2009 12
The lowest point in this area, the intersection of Eastern Ave. and Kennedy Street is at an elevation of approximately 100 ft. The decrease in elevation is accomplished through a series of terraces corresponding to Nicholson and Oglethorpe streets and their parallel alleys, with steeper grades between.
Groundwater in the Riggs Park area is under unconfined, or water table conditions. The
primary source of recharge is precipitation, although man-made sources such as leaking water mains or storm sewers may also contribute. As in many unconfined systems, the general trend of groundwater flow is from areas of higher elevation (recharge areas) toward areas of lower elevation (discharge areas).
Review of historic aerial photographs determined that prior to construction of the
residential neighborhood in the 1950s, a tributary to Northwest Branch was located in the vicinity of present-day Nicholson and Kennedy Streets and flowed to the southeast (Gannett Fleming, 2006). At the current time, a storm sewer is situated along Nicholson Street. Field observations by Gannett Fleming during the dry summer of 2002 revealed that the storm sewer buried beneath Nicholson Street contained continuously flowing water. This was interpreted as evidence that the buried storm sewer has replaced the former stream as the groundwater discharge zone in this area (Gannett Fleming, 2006). The current conceptual model for contaminant transport at the site includes discharge of contaminants from the groundwater system along this storm sewer line.
The direction of shallow groundwater flow generally follows the topography (Figure 6).
Consequently groundwater flows from the Riggs Road Chevron station across Eastern Ave. toward Nicholson Street. East of 8th street, however, groundwater flow on the Maryland side of Eastern Ave. is approximately parallel to Eastern Ave. The existing remediation system at the former Chevron station impacts the elevation of the water table and flow direction of groundwater, although these effects are limited to the immediate vicinity of the remediation system.
Because of the topographic variation across the site, the depth to groundwater also varies.
Near the former Chevron station on Riggs Road, the depth to groundwater is approximately 40 ft (Figure 7). The depth to groundwater decreases with the topographic trends so that along Nicholson and parts of Oglethorpe Streets the depth to groundwater may only be three to four feet. Many homes in this area are built with sumps and sump pumps in the basement to prevent flooding with groundwater. Water from these sumps was sampled by Gannett Fleming in 2002 and 2005 (Gannett Fleming, 2006).
Extent of Free Product and Source Area
Liquid-phase hydrocarbons (LPH), or free-product gasoline has been detected in 18 monitoring wells in the vicinity of the release area (Figure 3; Gannett Fleming, 2006). With one exception, all of these wells are located on the Maryland side of Eastern Ave. The one exception

Riggs Park Sampling & Analysis Report, February 2009 13
is well MW-18 on the south side of Eastern Ave. Gannett Fleming (2006) reported that free product was detected in this well only once, in 2002. Dissolved concentrations of some gasoline components, and TPH-GRO have remained at the the ppm level in this well through 2007 (Gannett Fleming, 2007a).
Since the start of petroleum recovery operations in 1990, more than 4,500 gallons of total
hydrocarbons have been removed from the source area (Gannett Fleming, 2006). Source area remediation is ongoing, and will include an expansion of activities to the DC side of Eastern Ave. with installation of the final remedy (USEPA, 2008).
Extent of Groundwater Contamination
The extent of groundwater contamination in the Riggs Park neighborhood has been described in a number of key sources. For information on petroleum-related compounds, the following sources were relied upon:
Gannett Fleming Inc. 2003. Description of Current Conditions Report Gannett Fleming Inc. 2006. Site Investigation Report, former Chevron Facility 122208,
5801 Riggs Road, Chillum, Maryland Gannett Fleming Inc. 2007 and 2008. Groundwater Monitoring Data in Electronic Format
(122208_analytical_11-26-07.xls, 122208_GW_Data_12-08-08.xls). Data Provided to DDOE and DOH by Gannett Fleming
U.S. Army Corp of Engineers. 2004 to 2006. Maps of Benzene and MTBE in shallow and deep groundwater
US Environmental Protection Agency, 2007. Statement of Basis - Chevron Gasoline Release at Chillum, Maryland.
Groundwater monitoring wells installed by Chevron are screened either across the water
table (shallow wells) or deeper in the water-bearing zone (deep wells). Consequently, maps of the groundwater contamination are reported as either shallow or deep. Gasoline-related contamination is present in both intervals.
Figures 8 and 9 represents the concentrations of benzene in groundwater in the water
table and deeper levels from September 2005, based upon samples collected from groundwater monitoring wells. Prior direct-push investigations in 2002 had found concentrations of benzene in exceedance of MCLs extending across a larger portion of the Riggs Park Neighborhood. In particular, samples collected from direct-push locations GP-154a and GP-155a (near the current location of the MW-33 cluster on Nicholson St.) exhibited benzene concentrations up to a maximum value of 1,320 ug/l.
Figures 10 and 11 illustrate the benzene concentrations in groundwater in March 2008 as
depicted by the USACE, on behalf of the USEPA. It is important to note that benzene contamination is present outside the contoured area on Figure 10. The USACE's minimum contour interval is 5 ug/l, but they excluded benzene concentrations as high as 51 ug/l from the contoured area on the Maryland side of Eastern Ave. This exclusion represents USACE's

Riggs Park Sampling & Analysis Report, February 2009 14
judgment that these detections in shallow groundwater originate from a different source than the rest of the benzene plume.
Figures 12 and 13 illustrate the extent of MTBE in monitoring wells as mapped in 2005
(Gannett Fleming, 2006). Figures 14 and 15 illustrate the MTBE distribution in groundwater as mapped in 2008 by the USACE. In contrast to Figure 11, the USACE has depicted MTBE results in shallow groundwater monitoring wells on the Maryland side of Eastern Ave. (southeast of 8th street) as part of a contiguous plume of MTBE contamination.
For information on the extent and concentrations of PCE in groundwater, the following sources of information were relied upon:
USEPA, 2002a. Perc Groundwater Results, Deep - Chevron Spring 2002 Direct Push Sampling Round
USEPA, 2002b. Perc Groundwater Results, Shallow - Chevron Spring 2002 DP Sampling Round
USEPA, 2004b. Perc Groundwater Results - Chevron July 2004 Sampling Round USEPA, 2004c. Perc Groundwater Results - Chevron May 2004 Sampling Round Gannett Fleming Inc. 2008. Groundwater Monitoring Data in Electronic Format
(122208_GW_Data_12-08-08.xls). Data Provided to DDOE and DOH from Gannett Fleming. The 2002 mapping results are reproduced as Figures 16 and 17. While these are not the
most recent data, they include all of the direct-push locations that were sampled, and therefore show a higher density of sampling than monitoring well data from subsequent years. Only limited data on PCE in groundwater have been provided for the period following 2004. PCE data for 2008, however, indicate that that maximum concentrations of PCE under the Riggs Park neighborhood range up to 43 ug/l, with the maximum concentrations generally observed in the deeper groundwater for the MW-25, MW-27, MW-44, MW-31, and MW-33 well pairs.
Table 2 presents a summary of the compounds reported as detected in groundwater for
the period from 1989 to 2008. As noted above, however, this summary is based upon a limited data set. No PCE results, for example, were available for the period from 2005 to 2008.

Riggs Park Sampling & Analysis Report, February 2009 15
Section 5 Project Methods and Materials
In this section, the timeline, methods and materials used to complete this project are reviewed. Additional information on the analytical methods, QA/QC procedures and other aspects of the project can be found in the Work Plan and QAPP (SSP&A, 2007).
Timeline
The contract for the Riggs Park Vapor Intrusion Study and Corrective Action Plan was awarded to S.S. Papadopulos & Associates on October 18, 2007. The kickoff meeting with DOH staff, including DOH's technical representative (COTR) took place on October 25, 2007. As indicated on Figure 18, the project proceeded as follows:
Preparation of the Work Plan and Field Readiness Documents from October 25th 2007 to January 8, 2008
Residents were contacted, and Access Agreements collected in several phases during the period from December 13th 2007 to March 14, 2008
First Quarter (Q1) VMP Installation and Sampling were completed during the period from January 14th to April 4th, 2008
First Quarter analytical results were forwarded to DOH on June 24, 2008 Second Quarter (Q2) GMP Installation was completed during the period from
April 1st to May 20th, 2008 Second Quarter (Q2) Sampling was completed during the period from April 15th
through June 27, 2008 Second Quarter analytical results were forwarded to DOH on July 22, 2008 Third Quarter (Q3) Sampling was completed during the period from July 15th to
September 12, 2008 Third Quarter analytical results were forwarded to DDOE on October 17, 2008,
with an updated and final data set provided on November 4, 2008
Activities
As noted earlier in this report, the primary site activities for this project included: Indoor/outdoor air sampling in 115 homes (Table 2) Sub-slab and outdoor vapor port installation and sampling at 118 homes
The following tasks were undertaken as part of the sample collection process:
Contacting Homeowners and Obtaining Access Agreements
All sampling for this project was completed on private property in the Riggs Park neighborhood. Testing was voluntary, and signed access agreements were required from all
Riggs Park Sampling & Analysis Report, February 2009 16
participants prior to sampling. The information packets and access agreements sent to residents are reproduced in Appendix A. Signatures only of homeowners, not renters or other residents, were accepted for participation in this study.
Potential sampling locations were initially based upon results of the prior DOH study
(BSEA, 2006). The initial target homes were the 97 homes sampled in 2006, and the co-slab homes of the 53 highest priority homes identified for re-sampling. After contacting these homeowners, additional sampling targets were identified.
Over 300 homes were contacted and provided with information packets for review. Of
these, 144 residents returned signed access agreements with a positive response. Ten additional homeowners returned access agreements declining to participate in the study. Of these 144 potential participants, some subsequently declined to participate, and others were either unable, or unwilling to schedule sampling appointments. Ultimately, indoor air samples were collected from 115 homes. Another three homeowners were either unable or unwilling to participate in the 3-day indoor air sampling protocol, but did agree to installation of outdoor GMPs on their property. Subsurface samples were therefore collected from a total of 118 homes.
Pre-VMP Installation Survey
Prior to installation of sub-slab VMPs, a survey of the basement area was completed to determine the presence of pre-existing VMPs, evidence for past flooding, and general suitability for VMP installation. Sub-slab VMPs were not installed in homes in which there was evidence of past flooding due to high groundwater levels or in which the owner expressed significant concern over such flooding. In addition, VMPs were not installed in some homes where the groundwater was known to be shallow and close to the slab elevation (e.g. parts of Nicholson Street). At these homes outdoor VMPs were installed instead during the second quarter. The completed survey forms are found in Appendix B. To maintain anonymity of information about specific homes, Appendix B is marked as confidential.
Pre-Indoor Air Sampling Survey
As per recommended procedures (USEPA, 2002), home surveys were completed prior to indoor air sampling. The purpose of these surveys was to collect information on resident demographics, home construction, and resident activities that might influence indoor air results (e.g. smoking or recent renovations), and to identify chemicals that might interfere with the indoor air testing. All chemicals identified were collected in bins, and removed to an outside location at least 24 hours before sampling began. The completed home survey forms are found in Appendix C. To maintain anonymity of information about specific homes, Appendix C is marked as confidential.

Riggs Park Sampling & Analysis Report, February 2009 17
Sub-Slab Vapor Monitoring Port Installation
The methods for installing VMPs were based on USEPA’s November 2002 Draft Guidance for Evaluating the Vapor Intrusion to Indoor Air Pathway from Groundwater and Soils (Subsurface Vapor Intrusion Guidance) and the USEPA Region 3 Standard Operating Procedures (SOP) for “Construction and Installation of Permanent Sub-Slab Soil Gas Wells” (USEPA, 2004f).
During installation of the sub-slab VMPs, an electric hammer drill was used to drill core holes through the concrete basement floor of the home. The sub-slab VMPs were then built using ¼-inch OD stainless steel tubing, and Swagelok© fittings with Teflon tubing attached to each assembly. Expansive concrete was used to seal the VMPs into the concrete floor. When water was encountered in any sub-slab hole during installation or purging for sampling, the boring was abandoned by sealing with expansive concrete grout.
The project Work Plan called for collection of soil samples during VMP installation.
Because of the difficulty and disruption associated with collection of these samples, with the COTR’s prior approval, soil samples were not collected from the sub-slab locations.
The majority of ports were screened within the soil/fill immediately below the concrete slab. In some homes, duplicate VMPs were installed to assist in evaluation of sub-slab vapor heterogeneity. In selected homes, additional ports were also installed to a depth of approximately 2.5 ft. Some existing VMPs from previous studies were encountered in the basements. When possible, the depths of these ports were measured. Some of these were sampled during subsequent sampling events. These samples are annotated as PVMPs (for pre-existing VMPs).
Outdoor Vapor Monitoring Ports
During the second quarter of this study, Outdoor Vapor Monitoring Ports (GMPs) were installed using a track-mounted Geoprobe-model 54LT direct push equipment. As per the work plan (SSP&A, 2007) each GMP was constructed in the boring using a ¼-inch OD stainless steel screen point and small diameter Teflon tubing. A glass bead filter medium was placed around the screen point and a portion of the tubing. The remainder of the annular space around the tubing was back-filled with bentonite followed by native soil. For each VMP, the tubing was extended above the ground surface, capped, and coiled within the surface completion. Surface completions consisted of blank PVC casings with a PVC cap. The soil core extracted during the deepest geoprobe push at each location was described, and the depth to water and/or soil saturation was noted, if present.
For each boring location, a soil and/or groundwater sample was collected for VOC
analysis by USEPA Method 8260 at the deepest point of the push. At some locations, refusal or the target push depth was encountered before groundwater was reached. In these cases, soil samples were collected from the bottom of the core sample. When a saturated zone was

Riggs Park Sampling & Analysis Report, February 2009 18
encountered, a sample of the saturated soil was collected for analysis, and a water sample was collected if sufficient water was produced in the hole.
Locations for the GMPs were based upon suitability of homes for indoor VMP installation, first quarter sampling results and previous investigation data. Some homes were identified for GMP installation because VMP installation was precluded. Locations for additional GMPs were generally identified as those homes with the highest concentrations of benzene, and/or PCE in previous sampling. GMPs were placed as close to each home as practical within the property boundary. In many cases, access to the property was limited by fences, ledges or other structures. If access to the front, side, or back yard was not possible, the GMP was completed in the alley behind the home. Depths for the geoprobe VMPs were based upon the estimated depth to groundwater at each location.
During the third quarter of sampling, some shallow GMPs were replaced using hand auger equipment. These were GMPs that did not produce adequate vapor samples due to water saturation of the soil in the screened interval and several that were damaged or paved-over subsequent to initial installation and sampling. These Q3 GMP replacements were installed at depths of 1 to 2 feet bgs. All other construction details were the same as those built using the Geoprobe equipment.
Sampling and Analysis Methods
Pre-evacuated, cleaned, and certified summa canisters and associated regulators were obtained from two laboratories
Spectrum Analytical (the primary laboratory), and Pace Analytical (the secondary laboratory).
Each canister was delivered directly to Chesapeake GeoSciences, and returned to the laboratory with chain of custody records by staff of Chesapeake GeoSciences. Because of the large number of Spectrum Analytical canisters used during each week of sampling, these were delivered by truck and picked up by laboratory staff at the offices of Chesapeake GeoSciences in Columbia, MD. All canisters were used within the holding times appropriate to ensure maintenance of the laboratory vacuum.
Vapor samples were analyzed using the Modified EPA Method TO-15 Low Level
consistent with EPA/625/R-96/010b, METHOD TO-15 “Determination of Volatile Organic Compounds (VOCs) In Air Collected In Specially-Prepared Canisters and Analyzed by Gas Chromatography/Mass Spectrometry.” The TO-15 analyte lists and MDLs for each of the two analytical laboratories are included as appendices in the Work Plan (SSP&A, 2007). Spectrum Analytical’s original TO-15 analyte list included 61 parameters. Over the course of the study, additional analytes were added to the list, increasing the total to 68.
Soil and groundwater samples were analyzed by Phase Separation Science laboratories.
Sample containers, as specified in the Work Plan, were obtained from the laboratory. After

Riggs Park Sampling & Analysis Report, February 2009 19
collection, these samples were shipped via express carrier to the laboratory in chilled coolers with chain of custody documentation. Soil and groundwater samples were analyzed via USEPA Method 8260.
For each target home, every attempt was made to sample indoor air and vapor monitoring ports simultaneously. In some cases, however, due to equipment issues (typically regulator flow rates that did not meet QC criteria) the indoor air and VMP samples may not have been collected on the same day. The actual sample date for each sample is reported in the results section of this report.
Indoor Air Sampling
Each indoor sampling event required three visits to the home on sequential days. On the first day, the field crew (2-person minimum) completed a pre-sampling survey form, and removed from the home chemicals with potential to interfere with the sampling. During surveying of the home, the ppb-RAE PID device was used to screen the home and identify any specific hot spots that might indicate indoor sources of VOCs.
On the second day of sampling, the field crew returned to place the Summa canister(s).
All indoor air samples were collected from the basement or lowest level of the homes in pre-evacuated 6-liter certified summa canisters. The samples were fitted with regulators calibrated to 24 hours. During placement of the canisters, PID readings were recorded near the canister, and the location noted on the field sheets. When the regulator valve was opened, the time and date were noted on the field sheets, together with the starting canister vacuum. After opening of the valve, the field crew waited for 5 to 10 minutes to observe the progress of the vacuum gage. If an unacceptable rate of vacuum loss was noted, the equipment was replaced.
On the third day, the field crew returned to retrieve the canister as close as possible to 24-
hours after placing the canister. The time and date were noted on the field form together with the final vacuum of the regulator.
One duplicate indoor air sample was collected for every 10 regular indoor air samples.
The duplicate samples (submitted to the independent laboratory for comparative analysis) were noted on all field sheets with the same information as the primary samples.
Ambient Air Sampling
At least one ambient air sample was collected for each day during which indoor air samples were obtained. During the primary period of indoor air sample collection (the first quarter of sampling) two ambient air samples were collected each day of indoor air sampling. Locations for the ambient air samples were selected randomly from amongst the homes scheduled for that day. The canister was fitted with a 24-hour regulator, and typically situated in

Riggs Park Sampling & Analysis Report, February 2009 20
a backyard, away from any obvious VOC sources. All other procedures for record keeping and chain of custody were the same as for the indoor air samples. Although each ambient air sample is identified with a home identification number, that number is solely intended as a record of the sampling location; ambient air samples were intended to represent ambient air for the entire neighborhood for the day of collection. One duplicate ambient air sample was collected for every 10 regular ambient air samples.
Vapor Monitoring Port Samples
Collection of sub-slab vapor monitoring port (VMP) samples and outdoor vapor monitoring port (GMP) samples was accomplished in two-day sampling visits. During the initial visit, downhole readings of ambient PID levels were collected with the ppb-RAE PID and noted on the field sheets (see Appendices). Canisters were attached to the VMP and GMP locations using Teflon tubing. The tubing was discarded after a single use. When duplicate samples were required, a T-junction was used to connect the VMP or GMP to both canisters. On the second day, the field crew returned to retrieve the canister as close as possible to 24-hours after placement. The time and date were noted on the field form together with the final vacuum of the regulator. If the total sampling time exceeded 24 hours, the sample is annotated in the results section of this report.

Riggs Park Sampling & Analysis Report, February 2009 21
Section 6 Results
In this section of the report, the sampling results are reported by medium and sample type. Some information on the statistics of each data population is also provided. A summary of the samples collected is provided in Tables 3 and 4. Completed sampling forms can be found in Appendices D through G. Laboratory Data Sheets can be found in Appendices H through N. Quarterly monitoring reports can be found in Appendix O.
Analytical methods at the primary laboratory included standard TO-15 GC/MS analysis,
as well as TO-15 analysis with selected ion monitoring (TO-15 SIMS). For some analytes with high concentrations, the greater sensitivity of the SIMS method yielded results flagged with an "E" qualifier indicating an estimated value. In these cases, if the standard TO-15 method produced an unqualified result, the standard TO-15 result is reported here. All laboratory results, flagged and otherwise, can be found in the Appendices.
For consistency with previous reports, analytical results for the target compounds are
presented in units of micrograms per cubic meter ( 3/ mug ). Results for the Total Volatile Hydrocarbons (C5-C12), however, were reported by the laboratory in units of parts per million, by volume (ppmV). Because there is no single molecular weight associated with the TVH parameter that can be used to convert to 3/ mug , these results are presented in ppmV.
Total Volatile Hydrocarbons (C5-C12) is a calculated parameter indicating the overall
presence of volatile compounds. It does not reflect the presence or absence of a single compound. In the following discussions, the term "compounds" is used to describe analytical parameters, although it is recognized that TVH does not represent a single compound. Similarly, the m- and p-xylenes are reported as a single analytical result, although they represent two different chemical compounds.
Detection of any specific compound or its discussion below does not necessarily indicate
a risk to human health or the environment associated with that compound. Potential risks from these results are not discussed in this report.
Ambient Air Samples (AOA)
Thirty-nine (39) ambient air samples were collected during Q1, Q2, and Q3 sampling events. Each sample was collected concurrent with at least one indoor air sampling event. Although each ambient air sample is labeled with a home identification number, that ID number is solely intended a record of the sampling location; these samples are intended to represent ambient air for the entire neighborhood for the day of collection.

Riggs Park Sampling & Analysis Report, February 2009 22
The complete list of analytes detected in the ambient air samples is included in Table 5. Statistical measures describing the data populations are presented in Tables 6 and 7. A total of 38 analytes were detected. Those detected in greater than 50% of the samples were:
Ethanol Isopropyl alcohol Toluene Chloromethane Trichlorofluoromethane (Freon 11) Acetone Benzene m,p-Xylene Total Volatile Hydrocarbons C5-C12 2-Butanone (MEK) Dichlorodifluoromethane (Freon12) Methylene chloride Hexane n-Heptane
A graphic representation of the data in Table 4 is presented in Figures 19 through 22,
illustrating the range of detections of selected compounds. The complete data populations are depicted graphically in Appendix O.
Indoor Air Samples (INA)
A total of 128 indoor air samples were collected at 115 homes. Some of these samples from the first quarter of sampling exhibited elevated detection limits for certain compounds that did not meet the project's quality criteria. Following discussions with the laboratory, analytical procedures were modified and repeat samples were collected from those homes. All analytical results are presented in the Appendices.
The complete list of analytes detected in the indoor air samples is included in Table 5. A
total of 47 were detected. Those detected in more than 50% of the samples were:
Ethanol Isopropyl alcohol Toluene Acetone Chloromethane Total Volatile Hydrocarbons C5-C12 Benzene Dichlorodifluoromethane (Freon12)

Riggs Park Sampling & Analysis Report, February 2009 23
2-Butanone (MEK) m,p-Xylene Hexane Trichlorofluoromethane (Freon 11) Ethyl acetate n-Heptane
A graphic representation of these data is presented in Figure 20.
Sub-Slab Vapor Monitoring Ports (VMPs)
A total of 378 sub-slab vapor samples were collected during the first, second and third quarters of this study. These were collected from 106 homes, and are listed in Tables 3 and 4. A total of 64 analytes were detected in the sub-slab samples (Table 5). Those detected in greater than 50% of the samples were:
Acetone Total Volatile Hydrocarbons C5-C12 (ppmV) Trichlorofluoromethane (Freon 11) 2-Butanone (MEK) Tetrachloroethene Toluene Ethanol Dichlorodifluoromethane (Freon12) Isopropyl alcohol Benzene 2-Hexanone (MBK) Chloroform 1,4-Dichlorobenzene n-Heptane Ethyl acetate m,p-Xylene
A graphic representation of the data in Table 5 is presented in Figure 21.
Outdoor Vapor Monitoring Ports (GMPs)
A total of 151 samples were collected from the outdoor vapor monitoring ports (GMPs) installed at 66 homes. A total of 48 analytes were detected in the GMP samples. Those detected in more than 50% of the samples were:

Riggs Park Sampling & Analysis Report, February 2009 24
Total Volatile Hydrocarbons C5-C12 (ppmV) Acetone Carbon disulfide Ethanol Isopropyl alcohol 2-Butanone (MEK) Propene Toluene 2-Hexanone (MBK)
A graphic representation of these data is presented in Figure 22.
Soil Samples
Locations of the soil samples collected during outdoor vapor monitoring ports (GMPs) installation are shown in Figure 23 and Table 8. Of the 69 soil samples collected, 19 were collected from saturated soil – either the water table or a perched zone of groundwater. These are indicated on Figure 23.
Compounds detected in the soil samples were
Acetone m,p-Xylenes Methyl-t-butyl ether Naphthalene o-Xylene
Acetone, in addition to occurring naturally as a metabolic by-product, is a common
laboratory contaminant in soil and groundwater analyses, and may not be representative of actual soil contamination. Acetone was detected in 3 locations. The other compounds detected in soil were found in a single sample collected from the alley between Oglethorpe St. and Eastern Ave at a depth of 28 ft. The depth to water at this location was approximately 25 ft after the hole filled with water. From a depth of about 24 to 28 ft, the geoprobe core was characterized by high PID readings.
Concentrations of these compounds in that sample were:
m,p-Xylenes 4,000 ug/kg o-Xylene 2,100 ug/kg Naphthalene 3,000 ug/kg
Detection of these compounds at this location is consistent with the presence of residual
gasoline in the "smear zone." A "smear zone" is an area of soil contamination formed when

Riggs Park Sampling & Analysis Report, February 2009 25
liquid phase gasoline (which is less than dense than water) has migrated atop the water table and been "smeared" across the soil with rising and falling water levels. These detections suggest that liquid-phase gasoline from the release at 5801 Riggs Road migrated at least as far as this location.
The location of this soil contamination is within Area B identified by USEPA for
additional remedial measures in its Final Decision and Response to Comments on the Chillum Gasoline Release (see Figure 1 in USEPA, 2008). While no benzene was detected in soil from this location, it is important to note that USEPA recognizes that the shallow groundwater benzene plume did extend at least this far in 2008 (Figure 10). Subsequent data for wells MW-24a and MW-24b confirm the presence of the other dissolved BTEX constituents (toluene, ethylbenzene and xylenes) through 2008.
Groundwater Samples
Fourteen groundwater samples were collected from the geoprobe borings described above (Table 8). The compounds detected were:
Acetone Chloroform Methyl-t-butyl ether (MTBE) Tetrachloroethene (PCE) Chloroform is a laboratory and industrial solvent, as well a common byproduct of water
chlorination. It may be present in urban groundwater due to use of public water supplies for watering of lawns and other activities that discharge treated water to the ground (Ivahnenko and Zogorski, 2006).
The most commonly detected compound in groundwater samples was MTBE, which was
detected in more than half of the samples (Table 9). The presence of MTBE in these shallow groundwater samples is generally consistent with the known maximum extent of shallow groundwater contamination. The location of the highest concentration (83 ug/l) in the area between Oglethorpe and Nicholson Streets is also consistent with previous mapping (Figures 12-15). The low-concentration detections on the order of 2-8 ug/l northeast and northwest of 6th street, were not reported for the shallow groundwater in 2008 (Figure 14).
The detection of PCE is also generally consistent with the previously reported
distribution of contaminants in the shallow groundwater. The two monitoring wells situated closest to the PCE detection in groundwater are MW-27A and MW-44A. Sampling results from these two wells in 2008 yielded 5.9 ug/l and 6.2 ug/l respectively. The PCE detection at location S199 was 7 ug/l.
Riggs Park Sampling & Analysis Report, February 2009 26
Data Validation
An important part of the data collection effort was Quality Control / Quality Assurance (QA/QC) and data validation. Methods for QA/QC are addressed more fully in the Quality Assurance Project Plan (QAPP) included with the Work Plan (SSP&A, 2007).
Field QA/QC
During data collection, every effort was made to ensure that field activities conformed with the data quality objectives of this project, and that data were collected according to the required protocols. Substantial emphasis was placed on appropriate installation of VMPs, sampling protocols, and field record keeping. All field notes are reproduced in the Appendices to this report. Key information recorded for each sample included
the exact sample location(s), Summa canister and regulator ID numbers, times and vacuums during canister placement and pickup, PID calibration data any other information that might have impacted sample collection.
Laboratory QA/QC
The Quality Assurance Manual for Spectrum Analytical Inc. is included as an Appendix to the QAPP. The other two laboratories used for this project also maintain detailed QA manuals. At all stages of this project, the Project Managers from SSP&A and CGS were in contact with the analytical laboratories to ensure that laboratory procedures were in compliance with the project and laboratories' QA/QC procedures.
Independent Laboratory Duplicates
As per the work plan, a duplicate sample was collected for at least ten percent of vapor samples (Table 10). These duplicates were sent to Pace Analytical Laboratories for analysis via method TO-15 (modified). The analyte lists for method TO-15 (modified) for the primary and secondary laboratories vary somewhat (see SSP&A, 2007), but include all of the target compounds required in the original scope of work and work plan, with similar nominal detection limits.
Figure 24 illustrates the correspondence between data from the primary and secondary
laboratories for selected compounds. Many of the compounds are present at concentrations close to the detection limits. All non-detects are plotted at 0.1 3/ mug on Figure 24 (except for TVH, for which they are plotted at 10 ppbV). As seen on Figure 24, for all the compounds illustrated, there is a positive correlation between the results from the two laboratories. The data are generally distributed about the 1:1 line, with greater scatter apparent at lower concentrations. Detection limits from the secondary lab are generally higher than those reported from the

Riggs Park Sampling & Analysis Report, February 2009 27
primary lab. Consequently, at low concentrations, the correspondence between the laboratories is more variable.
Spatial Duplicates (VMPs)
The concentrations of any compound in samples from a single home are expected to exhibit some variation. These variations may occur over time (temporal variation) or by sampling location (spatial variation). In fourteen (14) homes, more than one sub-slab VMP was installed. These VMPs were installed to the same depth, but in different parts of the basement for each home. They serve as spatial duplicates to provide a check upon the consistency of the sampling results, and the potential for subsurface heterogeneity to influence the sampling results. For each home with multiple VMPs, each VMP was sampled on the same schedule, and analytical results were obtained from the same laboratory.
A comparison of results from duplicate VMPs is presented in Figure 25. These results
represent a selection of the compounds most frequently detected. As can be seen from these diagrams, there is a positive correlation between results from the paired VMPs. This indicates that subsurface concentrations of contaminants are correlated for the same home, regardless of VMP location. While subsurface heterogeneity exists, and may impact individual measurements, these data suggest that it is generally not sufficient to be the primary factor impacting sampling results at the scale of individual homes.
Riggs Park Sampling & Analysis Report, February 2009 28
Section 7 Evaluation of Air and Vapor Sample Results As described above, many compounds were detected in the vapor and air samples. Thirty-eight (38) compounds were detected in the ambient air samples and 64 were detected in the sub-slab samples. A smaller number of compounds were detected in the soil and groundwater samples. The number of compounds detected does not by itself indicate the relative degree of contamination. Detection of any analytical parameter depends upon a number of factors including the detection limit for each sample. The detection limit is itself influenced by the analytical method, the presence of other compounds and their concentrations in each sample. Appendix O contains cumulative frequency diagrams for each analyte. In these diagrams, for each group of samples (e.g. indoor air, ambient air, sub-slab vapor monitoring ports and outdoor vapor monitoring ports) the complete set of results is sorted by value, and plotted in ascending order. Non-detect results are plotted at the value of the detection limit, and are indicated by open symbols. Detections are indicated by filled symbols. A review of these curves indicates that for each parameter, the lowest detection limits are generally associated with the sub-slab VMP samples, and the highest with the outdoor GMP samples. The higher detection limits for the GMP samples likely originate in part from preferential placement of the GMPs. They were installed at depths closer to potentially contaminated groundwater than were most VMPs, and for many compounds of interest, the highest concentrations are observed in the GMP samples (see below). In addition, the higher detection limits in some GMP samples may reflect anomalously high concentrations of acetone, tetrahydrofuran, and 2-butanone (MEK) and carbon disulfide. These compounds are unlikely to represent actual subsurface conditions, and may reflect factors associated with construction of the GMPs. Nonetheless, the detection limits for benzene and PCE, for example, are as low as 0.1 ppbV, and population of compounds detected is similar to that for the VMP samples.
Figure 26 illustrates the analytes detected in ambient and indoor air samples. Forty-seven
(47) analytes were detected in indoor air, and 38 were detected in ambient outdoor air. Two compounds were detected in ambient air, but not indoor air. Those two compounds (trans-1,3-dichloropropene and 1,2,4-trichlorobenzene) were only detected in a single ambient air sample. The 11 compounds detected in indoor air, but not ambient air, were detected in no more than 3 indoor samples each. Overall, these results indicate that the population of compounds detected in indoor and ambient air samples are similar.
The frequency of detection between the indoor and ambient air data populations, varies
between the two data sets. For example: cyclohexane was detected in about 27% of the indoor air samples, but in fewer
than 3% of the ambient air samples
Riggs Park Sampling & Analysis Report, February 2009 29
Carbon tetrachloride was detected in 26% of the ambient air samples, but only 6% of the indoor air samples
1,4-dichlorobenzene was detected in 49% of the indoor air samples, but only 10% of the ambient air samples
Ethyl acetate was detected in 61% of the indoor air samples, but only 10% of the ambient air samples
Methylene chloride was detected in 72% of the ambient air samples, but only 46% of the indoor air samples
Naphthalene was detected in 21% of the indoor air samples, but in none of the ambient air samples
Trichlorofluoromethane (Freon 11) was detected in 100% of the ambient air samples, but only 73% of the indoor air samples.
Figure 27 illustrates a similar comparison between the indoor air samples and the sub-
slab vapor monitoring port samples. Sixty-four (64) analytes were detected in the sub-slab samples, and 47 were detected in the indoor air samples. Only one compound, 1,3-butadiene detected in indoor air was not detected in the subslab samples. (Butadiene was detected in 7% of the indoor air samples.) There are 18 analytes that were detected in the sub-slab VMPs that were not detected in any indoor air samples. Of these, n-butyl benzene (in 17% of the sub-slab samples) occurred most frequently (see note on Table 5 regarding frequency of testing for compounds added to the TO-15 list). Overall, these results indicate that the population of compounds detected in indoor and sub-slab samples are very similar.
The frequency of detection between these data populations, however, are not identical.
For example, Carbon disulfide was detected in 31% of the sub-slab VMP samples, but only 4%
of the indoor air samples Carbon tetrachloride was detected in 30% of the sub-slab VMP samples, but only
6% of the indoor air samples Chloroform was detected in 58% of the sub-slab VMP samples, but only 24% of
the indoor air samples. Chloromethane was detected in 95% of the indoor air samples, but only 23% of
the sub-slab samples. Ethylbenzene was detected in 31% of the indoor air samples, but only 13% of the
sub-slab samples Hexane was detected in 75% of the indoor air samples, but only 40% of the sub-
slab samples 2-Hexanone (MBK) was detected in 60% of the sub-slab air samples, but only 7%
of the indoor air samples Methylene chloride was detected in 46% of the indoor air samples and 25% of the
sub-slab samples Naphthalene was detected in 21% of the indoor air samples but only 2% of the
sub-slab samples

Riggs Park Sampling & Analysis Report, February 2009 30
The m,p-xlyenes were detected in 78% of the indoor air samples, but only 50% of the sub-slab samples
PCE (tetrachloroethene) was detected in 95% of the the sub-slab samples, but only 31% of the indoor air samples
1,1,1-Trichloroethane was detected in 37% of the the sub-slab samples, but only 10% of the indoor air samples
Trichloroethene (TCE) was detected in 26% of the the sub-slab samples, but only 6% of the indoor air samples
1,1,2-Tirchlorotrifluoroethane (Freon 113) was detected in 44% of the the sub-slab samples, but only 8% of the indoor air samples.
Figure 28 illustrates a comparison between the sub-slab vapor monitoring port samples
and those collected from the outdoor vapor monitoring ports (GMPs). Forty-eight analytes were detected in the outdoor GMP samples, compared to 64 in the sub-slab samples. As noted above, detection limits for the GMP samples were generally higher than those for the VMP samples. Consequently, compounds at low concentration may have been detected more frequently in the VMP sample population than in the GMP sample population.
Bearing these issues in mind, it is noted that:
Benzene was detected in 67% of the sub-slab VMPs, but only 12% of the GMPs MTBE was detected in 11% of the GMPs, but only 5% of the sub-slab VMPs Carbon disulfide was detected in 95% of the GMPs, but only in 31% of the VMPs 1,4-dichlorobenzene was detected in 56% of the sub-slab VMPs, but only 11% of
the GMPs Dichlorodifluoromenthane (Freon 12) was detected in 94% of the sub-slab VMP
samples, but only 43% of the GMP samples Ethyl acetate was detected in 50% of the sub-slab VMPs, but only 21% of the
GMPs Methylene chloride was detected in 25% of the sub-slab VMPs, but only in 3% of
the GMPs Propene was detected in 82% of the GMP samples, but only 14% of the sub-slab
VMP samples. Tetrachloroethene (PCE) was detected in 95% of the VMP samples, but only 29%
of the GMP samples Tetrahydrofuran was detected in 25% of the VMP samples, but only 9% of the
GMP samples 1,1,1-Trichloroethane (111-TCA) was detected in 37% of the VMP samples, but
only 4% of the GMP samples Trichlorofluoromethane (Freon 11) was detected in 95% of the sub-slab VMPs,
and only 25% of the GMPs 1,1,2-trichlorotrifluoroethane (Freon 113) was detected in 44% of the VMPs, but
only 3% of the GMPs.
Riggs Park Sampling & Analysis Report, February 2009 31
As discussed above, installation of VMPs was not possible in some homes. Consequently, for these homes, outdoor GMPs were installed instead. Nonetheless, several studies have shown that there can be a significant difference in soil vapor concentrations below and adjacent to buildings (Hers et al., 2001). Concerns over false negative results from exterior soil vapor sampling has limited its use in determining vapor intrusion problems (Boyer, 2004). Exterior soil gas sampling may be an appropriate part of an indoor vapor intrusion study, when for example, occupants are (as in some Riggs Park homes) not receptive to drilling a hole in the slab (Boyer, 2004). While the elevated detection limits may mask some low concentrations of contaminants in the outdoor vapor samples, it is important to note that the maximum concentrations of many compounds were also detected in the GMPs.
Compounds Likely Unrelated to Subsurface Contamination
While it is not the intent of this report to exclude from consideration potential contaminants, there are a number of compounds detected that are unlikely to be related to subsurface contamination. These are compounds that are commonly detected in ambient and/or indoor air, and are unlikely to provide information about the subsurface environment. For example, the chlorofluorocarbons (CFCs)
Dichlorodifluoromethane (Freon 12) 1,2-Dichlorotetrafluoroethane (Freon 114) Trichlorofluoromethane (Freon 11) 1,1,2-Trichlorotrifluoroethane (Freon 113)
are widely disseminated, common, and relatively persistent chemicals in the atmosphere.
Studies have shown the presence of these chemicals in the ambient air and subsurface. Pankow et al. (2003) found average values of these compounds in semi-rural and urban areas consistent with values observed here.
Similarly, the compounds ethyl acetate, 4 ethyl-toluene, and the alcohols are excluded
from further discussion, as they are not typical of the groundwater or soil contaminants observed in the Riggs Park neighborhood. Finally, some common solvents acetone, MEK, MIBK, carbon disulfide, and tetrahydrofuran are excluded because they may represent laboratory or sampling contamination, and are not indicative of groundwater contamination. Propene, a compound that exists in a vapor-phase at ambient conditions, appears to be preferentially observed in the GMP samples, and is not known to be associated with gasoline-related contamination at the site. It is also excluded from further discussion.
Data Population Analysis
Tables 6 and 7 presents summary statistics for selected analytes grouped by common sources or characteristics. These groupings are not intended to represent an evaluation of provenance. Cyclohexane, for example, is a compound found in gasoline. It is also, however, a

Riggs Park Sampling & Analysis Report, February 2009 32
common laboratory solvent and component of gasoline exhaust. Similar limitations apply to all these compounds – each has multiple uses, and potential sources. The grouped compounds are as follows:
Petroleum-Related Compounds
Benzene Toluene Ethylbenzene Xylenes (m,p- and o-) Naphthalene MTBE Trimethylbenzenes (1,2,4- and 1,3,5-) Cylcohexane Hexane n-heptane
Chlorinated Solvents
Tetrachloroethene (PCE) Trichloroethene (TCE) 1,1,1-Trichloroethane (111-TCA) Chloroform Chloromethane 1,4-Dichlorobenzene
In Table 6, each sample population – the Ambient Air, Indoor Air, Sub-Slab VMP
Samples, and Outdoor GMP Samples, are addressed separately. In its Risk Assessment Guidance, the USEPA recommends that the average concentration of a compound be used to represent a reasonable estimate of the concentration likely to be contacted over time. Because of the uncertainty associated with estimating the true average concentration at a site, the USEPA recommends that the 95 percent Upper Confidence Limit (UCL) of the arithmetic mean should be used (USEPA, 1992, 2002d).
In this study, the USEPA software ProUCL 4.0 was used to calculate UCLs for the
ambient air data. Some of the data populations were determined by ProUCL to exhibit lognormal or gamma distributions, and thus are suitable for calculation of the UCL via parametric methods. The data distributions for other data sets were not determined to display a discernible distribution. For these datasets, the UCL was calculated via non-parametric methods. When more than one non-parametric method was suitable for UCL calculation, the highest estimate of the UCL is cited. Generally, the variation in UCL value calculated using different methods was small (<1 3/ mug ).
Riggs Park Sampling & Analysis Report, February 2009 33
Figures 29 and 30 illustrates the range of values detected in vapor samples for selected compounds. On each chart, the filled bars represent the interquartile range for each set of detections. The interquartile range represents the data between the 25th to 75th percentiles when all values are ranked in ascending order. Observations about these data populations include:
For the selected petroleum-related compounds, o the concentration values for each compound range over several orders of
magnitude o all but naphthalene and MTBE were detected in ambient air o the maximum concentrations and 75th percentile concentrations for indoor
air samples generally exceed those from the ambient air samples o for each compound, the maximum concentrations and 75th percentile
concentrations are generally associated with the GMP data o the minimum detections are generally associated with sub-slab VMP
samples For the selected chlorinated solvents,
o the concentration values for each compound range over several orders of magnitude
o all the compounds were detected in each of the four sample groups (indoor air, ambient air, VMPs, and GMPs)
o For TCE, 111-TCA, chloroform, and chloromethane, the maximum detections were in the VMP samples
o The maximum concentrations of 1,4-dichlorobenze are found in the indoor air samples
o For PCE, the maximum concentrations and 75th percentile concentrations are similar in both the VMP and GMP sample populations; these exceed the maximum and 75th percentile values for indoor air and ambient air.
Comparison of Ambient Air Data from Other Studies
Many of the results cited above for ambient air are consistent with data from other studies of urban environments. For example, the 95% UCL of the mean benzene concentrations in this study was 1.1 3/ mug . In comparison, a 2003 study found the average benzene concentration in highly urbanized areas in Massachusetts, California, and New Jersey to range from 0.4 to 3.5
3/ mug in 1999 to 2000 (Pankow et al., 2003). While sampling methods in that study utilized adsorbent cartridges rather than Summa canisters, a number of studies have cited a good correspondence of results between these two types of samples (Aleksic et al., 2005, Spicer 1986 cited in Wallace, 2001, Jia et al., 2008a).
Similarly, a California Air Resources Board study (California Air Resources Board,
1992) found the median values of benzene to range from 0.77 to 1.1 3/ mug . Closer to the Riggs

Riggs Park Sampling & Analysis Report, February 2009 34
Park neighborhood, the average result of 60 ambient benzene samples collected at the McMillan Reservoir in Washington DC in 2005 was 0.92 3/ mug (DDOE, pers. Comm.)
For toluene, which was detected in 100% of the ambient air samples, the 95% UCL of the
mean value of 2.5 3/ mug is consistent with the Pankow et al. (2003) mean values ranging from
1.5 to 10.2 3/ mug . The 2005 mean concentration for toluene at the McMillan reservoir was
1.94 3/ mug . PCE was detected in 28% of the ambient air samples collected for this study. The range
of detected values (0.61 to 4.95 3/ mug ) and the 95% UCL of the mean value (1.1 3/ mug ) are consistent with values observed at the MacMillan Reservoir from 2000 to 2007. Mean concentrations reported in Pankow et al. (2003) ranged from 0.26 to 2.3 3/ mug .
Comparison of Vapor Data to Previous Studies
Comparison of the data on Tables 1 and 5 illustrates the relationships between the current data set, and data collected in previous studies. For example:
For indoor air samples o The maximum benzene detected in this study was 8.36 3/ mug ; this result
is within the range of indoor (basement) values obtained from previous Riggs Park studies: the maximum value detected in the USEPA/Chevron studies was
13 3/ mug the maximum reported for the BSEA 2006 study was 26.8 J
3/ mug the maximum value observed in winter 2007 studies by DOH was
6.6 3/ mug
o The maximum value of MTBE detected in this study (1.77 3/ mug ) is
lower than the maximum reported in other studies 25.0 to 63.5 3/ mug )
o The maximum concentration of PCE detected (42.31 3/ mug ) is higher
than that reported from previous data sets (23.1 3/ mug , 38.9 3/ mug , and
3.3 3/ mug ), although in a similar range
For Subsurface (VMP and GMP samples) o The maximum detections of benzene (24.9 3/ mug ), toluene (173.7
3/ mug ), MTBE (667.4 3/ mug ), and PCE (929.0 3/ mug ) are all lower than the maximum reported in previous USEPA/Chevron studies; this may reflect inclusion of samples at depths and geographic locations closer to the source areas in those studies than sampled here

Riggs Park Sampling & Analysis Report, February 2009 35
o The maximum concentrations for the xylenes (270.2 and 189.9 3/ mug ) in this study are higher than those reported in previous USEPA/Chevron studies.
Comparison of Indoor Air Data to Ambient Air Data
As can be seen in Figures 29 and 30, the interquartile range and maximum concentrations for many compounds are higher in the indoor air samples than in the ambient air samples. This relationship by itself does not, however, serve as evidence for vapor intrusion from subsurface sources. There are many possible sources of indoor VOCs that may influence concentrations measured indoors.
For example, attached garages are potential sources of BTEX (Dodson et al., 2008; Jia et
al., 2008b; Batterman et al., 2006) as would be any gasoline-containing items such as lawnmowers. Other sources of indoor air contamination include recent renovations, indoor smoking, building materials, furnishings, cleaning products, insecticides, hobby supplies, etc. The degree of contamination itself can be related to rates of window/door opening and ventilation rates (Jia et al., 2008b). A USEPA study (Sack et al., 1992) evaluated 1159 common household products for 31 VOCs. Xylenes were among the most common chemicals detected. Other chemicals typically found in relatively high concentrations included PCE and toluene. Sources of BTEX included automotive products, household cleaners/polishes, and fabric and leather treatments (Sack et al., 1992). PCE may be elevated in indoor air when freshly dry-cleaned clothes are stored indoors (Tichenor et al., 1990).
Because these effects are well known, the indoor air sampling protocol required that
household chemicals be removed 24 hours prior to sampling. Nonetheless, such removal cannot completely eliminate the impacts of these indoor sources. It is known that sinks such as wallboard, ceiling tile, carpet, and upholstery are important in controlling VOC concentrations over extended periods (Hers et al., 2001; Tichenor et al., 1990). Similarly, seasonal variations in ambient air concentrations in urban communities can have an impact on contaminant concentrations in indoor air (Jia, et al., 2008b).
Geographic Distribution of Data
The geographic distributions of indoor air and subsurface vapor data are depicted on Figures 31 through 34. The zones depicted as Areas 1 to 6 are those used by BSEA in their initial study of the Riggs Park neighborhood on behalf of DOH (BSEA, 2006). For each of the selected contaminants the color scale for concentration ranges are scaled to the maximum values detected in either medium.
As noted above, air and soil vapor concentration data may vary over time as well as by
location. For the subsurface data, the maximum value detected at each home is indicated on these maps.

Riggs Park Sampling & Analysis Report, February 2009 36
Key observations include the following:
For the petroleum-related compounds (Figures 31 and 32), o With the exception of MTBE, all compounds were detected in the indoor
air of each of the six zones. o All compounds were detected in at least one location in the subsurface
vapor of each of the six zones. For the chlorinated compounds (Figures 33 and 34)
o All compounds were detected in the indoor air of each of the six zones. o All compounds were detected in at least one location in the subsurface
vapor of each of the six zones. The highest subsurface concentrations for several compounds were observed in GMP
samples southwest of Nicholson Street. Other subsurface detections were also noted in the portion of the study area southwest of Nicholson street. The currently accepted conceptual model for groundwater flow at this site is that groundwater discharge point for the Chevron plume occurs at the storm sewer along Nicholson street. If these results are confirmed, it suggests that the conceptual model for groundwater flow and plume migration may need to be modified, or that there is an additional source of gasoline-related contaminants affecting these portions of the neighborhood.
Riggs Park Sampling & Analysis Report, February 2009 37
Section 8 Information from Home Surveys
Prior to indoor air sampling, each homeowner completed a detailed survey form. Household chemicals were identified, and these were removed for 24 hours prior to testing. Some of the information on those survey forms may potentially inform the results of the indoor air testing. These results are summarized on Table 11.
Briefly, key results can be summarized as follows. Of the 115 homes for which indoor
air sampling was completed: Smokers (occasional or regular) were resident in 21 homes Dry cleaned clothes had been present in more than 20 homes within the last
several weeks Seven homes have an attached garage Gas cans, or lawnmowers with gas tanks were stored in the outdoor sheds of 7
homes, and in two homes with attached garages None of the residents cited a visit by an exterminator in the past year Three residents reported that a household member worked with solvents currently
or in the past (car painting, furniture repair) About 30 homeowners reported some home repairs or renovations within the six
months prior to the home survey and indoor air sampling Twenty-two (22) homeowners reported roof repairs or replacement within the past
year Basement sumps were reported to currently or commonly have water in them, in
four homes Five basements were equipped with previously installed VMPs from other
studies.

Riggs Park Sampling & Analysis Report, February 2009 38
Section 9 Ratios of Subsurface to Indoor Air Concentrations
One measure of the potential for vapor intrusion into a home is the observed ratio of contaminant concentrations between the subsurface and the indoor air.
We can define this ratio as INA
SS
Conc
Conc where
ssConc is the subsurface concentration (max value), and
INAConc is the indoor air concentration.
This definition is the inverse of the vapor/vapor attenuation factor (AF) commonly used
in vapor intrusion guidance and studies (e.g. USEPA, 2002c). Other definitions of attenuation factor, including groundwater to indoor air AF are also used in evaluating vapor intrusion.
A previous study cited by USEPA (USEPA, 2002c) found that for homes with greater
indoor air than subsurface vapor concentrations of chlorinated solvents, the sub/slab to indoor air ratios ranged from more than 0.1 to less than 0.001. These observations are consistent with the more recent work by McDonald and Wertz (2007) for chlorinated solvents in a New York State residential neighborhood.
Figures 35 and 36 illustrate the ratios of sub-slab to indoor air concentrations for each of the 115 homes which was fitted with a sub-slab VMP. Outdoor GMP data are excluded from this analysis. The maximum value for the sub-slab concentrations are used in these analyses. As can be seen from these graphs
For both the petroleum-related and chlorinated compounds, the ratio of sub-slab concentrations to indoor air concentrations depends on the individual home and sampling result
For the petroleum-related compounds, the sub-surface to indoor air ratios range from 182 to .006,
o ratios are less than 1 for most samples The highest ratio is associated with measurements of m,p-Xyelene for each of the petroleum-related compounds, the sub-slab concentrations exceed
the indoor air concentrations in at least 20% of homes For the chlorinated compounds, the sub-slab to indoor air ratios range from 144 to
0.004 For PCE, the ratio for subsurface to indoor air is greater than 1 for about 72% of
the homes. Ratios of 10 and higher were observed for 1,4-dichlorobenzene, chloroform, and
PCE.

Riggs Park Sampling & Analysis Report, February 2009 39
These results indicate that for some compounds concentrations in the sub-slab are higher
than in the homes, setting up a positive concentration gradient from the subsurface to indoor air. Of course, these results exclude homes without VMPs, and are impacted by factors such as variable detection limits in the sub-slab and indoor air samples. To evaluate the evidence for vapor intrusion and/or risk posed by these concentrations, an individualized home-by home analysis is required.
Riggs Park Sampling & Analysis Report, February 2009 40
Section 10 Conclusions
The following conclusions summarize the key points discussed in previous sections of this report:
Shallow groundwater samples collected from 14 locations yielded detections of PCE and MTBE; MTBE was detected in more than half of the samples at concentrations consistent with previous studies
A soil sample collected at the water table in the alley between Oglethorpe Street and Eastern Ave. is consistent with the presence of residual liquid-phase gasoline; this result provides additional evidence for migration of liquid-phase gasoline to the District of Columbia side of Eastern Ave
Analyses of the air and vapor samples indicates that the population of volatile compounds detected via TO-15 analyses are similar amongst the 4 data populations.
o In the 39 ambient air sample population, a total of 38 analytes were detected at least once
o In the 128 indoor air sample population, a total of 47 analytes were detected at least once
o In the 378 VMP vapor samples, a total of 64 analytes were detected at least once
o In the 151 GMP vapor samples, a total of 48 analytes were detected at least once
Ambient air concentrations of benzene, toluene, and PCE are within ranges observed both at Washington DC's McMillan Reservoir, and within ranges reported in the literature for other urban environments
Many compounds detected in the TO-15 analyses are likely unrelated to subsurface contamination sources. These include
o freons o various solvents and alcohols o anomalous concentrations of acetone, MIBK, tetrahydrofuran, propene, and
carbon disulfide in GMP samples For the suite of 13 petroleum-related compounds that occur frequently in the vapor
sample populations, the following observations can be made o the concentration values for each compound range over several orders of
magnitude o the maximum values and 75th percentile values for indoor air samples
generally exceed those from the ambient air samples o the maximum values and maximum 75th percentile values are generally
associated with the GMP data o the minimum detections are generally associated with sub-slab VMP samples o With the exception of MTBE, all compounds were detected in the indoor air
of each of the six geographic zones in the Riggs Park neighborhood.
Riggs Park Sampling & Analysis Report, February 2009 41
o All compounds were detected in at least one location in the subsurface vapor of each of the six geographic zones in the Riggs Park neighborhood
o The maximum benzene concentration detected in indoor air was 8.36 3/ mug o The maximum benzene concentration detected in subsurface vapors was 24.9
3/ mug .
For the 6 selected chlorinated compounds that occur frequently in the vapor sample populations the following observations can be made:
o the concentration values for each compound range over several orders of magnitude
o all the compounds were detected in each of the four sample groups (indoor air, ambient air, VMPs, and GMPs)
o For PCE, the maximum concentrations and 75th percentile concentrations are similar in both the VMP and GMP sample populations; these exceed the maximum and 75th percentile values for indoor air and ambient air
o All compounds were detected in indoor air in at least one location in each of the six geographic zones in the Riggs Park neighborhood
o All compounds were detected in subsurface vapors in at least one location in each of the six geographic zones in the Riggs Park neighborhood
o The maximum concentration of PCE detected in indoor air was 42.3 3/ mug o The maximum concentration of PCE detected in subsurface vapors was 929
3/ mug .
For homes at which compounds were detected both indoors and in the sub-slab samples:
o for the petroleum-related and chlorinated compounds, the ratios of sub-slab to indoor air concentrations range from 182 to 0.003 for individual homes
o for each of the petroleum-related compounds, the sub-slab concentrations exceed the indoor air concentrations in at least 20% of homes
o for the chlorinated compounds chloroform, 111-TCA, 14-dichlorobenzene and PCE, the maximum sub-slab concentration exceed the indoor air concentration in at least 20% of the homes
o the concentration of PCE is greater in the sub-slab than in the indoor air in about 72% of the homes
Discussion and Recommendations
The information presented above provides an overview of the analytical results from this sampling program. As noted, the intent of this report was not to exclude any analytes from the analysis. Nonetheless, some compounds that are widespread in the atmosphere (e.g. the freons) are not central to the potential impact of groundwater contamination on the Riggs Park neighborhood. Other compounds, such as the alcohols, propene, and carbon disulfide, may reflect some aspect of subsurface contamination and/or its metabolism by microbes. Because of

Riggs Park Sampling & Analysis Report, February 2009 42
the potential of these compounds to originate from many potential sources, however, any linkage between them and existing groundwater contamination must be explored further.
Similarly, no attempt was made in this report to subtract or otherwise account for ambient
air concentrations of the compounds of interest. The limited comparisons cited in this report between these data and other urban air studies suggest that the ambient air concentrations of volatile organic compounds are similar to those observed in other U.S. urban areas.
Finally, no attempt was made in this report to determine the levels at which contaminants
present in indoor air that appear to be present in subsurface vapor pose unacceptable cancer or non-cancer risk.
The following recommendations are based upon the above analyses:
These data should be used to complete a risk-assessment for the Riggs Park neighborhood on a home-by-home basis, using all relevant compounds in order to establish what risk, if any, exists for the residents
Considering the results from subsurface sampling southwest of Nicholson street (beyond the presumed groundwater discharge zone), additional sampling may be helpful
Should results suggesting subsurface contamination southwest of Nicholson Street be confirmed, the current conceptual model of contaminant transport should be reviewed to determine if
o The Nicholson street storm sewer is an effective discharge point for all groundwater contamination and/or if
o Other potential sources of subsurface contamination exist southwest of Nicholson street.

Riggs Park Sampling & Analysis Report, February 2009 43
Section 11 References Aleksic, N., G. Boynton, G. Sistla, and J. Perry. 2005. Concentrations and Trends of Benzene in
Ambient Air Over New York State during 1990-2003: Atmospheric Environment 39, no. 40: 7894-7905.
Batterman, S., G. Hatzivasilis, and C. Jia. 2006. Concentrations and Emissions of Gasoline and Other Vapors from Residential Vehicle Garages: Atmospheric Environment 40, no. 10: 1828-1844.
Boyer, J.E. 2004. Background Indoor Air Contamination: Its Assessment as Part of a Vapor Intrusion Investigation: Proceedings of the Air & Waste Management Association's 97th Annual Conference and Exhibition; Sustainable Development: Gearing Up for the Challenge, June 22-25 2004, Indianapolis, Indiana: 5753-5763.
Building Sciences and Engineering Associates (BSEA) Ltd. 2006. Riggs Park Air Quality Study - Final Program Report: Prepared for Government of the District of Columbia. September.
California Air Resources Board. 1992. Indoor Pollutant Concentrations and Exposures.
District of Columbia Department of Health. 2007. Indoor Air Sampling Results, Winter, 2007.
Dodson, R.E., J.I. Levy, J.D. Spengler, J.P. Shine, and D.H. Bennett. 2008. Influence of Basements, Garages, and Common Hallways on Indoor Residential Volatile Organic Compound Concentrations: Atmospheric Environment 42, no. 7: 1569-1581.
Gannett Fleming Inc. 2003a. Description of Current Conditions Report, Volume I: Prepared for Chevron Products Company. July.
Gannett Fleming Inc. 2003b. Soil Vapor Monitoring Report. August.
Gannett Fleming Inc. 2004. Interim Measures Report for Field Sampling at Residences. October.
Gannett Fleming Inc. 2005. Interim Measures Work Plan for Indoor Air Sampling at Residences: Prepared for ChevronTexaco Products Company. March.
Gannett Fleming Inc. 2006. Site Investigation Report, former Chevron Facility 122208, 5801 Riggs Road, Chillum, Maryland: Prepared for Chevron Products Company. June 21.
Gannett Fleming Inc. 2007a. Groundwater Monitoring Data in Electronic Format (122208_analytical_11-26-07.xls ). Data Provided to DOH from Gannett Fleming via e-mail.
Gannett Fleming Inc. 2007b. Interim Measure Report for Indoor Air Sampling ████████████, Former Chevron Facility 122208, Chillum, Maryland.
Gannett Fleming Inc. 2008. Groundwater Monitoring Data in Electronic Format (122208_GW_Data_12-08-08.xls). Data Provided to DDOE and DOH.

Riggs Park Sampling & Analysis Report, February 2009 44
Hers, I., R. Zapf-Gilje, L. Li, and J. Atwater. 2001. The Use of Indoor Air Measurements to Evaluate Intrusion of Subsurface VOC's into Buildings: Journal of the Air and Waste Management Association 51, no. 9: 1318-1331.
Ivahnenko, T., and J.S. Zogorski. 2006. Sources and Occurrence of Chloroform and Other Trihalomethanes in Drinking-Water Supply Wells in the United States, 1986-2001. U.S. Geological Survey. Scientific Investigations Report 2006-5015.
Jia, C., S. Batterman, and C. Godwin. 2008a. VOCs in Industrial, Urban and Suburban Neighborhoods, Part 1: Indoor and Outdoor Concentrations, Variation, and Risk Drivers: Atmospheric Environment 42, no. 9: 2083-2100.
Jia, C., S. Batterman, and C. Godwin. 2008b. VOCs in Industrial, Urban and Suburban Neighborhoods-Part 2: Factors Affecting Indoor and Outdoor Concentrations: Atmospheric Environment 42, no. 9: 2101-2116.
McDonald, G.J., and W.E. Wertz. 2007. PCE, TCE, and TCA Vapors in Subslab Soil Gas and Indoor Air: A Case Study in Upstate New York: Ground Water Monitoring & Remediation 27, no. 4: 86-92.
Pankow, J.F., et al. 2003. Concentrations and Co-Occurrence Correlations of 88 Volatile Organic Compounds (VOCs) in the Ambient Air of 13 Semi-Rural to Urban Locations in the United States: Atmospheric Environment 37, no. 36: 5023-5046.
Sack, T.M., D.H. Steele, K. Hammerstrom, and J. Remmers. 1992. Survey of Household Products for Volatile Organic Compounds: Atmospheric Environment 26A, no. 6: 1063-1070.
S.S. Papadopulos & Associates. 2007. Work Plan for the Riggs Park Air Toxics, Vapor Port Installation, Indoor, Soil Vapor Intrusion Study and Corrective Action Plan, December.
Tichenor, B.A., L.E. Sparks, M.D. Jackson, Z. Guo, M.A. Mason, C.M. Plunket, and S.A. Rasor. 1990. Emissions of Perchloroethylene from Dry Cleaned Fabrics: Atmospheric Environment 24A, no. 5: 1219-1229.
U.S. Army Corps of Engineers. 2004a. Chillum: Benzene Deep Plume, Maximum May-June Data from Deep Wells.
U.S. Army Corps of Engineers. 2004b. Chillum: Benzene Shallow Plume, May-June 2004 Data from Shallow Wells.
U.S. Army Corps of Engineers. 2004c. Chillum: Depth to Groundwater, August 204 Data from Shallow Wells.
U.S. Army Corps of Engineers. 2004d. Chillum: MTBE Deep Plume, Maximum May-June Data from Deep Wells.
U.S. Army Corps of Engineers. 2004e. Chillum: MTBE Shallow Plume, May-June 2004 Data from Shallow Wells.
U.S. Army Corps of Engineers. 2004f. Chillum: Benzene Soil Vapor Sample Results in 2002 and 2004. Shallow Soil Within 5 Feet Above or Below Slab.

Riggs Park Sampling & Analysis Report, February 2009 45
U.S. Army Corps of Engineers. 2004g. Chillum: MTBE Soil Vapor Sample Results in 2002 and 2004. Shallow Soil Within 5 Feet Above or Below Slab.
U.S. Army Corps of Engineers. 2004h. Chillum: Groundwater Elevation Contour, Shallow Wells - August 2004 Data.
U.S. Army Corps of Engineers. 2005a. Chillum: Benzene Deep Plume, Maximum September 2005 Data from Deep Wells.
U.S. Army Corps of Engineers. 2005b. Chillum: MTBE Deep Plume, Maximum September 2005 Data from Deep Wells.
U.S. Army Corps of Engineers. 2006a. Chillum: Benzene Shallow Plume, September 2005 Data from Shallow Wells.
U.S. Army Corps of Engineers. 2006b. Chillum: MTBE Shallow Plume, September 2005 Data from Shallow Wells.
U.S. Army Corps of Engineers. 2008. Plume Maps, Chillum, Maryland.
U.S. Department of Health and Human Services. 2008. Health Consultation - Public Comment Release, Indoor and Outdoor Air Data Evaluation for Chillum Perc Site, Chillum, Prince Georges County, Maryland. April 9.
U.S. Environmental Protection Agency. 1992. Supplemental Guidance to RAGS: Calculating the Concentration Term. U.S. Environmental Protection Agency. May.
U.S. Environmental Protection Agency. 1996. National Air Toxics Assessment, 1996 Modeled Ambient Concentrations. Accessed March 23, 2008, 2008. Available from U.S. Environmental Protection Agency,.
U.S. Environmental Protection Agency/USACE. 2002a. Perc Groundwater Results, Deep - Chevron Spring 2002 DP Sampling Round. Perc Groundwater Analytical Results Samples Collected During Gasoline Investigation Spring 2002.
U.S. Environmental Protection Agency/USACE. 2002b. Perc Groundwater Results, Shallow - Chevron Spring 2002 DP Sampling Round. Perc Groundwater Analytical Results Samples Collected During Gasoline Investigation Spring 2002.
U.S. Environmental Protection Agency. 2002c. OSWER Draft Guidance for Evaluating the Vapor Intrusion in Indoor Air Pathway from Groundwater and Soils (Subsurface Vapor Intrusion Guidance). Report No. EPA530-D-02-004. November.
U.S. Environmental Protection Agency. 2002d. Calculating Upper Confidence Limits for Exposure Point Concentrations at Hazardous Waste Sites. U.S. Environmental Protection Agency. December.
U.S. Environmental Protection Agency. 2003a. Chillum PERC Investigation Analytical Data for Samples Collected by EPA/START July-September 2003.

Riggs Park Sampling & Analysis Report, February 2009 46
U.S. Environmental Protection Agency. 2003b. Public Meeting October 2, 2003, Update on EPA’s investigation into the presence of PERC in subsurface soils. Mr. Marcos Aquino, On-Scene Coordinator, U.S. Environmental Protection Agency Region III.
U.S. Environmental Protection Agency. 2004a. Indoor Air Analytical Results (2004) Public Version. TABLE 2 SUMMARY OF VOC DETECTED IN AIR SAMPLES COLLECTED IN APRIL 2004.
U.S. Environmental Protection Agency/USACE. 2004b. Perc Groundwater Results - Chevron July 2004 Sampling Round. Perc Groundwater Analytical Results Samples Collected During Gasoline Investigation July/.August 2004.
U.S. Environmental Protection Agency/USACE. 2004c. Perc Groundwater Results - Chevron May 2004 Sampling Round. Perc Groundwater Analytical Results Samples Collected During Gasoline Investigation May/June 2004.U.S.
U.S. Environmental Protection Agency. 2004d. Soil Vapor Analytical Results (2004) Public Version. TABLE 3 SUMMARY OF SOIL VAPOR ANALYTICAL RESULTS (April 2004).
U.S. Environmental Protection Agency. 2004e. Soil Vapor Sampling Results, December 2004 Update. PowerPoint Presentation.
U.S. Environmental Protection Agency. 2004f. Construction and Installation of Permanent Sub-Slab Soil Gas Wells, Standard Operating Procedures 2082, Rev 99.9 (DRAFT), Response Engineering and Analytical Contract. Revision Date March 18, 2004.
U.S. Environmental Protection Agency. 2004g. Public Meeting Wednesday, Feb. 11, 2004, Update on EPA’s investigation into the presence of PERC in subsurface soils. Mr. Marcos Aquino, On-Scene Coordinator, U.S. Environmental Protection Agency Region III.
U.S. Environmental Protection Agency. 2007. Statement of Basis - Chevron Gasoline Release at Chillum, Maryland. August 30.
U.S. Environmental Protection Agency. 2008. Final Decision and Response to Comments, Chevron Gasoline Release at Chillum, Maryland – In Two Volumes. April.
Wallace, L.A. 2001. Human Exposure to Volatile Organic Pollutants: Implications for Indoor Air Studies: Annual Review of Energy and the Environment 26: 269-301.

FIGURES

������������������ ���������������
Former Chevron Station(5801 Chillum Rd)
La Salle Elementary School
Eastern Ave
Kennedy St
Rig
gs R
d
Oglethorpe St
Nicholson S
t
Madison St
6th
St
8th
St
Kensington Pl
6th S
t
8th
St
³
0 250 500Feet
Figure 1 Location of the Riggs Park Community
Legend
Study Area
McMillan Reservoir
Study Area
MDDC
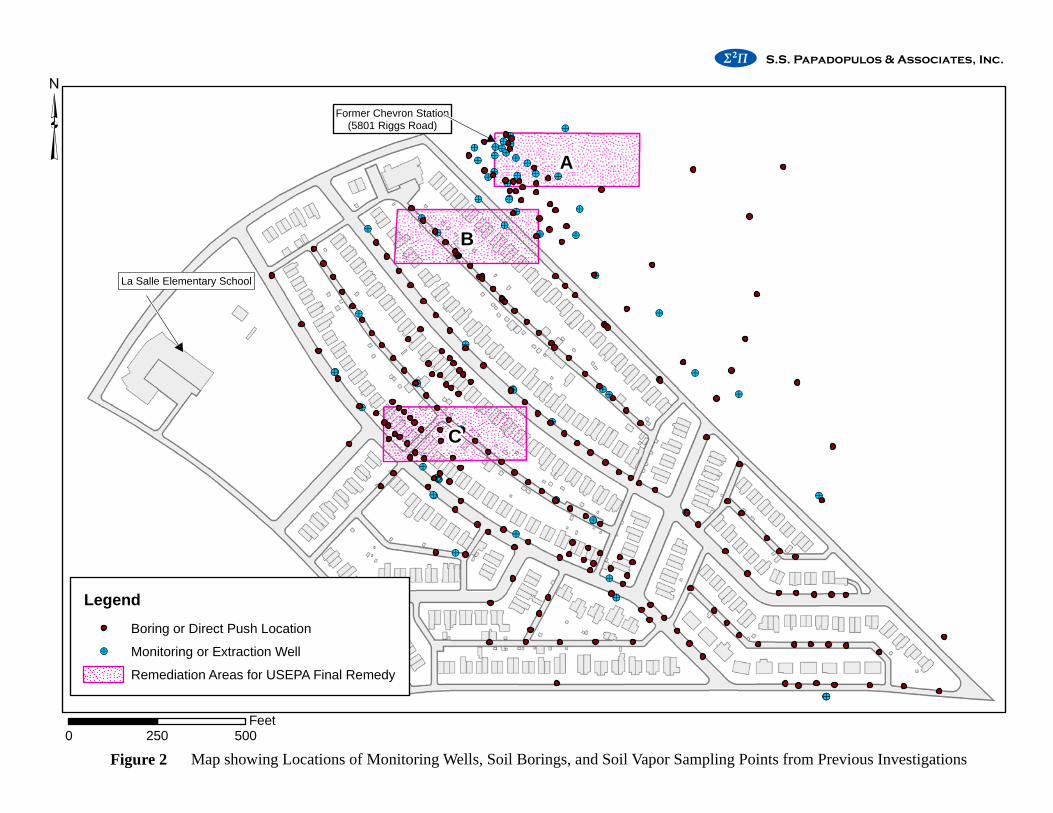
!>
!>
!>
!>
!>!>
!>
!>
!>
!> !>!>
!>!>
!>
!>
!>
!>!>
!>
!>
!>
!>!>
!>
!>!>
!>
!>!>
!>
!>
!>!>
!>!>!>!>
!>!>!>!>
!>
!>!>
!>!>
!>
!>!>
!>
!>!>
!>!>!>!>
!>
!>!>
!>
!>
!>!>
!>
!>!>
!>
Former Chevron Station(5801 Riggs Road)
La Salle Elementary School
A
C
B
³
0 250 500Feet
Figure 2 Map showing Locations of Monitoring Wells, Soil Borings, and Soil Vapor Sampling Points from Previous Investigations
Legend
Boring or Direct Push Location
!> Monitoring or Extraction Well
Remediation Areas for USEPA Final Remedy
������������������ ���������������

Figure 3 Detections of Liquid-Phase Hydrocarbons (from Gannett-Fleming, 2006)
������������������ ���������������

Figure 4 Concentrations of Benzene and MTBE in shallow soil vapor samples in 2002 to 2004 (from USACE, 2004f and 2004g)
������������������ ���������������

������������������ ���������������
³
0 250 500Feet
Figure 5 Shaded Relief Topographic Map of the Riggs Park Neighborhood
Legend
Study Area
Elevation (ft)
90 - 100
100 - 110
110 - 120
120 - 130
130 - 140
140 - 150
150 - 160
160 - 170
170 - 180

Figure 6 Groundwater Elevations in August 2004 (from USACE, 2004h)
������������������ ���������������

Figure 7 Depth to Groundwater in August 2004 (from USACE, 2004c)
������������������ ���������������

Figure 8 Benzene Concentrations in Shallow Monitoring Wells September 2005 (from Gannett-Fleming, 2006)
������������������ ���������������

Figure 9 Benzene Concentrations in Deep Monitoring Wells September 2005 (from Gannett-Fleming, 2006)
������������������ ���������������

Figure 10 Benzene Concentrations in Shallow Monitoring Wells March 2008 (from USACE, 2008)
������������������ ���������������

Figure 11 Benzene Concentrations in Deep Monitoring Wells March 2008 (from USACE, 2008)
������������������ ���������������

Figure 12 MTBE Concentrations in Shallow Monitoring Wells September 2005 (from Gannett-Fleming, 2006)
������������������ ���������������

Figure 13 MTBE Concentrations in Deep Monitoring Wells September 2005 (from Gannett-Fleming, 2006)
������������������ ���������������
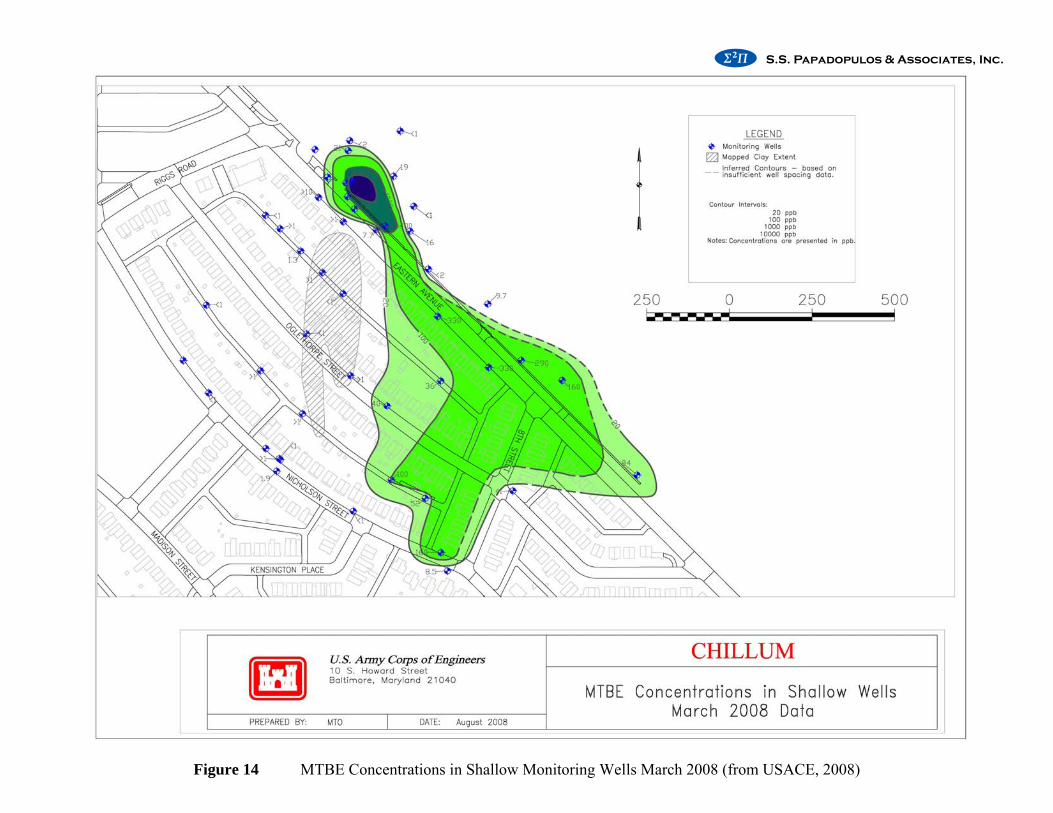
Figure 14 MTBE Concentrations in Shallow Monitoring Wells March 2008 (from USACE, 2008)
������������������ ���������������

Figure 15 MTBE Concentrations in Deep Monitoring Wells March 2008 (from USACE, 2008)
������������������ ���������������

Figure 16 PCE Concentrations in Shallow Groundwater from Spring 2002 Investigation (USEPA, 2002b)
������������������ ���������������

Figure 17 PCE Concentrations in Deep Groundwater (at least 10 feet below water table) from Spring 2002 Investigation (from USEPA, 2002a)
������������������ ���������������

������������������ ���������������
Task Name
Project Award
Kickoff Meeting
Work Plan and Field Readiness Documents
Obtaining Access Agreements
Q1 VMP Installation and Sampling
Q2 GMP Installation
Q2 Sampling
Q3 Sampling
Sep Oct Nov Dec Jan Feb Mar Apr May Jun Jul Aug Sep2008
Task
Progress
Milestone
Summary
Rolled Up Task
Rolled Up Milestone
Rolled Up Progress
Split
External Tasks
Project Summary
Group By Summary
Figure 18 Project Timeline
Project: Timeline_FigureXXDate: Mon 12/29/08
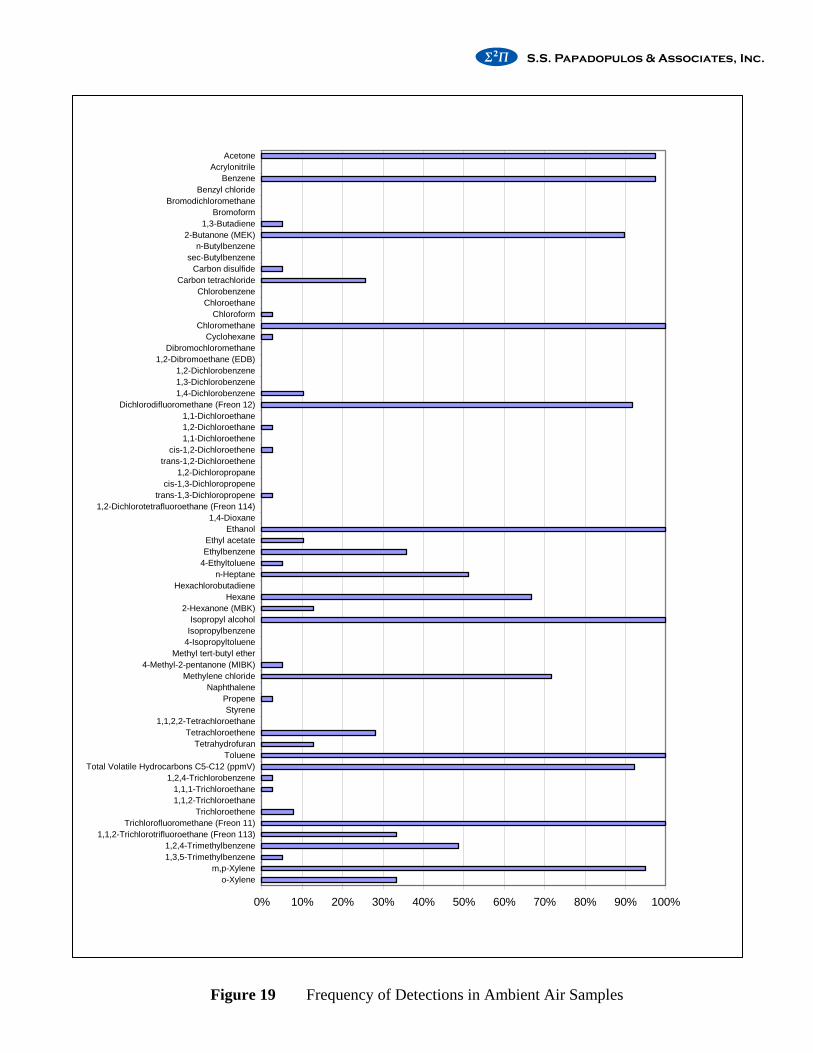
Figure 19 Frequency of Detections in Ambient Air Samples
0% 10% 20% 30% 40% 50% 60% 70% 80% 90% 100%
AcetoneAcrylonitrile
BenzeneBenzyl chloride
BromodichloromethaneBromoform
1,3-Butadiene2-Butanone (MEK)
n-Butylbenzenesec-Butylbenzene
Carbon disulfideCarbon tetrachloride
ChlorobenzeneChloroethane
ChloroformChloromethane
CyclohexaneDibromochloromethane
1,2-Dibromoethane (EDB)1,2-Dichlorobenzene1,3-Dichlorobenzene1,4-Dichlorobenzene
Dichlorodifluoromethane (Freon 12)1,1-Dichloroethane1,2-Dichloroethane1,1-Dichloroethene
cis-1,2-Dichloroethenetrans-1,2-Dichloroethene
1,2-Dichloropropanecis-1,3-Dichloropropene
trans-1,3-Dichloropropene1,2-Dichlorotetrafluoroethane (Freon 114)
1,4-DioxaneEthanol
Ethyl acetateEthylbenzene
4-Ethyltoluenen-Heptane
HexachlorobutadieneHexane
2-Hexanone (MBK)Isopropyl alcohol
Isopropylbenzene4-Isopropyltoluene
Methyl tert-butyl ether4-Methyl-2-pentanone (MIBK)
Methylene chlorideNaphthalene
PropeneStyrene
1,1,2,2-TetrachloroethaneTetrachloroethene
TetrahydrofuranToluene
Total Volatile Hydrocarbons C5-C12 (ppmV)1,2,4-Trichlorobenzene
1,1,1-Trichloroethane1,1,2-Trichloroethane
TrichloroetheneTrichlorofluoromethane (Freon 11)
1,1,2-Trichlorotrifluoroethane (Freon 113)1,2,4-Trimethylbenzene1,3,5-Trimethylbenzene
m,p-Xyleneo-Xylene
������������������ ���������������

Figure 20 Frequency of Detections in Indoor Air Samples
0% 10% 20% 30% 40% 50% 60% 70% 80% 90% 100%
AcetoneAcrylonitrile
BenzeneBenzyl chloride
BromodichloromethaneBromoform
1,3-Butadiene2-Butanone (MEK)
n-Butylbenzenesec-Butylbenzene
Carbon disulfideCarbon tetrachloride
ChlorobenzeneChloroethane
ChloroformChloromethane
CyclohexaneDibromochloromethane
1,2-Dibromoethane (EDB)1,2-Dichlorobenzene1,3-Dichlorobenzene1,4-Dichlorobenzene
Dichlorodifluoromethane (Freon 12)1,1-Dichloroethane1,2-Dichloroethane1,1-Dichloroethene
cis-1,2-Dichloroethenetrans-1,2-Dichloroethene
1,2-Dichloropropanecis-1,3-Dichloropropene
trans-1,3-Dichloropropene1,2-Dichlorotetrafluoroethane (Freon 114)
1,4-DioxaneEthanol
Ethyl acetateEthylbenzene
4-Ethyltoluenen-Heptane
HexachlorobutadieneHexane
2-Hexanone (MBK)Isopropyl alcohol
Isopropylbenzene4-Isopropyltoluene
Methyl tert-butyl ether4-Methyl-2-pentanone (MIBK)
Methylene chlorideNaphthalene
PropeneStyrene
1,1,2,2-TetrachloroethaneTetrachloroethene
TetrahydrofuranToluene
Total Volatile Hydrocarbons C5-C12 (ppmV)1,2,4-Trichlorobenzene
1,1,1-Trichloroethane1,1,2-Trichloroethane
TrichloroetheneTrichlorofluoromethane (Freon 11)
1,1,2-Trichlorotrifluoroethane (Freon 113)1,2,4-Trimethylbenzene1,3,5-Trimethylbenzene
m,p-Xyleneo-Xylene
������������������ ���������������
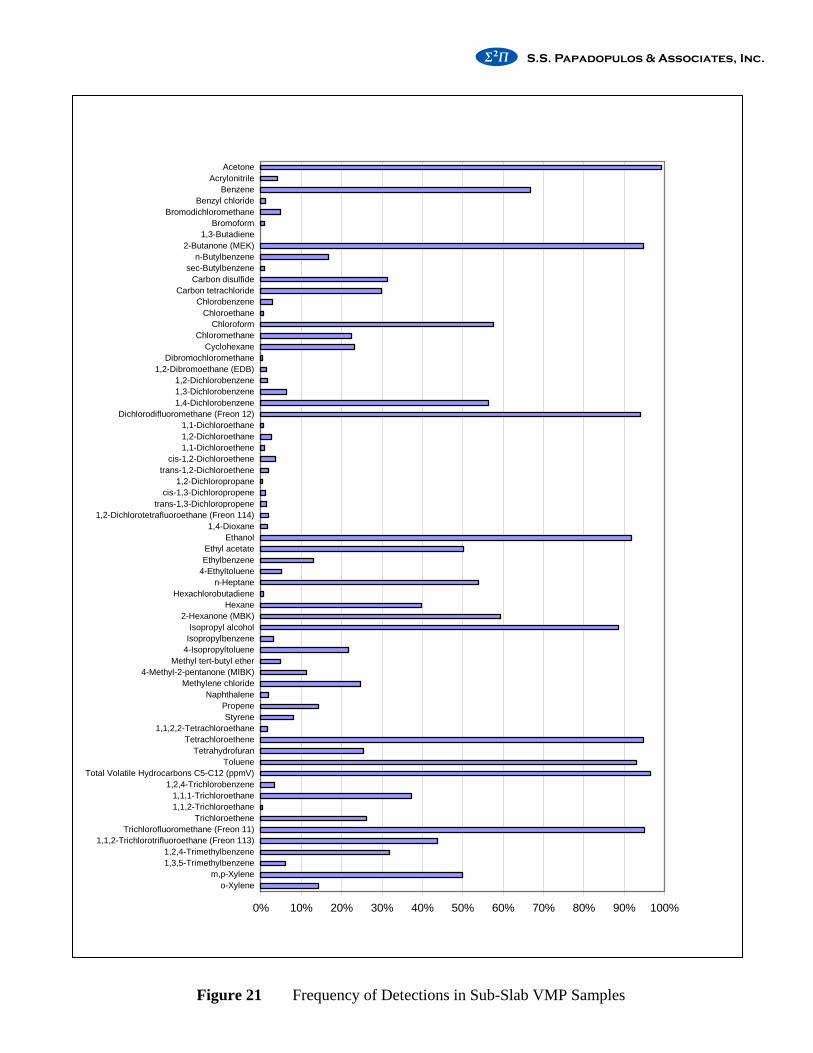
Figure 21 Frequency of Detections in Sub-Slab VMP Samples
0% 10% 20% 30% 40% 50% 60% 70% 80% 90% 100%
AcetoneAcrylonitrile
BenzeneBenzyl chloride
BromodichloromethaneBromoform
1,3-Butadiene2-Butanone (MEK)
n-Butylbenzenesec-Butylbenzene
Carbon disulfideCarbon tetrachloride
ChlorobenzeneChloroethane
ChloroformChloromethane
CyclohexaneDibromochloromethane
1,2-Dibromoethane (EDB)1,2-Dichlorobenzene1,3-Dichlorobenzene1,4-Dichlorobenzene
Dichlorodifluoromethane (Freon 12)1,1-Dichloroethane1,2-Dichloroethane1,1-Dichloroethene
cis-1,2-Dichloroethenetrans-1,2-Dichloroethene
1,2-Dichloropropanecis-1,3-Dichloropropene
trans-1,3-Dichloropropene1,2-Dichlorotetrafluoroethane (Freon 114)
1,4-DioxaneEthanol
Ethyl acetateEthylbenzene
4-Ethyltoluenen-Heptane
HexachlorobutadieneHexane
2-Hexanone (MBK)Isopropyl alcohol
Isopropylbenzene4-Isopropyltoluene
Methyl tert-butyl ether4-Methyl-2-pentanone (MIBK)
Methylene chlorideNaphthalene
PropeneStyrene
1,1,2,2-TetrachloroethaneTetrachloroethene
TetrahydrofuranToluene
Total Volatile Hydrocarbons C5-C12 (ppmV)1,2,4-Trichlorobenzene
1,1,1-Trichloroethane1,1,2-Trichloroethane
TrichloroetheneTrichlorofluoromethane (Freon 11)
1,1,2-Trichlorotrifluoroethane (Freon 113)1,2,4-Trimethylbenzene1,3,5-Trimethylbenzene
m,p-Xyleneo-Xylene
������������������ ���������������
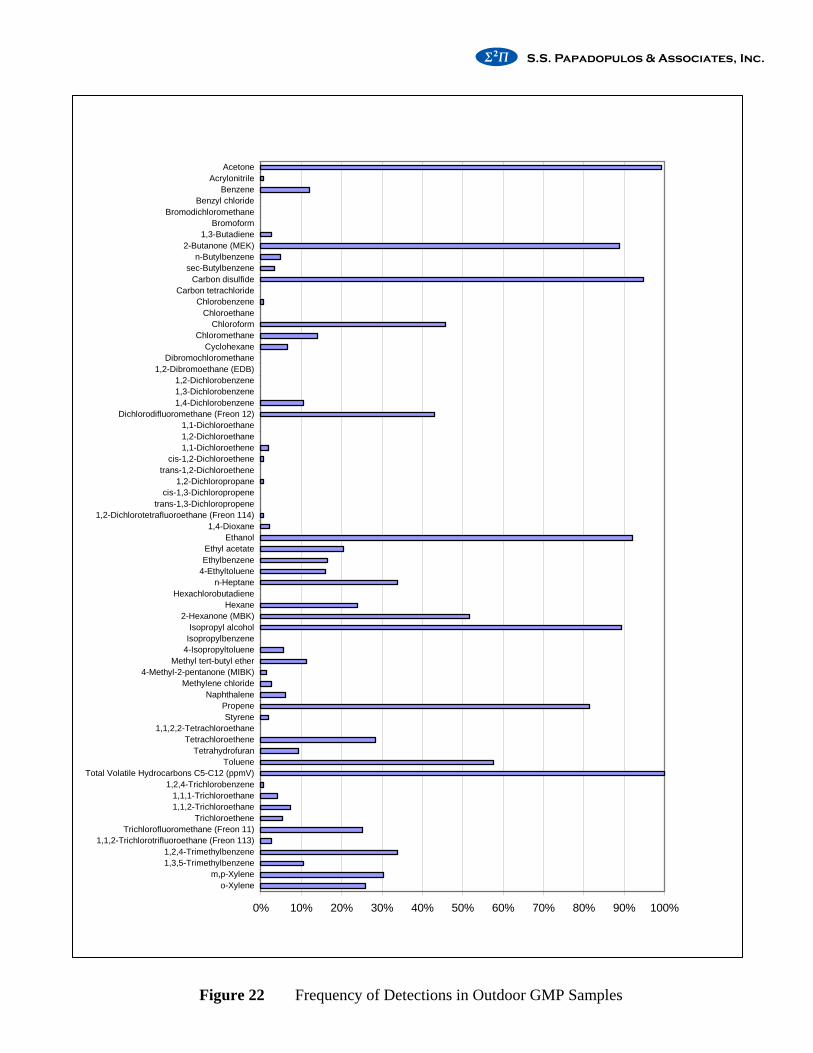
Figure 22 Frequency of Detections in Outdoor GMP Samples
0% 10% 20% 30% 40% 50% 60% 70% 80% 90% 100%
AcetoneAcrylonitrile
BenzeneBenzyl chloride
BromodichloromethaneBromoform
1,3-Butadiene2-Butanone (MEK)
n-Butylbenzenesec-Butylbenzene
Carbon disulfideCarbon tetrachloride
ChlorobenzeneChloroethane
ChloroformChloromethane
CyclohexaneDibromochloromethane
1,2-Dibromoethane (EDB)1,2-Dichlorobenzene1,3-Dichlorobenzene1,4-Dichlorobenzene
Dichlorodifluoromethane (Freon 12)1,1-Dichloroethane1,2-Dichloroethane1,1-Dichloroethene
cis-1,2-Dichloroethenetrans-1,2-Dichloroethene
1,2-Dichloropropanecis-1,3-Dichloropropene
trans-1,3-Dichloropropene1,2-Dichlorotetrafluoroethane (Freon 114)
1,4-DioxaneEthanol
Ethyl acetateEthylbenzene
4-Ethyltoluenen-Heptane
HexachlorobutadieneHexane
2-Hexanone (MBK)Isopropyl alcohol
Isopropylbenzene4-Isopropyltoluene
Methyl tert-butyl ether4-Methyl-2-pentanone (MIBK)
Methylene chlorideNaphthalene
PropeneStyrene
1,1,2,2-TetrachloroethaneTetrachloroethene
TetrahydrofuranToluene
Total Volatile Hydrocarbons C5-C12 (ppmV)1,2,4-Trichlorobenzene
1,1,1-Trichloroethane1,1,2-Trichloroethane
TrichloroetheneTrichlorofluoromethane (Freon 11)
1,1,2-Trichlorotrifluoroethane (Freon 113)1,2,4-Trimethylbenzene1,3,5-Trimethylbenzene
m,p-Xyleneo-Xylene
������������������ ���������������

1
2
282
1<1
<1
<1
<1<1
83<1
<1
0.8 7
<1
<1
<1<1
<1<1 <1<1
<1
<1
<1
MTBE in GroundwaterDetections (ug/l)
Non-Detects
PCE in GroundwaterDetections (ug/l)
Non-Detects
#*#*#*#*#*#*#*#*#*#*#*#*#*#*#*#*#*#*#*#*#*#*#*#*#*#*#*#*#*#*#*#*#*#*#*#*#*#*#*#*#*#*#*#*#*#*#*#*#*#*
#* Soil Sample Discussed in Text
Soil Sample Locations
Soil Samples in Saturated Zone
Groundwater Sample Locations
Figure 23 Locations of Outdoor Vapor Monitoring Ports (GMPs) and Detections of Selected Compounds in Groundwater Samples
������������������ ���������������

Figure 24 Scatter Plots of Concentrations in Duplicate Samples from Spectrum Analytical and Pace Laboratories (for Selected Analytes)
MTBE
0.1
1
10
100
1000
0.1 1 10 100 1000
Pa
ce -
Sec
onda
ry L
ab -
Con
c. (
ug/m
3)
Toluene
0.1
1
10
100
0.1 1 10 100
Pac
e -
Se
cond
ary
Lab
- C
onc
. (u
g/m
3)
Chloroform
0.1
1
10
100
0.1 1 10 100
Pac
e -
Se
cond
ary
Lab
- C
onc
. (u
g/m
3)
Benzene
0.1
1
10
100
0.1 1 10 100
Pa
ce -
Se
con
dary
Lab
- C
onc.
(ug
/m3
)
PCE
0.1
1
10
100
1000
0.1 1 10 100 1000
Pac
e -
Se
cond
ary
Lab
- C
onc
. (u
g/m
3)
Acetone
0.1
1
10
100
1000
10000
0.1 1 10 100 1000 10000
Spectrum - Primary Lab - Conc. (ug/m3)
Pa
ce -
Sec
onda
ry L
ab -
Con
c. (
ug/m
3)
1,4-Dichlorobenzene
0.1
1
10
100
1000
10000
0.1 1 10 100 1000 10000
Spectrum - Primary Lab - Conc. (ug/m3)
Pa
ce -
Sec
onda
ry L
ab -
Con
c. (
ug/m
3)
Total Volatile Hydrocarbons
10
100
1000
10000
10 100 1000 10000
Spectrum - Primary Lab - Conc. (ppbV)
Pac
e -
Se
cond
ary
Lab
- C
onc.
(pp
bV)
All ND Plotted as 0.1 ug/m3
except for TVHTVH units are ppbV,
ND plotted as 10 ppbV
������������������ ���������������

Figure 25 Scatter Plots of Concentrations in Samples from Homes with Pairs of Sub-Slab VMPs (for Selected Analytes)
0.1
1
10
0.1 1 10
Sub
slab
VM
P2
Con
cent
ratio
ns (
ug/m
3)
0.1
1
10
100
0.1 1 10 100
0.1
1
10
100
1000
0.1 1 10 100 1000
Sub
slab
VM
P2
Con
cent
ratio
ns (
ug/m
3)
10
100
1000
10 100 1000
Subslab VMP1 Concentrations (ppbV)
Sub
sla
b V
MP
2 C
onc
entr
atio
ns (
ppbV
)
0.1
1
10
100
1000
0.1 1 10 100 1000
1
10
100
1 10 100
Subslab VMP1 Concentrations (ug/m3)
Sub
slab
VM
P2
Con
cent
ratio
ns (
ug/m
3)
0.1
1
10
100
0.1 1 10 100
Subslab VMP1 Concentrations (ug/m3)
All ND Plotted as 0.1 ug/m3
except for TVHTVH units are ppbV,
ND plotted as 10 ppbV
Benzene Chloroform
PCE Toluene
Acetone Trichlorofluoromethane (Freon 11) Total Volatile Hydrocarbons
������������������ ���������������

Figure 26 Comparison of Detections between Indoor Air and Ambient Air Samples
0% 10% 20% 30% 40% 50% 60% 70% 80% 90% 100%
AcetoneAcrylonitrile
BenzeneBenzyl chloride
BromodichloromethaneBromoform
1,3-Butadiene2-Butanone (MEK)
n-Butylbenzenesec-Butylbenzene
Carbon disulfideCarbon tetrachloride
ChlorobenzeneChloroethane
ChloroformChloromethane
CyclohexaneDibromochloromethane
1,2-Dibromoethane (EDB)1,2-Dichlorobenzene1,3-Dichlorobenzene1,4-Dichlorobenzene
Dichlorodifluoromethane (Freon 12)1,1-Dichloroethane1,2-Dichloroethane1,1-Dichloroethene
cis-1,2-Dichloroethenetrans-1,2-Dichloroethene
1,2-Dichloropropanecis-1,3-Dichloropropene
trans-1,3-Dichloropropene1,2-Dichlorotetrafluoroethane (Freon 114)
1,4-DioxaneEthanol
Ethyl acetateEthylbenzene
4-Ethyltoluenen-Heptane
HexachlorobutadieneHexane
2-Hexanone (MBK)Isopropyl alcohol
Isopropylbenzene4-Isopropyltoluene
Methyl tert-butyl ether4-Methyl-2-pentanone (MIBK)
Methylene chlorideNaphthalene
PropeneStyrene
1,1,2,2-TetrachloroethaneTetrachloroethene
TetrahydrofuranToluene
Total Volatile Hydrocarbons C5-C12 (ppmV)1,2,4-Trichlorobenzene
1,1,1-Trichloroethane1,1,2-Trichloroethane
TrichloroetheneTrichlorofluoromethane (Freon 11)
1,1,2-Trichlorotrifluoroethane (Freon 113)1,2,4-Trimethylbenzene1,3,5-Trimethylbenzene
m,p-Xyleneo-Xylene
Ambient Air
Indoor Air
������������������ ���������������

Figure 27 Comparison of Detections between Indoor Air and Sub-Slab VMP Samples
0% 10% 20% 30% 40% 50% 60% 70% 80% 90% 100%
AcetoneAcrylonitrile
BenzeneBenzyl chloride
BromodichloromethaneBromoform
1,3-Butadiene2-Butanone (MEK)
n-Butylbenzenesec-Butylbenzene
Carbon disulfideCarbon tetrachloride
ChlorobenzeneChloroethane
ChloroformChloromethane
CyclohexaneDibromochloromethane
1,2-Dibromoethane (EDB)1,2-Dichlorobenzene1,3-Dichlorobenzene1,4-Dichlorobenzene
Dichlorodifluoromethane (Freon 12)1,1-Dichloroethane1,2-Dichloroethane1,1-Dichloroethene
cis-1,2-Dichloroethenetrans-1,2-Dichloroethene
1,2-Dichloropropanecis-1,3-Dichloropropene
trans-1,3-Dichloropropene1,2-Dichlorotetrafluoroethane (Freon 114)
1,4-DioxaneEthanol
Ethyl acetateEthylbenzene
4-Ethyltoluenen-Heptane
HexachlorobutadieneHexane
2-Hexanone (MBK)Isopropyl alcohol
Isopropylbenzene4-Isopropyltoluene
Methyl tert-butyl ether4-Methyl-2-pentanone (MIBK)
Methylene chlorideNaphthalene
PropeneStyrene
1,1,2,2-TetrachloroethaneTetrachloroethene
TetrahydrofuranToluene
Total Volatile Hydrocarbons C5-C12 (ppmV)1,2,4-Trichlorobenzene
1,1,1-Trichloroethane1,1,2-Trichloroethane
TrichloroetheneTrichlorofluoromethane (Freon 11)
1,1,2-Trichlorotrifluoroethane (Freon 113)1,2,4-Trimethylbenzene1,3,5-Trimethylbenzene
m,p-Xyleneo-Xylene
Indoor Air
Sub-Slab Vapor
������������������ ���������������

Figure 28 Comparison of Detections between Indoor VMP and Outdoor GMP Samples
0% 10% 20% 30% 40% 50% 60% 70% 80% 90% 100%
AcetoneAcrylonitrile
BenzeneBenzyl chloride
BromodichloromethaneBromoform
1,3-Butadiene2-Butanone (MEK)
n-Butylbenzenesec-Butylbenzene
Carbon disulfideCarbon tetrachloride
ChlorobenzeneChloroethane
ChloroformChloromethane
CyclohexaneDibromochloromethane
1,2-Dibromoethane (EDB)1,2-Dichlorobenzene1,3-Dichlorobenzene1,4-Dichlorobenzene
Dichlorodifluoromethane (Freon 12)1,1-Dichloroethane1,2-Dichloroethane1,1-Dichloroethene
cis-1,2-Dichloroethenetrans-1,2-Dichloroethene
1,2-Dichloropropanecis-1,3-Dichloropropene
trans-1,3-Dichloropropene1,2-Dichlorotetrafluoroethane (Freon 114)
1,4-DioxaneEthanol
Ethyl acetateEthylbenzene
4-Ethyltoluenen-Heptane
HexachlorobutadieneHexane
2-Hexanone (MBK)Isopropyl alcohol
Isopropylbenzene4-Isopropyltoluene
Methyl tert-butyl ether4-Methyl-2-pentanone (MIBK)
Methylene chlorideNaphthalene
PropeneStyrene
1,1,2,2-TetrachloroethaneTetrachloroethene
TetrahydrofuranToluene
Total Volatile Hydrocarbons C5-C12 (ppmV)1,2,4-Trichlorobenzene
1,1,1-Trichloroethane1,1,2-Trichloroethane
TrichloroetheneTrichlorofluoromethane (Freon 11)
1,1,2-Trichlorotrifluoroethane (Freon 113)1,2,4-Trimethylbenzene1,3,5-Trimethylbenzene
m,p-Xyleneo-Xylene
Sub-Slab Vapor
Outdoor GMP
������������������ ���������������

0.01
0.1
1
10
100
1000
10000
Co
nce
ntra
tion
(u
g/m
3)
AO
AIN
AV
MP
GM
P
AO
AIN
AV
MP
GM
P
AO
AIN
AV
MP
GM
P
AO
AIN
AV
MP
GM
P
AO
AIN
AV
MP
GM
P
AO
AIN
AV
MP
GM
P
AO
AIN
AV
MP
GM
P
AO
AIN
AV
MP
GM
P
AO
AIN
AV
MP
GM
P
AO
AIN
AV
MP
GM
P
AO
AIN
AV
MP
GM
P
AO
AIN
AV
MP
GM
P
Benzene
Toluene
Ethyl-benzene
m,p-Xylenes
o-Xylene
Naphthalene
MTBE 1,2,4-TMB
1,3,5-TMB
Cyclo-hexane
Hexane
n-Heptane
Figure 29 Box-Whisker Plot Summarizing Detections of Selected Petroleum-Related Compounds in Vapor Samples
������������������ ���������������

0.1
1
10
100
1000
10000
Co
nce
ntra
tion
(u
g/m
3)
AO
A
INA
VM
P
GM
P
AO
A
INA
VM
P
GM
P
AO
A
INA
VM
P
GM
P
AO
A
INA
VM
P
GM
P
AO
A
INA
VM
P
GM
P
AO
A
INA
VM
P
GM
P
PCE
TCE
111-TCA
Chloroform
Chloromethane
1,4-DCB
Figure 30 Box-Whisker Plot Summarizing Detections of Selected Chlorinated Compounds in Vapor Samples
������������������ ���������������
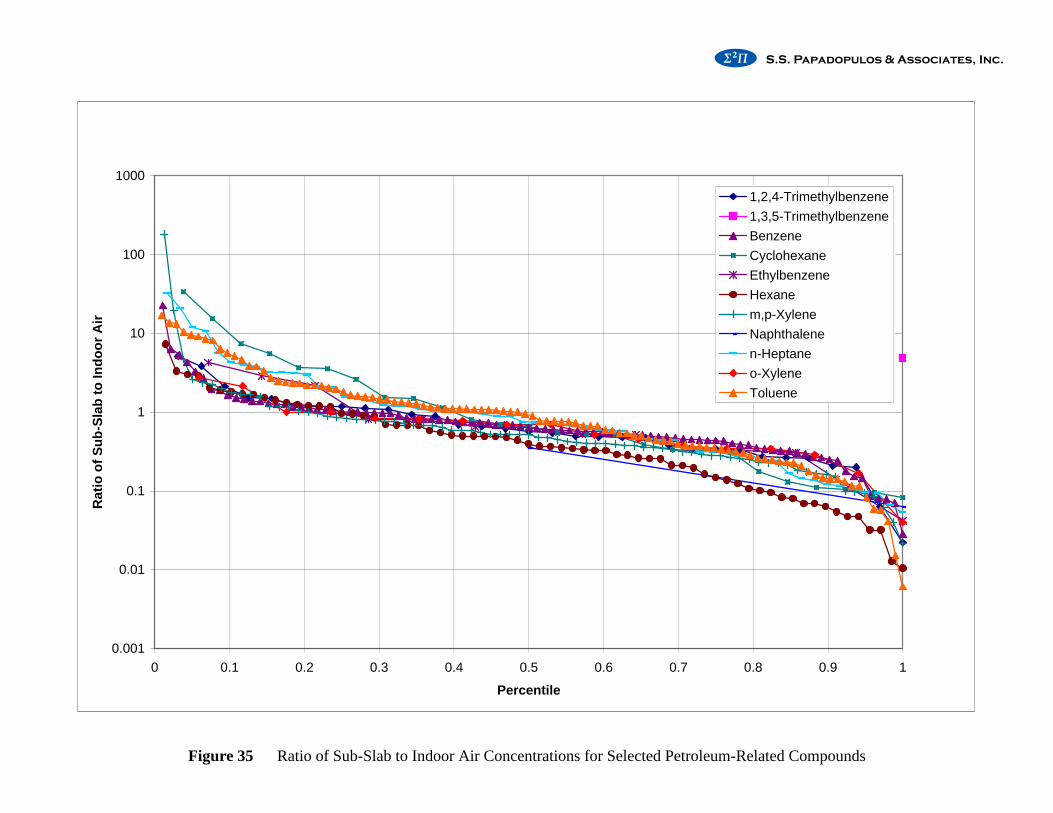
������������������ ���������������
Figure 35 Ratio of Sub-Slab to Indoor Air Concentrations for Selected Petroleum-Related Compounds
0.001
0.01
0.1
1
10
100
1000
0 0.1 0.2 0.3 0.4 0.5 0.6 0.7 0.8 0.9 1
Percentile
Rat
io o
f S
ub
-Sla
b t
o In
do
or
Air
1,2,4-Trimethylbenzene
1,3,5-Trimethylbenzene
Benzene
Cyclohexane
Ethylbenzene
Hexane
m,p-Xylene
Naphthalene
n-Heptane
o-Xylene
Toluene

������������������ ���������������
Figure 36 Ratio of Sub-Slab to Indoor Air Concentrations for Selected Chlorinated Compounds
0.001
0.01
0.1
1
10
100
1000
0 0.1 0.2 0.3 0.4 0.5 0.6 0.7 0.8 0.9 1
Percentile
Rat
io o
f S
ub
-sla
b t
o In
do
or
Air
1,1,1-Trichloroethane
1,4-Dichlorobenzene
Chloroform
Chloromethane
Tetrachloroethene
Trichloroethene

TABLES

TABLE 1 Summary of Vapor Sampling Conducted by Chevron, USEPA , and the District of Columbia Department of Health (DOH)
Subsurface Vapor Samples
AnalyteNumber
of Samples
Earliest Sample
Date
Latest Sample
Date
Minimum Result
(ug/m3)
Maximum Result
(ug/m3)
Benzene 216 Jan-02 Jun-05 1.4 160Toluene 214 Jan-02 Jun-05 1.7 1100
Ethylbenzene 216 Jan-02 Jun-05 < 1.8 91Xylenes-m,p 59 Jul-03 Jun-04 < 1.9 71
Xylene-o 59 Jul-03 Jun-04 < 1.8 28MTBE 216 Jan-02 Jun-05 < 3.6 2300PCE 35 Jul-03 Apr-04 < 6.8 2101.8
Sources: Gannett Fleming Inc. (2003b, 2004, 2006), US Environmental Protection Agency (2003a)
Indoor Basement Air Samples, Excluding DOH Studies
AnalyteNumber
of Samples
Earliest Sample
Date
Latest Sample
Date
Minimum Result
(ug/m3)
Maximum Result
(ug/m3)
Benzene 94 Jul-03 Jun-05 < 0.4 13Toluene 94 Jul-03 Jun-05 1.3 42
Ethylbenzene 94 Jul-03 Jun-05 < 0.61 26Xylenes-m,p 94 Jul-03 Jun-05 0.76 84
Xylene-o 82 Jul-03 Jun-05 0.7 22MTBE 94 Jul-03 Jun-05 < 0.39 25.0PCE 48 Apr-04 Jun-05 < 0.97 23.1
Sources: District of Columbia, Department of Health, pers. comm. (2008), Gannett Fleming (2005, 2006)
US Environmental Protection Agency (2004a)
Indoor Basement Air Samples, BSEA (2006) Study for DOH
AnalyteNumber
of Samples
Earliest Sample
Date
Latest Sample
Date
Minimum Result
(ug/m3)
Maximum Result
(ug/m3)
Benzene 97 Jun-06 Aug-06 < 0.11 26.8 JToluene 97 Jun-06 Aug-06 < 0.17 155.0
Ethylbenzene 97 Jun-06 Aug-06 < 0.18 79.9Xylenes-m,p 97 Jun-06 Aug-06 < 0.52 196.9
Xylene-o 97 Jun-06 Aug-06 < 0.25 75.3MTBE 97 Jun-06 Aug-06 < 0.26 63.5PCE 97 Jun-06 Aug-06 1.3 J 38.9
Sources: Building Sciences and Engineering Associates Ltd. (2006)
Indoor Air Samples, DOH Winter 2007
AnalyteNumber
of Samples
Earliest Sample
Date
Latest Sample
Date
Minimum Result
(ug/m3)
Maximum Result
(ug/m3)
Benzene 12 Mar-07 Mar-07 1.8 6.6Toluene 12 Mar-07 Mar-07 2.7 31.4
Ethylbenzene 12 Mar-07 Mar-07 BRL 5.3Xylenes-m,p 12 Mar-07 Mar-07 BRL 18.6
Xylene-o 12 Mar-07 Mar-07 --- ---MTBE 12 Mar-07 Mar-07 BRL 34.6PCE 12 Mar-07 Mar-07 BRL 3.3
Sources: District of Columbia, Department of Health, pers. comm. (2008)
������������������ ���������������

TABLE 2 Detections of Organic Compounds in Groundwater Reported to the District of Columbia Department of Environment (DDOE) by Chevron
AnalyteEarliest
DetectionReported
Most RecentDetection Reported
Number ofDetectionsReported
Maximum Detection
(ug/l)
1 Acetone Sep-08 Sep-08 16 5,5002 Benzene Nov-89 Oct-08 1272 51,0003 sec-Butylbenzene Sep-08 Oct-08 5 9.74 Carbon Disulfide Sep-08 Sep-08 2 1.75 Chloroform Sep-08 Oct-08 9 1.76 cis-1,2-Dichloroethene Sep-01 Oct-08 117 607 trans-1,2-Dichloroethene Sep-01 May-02 3 28 Ethylbenzene Nov-89 Oct-08 861 31,0009 Isopropylbenzene Sep-08 Oct-08 13 11010 Methane May-04 Jun-05 19 5,12011 Naphthalene Sep-08 Oct-08 22 1,40012 n-Propylbenzene Sep-08 Oct-08 16 40013 Methyl-t-butyl ether Dec-92 Oct-08 1981 148,00014 Tetrachloroethene Sep-01 Oct-08 1053 14,80015 Toluene Nov-89 Oct-08 954 141,00016 Trichloroethene (Trichloroethylene) Nov-01 Oct-08 178 60.517 1,2,4-Trimethylbenzene Sep-08 Oct-08 29 3,70018 1,3,5-Trimethylbenzene Mar-08 Oct-08 26 1,40019 Vinyl chloride (Chloroethene) May-02 Sep-08 2 3.420 m,p-Xylene Sep-08 Oct-08 26 9,50021 o-Xylene Jan-02 Oct-08 105 4,70022 Xylenes, Total Nov-89 Apr-08 1032 114,00023 TPH - Diesel Range Organics Mar-07 Mar-07 1 8,70024 TPH - Gasoline Range Organics Sep-01 Oct-08 733 294,00025 TPH - Oil Range Organics (>C20-C28) Mar-07 Mar-07 1 160
������������������ ���������������

TABLE 3 List of Vapor Samples Collected During This Study(in Chronological Order)
Quarter Week SampDateHome
IDSample Name
Sampling Observation
Quarter Week SampDateHome
IDSample Name
Sampling Observation
1 Q1 2 01/24/08 S79 Q1-S79-VMP2 349 Q2 19 05/21/08 S234 Q2-S234-GMPR2 Q1 2 01/24/08 S79 Q1-S79-AOA 350 Q2 19 05/21/08 S56 Q2-S56-GMPR3 Q1 2 01/24/08 S79 Q1-S79-INA 351 Q2 19 05/21/08 S56 Q2-S56-AOA4 Q1 2 01/24/08 S79 Q1-S79-VMP1 352 Q2 19 05/21/08 S56 Q2-S56-INA Home renovated in Spring (Feb-April)5 Q1 2 01/24/08 S148 Q1-S148-VMP 353 Q2 19 05/22/08 S33 Q2-S33-GMPR6 Q1 2 01/24/08 S148 Q1-S148-INA 354 Q2 19 05/23/08 S33 Q2-S33-VMP7 Q1 2 01/24/08 S313 Q1-S313-VMP 355 Q2 19 05/23/08 S33 Q2-S33-PVMP8 Q1 2 01/24/08 S313 Q1-S313-INA 356 Q2 19 05/23/08 S107 Q2-S107-GMPR9 Q1 2 01/24/08 S27 Q1-S27-VMP2 357 Q2 19 05/23/08 S287 Q2-S287-GMPR10 Q1 2 01/24/08 S27 Q1-S27-INA 358 Q2 19 05/23/08 S144 Q2-S144-GMP11 Q1 2 01/24/08 S27 Q1-S27-VMP1 359 Q2 19 05/23/08 S287 Q2-S287-VMP12 Q1 2 01/24/08 S220 Q1-S220-AOA 360 Q2 19 05/23/08 S344 Q2-S344-VMP13 Q1 2 01/24/08 S220 Q1-S220-INA 361 Q2 19 05/23/08 S199 Q2-S199-GMPR14 Q1 2 01/24/08 S220 Q1-S220-VMP 362 Q2 19 05/23/08 S240 Q2-S240-GMPR15 Q1 2 01/24/08 S176 Q1-S176-INA Can of gasoline removed from basement 363 Q2 19 05/23/08 S240 Q2-S240-VMP116 Q1 2 01/24/08 S176 Q1-S176-VMP1 364 Q2 19 05/23/08 S240 Q2-S240-VMP217 Q1 2 01/24/08 S176 Q1-S176-VMP2 365 Q2 20 05/28/08 S37 Q2-S37-VMP18 Q1 3 01/30/08 S311 Q1-S311-AOA 366 Q2 20 05/28/08 S37 Q2-S37-GMPR19 Q1 3 01/30/08 S311 Q1-S311-INA 367 Q2 20 05/28/08 S362 Q2-S362-VMP20 Q1 3 01/30/08 S311 Q1-S311-VMP 368 Q2 20 05/28/08 S360 Q2-S360-VMP21 Q1 3 01/30/08 S315 Q1-S315-INA 369 Q2 20 05/28/08 S354 Q2-S354-VMP22 Q1 3 01/30/08 S315 Q1-S315-VMP Broken brace on cannister 370 Q2 20 05/28/08 S354 Q2-S354-GMPR Purged 1 liter23 Q1 3 01/30/08 S373 Q1-S373-INA Missed some mothballs in closet during home survey 371 Q2 20 05/28/08 S294 Q2-S294-VMP24 Q1 3 01/30/08 S373 Q1-S373-VMP 372 Q2 20 05/28/08 S54 Q2-S54-VMP25 Q1 3 01/30/08 S309 Q1-S309-INA 373 Q2 20 05/28/08 S54 Q2-S54-GMPR126 Q1 3 01/30/08 S194 Q1-S194-INA 374 Q2 20 05/28/08 S54 Q2-S54-GMPR2 Purged 1 liter27 Q1 3 01/30/08 S194 Q1-S194-VMP 375 Q2 20 05/28/08 S294 Q2-S294-GMPR128 Q1 3 01/30/08 S4 Q1-S4-INA 376 Q2 20 05/28/08 S294 Q2-S294-GMPR2 Purged 1 liter29 Q1 3 01/30/08 S4 Q1-S4-VMP 377 Q2 20 05/28/08 S278 Q2-S278-GMPR130 Q1 3 01/30/08 S167 Q1-S167-INA 378 Q2 20 05/28/08 S278 Q2-S278-GMPR2 Purged 1 liter31 Q1 3 01/30/08 S167 Q1-S167-AOA 379 Q2 20 05/28/08 S122 Q2-S122-VMP32 Q1 3 01/30/08 S73 Q1-S73-INA Missed some mothballs in basement closet 380 Q2 20 05/28/08 S278 Q2-S278-PVMP133 Q1 3 01/30/08 S73 Q1-S73-VMP1 381 Q2 20 05/28/08 S278 Q2-S278-PVMP234 Q1 3 01/30/08 S73 Q1-S73-VMP2 382 Q2 20 05/28/08 S278 Q2-S278-VMP35 Q1 3 02/01/08 S269 Q1-S269-INA 383 Q2 20 05/29/08 S13 Q2-S13-GMPR Purged 1 liter36 Q1 3 02/01/08 S269 Q1-S269-VMP 384 Q2 20 05/29/08 S362 Q2-S362-GMPR37 Q1 3 02/01/08 S23 Q1-S23-VMP1 385 Q2 20 05/30/08 S393 Q2-S393-GMPR38 Q1 3 02/01/08 S23 Q1-S23-VMP2 386 Q2 20 05/30/08 S339 Q2-S339-GMPR39 Q1 3 02/01/08 S367 Q1-S367-INA 387 Q2 20 05/30/08 S373 Q2-S373-GMPR40 Q1 3 02/01/08 S367 Q1-S367-VMP 388 Q2 20 05/30/08 S134 Q2-S134-GMPR141 Q1 3 02/01/08 S258 Q1-S258-VMP 389 Q2 20 05/30/08 S134 Q2-S134-GMPR242 Q1 3 02/01/08 S258 Q1-S258-PVMP 390 Q2 20 05/30/08 S311 Q2-S311-GMPR Purged 1 liter43 Q1 3 02/01/08 S258 Q1-S258-INA 391 Q2 20 05/30/08 S79 Q2-S79-GMPR44 Q1 3 02/01/08 S326 Q1-S326-INA 392 Q2 20 05/30/08 S360 Q2-S360-GMPR45 Q1 3 02/01/08 S326 Q1-S326-VMP 393 Q2 20 05/30/08 S21 Q2-S21-GMPR146 Q1 3 02/01/08 S30 Q1-S30-INA 394 Q2 20 05/30/08 S21 Q2-S21-GMPR2 Purged 1 liter47 Q1 3 02/01/08 S30 Q1-S30-PVMP 395 Q2 20 05/30/08 S30 Q2-S30-GMPR148 Q1 3 02/01/08 S30 Q1-S30-VMP 396 Q2 20 05/30/08 S214 Q2-S214-GMPR149 Q1 3 02/01/08 S312 Q1-S312-INA 397 Q2 20 05/30/08 S214 Q2-S214-GMPR250 Q1 3 02/01/08 S312 Q1-S312-VMP 398 Q2 20 05/30/08 S220 Q2-S220-GMPR51 Q1 4 02/06/08 S214 Q1-S214-VMP Line not purged before sampling 399 Q2 21 06/04/08 S289 Q2-S289-VMP Basement has strong smell of mothballs52 Q1 4 02/06/08 S214 Q1-S214-INA 400 Q2 21 06/04/08 S194 Q2-S194-INA53 Q1 4 02/06/08 S7 Q1-S7-INA 401 Q2 21 06/04/08 S322 Q2-S322-VMP154 Q1 4 02/06/08 S7 Q1-S7-VMP 402 Q2 21 06/04/08 S322 Q2-S322-PVMP55 Q1 4 02/06/08 S7 Q1-S7-AOA 403 Q2 21 06/04/08 S322 Q2-S322-INA56 Q1 4 02/06/08 S183 Q1-S183-VMP1 404 Q2 21 06/04/08 S237 Q2-S237-VMP257 Q1 4 02/06/08 S183 Q1-S183-VMP2 405 Q2 21 06/04/08 S237 Q2-S237-VMP158 Q1 4 02/06/08 S183 Q1-S183-INA 406 Q2 21 06/04/08 S269 Q2-S269-GMPR
59 Q1 4 02/06/08 S23 Q1-S23-INANo indoor air sample collected during first visit- sample collected week of
2/4/08 407 Q2 21 06/04/08 S194 Q2-S194-GMPR60 Q1 4 02/06/08 S21 Q1-S21-INA 408 Q2 21 06/04/08 S322 Q2-S322-VMP261 Q1 4 02/06/08 S21 Q1-S21-VMP1 409 Q2 21 06/04/08 S289 Q2-S289-GMPR Slow draw rate on canister
Page 1 of 6
������������������ ���������������

TABLE 3 List of Vapor Samples Collected During This Study(in Chronological Order)
Quarter Week SampDateHome
IDSample Name
Sampling Observation
Quarter Week SampDateHome
IDSample Name
Sampling Observation
62 Q1 4 02/06/08 S21 Q1-S21-VMP2 410 Q2 21 06/04/08 S301 Q2-S301-GMPR63 Q1 4 02/06/08 S301 Q1-S301-INA 411 Q2 21 06/04/08 S269 Q2-S269-VMP64 Q1 4 02/06/08 S199 Q1-S199-INA 412 Q2 21 06/04/08 S269 Q2-S269-INA65 Q1 4 02/06/08 S199 Q1-S199-VMP 413 Q2 21 06/04/08 S70 Q2-S70-GMPR66 Q1 4 02/06/08 S393 Q1-S393-INA 414 Q2 21 06/04/08 S73 Q2-S73-AOA67 Q1 4 02/07/08 S199 Q1-S199-AOA 415 Q2 21 06/04/08 S73 Q2-S73-INA68 Q1 4 02/08/08 S245 Q1-S245-VMP 416 Q2 21 06/05/08 S30 Q2-S30-GMPR2 Slow draw rate on canister; left for 24 hours69 Q1 4 02/08/08 S245 Q1-S245-INA 417 Q2 22 06/11/08 S267 Q2-S267-VMP70 Q1 4 02/08/08 S245 Q1-S245-AOA 418 Q2 22 06/11/08 S254 Q2-S254-VMP71 Q1 4 02/08/08 S339 Q1-S339-VMP1 419 Q2 22 06/11/08 S48 Q2-S48-GMP Slow regulator, left more than 24 hours72 Q1 4 02/08/08 S339 Q1-S339-VMP2 420 Q2 22 06/11/08 S23 Q2-S23-VMP173 Q1 4 02/08/08 S339 Q1-S339-INA 421 Q2 22 06/11/08 S23 Q2-S23-VMP274 Q1 4 02/08/08 S88 Q1-S88-INA 422 Q2 22 06/11/08 S52 Q2-S52-INA Roof repaired in May75 Q1 4 02/08/08 S13 Q1-S13-VMP 423 Q2 22 06/11/08 S52 Q2-S52-VMP
76 Q1 4 02/08/08 S13 Q1-S13-INA Gas lawnmower in basement, moved outside and locked up for testing 424 Q2 22 06/11/08 S313 Q2-S313-VMP77 Q1 4 02/08/08 S240 Q1-S240-AOA 425 Q2 22 06/11/08 S313 Q2-S313-INA78 Q1 4 02/08/08 S240 Q1-S240-VMP1 426 Q2 22 06/11/08 S313 Q2-S313-AOA79 Q1 4 02/08/08 S240 Q1-S240-INA 427 Q2 22 06/11/08 S313 Q2-S313-GMPR80 Q1 4 02/08/08 S392 Q1-S392-VMP 428 Q2 22 06/11/08 S326 Q2-S326-GMPR81 Q1 4 02/08/08 S392 Q1-S392-INA 429 Q2 22 06/11/08 S326 Q2-S326-VMP_R82 Q1 4 02/08/08 S229 Q1-S229-INA 430 Q2 22 06/11/08 S326 Q2-S326-INA83 Q1 4 02/08/08 S384 Q1-S384-INA 431 Q2 22 06/11/08 S176 Q2-S176-VMP284 Q1 4 02/09/08 S229 Q1-S229-VMP Slow regulator - > 24 hours 432 Q2 22 06/11/08 S176 Q2-S176-INA85 Q1 4 02/09/08 S88 Q1-S88-VMP Slow regulator - > 24 hours 433 Q2 22 06/11/08 S176 Q2-S176-VMP186 Q1 5 02/13/08 S57 Q1-S57-VMP1 434 Q2 22 06/11/08 S176 Q2-S176-GMPR187 Q1 5 02/13/08 S57 Q1-S57-VMP2 435 Q2 22 06/11/08 S176 Q2-S176-GMPR288 Q1 5 02/13/08 S57 Q1-S57-INA 436 Q2 22 06/11/08 S176 Q2-S176-GMPR3 Purged 1 liter89 Q1 5 02/13/08 S59 Q1-S59-VMP 437 Q2 22 06/12/08 S7 Q2-S7-GMPR Purged 1 liter90 Q1 5 02/13/08 S59 Q1-S59-INA 438 Q2 22 06/12/08 S167 Q2-S167-GMPR Purged 1 liter91 Q1 5 02/13/08 S48 Q1-S48-INA 439 Q2 22 06/12/08 S384 Q2-S384-GMPR Purged 1 liter92 Q1 5 02/13/08 S48 Q1-S48-VMP 440 Q2 22 06/12/08 S381 Q2-S381-GMPR Purged 1 liter93 Q1 5 02/13/08 S380 Q1-S380-VMP 441 Q2 22 06/12/08 S309 Q2-S309-GMPR94 Q1 5 02/13/08 S380 Q1-S380-INA 442 Q2 22 06/13/08 S121 Q2-S121-VMP
95 Q1 5 02/13/08 S240 Q1-S240-VMP2 VMP2 not sampled during first visit - sampled following week (2/12/08) 443 Q2 22 06/13/08 S239 Q2-S239-VMP96 Q1 5 02/13/08 S305 Q1-S305-VMP Some water vapor in VMP tubing 444 Q2 22 06/13/08 S395 Q2-S395-GMP97 Q1 5 02/13/08 S305 Q1-S305-INA Unidentified odor in basement 445 Q2 22 06/13/08 S395 Q2-S395-VMP98 Q1 5 02/13/08 S294 Q1-S294-INA 446 Q2 22 06/13/08 S59 Q2-S59-VMP99 Q1 5 02/13/08 S294 Q1-S294-AOA 447 Q2 22 06/13/08 S120 Q2-S120-VMP100 Q1 5 02/13/08 S294 Q1-S294-VMP 448 Q2 22 06/13/08 S120 Q2-S120-GMPR1101 Q1 5 02/13/08 S354 Q1-S354-VMP 449 Q2 22 06/13/08 S120 Q2-S120-GMPR2102 Q1 5 02/13/08 S354 Q1-S354-INA 450 Q2 22 06/13/08 S45 Q2-S45-VMP
103 Q1 5 02/13/08 S241 Q1-S241-INA 451 Q2 22 06/13/08 S239 Q2-S239-GMPRPurged 1 liter; rainbow colors in tedlar bag from purging; sample was
slow to fill canister104 Q1 5 02/13/08 S241 Q1-S241-VMP1 452 Q2 23 06/18/08 S72 Q2-S72-VMP105 Q1 5 02/13/08 S241 Q1-S241-VMP2 453 Q2 23 06/18/08 S17 Q2-S17-VMP Home renovations ongoing on 1st floor; hairdressing in basement106 Q1 5 02/13/08 S241 Q1-S241-AOA 454 Q2 23 06/18/08 S140 Q2-S140-VMP107 Q1 5 02/15/08 S234 Q1-S234-INA 455 Q2 23 06/18/08 S394 Q2-S394-VMP1108 Q1 5 02/15/08 S234 Q1-S234-VMP 456 Q2 23 06/18/08 S394 Q2-S394-VMP2109 Q1 5 02/15/08 S41 Q1-S41-INA 457 Q2 23 06/18/08 S4 Q2-S4-VMP110 Q1 5 02/15/08 S41 Q1-S41-VMP 458 Q2 23 06/19/08 S293 Q2-S293-GMP111 Q1 5 02/15/08 S41 Q1-S41-AOA 459 Q2 23 06/19/08 S254 Q2-S254-GMPR112 Q1 5 02/15/08 S144 Q1-S144-VMP Slow regulator - > 24 hours 460 Q2 23 06/20/08 S416 Q2-S416-VMP113 Q1 5 02/15/08 S225 Q1-S225-INA 461 Q2 23 06/20/08 S347 Q2-S347-VMP1114 Q1 5 02/15/08 S225 Q1-S225-VMP 462 Q2 23 06/20/08 S347 Q2-S347-VMP2115 Q1 5 02/15/08 S200 Q1-S200-VMP1 463 Q2 23 06/20/08 S347 Q2-S347-GMPR2 Purged 1 liter116 Q1 5 02/15/08 S200 Q1-S200-VMP2 464 Q2 23 06/20/08 S96 Q2-S96-VMP117 Q1 5 02/15/08 S347 Q1-S347-INA Slow regulator - > 24 hours 465 Q2 23 06/20/08 S96 Q2-S96-GMP118 Q1 5 02/15/08 S144 Q1-S144-INA 466 Q2 23 06/20/08 S390 Q2-S390-GMPR119 Q1 5 02/15/08 S239 Q1-S239-INA Mot home for appointment, week of 2/4/08; obtained week of 2/13 467 Q2 23 06/20/08 S390 Q2-S390-VMP120 Q1 5 02/15/08 S239 Q1-S239-VMP 468 Q2 23 06/20/08 S250 Q2-S250-VMP1
Page 2 of 6
������������������ ���������������

TABLE 3 List of Vapor Samples Collected During This Study(in Chronological Order)
Quarter Week SampDateHome
IDSample Name
Sampling Observation
Quarter Week SampDateHome
IDSample Name
Sampling Observation
121 Q1 5 02/15/08 S347 Q1-S347-VMP1 Slow regulator - > 24 hours 469 Q2 23 06/20/08 S250 Q2-S250-VMP2122 Q1 5 02/15/08 S347 Q1-S347-VMP2 Slow regulator - > 24 hours 470 Q2 23 06/20/08 S296 Q2-S296-GMP123 Q1 5 02/15/08 S347 Q1-S347-AOA 471 Q2 23 06/20/08 S296 Q2-S296-VMP124 Q1 6 02/20/08 S200 Q1-S200-INA 472 Q2 24 06/25/08 S257 Q2-S257-VMP125 Q1 6 02/21/08 S36 Q1-S36-INA 473 Q2 24 06/25/08 S416 Q2-S416-GMPR126 Q1 6 02/21/08 S36 Q1-S36-VMP 474 Q2 24 06/25/08 S257 Q2-S257-GMPR Purged 1 liter127 Q1 6 02/21/08 S134 Q1-S134-VMP2 Difficulty purging VMP2, dust filled 2 hand pumps 475 Q2 24 06/25/08 S130 Q2-S130-VMP1128 Q1 6 02/21/08 S134 Q1-S134-VMP1 476 Q2 24 06/25/08 S130 Q2-S130-VMP2129 Q1 6 02/21/08 S134 Q1-S134-INA 477 Q2 24 06/25/08 S130 Q2-S130-GMPR2 Purged 1 liter130 Q1 6 02/21/08 S322 Q1-S322-INA 478 Q2 24 06/25/08 S132 Q2-S132-VMP131 Q1 6 02/21/08 S322 Q1-S322-PVMP 479 Q2 24 06/25/08 S335 Q2-S335-GMPR132 Q1 6 02/21/08 S254 Q1-S254-INA Faint smell of gas in home when placing cannister 480 Q2 24 06/25/08 S280 Q2-S280-VMPR133 Q1 6 02/21/08 S254 Q1-S254-VMP 481 Q2 24 06/25/08 S347 Q2-S347-GMPR1134 Q1 6 02/21/08 S278 Q1-S278-INA Autmotive equipment in home 482 Q2 24 06/25/08 S325 Q2-S325-AOA135 Q1 6 02/21/08 S278 Q1-S278-VMP 483 Q2 24 06/25/08 S325 Q2-S325-INA136 Q1 6 02/21/08 S278 Q1-S278-PVMP2 484 Q2 24 06/25/08 S325 Q2-S325-VMP137 Q1 6 02/21/08 S278 Q1-S278-PVMP1 485 Q2 24 06/27/08 S335 Q2-S335-VMP Basement flooded on day before sampling138 Q1 6 02/21/08 S37 Q1-S37-INA Slow regulator - > 24 hours 486 Q2 24 06/27/08 S77 Q2-S77-GMP Grab Sample - regulator failed139 Q1 6 02/21/08 S426 Q1-S426-VMP 487 Q2 24 06/27/08 S341 Q2-S341-VMP140 Q1 6 02/21/08 S426 Q1-S426-AOA 488 Q3 27 07/16/08 S36 Q3-S36-VMP141 Q1 6 02/21/08 S426 Q1-S426-INA 489 Q3 27 07/16/08 S312 Q3-S312-VMP142 Q1 6 02/21/08 S360 Q1-S360-AOA 490 Q3 27 07/16/08 S312 Q3-S312-GMPR Purged 1 liter143 Q1 6 02/21/08 S360 Q1-S360-VMP 491 Q3 27 07/16/08 S315 Q3-S315-VMP144 Q1 6 02/21/08 S360 Q1-S360-INA 492 Q3 27 07/16/08 S56 Q3-S56-GMPR
145 Q1 6 02/22/08 S322 Q1-S322-VMP2VMP2-high vacuum left on cannister after 24 hours, left in place > 24
hours 493 Q3 27 07/16/08 S138 Q3-S138-VMP Nail polish remover being used in basement prior to canister installatoin146 Q1 7 02/25/08 S37 Q1-S37-VMP VMP slow to fill; left in place >24 hours 494 Q3 27 07/16/08 S276 Q3-S276-VMP
147 Q1 7 02/27/08 S419 Q1-S419-INASome hobby paints remained in basement in sealed bags due to
homeoner concerns 495 Q3 27 07/16/08 S402 Q3-S402-VMP148 Q1 7 02/27/08 S419 Q1-S419-VMP 496 Q3 27 07/16/08 S241 Q3-S241-VMP1149 Q1 7 02/27/08 S419 Q1-S419-AOA 497 Q3 27 07/16/08 S241 Q3-S241-VMP2150 Q1 7 02/27/08 S130 Q1-S130-VMP1 498 Q3 27 07/18/08 S88 Q3-S88-VMP151 Q1 7 02/27/08 S130 Q1-S130-INA 499 Q3 27 07/18/08 S380 Q3-S380-VMP152 Q1 7 02/27/08 S130 Q1-S130-VMP2 500 Q3 27 07/18/08 S187 Q3-S187-VMP153 Q1 7 02/27/08 S293 Q1-S293-INA 501 Q3 27 07/18/08 S187 Q3-S187-GMPR Purged 1 liter154 Q1 7 02/27/08 S293 Q1-S293-VMP1 502 Q3 27 07/18/08 S41 Q3-S41-VMP155 Q1 7 02/27/08 S69 Q1-S69-VMP 503 Q3 27 07/18/08 S200 Q3-S200-VMP1156 Q1 7 02/27/08 S122 Q1-S122-VMP 504 Q3 27 07/18/08 S200 Q3-S200-VMP2157 Q1 7 02/27/08 S107 Q1-S107-VMP 505 Q3 27 07/18/08 S69 Q3-S69-VMP158 Q1 7 02/27/08 S107 Q1-S107-INA 506 Q3 27 07/18/08 S305 Q3-S305-VMP159 Q1 7 02/27/08 S54 Q1-S54-INA Additional box of mothballs found during sample setup, removed 507 Q3 27 07/18/08 S95 Q3-S95-VMP160 Q1 7 02/27/08 S54 Q1-S54-VMP 508 Q3 28 07/23/08 S57 Q3-S57-VMP1161 Q1 7 02/28/08 S130 Q1-S130-AOA 509 Q3 28 07/23/08 S57 Q3-S57-VMP2162 Q1 7 02/28/08 S293 Q1-S293-VMP2 Difficulty purging VMP2 for 2 full liters 510 Q3 28 07/23/08 S234 Q3-S234-VMP163 Q1 7 02/29/08 S362 Q1-S362-INA 511 Q3 28 07/23/08 S213 Q3-S213-VMP Noted a few drops of wet mud in tubing during purging164 Q1 7 02/29/08 S362 Q1-S362-VMP 512 Q3 28 07/23/08 S426 Q3-S426-VMP165 Q1 7 02/29/08 S362 Q1-S362-AOA 513 Q3 28 07/23/08 S234 Q3-S234-GMPR166 Q1 7 02/29/08 S8 Q1-S8-INA 514 Q3 28 07/23/08 S344 Q3-S344-VMP167 Q1 7 02/29/08 S8 Q1-S8-VMP 515 Q3 28 07/23/08 S107 Q3-S107-VMP168 Q1 7 02/29/08 S8 Q1-S8-AOA 516 Q3 28 07/23/08 S107 Q3-S107-GMPR169 Q1 7 02/29/08 S69 Q1-S69-INA 517 Q3 28 07/23/08 S199 Q3-S199-GMPR170 Q1 7 02/29/08 S237 Q1-S237-INA 518 Q3 28 07/23/08 S144 Q3-S144-GMPR171 Q1 7 02/29/08 S237 Q1-S237-VMP1 519 Q3 28 07/23/08 S199 Q3-S199-VMP172 Q1 7 02/29/08 S237 Q1-S237-VMP2 520 Q3 28 07/25/08 S33 Q3-S33-VMP173 Q1 7 02/29/08 S138 Q1-S138-INA 521 Q3 28 07/25/08 S33 Q3-S33-PVMP174 Q1 7 02/29/08 S138 Q1-S138-VMP 522 Q3 28 07/25/08 S33 Q3-S33-GMPR175 Q1 7 02/29/08 S122 Q1-S122-INA 523 Q3 28 07/25/08 S393 Q3-S393-GMPR176 Q1 7 02/29/08 S70 Q1-S70-INA 524 Q3 28 07/25/08 S75 Q3-S75-VMP177 Q1 7 02/29/08 S322 Q1-S322-VMP1 Slow regulator - > 24 hours 525 Q3 28 07/25/08 S311 Q3-S311-VMP Stairway in basement freshly painted178 Q1 7 02/29/08 S95 Q1-S95-INA 526 Q3 28 07/25/08 S311 Q3-S311-GMPR179 Q1 7 02/29/08 S95 Q1-S95-VMP 527 Q3 28 07/25/08 S183 Q3-S183-VMP1180 Q1 8 03/05/08 S238 Q1-S238-AOA 528 Q3 28 07/25/08 S183 Q3-S183-VMP2
Page 3 of 6
������������������ ���������������
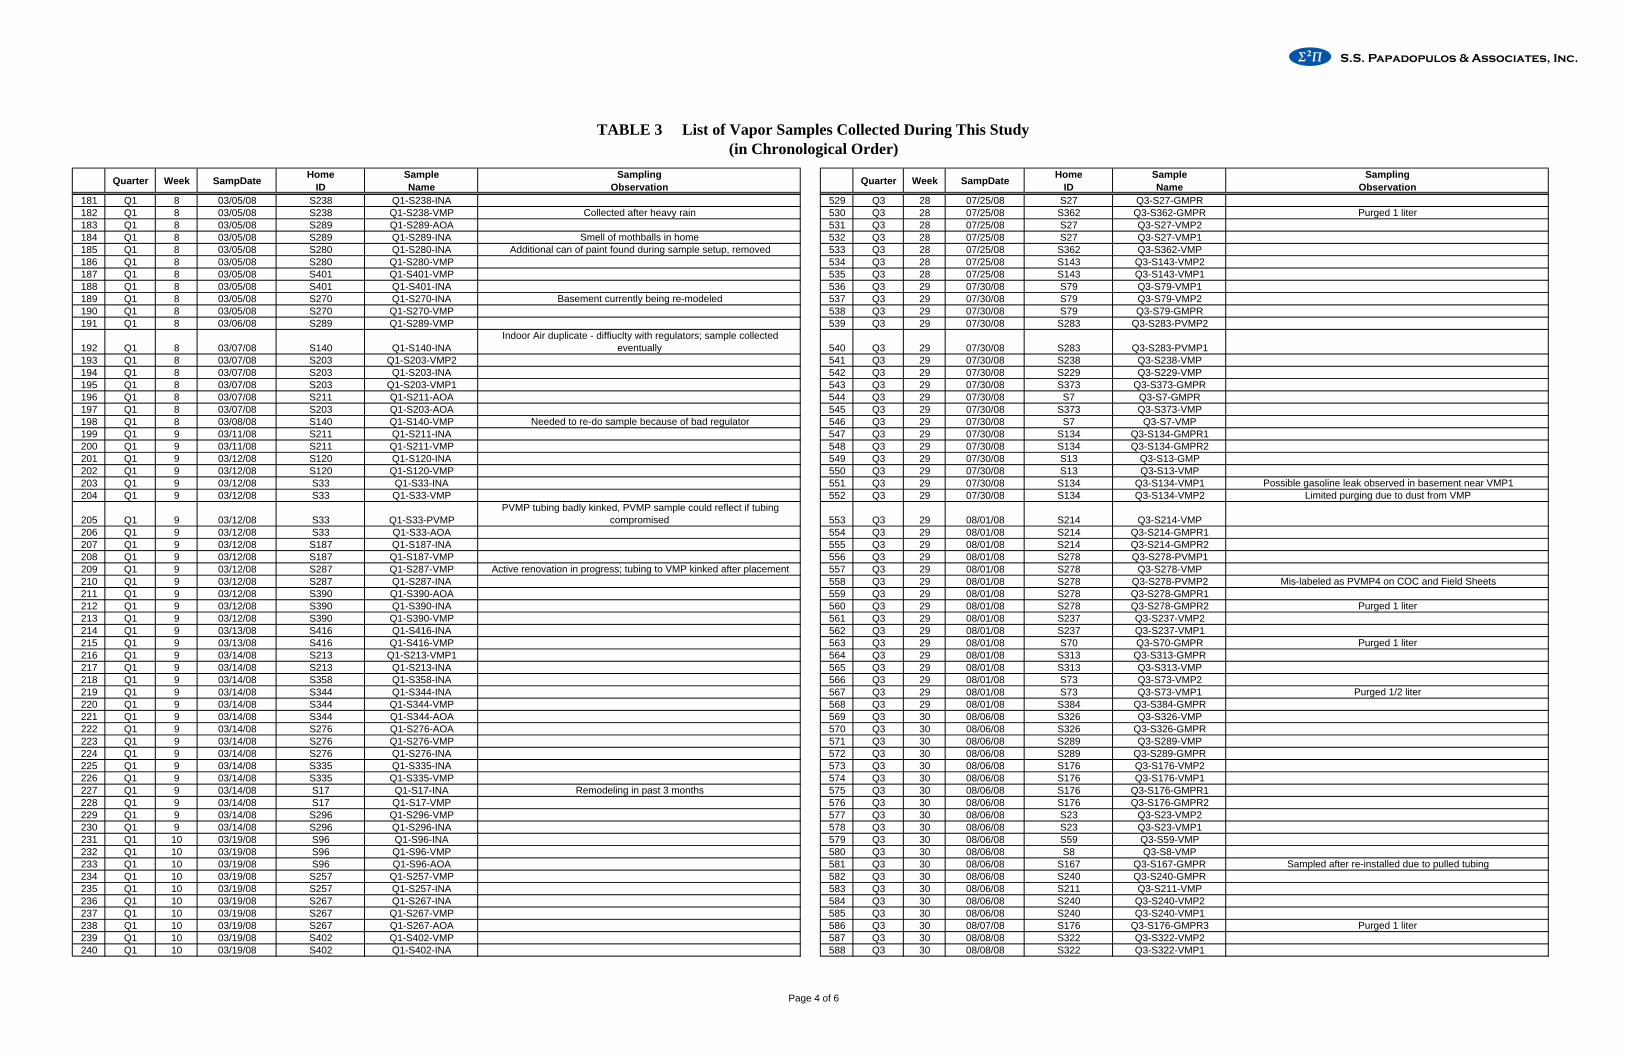
TABLE 3 List of Vapor Samples Collected During This Study(in Chronological Order)
Quarter Week SampDateHome
IDSample Name
Sampling Observation
Quarter Week SampDateHome
IDSample Name
Sampling Observation
181 Q1 8 03/05/08 S238 Q1-S238-INA 529 Q3 28 07/25/08 S27 Q3-S27-GMPR182 Q1 8 03/05/08 S238 Q1-S238-VMP Collected after heavy rain 530 Q3 28 07/25/08 S362 Q3-S362-GMPR Purged 1 liter183 Q1 8 03/05/08 S289 Q1-S289-AOA 531 Q3 28 07/25/08 S27 Q3-S27-VMP2184 Q1 8 03/05/08 S289 Q1-S289-INA Smell of mothballs in home 532 Q3 28 07/25/08 S27 Q3-S27-VMP1185 Q1 8 03/05/08 S280 Q1-S280-INA Additional can of paint found during sample setup, removed 533 Q3 28 07/25/08 S362 Q3-S362-VMP186 Q1 8 03/05/08 S280 Q1-S280-VMP 534 Q3 28 07/25/08 S143 Q3-S143-VMP2187 Q1 8 03/05/08 S401 Q1-S401-VMP 535 Q3 28 07/25/08 S143 Q3-S143-VMP1188 Q1 8 03/05/08 S401 Q1-S401-INA 536 Q3 29 07/30/08 S79 Q3-S79-VMP1189 Q1 8 03/05/08 S270 Q1-S270-INA Basement currently being re-modeled 537 Q3 29 07/30/08 S79 Q3-S79-VMP2190 Q1 8 03/05/08 S270 Q1-S270-VMP 538 Q3 29 07/30/08 S79 Q3-S79-GMPR191 Q1 8 03/06/08 S289 Q1-S289-VMP 539 Q3 29 07/30/08 S283 Q3-S283-PVMP2
192 Q1 8 03/07/08 S140 Q1-S140-INAIndoor Air duplicate - diffiuclty with regulators; sample collected
eventually 540 Q3 29 07/30/08 S283 Q3-S283-PVMP1193 Q1 8 03/07/08 S203 Q1-S203-VMP2 541 Q3 29 07/30/08 S238 Q3-S238-VMP194 Q1 8 03/07/08 S203 Q1-S203-INA 542 Q3 29 07/30/08 S229 Q3-S229-VMP195 Q1 8 03/07/08 S203 Q1-S203-VMP1 543 Q3 29 07/30/08 S373 Q3-S373-GMPR196 Q1 8 03/07/08 S211 Q1-S211-AOA 544 Q3 29 07/30/08 S7 Q3-S7-GMPR197 Q1 8 03/07/08 S203 Q1-S203-AOA 545 Q3 29 07/30/08 S373 Q3-S373-VMP198 Q1 8 03/08/08 S140 Q1-S140-VMP Needed to re-do sample because of bad regulator 546 Q3 29 07/30/08 S7 Q3-S7-VMP199 Q1 9 03/11/08 S211 Q1-S211-INA 547 Q3 29 07/30/08 S134 Q3-S134-GMPR1200 Q1 9 03/11/08 S211 Q1-S211-VMP 548 Q3 29 07/30/08 S134 Q3-S134-GMPR2201 Q1 9 03/12/08 S120 Q1-S120-INA 549 Q3 29 07/30/08 S13 Q3-S13-GMP202 Q1 9 03/12/08 S120 Q1-S120-VMP 550 Q3 29 07/30/08 S13 Q3-S13-VMP203 Q1 9 03/12/08 S33 Q1-S33-INA 551 Q3 29 07/30/08 S134 Q3-S134-VMP1 Possible gasoline leak observed in basement near VMP1204 Q1 9 03/12/08 S33 Q1-S33-VMP 552 Q3 29 07/30/08 S134 Q3-S134-VMP2 Limited purging due to dust from VMP
205 Q1 9 03/12/08 S33 Q1-S33-PVMPPVMP tubing badly kinked, PVMP sample could reflect if tubing
compromised 553 Q3 29 08/01/08 S214 Q3-S214-VMP206 Q1 9 03/12/08 S33 Q1-S33-AOA 554 Q3 29 08/01/08 S214 Q3-S214-GMPR1207 Q1 9 03/12/08 S187 Q1-S187-INA 555 Q3 29 08/01/08 S214 Q3-S214-GMPR2208 Q1 9 03/12/08 S187 Q1-S187-VMP 556 Q3 29 08/01/08 S278 Q3-S278-PVMP1209 Q1 9 03/12/08 S287 Q1-S287-VMP Active renovation in progress; tubing to VMP kinked after placement 557 Q3 29 08/01/08 S278 Q3-S278-VMP210 Q1 9 03/12/08 S287 Q1-S287-INA 558 Q3 29 08/01/08 S278 Q3-S278-PVMP2 Mis-labeled as PVMP4 on COC and Field Sheets211 Q1 9 03/12/08 S390 Q1-S390-AOA 559 Q3 29 08/01/08 S278 Q3-S278-GMPR1212 Q1 9 03/12/08 S390 Q1-S390-INA 560 Q3 29 08/01/08 S278 Q3-S278-GMPR2 Purged 1 liter213 Q1 9 03/12/08 S390 Q1-S390-VMP 561 Q3 29 08/01/08 S237 Q3-S237-VMP2214 Q1 9 03/13/08 S416 Q1-S416-INA 562 Q3 29 08/01/08 S237 Q3-S237-VMP1215 Q1 9 03/13/08 S416 Q1-S416-VMP 563 Q3 29 08/01/08 S70 Q3-S70-GMPR Purged 1 liter216 Q1 9 03/14/08 S213 Q1-S213-VMP1 564 Q3 29 08/01/08 S313 Q3-S313-GMPR217 Q1 9 03/14/08 S213 Q1-S213-INA 565 Q3 29 08/01/08 S313 Q3-S313-VMP218 Q1 9 03/14/08 S358 Q1-S358-INA 566 Q3 29 08/01/08 S73 Q3-S73-VMP2219 Q1 9 03/14/08 S344 Q1-S344-INA 567 Q3 29 08/01/08 S73 Q3-S73-VMP1 Purged 1/2 liter220 Q1 9 03/14/08 S344 Q1-S344-VMP 568 Q3 29 08/01/08 S384 Q3-S384-GMPR221 Q1 9 03/14/08 S344 Q1-S344-AOA 569 Q3 30 08/06/08 S326 Q3-S326-VMP222 Q1 9 03/14/08 S276 Q1-S276-AOA 570 Q3 30 08/06/08 S326 Q3-S326-GMPR223 Q1 9 03/14/08 S276 Q1-S276-VMP 571 Q3 30 08/06/08 S289 Q3-S289-VMP224 Q1 9 03/14/08 S276 Q1-S276-INA 572 Q3 30 08/06/08 S289 Q3-S289-GMPR225 Q1 9 03/14/08 S335 Q1-S335-INA 573 Q3 30 08/06/08 S176 Q3-S176-VMP2226 Q1 9 03/14/08 S335 Q1-S335-VMP 574 Q3 30 08/06/08 S176 Q3-S176-VMP1227 Q1 9 03/14/08 S17 Q1-S17-INA Remodeling in past 3 months 575 Q3 30 08/06/08 S176 Q3-S176-GMPR1228 Q1 9 03/14/08 S17 Q1-S17-VMP 576 Q3 30 08/06/08 S176 Q3-S176-GMPR2229 Q1 9 03/14/08 S296 Q1-S296-VMP 577 Q3 30 08/06/08 S23 Q3-S23-VMP2230 Q1 9 03/14/08 S296 Q1-S296-INA 578 Q3 30 08/06/08 S23 Q3-S23-VMP1231 Q1 10 03/19/08 S96 Q1-S96-INA 579 Q3 30 08/06/08 S59 Q3-S59-VMP232 Q1 10 03/19/08 S96 Q1-S96-VMP 580 Q3 30 08/06/08 S8 Q3-S8-VMP233 Q1 10 03/19/08 S96 Q1-S96-AOA 581 Q3 30 08/06/08 S167 Q3-S167-GMPR Sampled after re-installed due to pulled tubing234 Q1 10 03/19/08 S257 Q1-S257-VMP 582 Q3 30 08/06/08 S240 Q3-S240-GMPR235 Q1 10 03/19/08 S257 Q1-S257-INA 583 Q3 30 08/06/08 S211 Q3-S211-VMP236 Q1 10 03/19/08 S267 Q1-S267-INA 584 Q3 30 08/06/08 S240 Q3-S240-VMP2237 Q1 10 03/19/08 S267 Q1-S267-VMP 585 Q3 30 08/06/08 S240 Q3-S240-VMP1238 Q1 10 03/19/08 S267 Q1-S267-AOA 586 Q3 30 08/07/08 S176 Q3-S176-GMPR3 Purged 1 liter239 Q1 10 03/19/08 S402 Q1-S402-VMP 587 Q3 30 08/08/08 S322 Q3-S322-VMP2240 Q1 10 03/19/08 S402 Q1-S402-INA 588 Q3 30 08/08/08 S322 Q3-S322-VMP1
Page 4 of 6
������������������ ���������������

TABLE 3 List of Vapor Samples Collected During This Study(in Chronological Order)
Quarter Week SampDateHome
IDSample Name
Sampling Observation
Quarter Week SampDateHome
IDSample Name
Sampling Observation
241 Q1 10 03/19/08 S395 Q1-S395-VMP 589 Q3 30 08/08/08 S322 Q3-S322-PVMP242 Q1 10 03/19/08 S395 Q1-S395-INA 590 Q3 30 08/08/08 S322 Q3-S322-GMPR1 Purged 1 liter243 Q1 10 03/19/08 S75 Q1-S75-VMP 591 Q3 30 08/08/08 S45 Q3-S45-VMP244 Q1 10 03/19/08 S75 Q1-S75-INA 592 Q3 30 08/08/08 S267 Q3-S267-VMP245 Q1 10 03/19/08 S389 Q1-S389-INA 593 Q3 30 08/08/08 S269 Q3-S269-VMP246 Q1 11 03/28/08 S143 Q1-S143-INA 594 Q3 30 08/08/08 S269 Q3-S269-GMPR247 Q1 11 03/28/08 S143 Q1-S143-VMP1 595 Q3 30 08/08/08 S309 Q3-S309-GMPR Purged 1 liter248 Q1 11 03/28/08 S143 Q1-S143-VMP2 596 Q3 30 08/08/08 S322 Q3-S322-GMPR2 Slow regulator249 Q1 11 03/28/08 S143 Q1-S143-AOA 597 Q3 30 08/08/08 S239 Q3-S239-VMP250 Q1 11 03/28/08 S394 Q1-S394-INA Some paints left indoors, owner refused to allow removal 598 Q3 30 08/08/08 S239 Q3-S239-GMPR251 Q1 11 03/28/08 S394 Q1-S394-VMP1 599 Q3 30 08/08/08 S120 Q3-S120-VMP252 Q1 11 03/28/08 S394 Q1-S394-VMP2 600 Q3 30 08/08/08 S120 Q3-S120-GMPR1253 Q1 11 03/28/08 S341 Q1-S341-INA 601 Q3 30 08/08/08 S120 Q3-S120-GMPR2 Purged 1 liter254 Q1 11 03/28/08 S341 Q1-S341-VMP 602 Q3 30 08/08/08 S301 Q3-S301-GMPR255 Q1 11 03/28/08 S121 Q1-S121-INA 603 Q3 30 08/08/08 S381 Q3-S381-GMPR Purged 1 liter256 Q1 11 03/28/08 S121 Q1-S121-VMP 604 Q3 31 08/13/08 S52 Q3-S52-VMP257 Q1 11 03/28/08 S342 Q1-S342-VMP 605 Q3 31 08/13/08 S54 Q3-S54-VMP258 Q1 11 03/28/08 S342 Q1-S342-INA 606 Q3 31 08/13/08 S54 Q3-S54-GMPR1259 Q1 11 03/29/08 S121 Q1-S121-AOA 607 Q3 31 08/13/08 S54 Q3-S54-GMPR2 Purged 1 liter260 Q1 12 04/04/08 S132 Q1-S132-VMP 608 Q3 31 08/13/08 S293 Q3-S293-VMP2261 Q1 12 04/04/08 S132 Q1-S132-INA 609 Q3 31 08/13/08 S293 Q3-S293-VMP1262 Q1 12 04/04/08 S132 Q1-S132-AOA 610 Q3 31 08/13/08 S293 Q3-S293-GMP263 Q1 12 04/04/08 S45 Q1-S45-AOA 611 Q3 31 08/13/08 S37 Q3-S37-VMP264 Q1 12 04/04/08 S45 Q1-S45-INA 612 Q3 31 08/13/08 S37 Q3-S37-GMPR265 Q1 12 04/04/08 S45 Q1-S45-VMP 613 Q3 31 08/13/08 S72 Q3-S72-VMP266 Q1 12 04/04/08 S77 Q1-S77-INA 20-hour regulator 614 Q3 31 08/13/08 S250 Q3-S250-VMP1267 Q1 12 04/04/08 S72 Q1-S72-INA1 615 Q3 31 08/13/08 S250 Q3-S250-VMP2268 Q1 12 04/05/08 S72 Q1-S72-VMP 616 Q3 32 08/20/08 S245 Q3-S245-VMP269 Q1 12 04/05/08 S72 Q1-S72-INA2 Re-sample of indoor air coincident with sub-slab 617 Q3 32 08/20/08 S121 Q3-S121-VMP270 Q2 14 04/16/08 S79 Q2-S79-VMP2 618 Q3 32 08/20/08 S335 Q3-S335-GMPR271 Q2 14 04/16/08 S339 Q2-S339-VMP1 619 Q3 32 08/20/08 S150 Q3-S150-VMP272 Q2 14 04/16/08 S339 Q2-S339-VMP2 620 Q3 32 08/20/08 S335 Q3-S335-VMP273 Q2 14 04/16/08 S373 Q2-S373-VMP 621 Q3 32 08/20/08 S200 Q3-S200-GMPRR274 Q2 14 04/16/08 S326 Q2-S326-VMP 622 Q3 32 08/20/08 S36 Q3-S36-GMPRR275 Q2 14 04/16/08 S315 Q2-S315-VMP 623 Q3 32 08/20/08 S194 Q3-S194-VMP276 Q2 14 04/16/08 S13 Q2-S13-VMP 624 Q3 32 08/20/08 S367 Q3-S367-GMPRR277 Q2 14 04/16/08 S311 Q2-S311-VMP 625 Q3 32 08/22/08 S96 Q3-S96-VMP278 Q2 14 04/16/08 S73 Q2-S73-VMP2 626 Q3 32 08/22/08 S96 Q3-S96-GMP279 Q2 14 04/16/08 S73 Q2-S73-VMP1 627 Q3 32 08/22/08 S30 Q3-S30-PVMP280 Q2 14 04/17/08 S79 Q2-S79-VMP1 Slow regulator, left more than 24 hours 628 Q3 32 08/22/08 S30 Q3-S30-VMP281 Q2 14 04/18/08 S199 Q2-S199-VMP 629 Q3 32 08/22/08 S30 Q3-S30-GMPR1282 Q2 14 04/18/08 S214 Q2-S214-VMP 630 Q3 32 08/22/08 S30 Q3-S30-GMPR2283 Q2 14 04/18/08 S183 Q2-S183-VMP2 631 Q3 32 08/22/08 S254 Q3-S254-VMP284 Q2 14 04/18/08 S183 Q2-S183-VMP1 632 Q3 32 08/22/08 S254 Q3-S254-GMP285 Q2 14 04/18/08 S426 Q2-S426-VMP 633 Q3 32 08/22/08 S194 Q3-S194-GMPR Slow to Fill - Tight soil286 Q2 14 04/18/08 S134 Q2-S134-VMP2 634 Q3 32 08/22/08 S21 Q3-S21-GMPR2 Purged 1 liter287 Q2 14 04/18/08 S134 Q2-S134-VMP1 Purged 0.25 liters 635 Q3 32 08/22/08 S21 Q3-S21-GMPR1288 Q2 14 04/18/08 S138 Q2-S138-VMP 636 Q3 32 08/22/08 S21 Q3-S21-VMP1289 Q2 14 04/18/08 S229 Q2-S229-VMP 637 Q3 32 08/22/08 S21 Q3-S21-VMP2290 Q2 15 04/23/08 S7 Q2-S7-VMP 638 Q3 32 08/22/08 S132 Q3-S132-VMP291 Q2 15 04/23/08 S283 Q2-S283-AOA Strong smell of fertilizer 639 Q3 32 08/22/08 S48 Q3-S48-VMP292 Q2 15 04/23/08 S194 Q2-S194-VMP 640 Q3 32 08/22/08 S48 Q3-S48-GMP293 Q2 15 04/23/08 S283 Q2-S283-PVMP2 641 Q3 32 08/22/08 S389 Q3-S389-GMPRR Purged 1 liter294 Q2 15 04/23/08 S188 Q2-S188-INA 642 Q3 32 08/22/08 S401 Q3-S401-VMP295 Q2 15 04/23/08 S188 Q2-S188-VMP 643 Q3 33 08/27/08 S416 Q3-S416-VMP296 Q2 15 04/23/08 S283 Q2-S283-INA 644 Q3 33 08/27/08 S416 Q3-S416-GMPR297 Q2 15 04/23/08 S283 Q2-S283-PVMP1 645 Q3 33 08/27/08 S339 Q3-S339-GMPR298 Q2 15 04/23/08 S220 Q2-S220-VMP 646 Q3 33 08/27/08 S339 Q3-S339-VMP1299 Q2 15 04/23/08 S21 Q2-S21-VMP2 647 Q3 33 08/27/08 S339 Q3-S339-VMP2300 Q2 15 04/23/08 S21 Q2-S21-VMP1 648 Q3 33 08/27/08 S280 Q3-S280-VMP301 Q2 15 04/23/08 S88 Q2-S88-VMP 649 Q3 33 08/27/08 S77 Q3-S77-GMPR302 Q2 15 04/23/08 S30 Q2-S30-INA Water heater exploded and basement flooded 2 weeks earlier 650 Q3 33 08/27/08 S358 Q3-S358-GMPRR
Page 5 of 6
������������������ ���������������
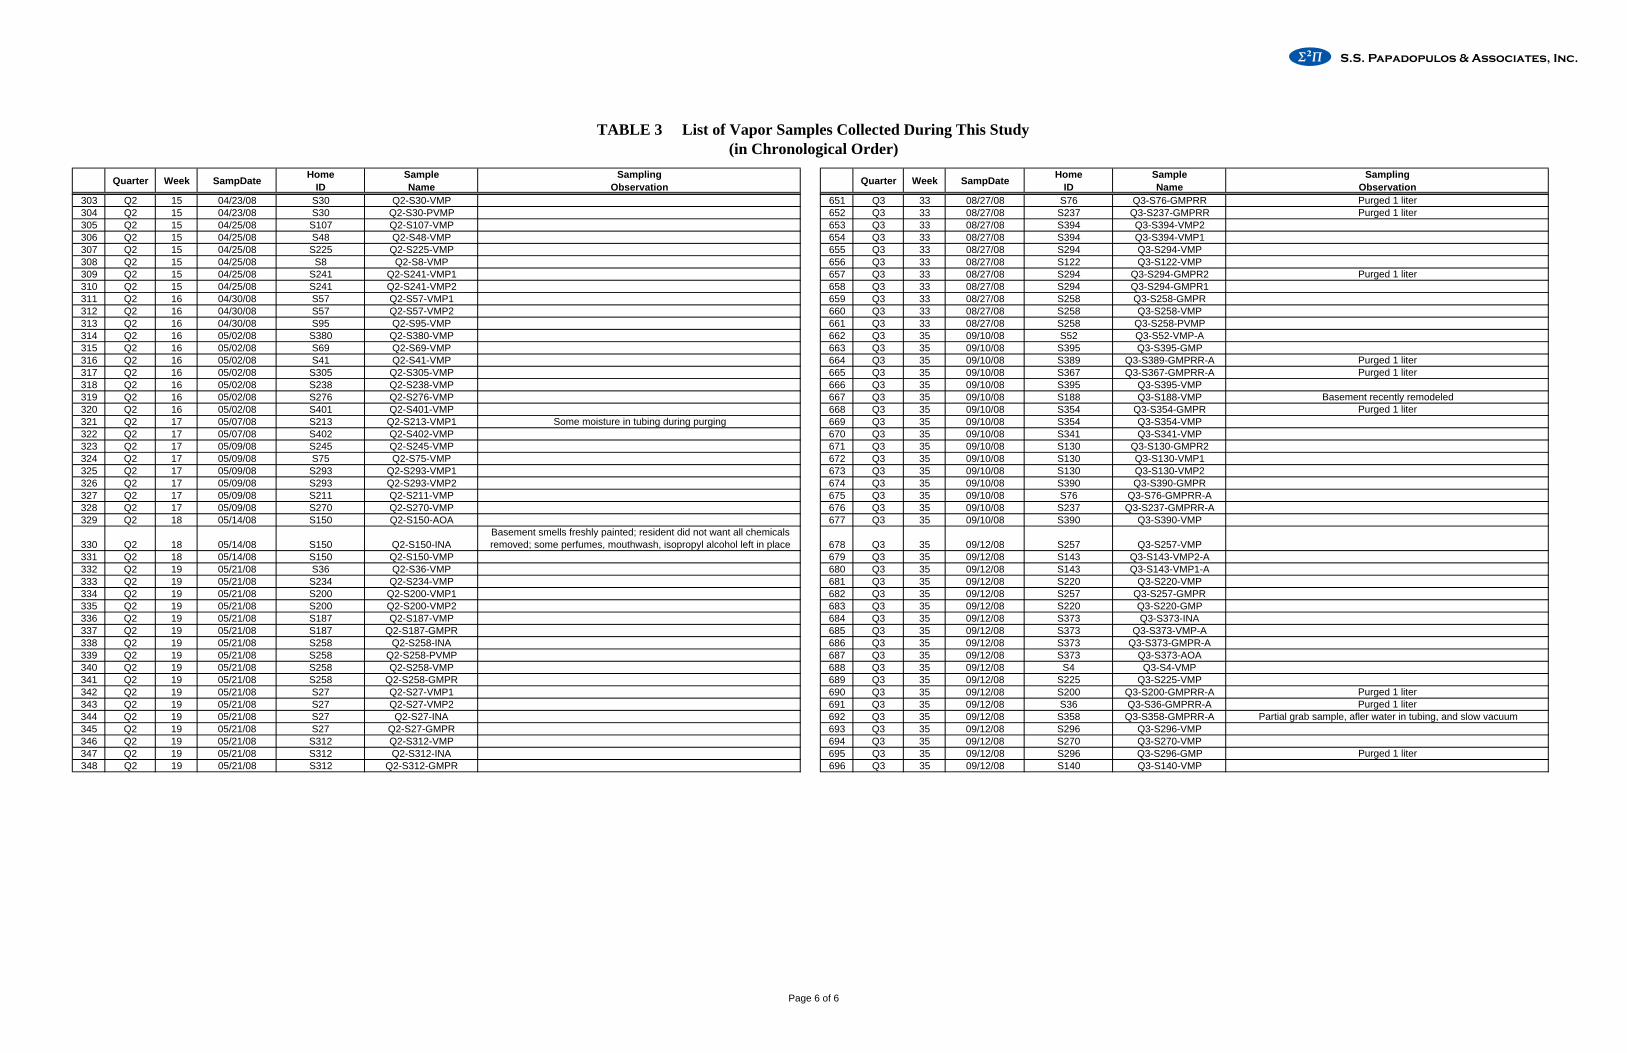
TABLE 3 List of Vapor Samples Collected During This Study(in Chronological Order)
Quarter Week SampDateHome
IDSample Name
Sampling Observation
Quarter Week SampDateHome
IDSample Name
Sampling Observation
303 Q2 15 04/23/08 S30 Q2-S30-VMP 651 Q3 33 08/27/08 S76 Q3-S76-GMPRR Purged 1 liter304 Q2 15 04/23/08 S30 Q2-S30-PVMP 652 Q3 33 08/27/08 S237 Q3-S237-GMPRR Purged 1 liter305 Q2 15 04/25/08 S107 Q2-S107-VMP 653 Q3 33 08/27/08 S394 Q3-S394-VMP2306 Q2 15 04/25/08 S48 Q2-S48-VMP 654 Q3 33 08/27/08 S394 Q3-S394-VMP1307 Q2 15 04/25/08 S225 Q2-S225-VMP 655 Q3 33 08/27/08 S294 Q3-S294-VMP308 Q2 15 04/25/08 S8 Q2-S8-VMP 656 Q3 33 08/27/08 S122 Q3-S122-VMP309 Q2 15 04/25/08 S241 Q2-S241-VMP1 657 Q3 33 08/27/08 S294 Q3-S294-GMPR2 Purged 1 liter310 Q2 15 04/25/08 S241 Q2-S241-VMP2 658 Q3 33 08/27/08 S294 Q3-S294-GMPR1311 Q2 16 04/30/08 S57 Q2-S57-VMP1 659 Q3 33 08/27/08 S258 Q3-S258-GMPR312 Q2 16 04/30/08 S57 Q2-S57-VMP2 660 Q3 33 08/27/08 S258 Q3-S258-VMP313 Q2 16 04/30/08 S95 Q2-S95-VMP 661 Q3 33 08/27/08 S258 Q3-S258-PVMP314 Q2 16 05/02/08 S380 Q2-S380-VMP 662 Q3 35 09/10/08 S52 Q3-S52-VMP-A315 Q2 16 05/02/08 S69 Q2-S69-VMP 663 Q3 35 09/10/08 S395 Q3-S395-GMP316 Q2 16 05/02/08 S41 Q2-S41-VMP 664 Q3 35 09/10/08 S389 Q3-S389-GMPRR-A Purged 1 liter317 Q2 16 05/02/08 S305 Q2-S305-VMP 665 Q3 35 09/10/08 S367 Q3-S367-GMPRR-A Purged 1 liter318 Q2 16 05/02/08 S238 Q2-S238-VMP 666 Q3 35 09/10/08 S395 Q3-S395-VMP319 Q2 16 05/02/08 S276 Q2-S276-VMP 667 Q3 35 09/10/08 S188 Q3-S188-VMP Basement recently remodeled320 Q2 16 05/02/08 S401 Q2-S401-VMP 668 Q3 35 09/10/08 S354 Q3-S354-GMPR Purged 1 liter321 Q2 17 05/07/08 S213 Q2-S213-VMP1 Some moisture in tubing during purging 669 Q3 35 09/10/08 S354 Q3-S354-VMP322 Q2 17 05/07/08 S402 Q2-S402-VMP 670 Q3 35 09/10/08 S341 Q3-S341-VMP323 Q2 17 05/09/08 S245 Q2-S245-VMP 671 Q3 35 09/10/08 S130 Q3-S130-GMPR2324 Q2 17 05/09/08 S75 Q2-S75-VMP 672 Q3 35 09/10/08 S130 Q3-S130-VMP1325 Q2 17 05/09/08 S293 Q2-S293-VMP1 673 Q3 35 09/10/08 S130 Q3-S130-VMP2326 Q2 17 05/09/08 S293 Q2-S293-VMP2 674 Q3 35 09/10/08 S390 Q3-S390-GMPR327 Q2 17 05/09/08 S211 Q2-S211-VMP 675 Q3 35 09/10/08 S76 Q3-S76-GMPRR-A328 Q2 17 05/09/08 S270 Q2-S270-VMP 676 Q3 35 09/10/08 S237 Q3-S237-GMPRR-A329 Q2 18 05/14/08 S150 Q2-S150-AOA 677 Q3 35 09/10/08 S390 Q3-S390-VMP
330 Q2 18 05/14/08 S150 Q2-S150-INABasement smells freshly painted; resident did not want all chemicals removed; some perfumes, mouthwash, isopropyl alcohol left in place 678 Q3 35 09/12/08 S257 Q3-S257-VMP
331 Q2 18 05/14/08 S150 Q2-S150-VMP 679 Q3 35 09/12/08 S143 Q3-S143-VMP2-A332 Q2 19 05/21/08 S36 Q2-S36-VMP 680 Q3 35 09/12/08 S143 Q3-S143-VMP1-A333 Q2 19 05/21/08 S234 Q2-S234-VMP 681 Q3 35 09/12/08 S220 Q3-S220-VMP334 Q2 19 05/21/08 S200 Q2-S200-VMP1 682 Q3 35 09/12/08 S257 Q3-S257-GMPR335 Q2 19 05/21/08 S200 Q2-S200-VMP2 683 Q3 35 09/12/08 S220 Q3-S220-GMP336 Q2 19 05/21/08 S187 Q2-S187-VMP 684 Q3 35 09/12/08 S373 Q3-S373-INA337 Q2 19 05/21/08 S187 Q2-S187-GMPR 685 Q3 35 09/12/08 S373 Q3-S373-VMP-A338 Q2 19 05/21/08 S258 Q2-S258-INA 686 Q3 35 09/12/08 S373 Q3-S373-GMPR-A339 Q2 19 05/21/08 S258 Q2-S258-PVMP 687 Q3 35 09/12/08 S373 Q3-S373-AOA340 Q2 19 05/21/08 S258 Q2-S258-VMP 688 Q3 35 09/12/08 S4 Q3-S4-VMP341 Q2 19 05/21/08 S258 Q2-S258-GMPR 689 Q3 35 09/12/08 S225 Q3-S225-VMP342 Q2 19 05/21/08 S27 Q2-S27-VMP1 690 Q3 35 09/12/08 S200 Q3-S200-GMPRR-A Purged 1 liter343 Q2 19 05/21/08 S27 Q2-S27-VMP2 691 Q3 35 09/12/08 S36 Q3-S36-GMPRR-A Purged 1 liter344 Q2 19 05/21/08 S27 Q2-S27-INA 692 Q3 35 09/12/08 S358 Q3-S358-GMPRR-A Partial grab sample, afler water in tubing, and slow vacuum345 Q2 19 05/21/08 S27 Q2-S27-GMPR 693 Q3 35 09/12/08 S296 Q3-S296-VMP346 Q2 19 05/21/08 S312 Q2-S312-VMP 694 Q3 35 09/12/08 S270 Q3-S270-VMP347 Q2 19 05/21/08 S312 Q2-S312-INA 695 Q3 35 09/12/08 S296 Q3-S296-GMP Purged 1 liter348 Q2 19 05/21/08 S312 Q2-S312-GMPR 696 Q3 35 09/12/08 S140 Q3-S140-VMP
Page 6 of 6
������������������ ���������������

TABLE 4 List of Vapor Samples By Home, Sample Type, and Quarter
Home ID
No. ofIndoor
Air
No. ofSub-Slab
VMP
No. ofIndoor
Air
No. ofSub-Slab
VMP
NO. of Outdoor
GMP
No. ofIndoor
Air
No. ofSub-Slab
VMP
NO. of Outdoor
GMP
S4 1 1 1 1S7 1 1 1 1 1 1S8 1 1 1 1S13 1 1 1 1 1 1S17 1 1 1S21 1 2 2 2 2 2S23 1 2 2 2S27* 1 2 1 2 1 2 1S30* 1 2 1 2 2 2 2S33 1 2 2 1 2 1S36 1 1 1 1 2S37 1 1 1 1 1 1S41 1 1 1 1S45 1 1 1 1S48 1 1 1 1 1 1S52 1 1 2S54 1 1 1 2 1 2S56 1 1 1S57 1 2 2 2S59 1 1 1 1S69 1 1 1 1S70 1 1 1S72* 2 1 1 1S73* 1 2 1 2 2S75 1 1 1 1S76 2S77 1 1 1S79 1 2 2 1 2 1S88 1 1 1 1S95 1 1 1 1S96 1 1 1 1 1 1
S107 1 1 1 1 1 1S120 1 1 1 2 1 2S121 1 1 1 1S122 1 1 1 1S130 1 2 2 1 2 1S132 1 1 1 1S134 1 2 2 2 2 2S138 1 1 1 1S140 1 1 1 1S143 1 2 4S144 1 1 1 1S148 1 1S150 1 1 1S167 1 1 1S176* 1 2 1 2 3 2 3S183 1 2 2 2S187 1 1 1 1 1 1S188 1 1 1S194* 1 1 1 1 1 1 1S199 1 1 1 1 1 1S200 1 2 2 2 2S203 1 2
Q1 Q2 Q3
Page 1 of 3
������������������ ���������������

TABLE 4 List of Vapor Samples By Home, Sample Type, and Quarter
Home ID
No. ofIndoor
Air
No. ofSub-Slab
VMP
No. ofIndoor
Air
No. ofSub-Slab
VMP
NO. of Outdoor
GMP
No. ofIndoor
Air
No. ofSub-Slab
VMP
NO. of Outdoor
GMP
Q1 Q2 Q3
S211 1 1 1 1S213 1 1 1 1S214 1 1 1 2 1 2S220 1 1 1 1 1 1S225 1 1 1 1S229 1 1 1 1S234 1 1 1 1 1 1S237 1 2 2 2 2S238 1 1 1 1S239 1 1 1 1 1 1S240 1 2 2 1 2 1S241 1 2 2 2S245 1 1 1 1S250 2 2S254 1 1 1 1 1 1S257 1 1 1 1 1 1S258* 1 2 1 2 1 2 1S267 1 1 1 1S269* 1 1 1 1 1 1 1S270 1 1 1 1S276 1 1 1 1S278 1 3 3 2 3 2S280 1 1 1 1S283 1 2 2S287 1 1 1 1S289 1 1 1 1 1 1S293 1 2 2 1 2 1S294 1 1 1 2 1 2S296 1 1 1 1 1 1S301 1 1 1S305 1 1 1 1S309 1 1 1S311 1 1 1 1 1 1S312* 1 1 1 1 1 1 1S313* 1 1 1 1 1 1 1S315 1 1 1 1S322* 1 3 1 3 3 2S325 1 1S326* 1 1 1 2 1 1 1S335 1 1 1 1 1 1S339 1 2 2 1 2 1S341 1 1 1 1S342 1 1S344 1 1 1 1S347 1 2 2 2S354 1 1 1 1 1 1S358 1 2S360 1 1 1 1S362 1 1 1 1 1 1S367 1 1 2S373* 1 1 1 1 1 2 2S380 1 1 1 1S381 1 1
Page 2 of 3
������������������ ���������������

TABLE 4 List of Vapor Samples By Home, Sample Type, and Quarter
Home ID
No. ofIndoor
Air
No. ofSub-Slab
VMP
No. ofIndoor
Air
No. ofSub-Slab
VMP
NO. of Outdoor
GMP
No. ofIndoor
Air
No. ofSub-Slab
VMP
NO. of Outdoor
GMP
Q1 Q2 Q3
S384 1 1 1S389 1 2S390 1 1 1 1 1 1S392 1 1S393 1 1 1S394 1 2 2 2S395 1 1 1 1 1 1S401 1 1 1 1S402 1 1 1 1S416 1 1 1 1 1 1S419 1 1S426 1 1 1 1
* Indoor air sampling repeated to achieve lower detection limits on target compounds
Q1-Q3 Number of Homes Indoor Air: 115 SubSlab: 106 Outdoor GMP: 66Q1-Q3 Number of Samples 128 378 151
Page 3 of 3
������������������ ���������������

TABLE 5 Analytes Detected in Vapor Samples
AnalyteNumber ofDetections
(n=39)
Frequencyof Detection
MaxDetection *
(ug/m3)
Number ofDetections
(n=128)
Frequencyof Detection
MaxDetection *
(ug/m3)
Number ofDetections
(n=378)
Frequencyof Detection
MaxDetection *
(ug/m3)
Number ofDetections
(n=151)
Frequencyof Detection
MaxDetection *
(ug/m3)Acetone 38 97.4% 60.69 122 95.3% 251.89 375 99.2% 125.71 150 99.3% 4,633.74
Acrylonitrile # 5 4.0% 0.69 1 0.7% 1.34Benzene 38 97.4% 1.95 110 85.9% 8.36 252 66.7% 13.72 18 11.9% 24.88
Benzyl chloride 4 1.1% 5.51Bromodichloromethane 1 0.8% 0.20 18 4.8% 4.22
Bromoform 3 0.8% 1.241,3-Butadiene 2 5.1% 0.29 9 7.0% 5.81 4 2.6% 6.80
2-Butanone (MEK) 35 89.7% 3.92 101 78.9% 12.92 358 94.7% 25.48 134 88.7% 787.35
n-Butylbenzene # 21 16.8% 4.88 7 4.9% 156.43
sec-Butylbenzene # 1 0.8% 0.55 5 3.5% 28.98Carbon disulfide 2 5.1% 0.68 5 3.9% 2.21 118 31.2% 18.15 143 94.7% 140.68
Carbon tetrachloride 10 25.6% 0.63 8 6.3% 0.94 113 29.9% 42.15Chlorobenzene 2 1.6% 25.56 11 2.9% 8.70 1 0.7% 8.66Chloroethane 2 0.5% 3.40Chloroform 1 2.6% 0.19 31 24.2% 23.31 218 57.7% 301.76 69 45.7% 66.19
Chloromethane 39 100.0% 2.09 121 94.5% 4.90 85 22.5% 15.51 21 13.9% 4.96Cyclohexane 1 2.6% 0.55 34 26.6% 7.47 88 23.3% 18.59 10 6.6% 5.71
Dibromochloromethane 1 0.3% 0.601,2-Dibromoethane (EDB) 5 1.3% 4.46
1,2-Dichlorobenzene 6 1.6% 3.491,3-Dichlorobenzene 1 0.8% 4.93 24 6.3% 5.591,4-Dichlorobenzene 4 10.3% 4.21 63 49.2% 3,012.15 213 56.3% 657.74 16 10.6% 46.41
Dichlorodifluoromethane (Freon 12) # 33 91.7% 3.41 103 99.0% 62.80 346 94.0% 39.11 65 43.0% 45.491,1-Dichloroethane 2 0.5% 0.571,2-Dichloroethane 1 2.6% 0.12 6 4.7% 4.29 10 2.6% 2.791,1-Dichloroethene 3 0.8% 0.79 3 2.0% 8.57
cis-1,2-Dichloroethene 1 2.6% 0.75 1 0.8% 0.63 14 3.7% 17.61 1 0.7% 32.51trans-1,2-Dichloroethene 1 0.8% 0.08 7 1.9% 0.59
1,2-Dichloropropane 1 0.3% 0.18 1 0.7% 2.87cis-1,3-Dichloropropene 4 1.1% 1.50
trans-1,3-Dichloropropene 1 2.6% 0.41 5 1.3% 3.501,2-Dichlorotetrafluoroethane (Freon 114) 3 2.3% 33.55 7 1.9% 21.04 1 0.7% 29.08
1,4-Dioxane # 2 1.6% 13.68 3 2.1% 97.18Ethanol 39 100.0% 23.76 127 99.2% 3,073.33 347 91.8% 1,046.44 139 92.1% 499.65
Ethyl acetate 4 10.3% 0.50 78 60.9% 51.53 190 50.3% 54.41 31 20.5% 64.86Ethylbenzene 14 35.9% 4.81 40 31.3% 7.28 49 13.0% 25.36 25 16.6% 49.424-Ethyltoluene 2 5.1% 9.09 10 7.8% 9.73 19 5.0% 6.59 24 15.9% 318.57
n-Heptane 20 51.3% 1.07 72 56.3% 18.48 204 54.0% 78.68 51 33.8% 52.46Hexachlorobutadiene 1 0.8% 5.22 2 0.5% 1.17
Hexane 26 66.7% 2.33 96 75.0% 54.36 150 39.7% 11.04 36 23.8% 326.822-Hexanone (MBK) 5 12.8% 4.67 9 7.0% 2.21 224 59.3% 74.05 78 51.7% 190.97Isopropyl alcohol 39 100.0% 53.50 125 97.7% 1,055.21 335 88.6% 104.88 135 89.4% 76.07
Isopropylbenzene # 1 14.3% 1.52 4 3.2% 1.43
4-Isopropyltoluene # 3 42.9% 4.08 27 21.6% 5.85 8 5.6% 39.71Methyl tert-butyl ether 1 0.8% 1.77 18 4.8% 4.51 17 11.3% 667.36
4-Methyl-2-pentanone (MIBK) 2 5.1% 2.17 6 4.7% 2.17 43 11.4% 6.23 2 1.3% 65.98Methylene chloride 28 71.8% 4.03 59 46.1% 79.38 93 24.6% 1,229.23 4 2.6% 5.21
Naphthalene 27 21.1% 146.06 7 1.9% 72.25 9 6.0% 98.42Propene 1 2.6% 2.62 6 4.7% 15.70 54 14.3% 33.47 123 81.5% 252.20Styrene 19 14.8% 4.76 31 8.2% 5.83 3 2.0% 4.42
1,1,2,2-Tetrachloroethane # 2 1.6% 0.55Tetrachloroethene 11 28.2% 4.95 40 31.3% 42.31 358 94.7% 813.74 43 28.5% 929.02Tetrahydrofuran 5 12.8% 1.09 16 12.5% 12.18 96 25.4% 28.07 14 9.3% 315.53
Toluene 39 100.0% 5.64 122 95.3% 164.73 352 93.1% 113.26 87 57.6% 173.69Total Volatile Hydrocarbons C5-C12 (ppmV) 36 92.3% 0.11 121 94.5% 1.10 365 96.6% 0.52 151 100.0% 23.70
1,2,4-Trichlorobenzene 1 2.6% 0.82 13 3.4% 6.53 1 0.7% 11.281,1,1-Trichloroethane 1 2.6% 0.16 13 10.2% 8.18 141 37.3% 621.99 6 4.0% 24.33
Ambient Air
Indoor Air
Sub-SlabVMPs
OutdoorGMPs
Page 1 of 2
������������������ ���������������

TABLE 5 Analytes Detected in Vapor Samples
AnalyteNumber ofDetections
(n=39)
Frequencyof Detection
MaxDetection *
(ug/m3)
Number ofDetections
(n=128)
Frequencyof Detection
MaxDetection *
(ug/m3)
Number ofDetections
(n=378)
Frequencyof Detection
MaxDetection *
(ug/m3)
Number ofDetections
(n=151)
Frequencyof Detection
MaxDetection *
(ug/m3)
Ambient Air
Indoor Air
Sub-SlabVMPs
OutdoorGMPs
1,1,2-Trichloroethane 1 0.3% 0.55 11 7.3% 22.26Trichloroethene 3 7.7% 3.60 7 5.5% 7.26 99 26.2% 35.36 8 5.3% 15.91
Trichlorofluoromethane (Freon 11) 39 100.0% 2.64 94 73.4% 35.40 359 95.0% 24.11 38 25.2% 22.93
1,1,2-Trichlorotrifluoroethane (Freon 113) 13 33.3% 0.84 10 7.8% 0.92 165 43.7% 9.43 4 2.6% 23.451,2,4-Trimethylbenzene 19 48.7% 30.87 49 38.3% 22.12 120 31.7% 8.50 51 33.8% 1,066.811,3,5-Trimethylbenzene 2 5.1% 7.13 9 7.0% 6.98 23 6.1% 4.28 16 10.6% 155.84
m,p-Xylene 37 94.9% 20.03 100 78.1% 26.01 189 50.0% 197.69 46 30.5% 270.18o-Xylene 13 33.3% 7.89 41 32.0% 11.79 54 14.3% 62.86 39 25.8% 189.89
Number of Compounds Detected 38 47 64 48
* For results with an "E" flag from TO-15-SIMS Analysis, but not flagged in TO-15 (standard), the unflagged result is cited
# The following compounds were added to the TO-15 analyte list during the course of the project and thus the total number of anlyses are fewer than cited in the heade 1,1,1,2-Tetrachloroethane, 1,4-Dioxane, 4-Isopropyltoluene, Acrylonitrile, Dichlorodifluoromethane (Freon12), Isopropylbenzene, n-Butylbenzene,and sec-Butylbenzene
Page 2 of 2
������������������ ���������������

TABLE 6 Summary Statistics for Selected Petroleum-Related Analytes
Ambient Air Samples (AOA)B T E Xmp Xo Naphth MTBE 124-TMB 135-TMB CycloHex Hexane Propene n-Heptane
Number of Valid Data 39 39 39 39 39 39 39 39 39 39 39 39 39Number of Detected Data 38 39 14 37 13 0 0 14 2 1 26 1 20
Number of Non-Detect Data 1 0 25 2 26 39 39 25 37 38 13 38 19
Percent Detected 97.4% 100.0% 35.9% 94.9% 33.3% 0.0% 0.0% 35.9% 5.1% 2.6% 66.7% 2.6% 51.3%
Minimum Detected 0.32 0.60 0.30 0.39 0.48 NA NA 0.44 1.82 NA 0.39 NA 0.29Maximum Detected 1.95 5.64 4.81 20.03 7.89 NA NA 30.87 7.13 NA 2.33 NA 1.07Mean of Detected 1.00 2.15 0.93 1.79 1.34 NA NA 2.61 4.47 NA 0.98 NA 0.59SD of Detected 0.46 1.17 1.14 3.21 2.01 NA NA 6.95 3.75 NA 0.44 NA 0.18
Minimum Non-Detect 0.40 NA 0.29 0.29 0.32 NA NA 0.38 0.01 NA 0.06 NA 0.17Maximum Non-Detect 0.40 NA 0.29 0.29 0.32 NA NA 0.38 0.43 NA 0.33 NA 0.46
UCL 1.12 2.49 0.77 3.91 1.14 NA NA 3.05 7.13 NA 0.91 NA 0.52
Indoor Air Samples (INA)B T E Xmp Xo Naphth MTBE 124-TMB 135-TMB CycloHex Hexane Propene n-Heptane
Number of Valid Data 115 115 115 115 115 115 115 115 115 115 115 115 115Number of Detected Data 107 114 39 97 41 27 1 48 9 34 92 2 71
Number of Non-Detect Data 8 1 76 18 74 88 114 67 106 81 23 113 44Percent Detected 93.0% 99.1% 33.9% 84.3% 35.7% 23.5% 0.9% 41.7% 7.8% 29.6% 80.0% 1.7% 61.7%
Minimum Detected 0.48 1.43 0.39 0.69 0.39 5.39 NA 0.49 0.49 0.28 0.60 2.12 0.49Maximum Detected 8.36 164.70 7.28 26.01 11.79 146.10 NA 22.12 6.98 7.47 54.36 5.15 18.48Mean of Detected 1.80 9.34 1.80 3.46 1.85 25.69 NA 3.14 2.56 1.62 3.69 3.63 2.35SD of Detected 1.33 18.44 1.61 4.18 2.14 26.31 NA 4.23 2.25 1.56 6.42 2.14 2.86
Minimum Non-Detect 0.40 3.67 0.29 1.07 0.32 5.24 NA 0.38 0.01 0.03 0.06 0.10 0.17Maximum Non-Detect 3.17 3.67 4.90 8.54 4.02 41.88 NA 5.65 6.93 3.11 2.60 4.17 3.64
UCL 1.95 12.69 1.10 3.70 1.17 12.58 NA 2.15 0.79 0.87 4.07 2.21 2.03
Sub-Slab Vapor Samples (VMP)B T E Xmp Xo Naphth MTBE 124-TMB 135-TMB CycloHex Hexane Propene n-Heptane
Number of Valid Data 378 378 378 378 378 378 378 378 378 378 378 378 378Number of Detected Data 252 352 49 189 54 7 18 120 23 88 150 54 204
Number of Non-Detect Data 126 26 329 189 324 371 360 258 355 290 228 324 174Percent Detected 66.7% 93.1% 13.0% 50.0% 14.3% 1.9% 4.8% 31.7% 6.1% 23.3% 39.7% 14.3% 54.0%
Minimum Detected 0.06 0.23 0.30 0.30 0.35 6.70 0.25 0.39 0.44 0.10 0.07 0.10 0.21Maximum Detected 13.72 113.30 25.36 197.70 62.86 72.25 4.51 8.51 4.28 18.59 11.04 33.47 78.68Mean of Detected 0.85 3.77 1.68 2.61 2.51 20.86 1.40 1.22 1.18 1.36 1.08 1.84 1.69SD of Detected 1.20 8.80 3.84 14.99 8.80 23.23 1.27 1.41 1.05 2.56 1.45 5.32 6.03
Minimum Non-Detect 0.00 0.01 0.01 0.02 0.01 5.24 0.01 0.01 0.01 0.03 0.01 0.00 0.02Maximum Non-Detect 1.98 2.30 3.06 5.33 2.52 26.18 1.95 3.54 4.33 1.95 1.63 1.04 2.27
UCL 0.70 5.45 0.61 2.48 1.01 11.28 0.34 0.74 0.54 0.53 0.58 0.61 1.44
Outdoor Subsurface Vapor Samples (GMP)B T E Xmp Xo Naphth MTBE 124-TMB 135-TMB CycloHex Hexane Propene n-Heptane
Number of Valid Data 151 151 151 151 151 151 151 151 151 151 151 151 151Number of Detected Data 18 87 25 46 39 9 17 51 16 10 36 123 51
Number of Non-Detect Data 133 64 126 105 112 142 134 100 135 141 115 28 100Percent Detected 11.9% 57.6% 16.6% 30.5% 25.8% 6.0% 11.3% 33.8% 10.6% 6.6% 23.8% 81.5% 33.8%
Minimum Detected 0.26 0.72 0.91 1.08 1.47 5.60 0.90 0.64 2.66 1.17 0.88 0.81 0.90Maximum Detected 24.88 173.70 49.42 270.20 189.90 98.42 667.40 1067.00 155.80 5.71 326.80 252.20 52.46Mean of Detected 4.78 16.10 10.87 28.51 19.35 46.48 131.10 111.60 40.28 2.84 18.38 19.10 6.62SD of Detected 7.25 29.59 14.34 55.39 35.88 30.32 217.60 242.50 48.10 1.91 56.94 31.59 9.14
Minimum Non-Detect 0.40 0.46 0.29 0.29 0.32 5.24 0.15 0.71 0.43 0.08 0.06 0.10 0.17Maximum Non-Detect 3.96 3.67 6.11 10.67 5.03 52.35 3.90 7.08 8.65 3.89 3.25 4.16 4.55
UCL 1.58 18.04 4.30 15.63 9.55 30.84 26.94 114.70 9.30 1.50 10.48 26.17 3.81
������������������ ���������������

TABLE 7 Summary Statistics for Selected Chlorinated Analytes
Ambient Air Samples (AOA) Sub-Slab Vapor Samples (VMP)PCE TCE 111-TCA CF CM 14-DCB PCE TCE 111-TCA CF CM 14-DCB
Number of Valid Data 39 39 39 39 39 39 Number of Valid Data 378 378 378 378 378 378
Number of Detected Data 11 3 1 1 39 4 Number of Detected Data 358 99 141 218 85 213
Number of Non-Detect Data 28 36 38 38 0 35 Number of Non-Detect Data 20 279 237 160 293 165
Percent Detected 28.2% 7.7% 2.6% 2.6% 100.0% 10.3% Percent Detected 94.7% 26.2% 37.3% 57.7% 22.5% 56.3%
Minimum Detected 0.61 1.18 NA NA 0.89 0.72 Minimum Detected 0.34 0.16 0.16 0.15 0.17 0.54
Maximum Detected 4.95 3.60 NA NA 2.09 4.21 Maximum Detected 813.70 35.36 622.00 301.80 15.51 657.70
Mean of Detected 1.35 1.99 NA NA 1.32 1.65 Mean of Detected 34.69 1.92 13.96 9.11 0.68 9.37
SD of Detected 1.35 1.40 NA NA 0.27 1.70 SD of Detected 108.90 4.98 74.35 34.76 1.70 51.32
Minimum Non-Detect 0.29 0.02 NA NA NA 0.49 Minimum Non-Detect 0.29 0.02 0.01 0.01 0.01 0.01
Maximum Non-Detect 0.97 0.82 NA NA NA 0.86 Maximum Non-Detect 4.85 4.11 3.55 5.35 1.28 4.30
UCL 1.08 1.37 NA NA 1.39 1.19 UCL 67.02 0.86 15.61 11.34 0.37 14.22
Indoor Air Samples (INA) Outdoor Subsurface Vapor Samples (GMP)PCE TCE 111-TCA CF CM 14-DCB PCE TCE 111-TCA CF CM 14-DCB
Number of Valid Data 115 115 115 115 115 115 Number of Valid Data 151 151 151 151 151 151
Number of Detected Data 40 7 13 31 112 61 Number of Detected Data 43 8 6 69 21 16
Number of Non-Detect Data 75 108 102 84 3 54 Number of Non-Detect Data 108 143 145 82 130 135
Percent Detected 34.8% 6.1% 11.3% 27.0% 97.4% 53.0% Percent Detected 28.5% 5.3% 4.0% 45.7% 13.9% 10.6%
Minimum Detected 0.41 0.16 0.16 0.49 0.76 0.66 Minimum Detected 1.70 3.44 3.17 1.22 0.60 1.14
Maximum Detected 42.31 7.26 8.18 23.31 4.90 3012.00 Maximum Detected 929.00 15.91 24.33 66.19 4.96 46.41
Mean of Detected 4.53 2.08 2.30 3.33 1.60 148.00 Mean of Detected 59.95 9.87 14.04 14.50 1.98 15.30
SD of Detected 7.21 2.47 2.13 4.37 0.69 476.40 SD of Detected 190.00 4.57 8.63 15.17 1.38 13.64
Minimum Non-Detect 0.29 0.02 0.01 0.01 0.26 0.49 Minimum Non-Detect 0.97 0.16 0.14 1.08 0.15 0.86
Maximum Non-Detect 7.73 6.56 5.67 8.62 2.05 6.85 Maximum Non-Detect 9.70 8.22 7.09 10.76 2.56 8.60
UCL 2.70 0.40 0.56 1.79 1.70 285.40 UCL 34.26 6.90 16.85 9.21 0.90 3.90
������������������ ���������������

TABLE 8 Soil and Groundwater Samples Collected During Second Quarter (Q2) Outdoor VMP Installation
Home IDSample Name
Depth(ft)
SampleType
Date Sampled Home ID
Sample Name
Depth(ft)
SampleType
Date Sampled
S5 S5 SB (8') 8 SOIL 3/31/2008 S296 S296-SB(5') 5 SOIL 5/16/2008S7 S7 SB (6') 6 SOIL 4/1/2008 S301 S301 SB (4') 4 SOIL 3/31/2008
S13 S13 - SB (18') 18 SOIL 4/15/2008 S309 S309 SB (10') 10 SOIL 3/31/2008S21 S21 SB (12.2') 12.2 SOIL 4/2/2008 S311 S311 SB (5') 5 SOIL 4/1/2008S27 S27 SB (19') 19 SOIL 4/1/2008 S312 S312 - SB (15') 15 SOIL 4/11/2008S30 S30 - SB (11') 11 SOIL 4/15/2008 S313 S313 - SB (15') 15 SOIL 4/9/2008S36 S36 SB (16') 16 SOIL 4/1/2008 S322 S322 SB (16') 16 SOIL 4/2/2008S37 S37 SB (10') 10 SOIL 3/31/2008 S326 S326 SB (16') 16 SOIL 4/1/2008S48 S48-SB(12') 12 SOIL 5/16/2008 S335 S335 - SB (20') 20 SOIL 4/16/2008S54 S54 - SB (16') 16 SOIL 4/11/2008 S339 S339 - SB (17') 17 SOIL 4/7/2008S56 S56 SB (2') 2 SOIL 3/31/2008 S347 S347 - SB (18') 18 SOIL 4/9/2008S70 S70 - SB (5') 5 SOIL 4/10/2008 S354 S354 - SB (17') 17 SOIL 4/15/2008S76 S76-SB (24') 24 SOIL 4/3/2008 S358 S358-SB(2') 2 SOIL 5/13/2008S77 S77-SB(2') 2 SOIL 5/14/2008 S360 S360-SB (19') 19 SOIL 4/3/2008S79 S79 SB (16') 16 SOIL 4/2/2008 S362 S362 - SB (16') 16 SOIL 4/17/2008S96 S96-SB(8') 8 SOIL 5/13/2008 S367 S367 - SB (5') 5 SOIL 4/10/2008
S107 S107 - SB (13') 13 SOIL 4/11/2008 S373 S373 - SB (17.5') 17.5 SOIL 4/7/2008S120 S120 - SB (16') 16 SOIL 4/17/2008 S381 S381 - SB (10') 10 SOIL 4/17/2008S130 S130 - SB (16') 16 SOIL 4/9/2008 S384 S384 SB (5') 5 SOIL 3/31/2008S134 S134 - SB (18') 18 SOIL 4/9/2008 S389 S389 - SB (10') 10 SOIL 4/17/2008S144 S144-SB(1') 1 SOIL 5/13/2008 S390 S390 - SB (5.5') 5.5 SOIL 4/16/2008S167 S167 SB (5') 5 SOIL 3/31/2008 S392 S392 SB (6.5') 6.5 SOIL 4/1/2008S176 S176 - SB (35') 35 SOIL 4/16/2008 S393 S393 - SB (5') 5 SOIL 4/10/2008S187 S187 - SB (2') 2 SOIL 4/10/2008 S395 S395-SB(1') 1 SOIL 5/13/2008S194 S194 SB (20') 20 SOIL 4/2/2008 S403 S403 - SB (20') 20 SOIL 4/16/2008S199 S199 SB (12') 12 SOIL 4/1/2008 S416 S416 - SB (21') 21 SOIL 4/16/2008S200 S200 - SB (16') 16 SOIL 4/15/2008 S419 S419 SB (15.5') 15.5 SOIL 4/2/2008S214 S214 SB (8') 8 SOIL 3/31/2008S220 S220 - SB (17') 17 SOIL 4/17/2008 S7 S7 GW 7.7 WATER 4/1/2008S233 S233 - SB (16') 16 SOIL 4/15/2008 S56 S56 GW 4 WATER 3/31/2008S234 S234 SB (5') 5 SOIL 4/1/2008 S107 S107 - GW 13.5 WATER 4/11/2008S237 S237-SB (20') 20 SOIL 4/3/2008 S167 S167 GW 5.95 WATER 3/31/2008S239 S239 - SB (17') 17 SOIL 4/7/2008 S199 S199 GW 12.4 WATER 4/1/2008S240 S240 - SB (8') 8 SOIL 4/15/2008 S214 S214 GW 7.7 WATER 3/31/2008S254 S254 SB (18.5') 18.5 SOIL 4/2/2008 S234 S234 GW 6.1 WATER 4/1/2008S257 S257-SB(12') 12 SOIL 5/15/2008 S301 S301 GW 4.6 WATER 3/31/2008S258 S258 SB (15.8') 15.8 SOIL 4/2/2008 S309 S309 GW 10.9 WATER 3/30/2008S269 S269 SB (19') 19 SOIL 4/2/2008 S311 S311 GW 6.1 WATER 4/1/2008S278 S278-SB (22') 22 SOIL 4/3/2008 S381 S381 - GW 8 WATER 4/17/2008S287 S287-SB(1') 1 SOIL 5/14/2008 S384 S384 GW 6.95 WATER 3/31/2008S289 S289 - SB (19') 19 SOIL 4/16/2008 S389 S389 - GW 11 WATER 4/17/2008S294 S294-SB (28') 28 SOIL 4/3/2008 S392 S392 GW 7.2 WATER 4/1/2008
������������������ ���������������

TABLE 9 Compounds Detected in Soil and Groundwater Samples
Soil Samples
Analyte
Numberof
Samples
Number of
Detections
Maximum Detection
(ug/kg)
Acetone 69 3 17m,p-Xylenes 69 1 4000
Methyl-t-butyl ether 69 1 3Naphthalene 69 1 3000
o-Xylene 69 1 2100
Groundwater Samples
Analyte
Numberof
Samples
Number of
Detections
Maximum Detection
(ug/l)
Acetone 14 2 14Chloroform 14 1 2
Methyl-t-butyl ether 14 8 83Tetrachloroethene 14 1 7
������������������ ���������������

TABLE 10 Duplicate Vapor Samples Collected
Quarter WeekHome
IDSample Name
SampleDate
Quarter WeekHome
IDSample Name
SampleDate
1 Q1 2 S220 S220-VMP-D 1/24/2008 37 Q2 20 S354 S354-VMP-D 5/28/20082 Q1 3 S309 S309-INA-D 1/30/2008 38 Q2 21 S269 S269-INA-D 6/4/20083 Q1 3 S373 S373-VMP-D 1/30/2008 39 Q2 21 S289 S289-GMPR-D 6/4/20084 Q1 3 S326 S326-INA-D 2/1/2008 40 Q2 21 S301 S301-GMPR-D 6/4/20085 Q1 3 S367 S367-VMP-D 2/1/2008 41 Q2 21 S322 S322-VMP2-D 6/5/20086 Q1 4 S7 S7-AOA-D 2/6/2008 42 Q2 22 S52 S52-INA-D 6/11/20087 Q1 4 S199 S199-VMP-D 2/6/2008 43 Q2 22 S313 S313-AOA-D 6/11/20088 Q1 4 S301 S301-INA-D 2/6/2008 44 Q2 22 S48 S48-GMP-D 6/12/20089 Q1 5 S48 S48-VMP-D 2/13/2008 45 Q2 22 S326 S326-VMP-D 6/12/200810 Q1 5 S294 S294-AOA-D 2/13/2008 46 Q2 22 S121 S121-VMP-D 6/13/200811 Q1 5 S144 S144-VMP-D 2/15/2008 47 Q2 22 S239 S239-GMPR-D 6/13/200812 Q1 5 S234 S234-INA-D 2/15/2008 48 Q2 23 S347 S347-VMP2-D 6/20/200813 Q1 6 S278 S278--INA-D 2/21/2008 49 Q2 23 S390 S390-GMPR-D 6/20/200814 Q1 6 S426 S426-VMP-D 2/21/2008 50 Q2 24 S130 S130-VMP2-D 6/25/200815 Q1 7 S69 S69-VMP-D 2/27/2008 51 Q2 24 S77 S77-GMP-D 6/27/200816 Q1 7 S107 S107-INA-D 2/27/2008 52 Q3 27 S56 S56-GMPR-D 7/16/200817 Q1 7 S70 S70-INA-D 2/29/2008 53 Q3 27 S187 S187-VMP-D 7/18/200818 Q1 7 S138 S138-VMP-D 2/29/2008 54 Q3 28 S213 S213-VMP-D 7/23/200819 Q1 8 S280 S280-VMP-D 3/5/2008 55 Q3 28 S234 S234-GMPR-D 7/23/200820 Q1 8 S140 S140-INA-D 3/7/2008 56 Q3 28 S33 S33-VMP-D 7/25/200821 Q1 8 S203 S203-VMP2-D 3/7/2008 57 Q3 29 S79 S79-VMP1-D 7/30/200822 Q1 9 S187 S187-VMP-D 3/12/2008 58 Q3 29 S134 S134-VMP2-D 7/30/200823 Q1 9 S287 S287-INA-D 3/12/2008 59 Q3 29 S229 S229-VMP-D 7/30/200824 Q1 9 S276 S276-AOA D 3/14/2008 60 Q3 29 S384 S384-GMPR-D 8/1/200825 Q1 9 S358 S358-INA-D 3/14/2008 61 Q3 30 S326 S326-VMP-D 8/6/200826 Q1 10 S257 S257-VMP-D 3/19/2008 62 Q3 30 S322 S322-VMP2-D 8/8/200827 Q1 12 S77 S77-INA-D 4/4/2008 63 Q3 31 S37 S37-VMP-D 8/13/200828 Q2 14 S315 S315-VMP-D 4/16/2008 64 Q3 31 S293 S293-VMP2-D 8/13/200829 Q2 14 S134 S134-GMP2-D 4/18/2008 65 Q3 32 S335 S335-GMPR-D 8/20/200830 Q2 14 S426 S426-VMP-D 4/18/2008 66 Q3 32 S21 S21-VMPI-D 8/22/200831 Q2 15 588 S88-VMP-D 4/23/2008 67 Q3 32 S132 S132-VMP-D 8/22/200832 Q2 15 S48 S48-VMP-D 4/25/2008 68 Q3 33 S339 S339-VMPI-D 8/27/200833 Q2 16 S57 S57-VMP2-D 4/30/2008 69 Q3 33 S416 S416-GMPR-D 8/27/200834 Q2 17 S402 S402-VMP-D 5/7/2008 70 Q3 35 S237 S237-GMPRR-D 9/10/200835 Q2 19 S187 S187-VMP-D 5/21/2008 71 Q3 35 S354 S354-GMPR-D 9/10/200836 Q2 19 S199 S199-GMPR-D 5/23/2008 72 Q3 35 S270 S270-VMP-D 9/12/2008
������������������ ���������������

TABLE 11 Selected Information from Home Surveys
Home ID DateYes/No
Number CommentYes/No
Water in Sump?
CommentYes/No
CommentYes/No
CommentYes/No
CommentCar/Gas Cans in Garage?
Yes/No
CommentYes/No
CommentYes/No
Comment
S7 Feb-08 Yes Bathroom, august 2007 Yes in shed- 1 gallon gas can YesS17 Mar-08 Yes Kitchen - finished 3 weeks ago Yes Repaired this yearS21 Feb-08 Yes 2nd floor bathroom YesS23 Jan-08 Yes Early December 2007 Yes Husband smokes, wife quitS27 Jan-08 Yes painting patch in second floor
S33 Mar-08 Yes 1utility area towards back, non-
neighbor side in front of freezer - has 2" brass cap
Yes yes- one
S36 Feb-08 Yeslast Saturday, 2 shirt and pair of
pants, keep in the carS37 Feb-08 Yes repaired 1 yr ago
S41 Feb-08 Yesyes, last summer 6 months ago whole
interior of house paintedS45 Apr-08 Yes no waterS52 Jun-08 Yes Yes - recently repaired late MayS54 Feb-08 Yes one - occasionally
S56 May-08 Yeskitchen remodeled, whole house
painted finished in April (Feb. to Apr.)S57 Feb-08 Yes kitchen floor/whole kitchen
S73 Jan-08 Yes 1sealed and abandoned with
concreteS77 Apr-08 Yes yes, owner is a smoker Yes not sure, probably 7 days agoS88 Feb-08 Yes Nov. 11 2007 - whole roofS96 Mar-08 Yes Yes hallway 6 months ago
S107 Feb-08 Yes last summer-replacedS120 Mar-08 Yes yes, occasionalS121 Mar-08 Yes No water Yes Bedroom Yes Yes - today - putting in carS130 Feb-08 Yes one Yes 2 weeks ago
S132 Apr-08 Yesno shed, gas lawnmower in
basement
S134 Feb-08 YesDC public works, waste
managements
S138 Feb-08 Yesdidn't check due to period w/out flood
Yes in process of redoing basement floor tile Yes jacket - 2 weeks ago
S140 Mar-08 Yes basement started about 6 months ago Yes one coat last week- wearing Yes furniture repair and refinishing
S143 Mar-08 Yes1st floor bathroom - Feb 2008: some
fixingYes 2 outfits - 2 Saturdays ago
S148 Jan-08 Yes two weeks ago
S150 May-08 YesPainting and drywall work done in rear
basement--exercise roomYes
gas cans, lawnmower, paint supplies all stored in garage
Yes
S176 Jan-08 Yes new roof a week agoS188 Apr-08 Yes 2 weeks agoS194 Jan-08 Yes yes- 3 months ago in October
S200 Feb-08 Yes no water; never runs YesFront porch roof last summer, main
roof 3 years agoS203 Mar-08 Yes yes, 2 weeks ago- replaced Yes grandson smokesS211 Mar-08 Yes put in carpet Yes 1 yr ago - replacedS214 Feb-08 Yes 2 months ago- steps Yes no gas cansS220 Jan-08 Yes recently, will be removedS225 Feb-08 Yes no water
S234 Feb-08 Yesyes, about 4 months ago- living room
and 2nd floor hallwayYes usually smokes outside
S237 Feb-08 Yes Done last year (repaired)
S238 Mar-08 Yes Yes, repaired October 2007 Yes Not anymore as of 2 weeks ago
S239 Feb-08 Yes Back attached sun room, rear of kitchen Yes 2005 and December 2007 Yes shed, gas cans in shed Yes Daughter smokes
S240 Feb-08 Yes Oct-Nov 07S241 Feb-08 Yes about 2 weeks ago
S245 Feb-08 Yesone downstairs & one smoer -
smokes outsideS250 Mar-08 Yes yes, yesterday Yes 8 months ago-repairedS257 Mar-08 Yes repaired two weeks ago (loose flap) Yes over two weeks ago
S258 Jan-08 Yes 1One VMP installed previously
by the EPA in basement.
S267 Mar-08 Yes yes, closet hole repair 6 months agoS270 Mar-08 Yes yes, basement is being remodeled
Pre-Existing VMPs? Basement Sump?Painting/Remodeling in Past 6
months?Roof Repairs in Past Year? Attached Garage? Smokers In House? Dry Cleaning in House? Residents Work with Solvents?
Page 1 of 2
������������������ ���������������

TABLE 11 Selected Information from Home Surveys
Home ID DateYes/No
Number CommentYes/No
Water in Sump?
CommentYes/No
CommentYes/No
CommentYes/No
CommentCar/Gas Cans in Garage?
Yes/No
CommentYes/No
CommentYes/No
Comment
Pre-Existing VMPs? Basement Sump?Painting/Remodeling in Past 6
months?Roof Repairs in Past Year? Attached Garage? Smokers In House? Dry Cleaning in House? Residents Work with Solvents?
S278 Feb-08 Yes 42 in front room under carpet
and 2 in backYes 1 coat - will put in car
S287 Mar-08 Yesyes, in progress- last painting was bathroom 2 weeks ago, basement
painted and tiled 1 to 1.5 months agoYes yes Yes week before last
S289 Mar-08 Yes whole new roof 2 weeks ago
S294 Feb-08 Yesmaybe, will talk to son about
removing it from houseS296 Mar-08 Yes approx. 6 months upstairs roomS301 Feb-08 Yes Yes Yes son smokes sometimesS305 Feb-08 Yes yes, 2 months agoS312 Jan-08 Yes car, gas, lawn mower Yes
S322 Feb-08 Yes
1 PVMP has been installed w/sampling port. hose is kinked thus depth was impossible to
ascertain. >14"
Yes recoated 1 yr ago Yes no shed. no gas cans.
S335 Mar-08 Yes no waterS339 Feb-08 Yes Porch-July Yes 8 months ago repairedS341 Mar-08 Yes oneS342 Mar-08 Yes yes -- in car during samplingS344 Mar-08 Yes 2 weeks agoS347 Feb-08 Yes painted in December 2007- kitchen
S358 Mar-08 Yes Yessump has pumping
problems
S360 Feb-08 Yeskitchen - last April; bedroom - last
month partition
S362 Feb-08 Yesone outfit cleaned more than a
week ago, 2/14/08
S367 Jan-08 Yes Yesbelow intake - stagnant -
completely settles
S373 Jan-08 Yes no water in sumpS380 Feb-08 Yes Yes- last year roof recoating Yes yesS384 Feb-08 Yes decombes picked upS389 Mar-08 Yes replaced one year agoS390 Mar-08 Yes one- smokes outside Yes yes- will put outS392 Feb-08 Yes >= 1 year Yes YesS393 Feb-08 Yes Yes YesS394 Mar-08 Yes painting back bedroom - 3 weeks agoS401 Mar-08 Yes Dec-07 Yes 3 people in basementS402 Mar-08 Yes yes, basement finished October 2007 Yes more than 1 weekS416 Mar-08 Yes Yes, but three weeks agoS419 Feb-08 Yes one coat, wearing Yes yes, just a hobby- paints carsS426 Feb-08 Yes one - wife
Page 2 of 2
������������������ ���������������