rick russo - spie 12 russo... · rick russo laser ablation for chemical analysis: 50 years . laser...
TRANSCRIPT

Lawrence Berkeley National Laboratory
Applied Spectra, Inc
2012 Laser Damage Boulder, CA
September 25, 2012
Rick Russo
Laser Ablation for Chemical Analysis: 50 Years

Laser Ablation for Chemical Analysis: 50 Years
Benefits of Laser Damage!

F. Brech and L. Cross, Optical
Microemission Stimulated by a
Ruby Laser, Applied Spectroscopy
16, p59 (1962)"
Laser Ablation - Chemical Analysis

Laser ablation is the process of removing material from a solid (or occasionally liquid)
surface by irradiating it with a laser beam. At low laser flux, the material is heated by the
absorbed laser energy and evaporates or sublimates. At high laser flux, the material is
typically converted to a plasma. Usually, laser ablation refers to removing material with a
pulsed laser, but it is possible to ablate material with a continuous wave laser beam if the
laser intensity is high enough.
Wikipedia (2011)
Laser Ablation?

Laser Ablation - Chemical Analysis
Plasma
Particles ICP (MS or OES)
LIBS - LAMIS
Laser Ablation
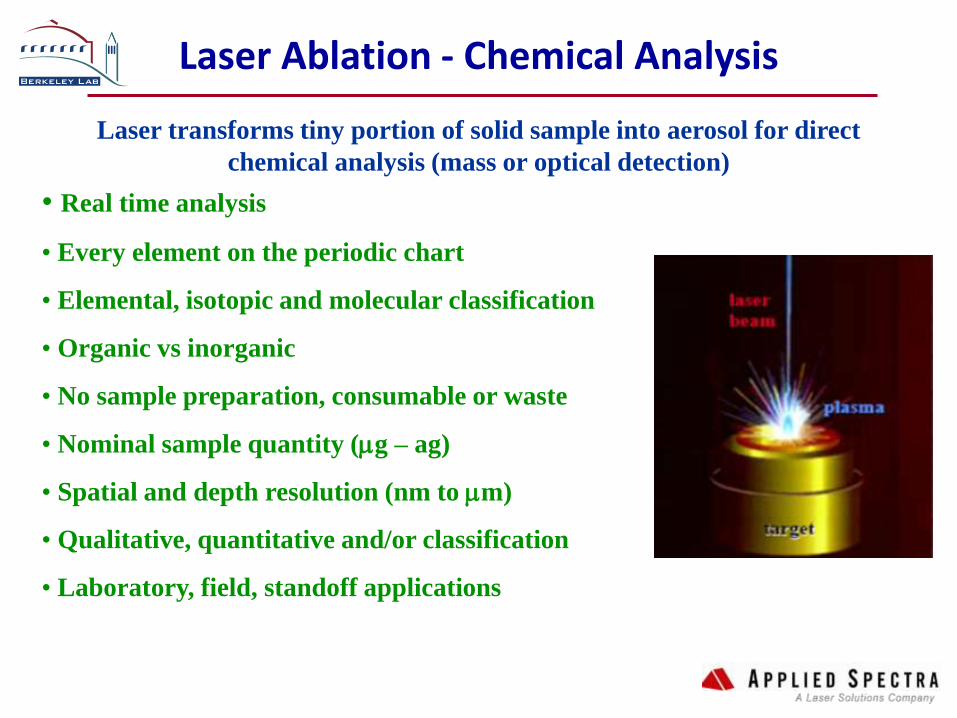
• Real time analysis
• Every element on the periodic chart
• Elemental, isotopic and molecular classification
• Organic vs inorganic
• No sample preparation, consumable or waste
• Nominal sample quantity (mg – ag)
• Spatial and depth resolution (nm to mm)
• Qualitative, quantitative and/or classification
• Laboratory, field, standoff applications
Laser transforms tiny portion of solid sample into aerosol for direct
chemical analysis (mass or optical detection)
Laser Ablation - Chemical Analysis

High power laser beam explodes ‘portion of’ sample!
Nuclear Explosion
Laser Ablation
Theory:
Non-linear processes
Laser material interaction
Laser-plasma interaction
Plasma-sample interaction
Vapor phase processes
Vapor phase chemistry
2
1
3
4
Irradiance
Mea
sure
men
t
Laser Ablation

109
1010
104
105
Nd: YAG Laser, =266nm, tp=3ns, t
d=30ns, t
g=20ns
2X10⁴
ne=B
2
1.45
ne=B
1
0.24
5X10⁴
2X10¹⁰
3X10⁹
7X10¹⁰
Irradiance (W/cm2)
P
las
ma
Te
mp
era
ture
(K
)
Plasma Temperature
1019
3X10¹⁹
T=A2
0.25
T=A1
0.54
5X10¹⁸
2X10¹⁹
Ele
ctr
on
Nu
mb
er
De
ns
ity
(c
m-3
)
Electron number density
Non-linear

109
101 0
101 1
1
10
Cra
ter
de
pth
(m
m)
Laser Power Density (W /cm2)
I=15 GW/cm2
I=21 GW/cm2
Craters, Pits, Laser Targets

Computer
&
Electronics
fs laser
delay stage
photodiode/oscilloscope
mirror
filter
lens
camera
beam splitter
lens
CCD
beam splitter
target BBO double
crystal
400 nm
800 nm, 266nm
Pump and Probe

(pulse energy -- 7.5mJ; pulse length -- 35ps; spot size -- 100mm)
• Two different plasmas
•Air plasma
Disappears in vacuum
Occurs at 0 ps
•Mass plasma
Exists in vacuum
appears at 400 ps
More dense
0 ps 50 ps 150 ps
500 ps 1200 ps
Air plasma
Mass Plasma
Electron and Mass Plasmas

5 ns 68 ns 200 ns
400 ns
500 mm
Shock wave
propagates in ns
Larger particles
are ejected after
0.4 ms
1.3 ms 20 ms
Sa
mp
le Su
rface
Laser
Shock Waves and Particles

284 285 286 287 288 289 290 291 292 293
0
5000
10000
15000
150ns delay
50ns delay
30ns delay
10ns delay
Inte
ns
ity
( A
rb.
un
it )
Wavelength (nm)
Nanosecond Femtosecond
Laser Induced Plasmas
0 100 200 300 400 500
0
5000
10000
15000
20000
25000
30000
35000
Pe
ak in
ten
sity o
f sp
ectr
al lin
e (
a.u
.)
time (ns)
ns laser
fs laser

• ISW = internal shockwave
ESW = external shockwave
• Laser-sample interaction
(~few fs to ~few ns)
• Vapor plume expansion
(~few ns to ~1ms)
• Radiative cooling
(~1ms to ~100ms)
• Vapor plume condensation
(~100ms to ~100ms)
Process simulation based on time-resolved measurements of plasma plume
Fundamental Processes

Pulsed Laser
Gas
LA-ICP-MS
J100 (+) fs LA-ICP-MS
• LA-ICP-MS:
Direct solid sampling
Eliminates sample preparation
Depth profiling, inclusion, & spatially resolved analysis
Rapid & high throughput

fs-N1711 Al base alloy ns-N1711 Al base alloy
0 10 20 30 40 50 60 70 80 90 100
-25
-20
-15
-10
-5
0
5
10
15
20
25
mm
mm
ns-N1711
fs-N1711
0 50 100 150 200 250 300 350 400 450
104
105
106
107
108
109
1010
ICP
S
Time (sec)
66Zn-ns-1u
66Zn-fs-1u
ns fs
Particle size and chemistry depends
on laser parameters! Nanoparticles
Laser Ablated Particles

0 50 100 150 200 250 300 350 400
101
102
103
104
105
106
107
Inte
gra
ted
co
un
ts p
er
se
co
nd
(IC
PS
)
Time (s)
88
Sr (N612)
88
Sr (Granite)
0 50 100 150 200 250 300 350 400
104
105
106
107
108
109
1010
Inte
gra
ted
co
un
ts p
er
se
co
nd
(IC
PS
)
Time (sec)
27
Al (N612)
27
Al (Granite)
0 50 100 150 200 250 300 350 400
101
102
103
104
105
106
107
Inte
gra
ted
co
un
ts p
er
se
co
nd
(IC
PS
)
Time (s)
90
Zr (N612)
90
Zr (Granite)
NIST 612 and granite at 6um spot, 40mm/sec and 20KHz. The signal response can be used to provide ‘level’ of
inhomogeneity in the sample. Integrated signal provides bulk analysis. More scan time leads to bulk properties from
inhomogeneous samples.
Rapid Analysis of Bulk Samples

Sample
RT100 LIBS/LAMIS
Optical emission from the plasma – every element in the sample emits light at a characteristic wavelength when heated to emission – fireworks!
LIBS = Laser Induced Breakdown Spectroscopy
LIBS

ChemCam (LIBS):
• 30 elements at once
• Three spectrometers
• Analysis time 1-3 min
• Standoff range 2-9 m
Curiosity
NASA Mars Rover

Everything has a unique elemental fingerprint – a chemical “Barcode”
Classification and Discrimination Analysis
Cancer Toxins Products

Forensics

plants soils
Classification

603 604 605 606 607 608 609 610
2000
3000
4000
5000
6000
7000
8000
Cu
O e
mis
sio
n
Wavelength (nm)
Sample CuO
279 280 281 282 283 284 285 286
0
500
1000
1500
2000
2500
3000
3500
Mg (
I) 2
85.2
1 n
m
Al(
II)
281.6
2 n
m
Mg (
II)
280.2
3 n
m
Mn (
II)
279.8
3 n
mM
g (
II)
279.5
5 n
m
Inte
nsity (
a.
u.)
Wavelength (nm)
NIST Al alloy
Delay time: 0.5 ms
Gate width: 0.5 ms
1064 nm Nd:YAG laser
Mg (
II)
279.1
0 n
m
Emission Spectra for Isotopes Emission spectrum for Elements
LIBS LAMIS
605 606 607 608 609 610 611 612 613 614 615
4000
6000
8000
10000
12000
Sample:CeO2
Em
issio
n In
ten
sity
Wavelength (nm)
LAMIS: Laser Ablation Molecular Isotopic Spectroscopy

0.1 1 10 100
100
101
102
103
104
105
106
Em
issio
n in
ten
sit
y
Time (ms)
B ion emission
B atom emission
BO molecule emission (A-X)
BO molecule emission (B-X)
Molecules form
later in time
as plasma cools
LIBS LAMIS
Atoms/ions form
early in plasma

208.945 208.950 208.955 208.960 208.965
0
4
8
10B
11B
Em
issio
n Inte
nsity
Wavelength (nm)
B-O Molecular Emission (atm pressure) Boron Atomic Emission (low pressure)
D = 2.5 pm D = 730 pm
Atomic isotopic shift not resolved at atm pressure!
254.5 255.0 255.5 256.0 256.5 257.0 257.5 258.0 258.5 259.0
5000
5500
6000
6500
7000
7500
8000
8500
9000
9500
10B 20.24%
Natural abundance 19.9% (18.9-20.3)
Em
issio
n In
ten
sity
Wavelength
Experiment
Fitting
10B
11B
Atomic vs Molecular Spectra

579 580 581 582 583 584
406080
100120140160180
LA
MIS
In
ten
sity (
arb
. u
nit)
10B
0.05
11B
0.95O
10B
0.8
11B
0.2O
10B
0.99
11B
0.01O
Wavelength (nm)
6080
100120140160180
10B
0.2
11B
0.8O
6080
100120140160180
10B
0.52
11B
0.48O
6080
100120140160180
6080
100120140160180
0 20 40 60 80 100
0
20
40
60
80
100
Ca
lcu
late
d 1
1B
Co
nce
ntr
atio
n
Standard 11
B Concentration
Quantitative analysis using Chemometrics
Atmospheric pressure – single laser pulse
10/11 Boron ratio
Isotope Abundance Ratio Calibration

Ce-O Emission
605 606 607 608 609 610 611 612 613 614 615
4000
6000
8000
10000
12000
Sample:CeO2
Em
issio
n In
ten
sity
Wavelength (nm)
W-O emission 480.0 480.5 481.0 481.5 482.0 482.5 483.0 483.5 484.0
17000
18000
19000
20000
21000
22000
WO
em
issio
n
Wavelength (nm)
Sample W
Other Elements/Isotopes

LIBS system
Beam size (D) ~ aperture size (a<< ) in near field
Near-field Gap distance (d1) ~ aperture size (a)
Near-field optics
Nanometer Spatial Ablation and Analysis
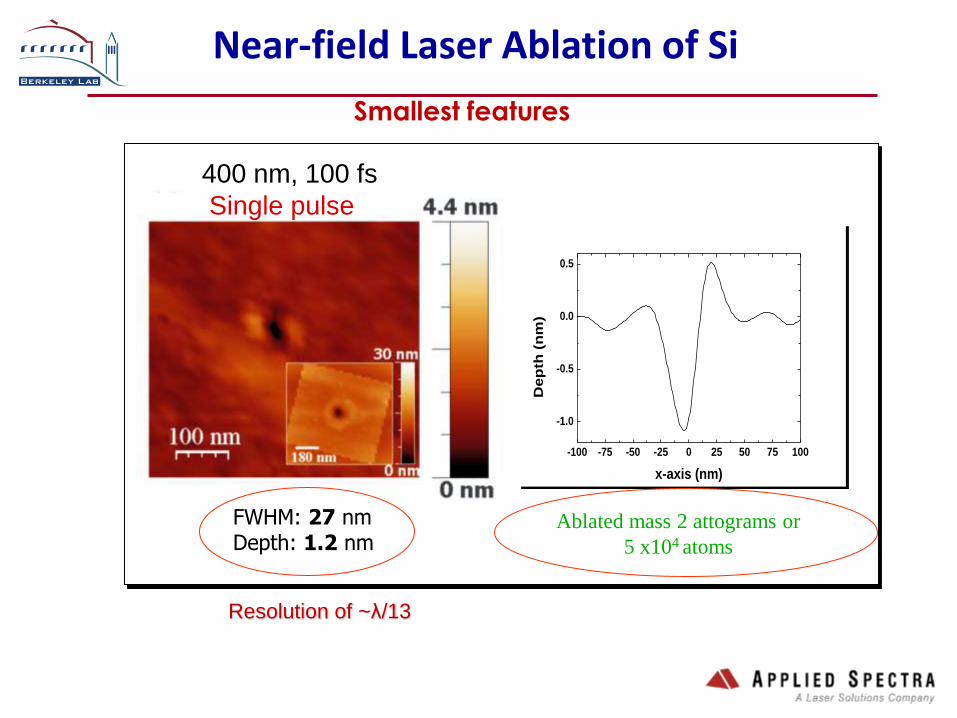
FWHM: 27 nm Depth: 1.2 nm
Resolution of ~λ/13
400 nm, 100 fs
Single pulse
Smallest features
-100 -75 -50 -25 0 25 50 75 100
-1.0
-0.5
0.0
0.5
Dep
th (
nm
)
x-axis (nm)
Ablated mass 2 attograms or
5 x10⁴ atoms
Near-field Laser Ablation of Si

Femtosecond Far-Field LIBS
Minimal detectable Na mass : 220·10-18 gr
Heig
ht
(nm
)
AFM surface map Spectral emission
-2 0 2-200
-100
0
100
200
Single-pulse ablation in air
450 nm
Surface Profile
He
igh
t (n
m)
X (μm) Wavelength (nm)
Na

LIBS Nanometer depth profiling
0 10 20 30 40 50
0 10 20 30 40 50
C2
C
F
P
Li
O
H
Laser Induced plasma Spectroscopy
# laser pulses
No
rmal
ize
d In
tegr
ated
Inte
nsi
ty (
a.u
.)
SEI layer (~50nm)
HOPG basal plane
Depth resolution
Model System: Highly Oriented Pyrolytic Graphite (HOPG) electrode at 0.7V vs. Li/Li+ in LiPF6/EC-DEC (1:2) electrolyte
Sample
7nm depth resolution!

Laser Ablation: Analytical Spectroscopy
• Rapid, real-time analysis (no sample preparation)
• Elemental, isotopic, classification
• Sub-micron (nanometer) depth and spatial analysis
• Sensitivity – attogram absolute mass detection
• Monitor of Laser Damage (external and internal)
Summary
LAMIS

Co Authors:
Jhanis J. Gonzalez, Vassilia Zormpa, Inhee Choi, Javier Ruiz.
Lawrence Berkeley National Laboratory (USA)
Alexander A. Bolshakov, Jong H. Yoo
Applied Spectra, Inc. (USA)
Thank You
Funding:
Department of Energy
Defense Threat Reduction Agency
NASA
SBIR