richard p. feynman - theoretical physicist...
TRANSCRIPT


The Interagency Monitoring of Protected Visual Environments (IMPROVE) Program is a cooperative air quality monitor-ing effort between federal land managers; regional, state and tribal air agencies; and the Environmental Protection Agency.The IMPROVE monitoring program was established in 1985 to aid in the implementation of the 1977 Clean Air Act goal ofpreventing future and remedying existing visibility impairment in 156 Class I areas (National Parks, Wilderness Areas, andWildlife Refuges). The network began operating in 1988 and currently consists of 163 monitoring sites collecting aerosoland optical data. These data are critical for the implementation of our national goal to reduce regional haze in Class I areasby establishing the current visibility conditions, tracking the progress toward attaining the goal, and identifying the chem-ical species and emission sources responsible for existing visibility impairment.
Grand Canyon National Park is among the most extensively monitored parks in thecountry. Qualitative measurements of air quality were first made in 1972. Scene mon-itoring to document haze impacts on scenic views began in September 1983. Moreintensive visibility monitoring was initiated in July 1987 with the installation of a trans-missometer, nephelometer, and particle sampler. IMPROVE protocols began in 1988and are overseen by Carl Bowman, Air Quality Program Director, who also overseesGrand Canyon's Dataram real-time smoke monitoring program. In 1989 an additionaltransmissometer and a particle sampler were installed to sample inner canyon air. Inaddition to visibility monitoring, Grand Canyon participates in numerous other airquality monitoring programs. The National Park Service Gaseous PollutantMonitoring Network and EPA Clean Air Status and Trends Network (CASTNet) measureozone, sulfur dioxide, and dry acid deposition. Precipitation samples are analyzed foracidity and various dissolved pollutants as part of the nationwide National TrendsNetwork (NTN). Ultraviolet radiation is measured as part of the USDA national UV-Bmonitoring network, and dioxin levels are measured through the National DioxinAmbient Monitoring Network (NDAMN).
Air pollution impairs visibility at Grand Canyon N.P., obscuring views to some extent90% of the time. Visibility today is 60 miles less than it would be under natural con-ditions and averages about 20% worse in the inner canyon as compared to visibilityon the rim. The rich history of monitoring and intensive monitoring campaigns overthe years have supplied a long term, high quality record of many air quality parame-ters. These measurements enable us to understand the nature of the air qualityproblem and to identify major sources contributing to the problem.
Through cooperative research programs involving federal and state agencies, andwith the active participation of industry, the contribution of two power plants on theColorado Plateau has been identified. As a result, these plants are installing, or haveinstalled, pollution control equipment to reduce emissions. However, the visibilitycontinues to be degraded from sources both in the vicinity of the park and from thoselocated up to hundreds of miles away. To find further solutions to the air quality prob-lem at Grand Canyon National Park, resource managers are actively participating inthe Western Regional Air Partnership (WRAP). WRAP is a cooperation consisting of13 western states, tribes, the U.S. Departments of Agriculture and the Interior, and theEPA working to address regional air quality problems and find solutions to regionalhaze across the western states.
Hazy and Clear Days
For current visibility, see the Web cam at www2.nature.nps.gov/ard/parks/grca/grcacam/gracam.htm.

Located near theYavapai Museum,the IMPROVE trans-missometermeasures air qual-ity between the rimand the receiverstation at PhantomRanch in the innercanyon.
Grand Canyon's innercanyon aerosol sam-pler is located atIndian Gardens and isaccessible only byfoot.
HHeerrnnaannAAbbrreeaauuwas born inPuerto Rico.As a biolo-gist for theU.S. Fish andWildlifeService, heworked formany yearson theEndangeredPuerto Rican Parrot Project. In 2001 Hernan movedto Grand Canyon National Park with his wife andtwo daughters, becoming an integral part of the airmonitoring programs. IMPROVE site operationsinclude a weekly hike of 4.5 miles descending 3600feet below the rim to service the inner canyonaerosol monitor ("a task I very much enjoy!"). Inaddition, Hernan reviews data, maintains the visibil-ity web cam, and helps as needed with the Dataramsmoke monitoring program. Data collection per-centages at Grand Canyon are impressive; bothoptical and aerosol data collection was 100% forthe 2nd and 3rd quarters of 2002!
The Abyss air qualitymonitoring site,located near HopiPoint, is the center forcollecting meteorolog-ical, ozone, sulfurdioxide, and wet/drydeposition data.
“We are at the very beginning of time for the human race. It is not unreasonable that wegrapple with problems. But there are tens of thousands of years in the future. Our respon-sibility is to do what we can, learn what we can, improve the solutions, and pass them on.”
Richard P. Feynman - Theoretical Physicist 1918-1988
IMPROVE particlesampling day
Change IMPROVEparticle cartridges.
IMPROVE particlesampling day
IMPROVE particlesampling day
IMPROVE particlesampling day
IMPROVE particlesampling day
Change IMPROVEparticle cartridges.
Special IMPROVEparticle change.Move cassette #3from old cartridgeto new cartridge.IMPROVE particlesampling day
IMPROVE particlesampling day
IMPROVE particlesampling day
St. Patrick’s Day
ARS: Optical:Carter Blandford or
Dave Beichley Photography:Karen Fischer
(970) 484-7941
Spring Begins
IMPROVE particlesampling day
IMPROVE particlesampling day
UC-Davis: Sampler :General Lab
(530) 752-1123
100th Anniversaryof the creation ofthe National WildlifeRefuge System
Special IMPROVEparticle change.Move cassette #3from old cartridgeto new cartridge.IMPROVE particlesampling day

Cameras and time-lapse video record the changingappearance of a scene as haze levels, lighting, cloudcover, and vegetation vary.
Located in the Monongahela National Forest of West Virginia, theBearden Knob monitoring site is located 10 miles equidistant from theDolly Sods and Otter Creek Class I Wilderness Areas. The monitoringlocation was chosen to be representative of air quality conditions com-mon to both wilderness areas. The Wilderness Act of 1964 mandates theForest Service to manage these areas as "a place where protection ofnatural processes is the highest priority use.”
The plant life and climate in this part of the southern Appalachiansresembles northern Canada, and many species found here are near theirsouthernmost range. These ecosystems are particularly sensitive to wetand dry deposition. Spruce and fir forests found at higher elevations aremore susceptible to the effects of acid deposition than other types offorests, especially where clouds can be as acid as vinegar. At elevationsabove 3,000 feet the fragile high elevation lakes and perennial streams ofthe area have low acid neutralizing capacity and the Forest Service isconcerned about chronic acidification.
IMPROVE aerosol sampling began in the Dolly Sods / Otter Creek area inSeptember 1991. Current IMPROVE data show that half the time visibil-ity is 32 miles or less, and on 10% of the haziest days visibility is lessthan 15 miles. Current average annual visibility at Dolly Sods / OtterCreek is about 24 miles compared to the natural visibility of 90 miles.Sulfate particles are by far the greatest contributor to this visibility-reducing haze, and the sulfur dioxide emissions that produce sulfatescome largely from coal combustion.
Clear and Hazy Days
All IMPROVE program sites conduct aerosol monitoring.Aerosol samples give information about the type of parti-cles that affect visibility. Through sample analysis, particlesize, chemical composition and concentration are charac-terized. Particle measurements in conjunction with opticalmeasurements allow estimation of the sources of visibility-reducing aerosols and causes of impairment.
Scene Monitoring
Aerosol Monitoring
Optical Monitoring
The transmissometer makes a long path measurementof extinction (the total amount of light lost over a view-ing path due to both scattering and absorption).
Nephelometers and transmissometers record the opti-cal characteristics of the atmosphere, providingmeasurements from which estimates of visual rangecan be calculated. Optical measurements cannot beused to identify sources of air pollution.
The integrating nephelometer makes a point or localizedmeasurement of scattering due to atmospheric particlesand gases.
Monitoring methods can be categorized into three classes:

Air Quality moni-toring at BeardenKnob, WV, andLLaayynnee GGooddwwiinnseem almost inex-tricable. Injuriesfrom a car acci-dent while workingfor the WestVirginia StatePolice necessi-tated Godwin'sretraining in com-puter technologiesand then as a siteoperator at theNortheastern
Research Station of the Forest Service in 1991.Since then, much of the site's evolution mirrorsLayne's dedication and initiative. He commutes tothe site every other day - an hour "in good weather" -from home in Elkins, West Virginia. The CanaanValley - home to the three East Coast ski resorts of
Canaan Valley, Timberline, andSnowshoe - has some of the fiercestweather in the lower 48, rivaling evenfrigid climes like International Falls,MN for the distinction of the "coldestspot in the nation." Layne describesone 7-foot snow day in particular andthe more routine winter temperaturesof -30 degrees as one of the more fin-ger-numbing challenges of monitoringhere.
Although being a father to four boyskeeps him busy, Layne maintains anexemplary data capture history,including 100% aerosol and neph-elometer data collection in thesecond quarter of 2002! In additionto two Anderson particulate samplers
employed to QA/QC IMPROVE monitoring, Layneservices an ozone monitor, sulfur dioxide/nitrogenoxide gas monitors, and a full complement of mete-orological instruments.
Bearden Knob air quality monitoring site.
Rain GaugeTippingBucket
“Of all ebriosity, who doesnot prefer to be intoxicatedby the air he breathes?”
Henry David Thoreau
IMPROVE particlesampling day
Change IMPROVEparticle cartridges.
IMPROVE particlesampling day
IMPROVE particlesampling day
IMPROVE particlesampling day
IMPROVE particlesampling day
IMPROVE particlesampling day
IMPROVE particlesampling day
Change IMPROVEparticle cartridges.
Change IMPROVEparticle cartridges.
IMPROVE particlesampling day
Daylight SavingTime Begins
UC-Davis: Sampler :General Lab
(530) 752-1123
ARS: Optical:Carter Blandford or
Dave Beichley Photography:Karen Fischer
(970) 484-7941
IMPROVE particlesampling day
Change IMPROVEparticle cartridges.
Special IMPROVEparticle change.Move cassette #3from old cartridgeto new cartridge.IMPROVE particlesampling day

The standard IMPROVE particulate sampler has four sampling mod-ules. Modules A, B, and C collect fine particles (2.5 microns andsmaller (PM2.5)), while Module D collects larger particles. Fine parti-cles have the greatest impact on visibility, can adversely affect humanhealth, and are often the result of human activities. Module D collectsparticles 10 microns and smaller (PM10). The coarse mass (particleslarger than 2.5 microns) is primarily composed of soil and carbona-ceous material and is often of natural origins. The aerosols areseparated by size using a cyclone shown in the figure below.
The Seney National Wildlife Refuge is found in the UpperPeninsula of Michigan, midway between the Great Lakes ofMichigan and Superior. The 96,000-acre refuge includes 25,150acres of Class I wilderness, encompassing string-bog wetlandsand a mosaic of other habitats, including cedar swamps, oldgrowth hemlock, white pine, and a mixture of upland spruce, fir,pine, aspen, and northern hardwoods.
IMPROVE monitoring began at Seney in December 1999 as part ofthe network expansion called for by the U.S. EPA regional hazeregulations. The National Atmospheric Deposition Program beganmonitoring the following year. In 2002 the Midwest RegionalPlanning Organization, the state of Michigan, and the U.S. Fish andWildlife Service began a cooperative effort to better understand thecauses of regional haze in the upper Midwest. Continuous PM 2.5mass, ozone, meteorology, light scattering (nephelometer), anddaily speciated PM 2.5 monitoring are conducted at the site.
IMPROVE data show current annual average visibility at Seney isabout 47 miles, compared to natural visibility of 90 miles. In gen-eral, sources that contribute to air quality impacts at Seneyinclude paper mills and electric generating plants. Studies atSeney have found high mercury concentrations in some largepredatory fish, and vegetation surveys show ozone injury to sev-eral species of plants including milkweed.
Filter analysis provides concentrations and composi-tion of atmospheric particles. Common fine particlesinclude sulfates, nitrates, organic material, elementalcarbon (soot), and soil. An indication of sources canbe obtained from the analysis of trace elements.
vanadium/nickel petroleum-based facilities, autos
arsenic copper smeltersselenium power plantscrustal elements soil dust (local,
Saharan, Asian) potassium (non-soil) forest fires
Module APM 2.5(Teflon)
PM 2.5 mass,over 30 ele-ments, andabsorption
Module BPM 2.5(nylon)sulfate,
nitrate, nitrite,& chloride
ions
Module CPM 2.5(tandemquartz)
organics and elemental
carbon
Module DPM 10 mass
(Teflon)
CarbonateDenuder
Controller
The IMPROVE fine particle modules employ a cyclone at the air inletwhich spins the air within a chamber. Fine particles are lifted into theair stream where they will be siphoned off and collected on a filtersubstrate for later analysis. The large particles impact on the sides ofthe chamber and fall into a collection cup at the bottom.
IMPORTANT: VALID MEASUREMENTSA visibility impairment value is calculated for eachsample day. To get a valid measurement, all four mod-ules must collect valid samples. The Regional HazeRegulation uses the average visibility values for theclean days and the worst days. The worst days aredefined as those with the upper 20% of impairment val-ues for the year, and the clean days as the lower 20%.The goal is to reduce the impairment of the worst daysand to maintain or reduce it on the clean days. Theannual values for each five-year block will be aver-aged, and trends examined. For your site's data to beconsidered under the Regional Haze Regulations, cri-teria have been set to determine the minimum numberof daily samples needed to have a valid year. Becauseconcentrations of the groups vary seasonally, thereare both annual and seasonal criteria. The criteria are:
75% of the possible samples for the calendar year must be complete.50% of the possible samples for each calendar quarter must be complete.No more than 10 consecutive samplingperiods may be missing.
The Seney Web cam is part of the Midwest Regional PlanningOrganization's (RPO) visibility camera network. The network includesseven Web-based cameras providing the public with current imagesand air quality conditions. For current visibility from the Seney firetower see the Web cam at www.mwhazecam.net/seney.html.
AirIn
AirOut
Air Flow
SmallParticles
LargeParticles
Filter
Pump
The version II aerosol sampler was introduced into theIMPROVE network in 1999. It employs a new micro-processor controller and implements an upgraded filtercassette design. IMPROVE aerosol data are used forassessing the contribution of various sources to haze.In addition, these data are the basis for trackingprogress related to the regional haze regulations.

The air quality monitoring site at Seney is the loca-tion of air quality sampling systems for a numberof programs including EPA's Clean Air Status andTrends (CASTNet) and IMPROVE networks, theNational Atmospheric Deposition Program (NADP),and other special monitoring programs initiated tobetter understand the causes of haze at Seney.
MarilynHeet, wife ofAssistantRefuge ManagerGary Heet, isthe IMPROVEsite operator atSeney. Marilyndraws upon 22years of experi-ence working asa medical labo-ratory technician and is motivated by her concernfor the environment. Marilyn’s diligence resulted inan aerosol data completeness of 96% for 2002!
The Heets live in Gulliver, Michigan, about 30 milessouth of the refuge. They have been married for 30years and have two sons; David, age 19, attends BayCollege in nearby Escanaba, and Andrew, age 17, isa senior in high school. Marilyn enjoys gardening,reading, sewing, and card games. She also lovesanimals and wildlife. At present, the Heet's house-hold includes five cats, one guinea pig, one horse, aSpringer spaniel, a Brittany, and Marilyn's newPomeranian, Lassie. Marilyn is also active in avian
rehabilitation,primarilyhawks andowls. Garylikes to fishand hunt anddeal in antiquebottles, arrow-heads, andother items onEbay.
Marilyn on top of the shelter hous-ing the nephelometer and meteor-ological towers. Lassie oftenaccompanies Marilyn to the site.
“No sensible decision can be made anylonger without taking into account not onlythe world as it is, but the world as it willbe.”
Isaac Asimov
Change IMPROVEparticle cartridges.
IMPROVE particlesampling day
IMPROVE particlesampling day
IMPROVE particlesampling day
Change IMPROVEparticle cartridges.
IMPROVE particlesampling day
IMPROVE particlesampling day
Mother’s Day
UC-Davis: Sampler :General Lab
(530) 752-1123
ARS: Optical:Carter Blandford or
Dave Beichley Photography:Karen Fischer
(970) 484-7941IMPROVE particlesampling day
IMPROVE particlesampling day
Armed Forces Day
Memorial Day
IMPROVE particlesampling day
Special IMPROVEparticle change.Move cassette #3from old cartridgeto new cartridge.IMPROVE particlesampling day
Special IMPROVEparticle change.Move cassette #3from old cartridgeto new cartridge.IMPROVE particlesampling day

The IMPROVE network operates on the one-day-in-three protocol. Sample change is always onTuesday. (Arrangement of ambient filters varieseach week; pattern repeats every third week.)
FFoorr ttwwoo ooff tthhee tthhrreeee wweeeekkss, the sampler willnot be operating on the sample-changing day theoperator records final readings, replaces old car-tridges, and records the initial readings. Therewill be initial or final readings for the filter in posi-tion 3 on two of the three weeks. The log sheetand display indicate when values for position 3are recorded.
EEvveerryy 33rrdd wweeeekk,, the sampler will be operatingwhen the operator arrives. When sample changeis initiated the controller will:
Suspend sampling.Read flow rates on all filters and displayand record information. Transfer the cassette in position 3 fromthe old cartridge to the new one. (New car-tridges have no cassette in position 3.The cassette in position 3 has a black O-ring attaching it -- the only one that can beremoved without a special tool.) Transfer the cassette and install a new car-tridge. After the initial readings are taken,the sampler will resume collection on thefilters in position 3.
The field blanks in position 4 are transparent tothe operator and to the sampler controller. Flowrate measurements are not taken for field blanks.
FFoorr qquueessttiioonnss oorr pprroobblleemmss wwiitthh::FFiilltteerr bbooxxeess,, ffllaasshhccaarrddss,, aanndd ssaammpplleecchhaannggeess:: contact Sujan Bhattarai, JoanHancock, Jose Avena, Jose Mojica, or StevenIxquiac at (530) 752-1123.CCoonnttrroolllleerrss,, eeqquuiippmmeenntt mmaallffuunnccttiioonnss,, ssaamm-pplleerr mmaaiinntteennaannccee,, aanndd ffllooww aaddjjuussttmmeennttss::contact Jose Mojica at (530) 752-9044, {or cellphone number (530) 867-4391}, or Steven Ixquiacat (530) 752-4108 {or cell number: (530) 304-1468}.SSaammpplleerr aauuddiittss:: Steven Ixquiac (see above).
Comprised of a cluster of islands on the Maine coast, Acadia National Park is positionedwithin the broad transition zone between eastern deciduous and northern coniferous forests.The park hosts several species of plant communities at the edge of their geographic range.While surrounded by the ocean, the entire fabric of Acadia is interwoven with a wide variety offreshwater, estuarine, forest, and intertidal ecosystems. Pollutants from the industrializedMidwest and metropolitan northeast are transported into the park with the winds. Acadia wasnamed one of five most polluted parks by the National Parks Conservation Association in their2002 Code Red: America's Five Most Polluted Parks report.
Acadia National Park has had an air quality monitoring program since 1979. Acadia's airresource program is collaborative, involving the National Park Service Air Resources Division,the Maine Department of Environmental Protection, the U.S. Geological Survey, EPA, universi-ties, and other states. By studying the effects of air pollution on park plants, soil, and water,park managers hope to learn how to protect these resources and the views for which the areais well known. Acadia is one of 14 national parks established as regional index sites to mon-itor environmental stressors and related ecosystem response.
IMPROVE monitoring began at Acadia in 1987 and includes optical, scene, and aerosol moni-toring. Monitoring data show that visibility conditions have improved slightly from 1988through 1998, but visibility levels are still less than half what they should be at "natural back-ground" levels. Summertime visibility averages about 33 miles. Scientists estimate thatapproximately 70%of Maine’s polluted air comes from outside the state.
Summer ozone levels occasionally exceed federal health standards. The highest ozone con-centration reported in Maine was measured at Acadia (Isle au Haut) on June 15, 1988. Ozoneconcentrations above the federal health standard have been shown to damage sensitive parkvegetation.
The effects of atmospheric deposition are another major concern at the park. Acadia's rockysoils give streams little protection from acid rain. Some of the park's headwater streams haveexperienced episodic acidification, with a pH less than 5.0, between that of black coffee andtomato juice. For two decades, the average pH for precipitation has ranged between 4.4 and4.6, and fog pH has measured as low as 3.0.
Recent studies discovered high concentrations of mercury in several freshwater fish speciessampled in park lakes. The major source of mercury in lakes appears to be deposition fromthe atmosphere, and it then concentrates in the food chain.
Each “blue box” contains:
1 flash memory card3 labeled Ziplock88 bags1 bag/week labeled with
install date and 4 color-coded cartridges, onefor each module.
Stack of filter cartridgeswith log sheet.
Four cartridges:Red for Module AYellow for Module BGreen for Module CBlue for Module D
The "blue box" has three dates listed on the box.These are the dates on which the filters must beinstalled (all Tuesday dates).
If for any reason you or your backup cannot make achange on a particular Tuesday or the "blue box" islate, or for any problem or question, immediatelycall UCD’s General Lab at (530) 752-1123.Discussing a problem first will avoid confusion, anda proper diagnosis is more likely to be made. NOproblem is too small; it could be a sign of biggerproblems, such as unusual readings. E-mail toUCD field operations should only be used if phonecontact cannot be made. E-mail addresses are inthe format of [email protected].
Clear, Hazy, and Very Hazy Days
For current visibility, see the Web cam at www.hazecam.net/acadia.htm.

IMPROVE site opera-tor Bill GGawleyhas assisted Acadia'sAir ResourceManagement headBob Breen since1993. Bill is a singer-songwriter in the folktradition and has cre-ated an album of hiswork on CD. He sayshe has even moretime to devote to that interest now that his threechildren are in college and long cold winters keephim inside. Data recovery here is always one of thehighest in the nation. Optical data collected atAcadia was near 100% during the first three quar-ters of 2002, while aerosol data completeness wasnear 90% for the year.
Nephelometer tower with Webcam looking NE toward Round
Mountain 20 miles distant
IMPROVE monitor-ing site at McFarlandHill near CadillacMountain
Meteorological tower atMcFarland Hill
“The air was so elastic and crystalline that it had the sameeffect on the landscape that a glass has on a picture, togive it an ideal remoteness and perfection.”
Henry David Thoreau, A Week on the Concord and Merrimac Rivers
IMPROVE particlesampling day
Change IMPROVEparticle cartridges.
IMPROVE particlesampling day
IMPROVE particlesampling day
IMPROVE particlesampling day
Change IMPROVEparticle cartridges.
Special IMPROVEparticle change.Move cassette #3from old cartridgeto new cartridge.IMPROVE particlesampling day
IMPROVE particlesampling day
Father’s Day
UC-Davis: Sampler :General Lab
(530) 752-1123
ARS: Optical:Carter Blandford or
Dave Beichley Photography:Karen Fischer
(970) 484-7941
IMPROVE particlesampling day
IMPROVE particlesampling day
Flag Day
IMPROVE particlesampling day
Change IMPROVEparticle cartridges.
Summer Begins
IMPROVE particlesampling day

Mammoth Cave National Park has the longest recorded cave system in the world.It is located in the scenic Green and Nolin River valleys of south central Kentucky.Many natural resources in the park are subject to unfavorable influences from avariety of sources due to its proximity to some of the nation's most polluting coal-fired utility plants in the nearby Ohio Valley. Many of these utilities were built beforethe passage of the 1977 amendments to the Clean Air Act and are subject to lessstringent regulations. Mammoth Cave was named the third most polluted nationalpark in the National Parks Conservation Association's 2002 report Code Red:America's Five Most Polluted Parks.
Air quality monitoring at Mammoth Cave National Park began in 1992, and currentmonitoring is extensive. Measurements include IMPROVE aerosol, scene, and lightscattering (nephelometer) measurements in addition to ozone, sulfur dioxide, car-bon monoxide, nitric oxide, and total reactive nitrogen. Atmospheric depositiondata including mercury are collected through the National Acid Deposition Program(NADP), and the National Dry Deposition Network (NDDN). Air quality monitoringhas led to a better understanding of impacts on Mammoth Cave resources.
Three out of every four park visitors never venture underground but insteadenjoy the park's 70 miles of trails with scenic views of rolling forested hills andvalleys. Estimated annual average natural visibility at Mammoth Cave is 113miles. Currently, air pollution reduces average visual range to approximately 14miles from June through August. Visibility may get worse. There are 26 newpower plants proposed over the next five years, of which eight will be coal-fired.
Mammoth Cave has one of the highest nitrate and sulfate loadings of anynational park. Current rainfall can be 10 times more acidic than natural condi-tions.
Mammoth Cave often measures high ozone concentrations. Scientists areinvestigating whether ozone exposure in the park reduces growth in blackcherry and sycamore trees, both ozone-sensitive species that provide key nest-ing grounds for an endangered species, the Indiana bat.
Mercury concentrations may impact the park's seven endangered freshwa-ter mussel species.
Air resource manager Bob Carson represents Mammoth Cave in the VisibilityImprovement State and Tribal Association of the Southeast (VISTAS) RegionalPlanning Organization. The organization is a collaborative effort of state govern-ments, tribal governments, and various federal agencies established to initiate andcoordinate activities associated with the management of regional haze, visibilityand other air quality issues in the Southeastern United States.
1. Clean A and D module fil-ters must be pre-weighedon a balance before ship-ping the blue box. Clean Band C module filters aresimply placed in a cassettewithout being weighed.This process is calleduploading.
2. The uploader weighs theA and D filters. Each filterhas an ID according to thesite it will be sent to and thedate that the filter will beused. Each A and D filter’sweight is automaticallyrecorded in a database.
3. After the box has beenuploaded, the work is dou-ble-checked. This is thefinal process before thebox is shipped out.
4. After the log-sheets andflashcards are removedfrom the box, the data inthe flash card is read andautomatically placed intoa database.
5. After the flash card isread into the database, itsdata is compared to thedata written on the logsheets. Any problems abox might have are dealtwith at this point.
6. The B and C filters areplaced in a petri dish withthe corresponding identifi-cation sticker.
7. The B and C petri dishesare placed in trays in a par-ticular order generated bythe database.
8. After the B and C filtersare downloaded, the boxmoves on to the post-weighing station where thesampled A and D filters areweighed.
9. After post-weighing, thefilter is stored in a pre-labeled slide mount forlater analysis.
10. After downloading theB and C filters and post-weighing the A and Dfilters, the box is placedback at the uploading sta-tion to start the processagain.
Filters cycle through several processes before they reach the monitoring siteand after they return to the University of California-Davis.
Pre-Shipping...A
fter Return From
the Field...
Hazy and Clear Days
For current visibility, see the Web cam at www2.nature.nps.gov/ard/parks/maca/macacam/macacam.htm.

Bob CCarsonheads the AirResourcesSpecialist Scienceand ResourcesManagementDivision atMammoth Cave.He has overseenthe program's
evolution and until last year was solely responsiblefor IMPROVE monitoring operations at the park.IMPROVE site operator Johnathon Jernigan joinedthe program in January 2002 and brings consider-able knowledge and ability to the job. Aftergraduating from Western Kentucky University witha BA in Mathematics in 1996, Jonathon earned hismaster's a year later at the same institution. Histhesis studied airflow and temperature at MammothCave. He participated in cave atmospheric studieswith the Student Conservation Association andtaught full time in the mathematics department atthe university. He has completed two statisticalstudies on atmospheric data collected at MammothCave's air quality stations prior to his full timeappointment at the park. Aerosol and nephelome-ter data collected averaged 98% for 2002!
Mammoth Cave’sIMPROVE air qual-ity monitoring site
Green River Bluffsoverlook, the loca-tion of theIMPROVE scenemonitoring camera
Air resource spe-cialist Bob Carson
changing theIMPROVE sampler
filters
“No problem can be solvedfrom the same level of con-sciousness that created it.”
Albert EinsteinChange IMPROVEparticle cartridges.
IMPROVE particlesampling day
IMPROVE particlesampling day
IMPROVE particlesampling day
Change IMPROVEparticle cartridges.
IMPROVE particlesampling day
IMPROVE particlesampling day
Independence Day
UC-Davis: Sampler :General Lab
(530) 752-1123
ARS: Optical:Carter Blandford or
Dave Beichley Photography:Karen Fischer
(970) 484-7941
IMPROVE particlesampling day
IMPROVE particlesampling day
IMPROVE particlesampling day
Change IMPROVEparticle cartridges.
Special IMPROVEparticle change.Move cassette #3from old cartridgeto new cartridge.IMPROVE particlesampling day
Special IMPROVEparticle change.Move cassette #3from old cartridgeto new cartridge.IMPROVE particlesampling day

The area now known as the Hoover Wilderness was first recognized in 1931 by the Forest Service asan area in need of protection. This primitive area, expanded in 1957, was designated as the HooverWild Area. With the passage of the 1964 Wilderness Act, Hoover became one of the first wildernessesin the National Wilderness Preservation System. An adjoining 72,000 acres of pristine national forestlands are being considered for a future addition to this wilderness.
The Hoover Wilderness is rugged and scenic with 12,000-foot mountains, high alpine lakes, and beau-tiful meadows, but little timber. Rain, snow, strong winds, and bitter cold can occur in all seasons.The Hoover Wilderness shares its western border with Yosemite National Park. This is the onlyIMPROVE site that is representative of the Sierra Nevada Wilderness east of the divide, and is signif-icant because it provides the only data to give a glimpse of “east side” air quality.
The Hoover IMPROVE site is located on Conway Summit on the north edge of the Mono Lake Basinin eastern California at an elevation of 8,400 feet. The site is just east of the Sierra Nevada crest andwas selected by virtue of its proximity to the Hoover Wilderness of the Toiyabe and Inyo NationalForests and Yosemite National Park.
IMPROVE aerosol monitoring began at Hoover in July 2001. Current annual average visibility is about75 miles, a little more than half of the estimated natural visibility. On the clearest days visibilityapproaches 125 miles, but is often 35 miles or less on very hazy days. The greatest visibility impairmentoccurs during the late summer and fall months, July through October. The particles primarily responsi-ble for visibility reduction in this area are made up of biogenic carbon, which comes primarily from forestfires, but also from secondary organic aerosols associated with biogenic gaseous emissions.
The USDA Forest Service and the Western Regional Air Partnership (WRAP) are involved in a collabora-tive effort of tribal governments, state governments, and various federal agencies to address westernregional air quality issues in order to comply with the EPA's regional haze regulations. The HooverIMPROVE site will provide data about current visibility conditions and enable the Forest Service to trackprogress toward the national goal of one day achieving natural visibility conditions in the wilderness.
The first step in correctly diagnosing and solv-ing any problem is to call UCD’s General Lab at(530) 752-1123. No problem is too small, and acorrect diagnosis is more likely to be made.
Has a filter or filter cartridgebeen dropped?The cartridges are well protected and unlessthe operator is physically forcing air throughthe media there should be no immediate prob-lem. Pay careful attention to any fluctuation inthe normal readings on that particular set offilters. As with any significant event, note it onthe logsheet and detail what occurred. NotifyUCD about any questions or concerns.
What if the filter gets wet?Although this can significantly affect the sam-ple, UCD may or may not be able to send areplacement. Call the lab so that UCD can dealwith it properly and note it on the logsheet.
Missed changing filters on theregular Tuesday?Immediately call UCD to get instructionsbefore proceeding with the sample change.Experienced operators should still call UCD toadvise of any deviation in the sample chang-ing schedule.
** IIff tthheerree aarree rreemmaaiinniinngg ssaammpplliinngg ddaayyss iinntthhee wweeeekk:: Remove the exposed filters aswould normally be done, and put in the cleanfilters that were to have been installed on thelast change day. Make a note on the logsheet.
** IIff tthhee wweeeekk iiss ccoommpplleetteellyy mmiisssseedd::Remove the exposed filters as would normallybe done but do not put in the filters for themissed change day. Keep these in the ship-ping box and send them back to UCD whenboth weeks in that box have passed. Installthe appropriate filters for the current week.Make a note on the logsheet of the filters thatwere not installed.
Trouble with the “red button”-controlled motors:Sometimes when the weather turns cold, theelectric motor that raises and lowers the sole-noids works very slowly. If this occurs, or ifthe red-buttons fail to work for any reason, fol-low these steps:
Clear and Hazy Days
MMoodduulleess AA-CC::The motor is located inthe top right area.
1. Disengage motor bygently pushing downon the top of the motor.
2. “Lockout” the motorby rotating it toward thesolenoids.
3. Raise and lower thesolenoids by turningthe handwheel at thetop of the module.
MMoodduullee DD::The motor is located inthe bottom left area.
1. Disengage motor bygently pushing up onthe bottom of the motor.
2. “Lockout” the motorby rotating it toward thesolenoids.
3. Raise and lower thesolenoids by turningthe handwheel at thebottom of the module.
FFoorr qquueessttiioonnss oorr pprroobblleemmss wwiitthh::FFiilltteerr bbooxxeess,, ffllaasshhccaarrddss,, aanndd ssaammpplleecchhaannggeess:: contact Sujan Bhattarai, JoanHancock, Jose Avena, Jose Mojica, or StevenIxquiac at (530) 752-1123.CCoonnttrroolllleerrss,, eeqquuiippmmeenntt mmaallffuunnccttiioonnss,,ssaammpplleerr mmaaiinntteennaannccee,, aanndd ffllooww aaddjjuusstt-mmeennttss:: contact Jose Mojica at (530) 752-9044[cell: (530) 867-4391], or Steven Ixquiac at (530)752-4108 [cell: (530) 304-1468].SSaammpplleerr aauuddiittss:: Steven Ixquiac (see above).

Larry FFordspent 20 years atthe ScrippsInstitution ofOceanography atthe University ofCalifornia at SanDiego. After fiveyears in marinegeology and 15years as principalphotographer, hetook a year'sleave of absenceand moved to Mono Lake. Now, twenty years later,he works for the Forest Service on the Mono LakeRanger District as the assistant manager for theMono Basin National Forest Scenic Area. Hisresponsibilities include habitat restoration, manage-ment of the water resources, interpretation, lawenforcement, and the operation of the IMPROVE par-ticle sampler. Access from late spring through earlyfall is drivable, but during the rest of the year it canbe "very interesting," he reports. "Winds in excessof 100 mph are not uncommonand pile the snow into chest-deep drifts in places whileleaving bare, frozen ground inothers. Even though there's amajor highway nearby it can feelvery isolated; the storms can befrightening. Some days I imag-ine myself snowshoeing across ahostile Antarctic landscape withsnow blowing horizontally andvisibility nearly zero. My trusty,four-footed companion, Caly, isalways there, probably wonder-ing if I've lost my mind butallowing me to break track untilwe get to the welcome shelter ofthe IMPROVE site." Ford's sitedata capture is among the high-est with 93% of the data beingcollected in 2002.
Larry is an avid cross-country skier, coaches theMammoth High School cross-country ski team andspends his spare time doing woodworking, garden-
ing, and raisingchickens, all while tryingto keep up with a sonand daughter, both stu-dents at the University ofNevada, Reno!
Hoover Wilderness aerosol monitoring site.
Larry Ford andCaly changingIMPROVE sam-pler filters
“You cannot escape the responsibility of tomorrow by evading it today.”Abraham Lincoln
"There is nothing more practical in the end than the preservation of beauty."President Theodore Roosevelt
IMPROVE particlesampling day
Change IMPROVEparticle cartridges.
IMPROVE particlesampling day
IMPROVE particlesampling day
Change IMPROVEparticle cartridges.
IMPROVE particlesampling day
IMPROVE particlesampling day
IMPROVE particlesampling day
IMPROVE particlesampling day
Change IMPROVEparticle cartridges.
IMPROVE particlesampling day
IMPROVE particlesampling day
IMPROVE particlesampling day
ARS: Optical:Carter Blandford or
Dave Beichley Photography:Karen Fischer
(970) 484-7941
UC-Davis: Sampler :General Lab
(530) 752-1123
Special IMPROVEparticle change.Move cassette #3from old cartridgeto new cartridge.IMPROVE particlesampling day
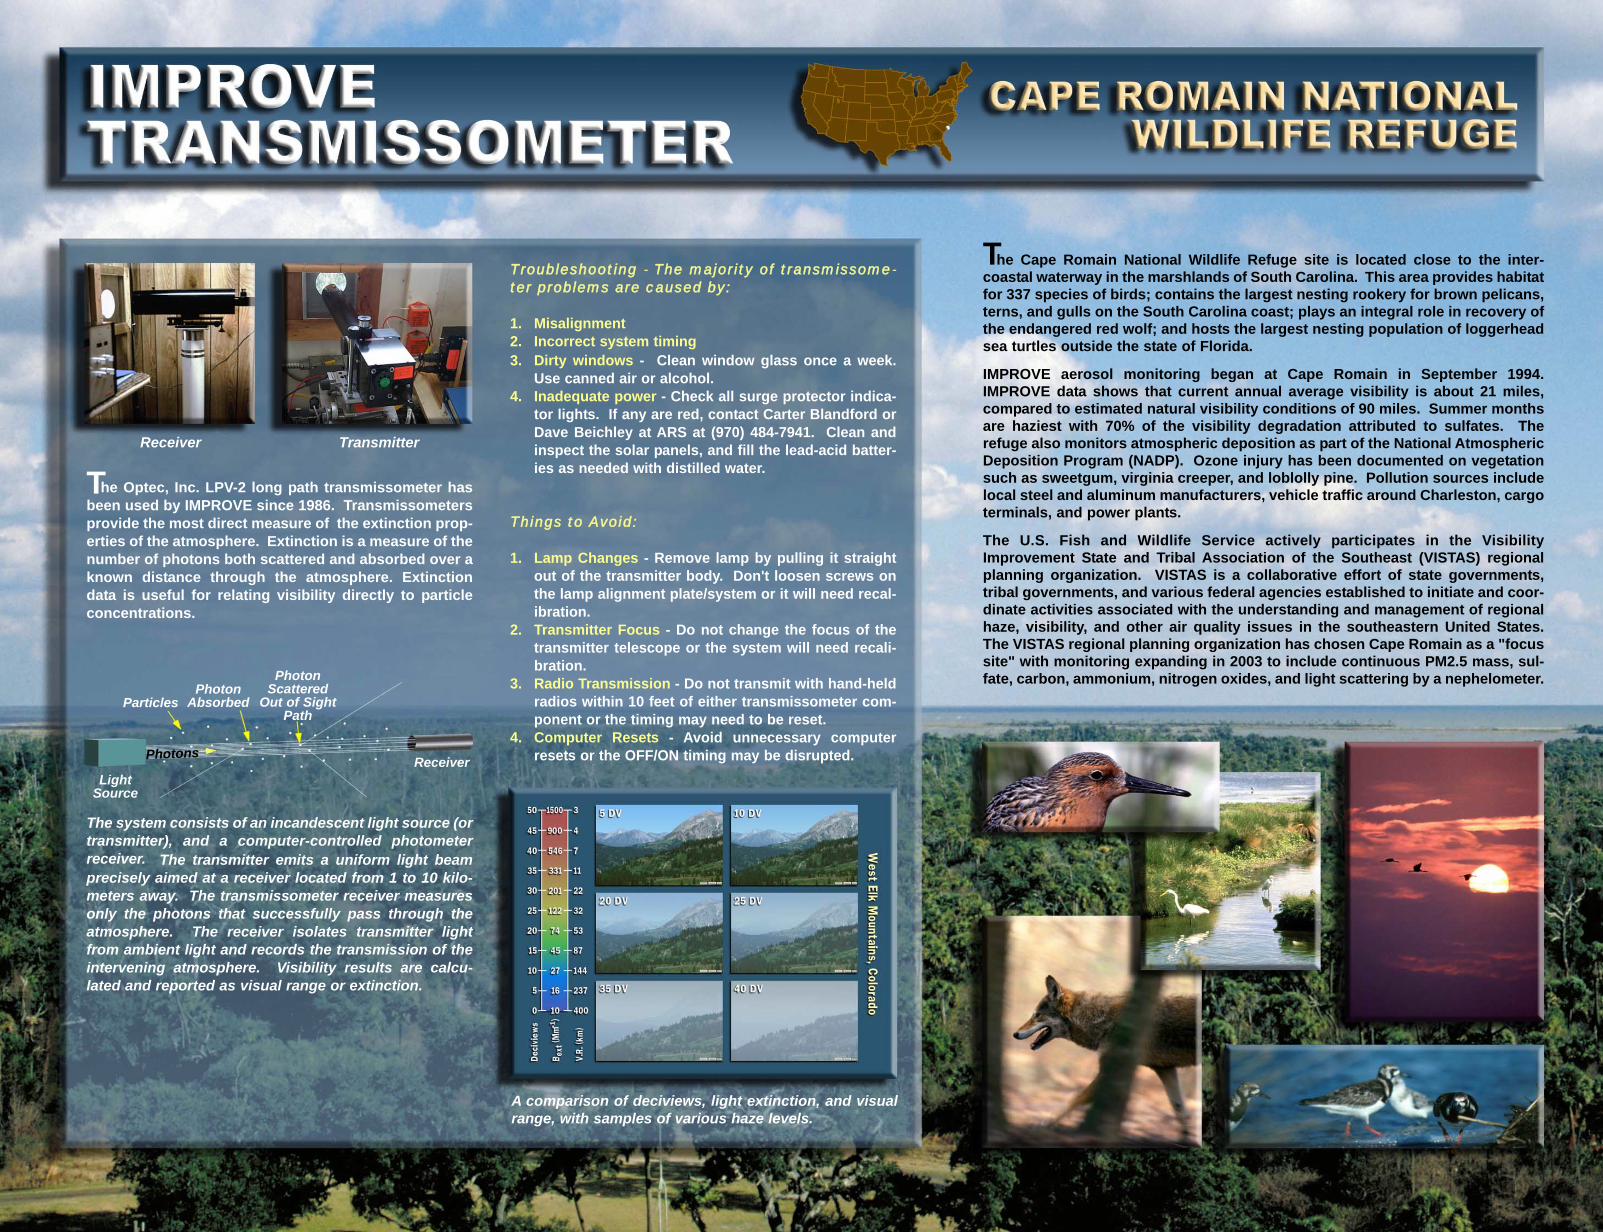
The Cape Romain National Wildlife Refuge site is located close to the inter-coastal waterway in the marshlands of South Carolina. This area provides habitatfor 337 species of birds; contains the largest nesting rookery for brown pelicans,terns, and gulls on the South Carolina coast; plays an integral role in recovery ofthe endangered red wolf; and hosts the largest nesting population of loggerheadsea turtles outside the state of Florida.
IMPROVE aerosol monitoring began at Cape Romain in September 1994.IMPROVE data shows that current annual average visibility is about 21 miles,compared to estimated natural visibility conditions of 90 miles. Summer monthsare haziest with 70% of the visibility degradation attributed to sulfates. Therefuge also monitors atmospheric deposition as part of the National AtmosphericDeposition Program (NADP). Ozone injury has been documented on vegetationsuch as sweetgum, virginia creeper, and loblolly pine. Pollution sources includelocal steel and aluminum manufacturers, vehicle traffic around Charleston, cargoterminals, and power plants.
The U.S. Fish and Wildlife Service actively participates in the VisibilityImprovement State and Tribal Association of the Southeast (VISTAS) regionalplanning organization. VISTAS is a collaborative effort of state governments,tribal governments, and various federal agencies established to initiate and coor-dinate activities associated with the understanding and management of regionalhaze, visibility, and other air quality issues in the southeastern United States.The VISTAS regional planning organization has chosen Cape Romain as a "focussite" with monitoring expanding in 2003 to include continuous PM2.5 mass, sul-fate, carbon, ammonium, nitrogen oxides, and light scattering by a nephelometer.
The Optec, Inc. LPV-2 long path transmissometer hasbeen used by IMPROVE since 1986. Transmissometersprovide the most direct measure of the extinction prop-erties of the atmosphere. Extinction is a measure of thenumber of photons both scattered and absorbed over aknown distance through the atmosphere. Extinctiondata is useful for relating visibility directly to particleconcentrations.
Receiver
TTrroouubblleesshhoooottiinngg - TThhee mmaajjoorriittyy ooff ttrraannssmmiissssoommee-tteerr pprroobblleemmss aarree ccaauusseedd bbyy::
1. Misalignment 2. Incorrect system timing3. Dirty windows - Clean window glass once a week.
Use canned air or alcohol.4. Inadequate power - Check all surge protector indica-
tor lights. If any are red, contact Carter Blandford orDave Beichley at ARS at (970) 484-7941. Clean andinspect the solar panels, and fill the lead-acid batter-ies as needed with distilled water.
TThhiinnggss ttoo AAvvooiidd::
1. Lamp Changes - Remove lamp by pulling it straightout of the transmitter body. Don't loosen screws onthe lamp alignment plate/system or it will need recal-ibration.
2. Transmitter Focus - Do not change the focus of thetransmitter telescope or the system will need recali-bration.
3. Radio Transmission - Do not transmit with hand-heldradios within 10 feet of either transmissometer com-ponent or the timing may need to be reset.
4. Computer Resets - Avoid unnecessary computerresets or the OFF/ON timing may be disrupted.
Transmitter
LightSource
Receiver
Particles
PhotonScattered
Out of SightPath
PhotonAbsorbed
Photons
A comparison of deciviews, light extinction, and visualrange, with samples of various haze levels.
The system consists of an incandescent light source (ortransmitter), and a computer-controlled photometerreceiver. The transmitter emits a uniform light beamprecisely aimed at a receiver located from 1 to 10 kilo-meters away. The transmissometer receiver measuresonly the photons that successfully pass through theatmosphere. The receiver isolates transmitter lightfrom ambient light and records the transmission of theintervening atmosphere. Visibility results are calcu-lated and reported as visual range or extinction.

The Cape Romain National Wildlife Refugeachieved an impressive 99% data capture for 2002,in spite of the fact that site operators SarahDawsey and Mary CCatherine MMartin devotemost of their time to wildlife studies for the endan-gered red wolf and loggerhead sea turtleprograms. Sarah, who has been at the refugesince 1986, also oversaw the completion of a fiveyear record of scene monitoring data for the airquality program.
Proper management ofair resources is vital toprotecting and maintain-ing the nation's fish andwildlife resources.
There are nearly 540 units in the National WildlifeRefuge System. The Service manages 21 Class Iareas, wilderness areas exceeding 5,000 acres andtotaling 2.3 million acres of natural areas, that pro-vide habitat for a wide variety of wildlife. TheService is required by the Clean Air Act to pre-serve, protect, and enhance air quality and airquality related values including visibility, flora,fauna, soil, water quality, cultural and historicalresources, and virtually all resources that aredependent upon and affected by air quality. Manyof these areas are currently, or have the potentialto be, impacted by air pollution.
“An area where the earth and its community of life areuntrammeled by man, where man himself is a visitor whodoes not remain.”
Definition of Wilderness from the Wilderness Act of 1964
Change IMPROVEparticle cartridges.
IMPROVE particlesampling day
IMPROVE particlesampling day
IMPROVE particlesampling day
Change IMPROVEparticle cartridges.
IMPROVE particlesampling day
IMPROVE particlesampling day
Labor DayUC-Davis: Sampler :
General Lab(530) 752-1123
ARS: Optical:Carter Blandford or
Dave Beichley Photography:Karen Fischer
(970) 484-7941IMPROVE particlesampling day
IMPROVE particlesampling day
IMPROVE particlesampling day
Change IMPROVEparticle cartridges.
Autumn Begins
Special IMPROVEparticle change.Move cassette #3from old cartridgeto new cartridge.IMPROVE particlesampling day
Special IMPROVEparticle change.Move cassette #3from old cartridgeto new cartridge.IMPROVE particlesampling day

Established in 1890, Sequoia is the second-oldest national park in the country.A small portion of what is now Kings Canyon was also set aside in 1890 asGeneral Grant National Park. Since 1940, Sequoia and Kings Canyon, located inthe southern Sierra Nevada in California, have been managed as one unit.Sequoia-Kings Canyon National Parks (SEKI) are named for its groves of giantsequoias, including the General Sherman tree, the most massive tree on earth.Sequoia and Kings Canyon contain some of America's most awe-inspiringscenery. Park peaks include Mount Whitney, the tallest mountain in the U.S. out-side of Alaska. Sequoia and Kings Canyon are home to numerous mammalspecies, and the topographic diversity supports more than 1,200 plant species.
The SEKI air resources program has been involved in air quality monitoring foralmost 20 years, one of the longest running air programs in the National ParkService. IMPROVE monitoring began in this park in March of 1992. IMPROVEdata show that average annual visibility is about 40 miles, and park views areoften completely obscured by air pollution. Natural visibility levels in the westare estimated to be about 140 miles. In addition to visibility monitoring, ongoingair quality monitoring activities include ozone, nitrogen oxides, particulates, UVradiation, synthetic chemicals, meteorology, and wet/dry deposition chemistry.
Because of high concentrations of ground-level ozone, the air in SEKI is oftenunhealthy to breathe. High levels occur more days than in any other national park.Ponderosa and Jeffrey pine trees show extensive injury to their foliage at presentozone levels. One study found that nearly 90% of Jeffrey pines in or near the GiantForest showed visible signs of ozone injury. Although chronic acidification is cur-rently not a problem in high-elevation lakes, there are episodes when the ability ofsome lakes and streams to neutralize acids gets reduced and waters becomeacidic for short periods. This is most likely to happen during snowmelt and dur-ing the "dirty" rainstorms of summer and early fall. There has also been a slow,continuous increase in atmospheric nitrogen deposition in park watersheds.
Sequoia-Kings Canyon National Parks were named as among the five most pol-luted parks by the National Parks Conservation Association in their 2002 report,Code Red: America's Five Most Polluted Parks report. At present, the worstimpacts are tied to wind transport of air pollutants from the Central Valley ofCalifornia, especially from April to October. Sources of pollutants include vehi-cle emissions, agricultural activities, prescribed and wildland fire, and industrialemissions of fine particles.
The Optec NGN-2 ambient nephelometer has beenused by IMPROVE since 1993. Nephelometers measurethe amount of light (photons) scattered by particles andgases in the atmosphere. This measurement combinedwith estimates of the absorption coefficient (fromaerosol monitoring filters) can be used to determine theaverage total light extinction.
LightSource
Particles
Photon
Backward
Scattered
Photons
Detector
Photons
Foreward
Scattered
Photon Side
Scattered
TTrroouubblleesshhoooottiinngg FFrroonntt PPaanneell EErrrroorr CCooddeess::
1. Error Code -400 (4), door closed, no neph readings:The lamp is out. Replace lamp, reset neph and checklamp counts (>2000).
2. Error Code -500 (5), door closed, no neph readings:Rain event. No operator intervention is required.Readings will return when the sensor is dry.
3. Error Code -600 (6), door closed, no neph readings:Incorrect chopper frequency. Reset nephelometer.
4. Error Code -900 (.920), door closed, locked-up analogreadings: Possible lamp out and/or serial interfacemalfunction. Reset blue earth and neph. If codechanges to -400, replace lamp and check lampcounts.)
5. Error Code -900 (.920), door open, analog readingsonly: Serial data interface failure. Reset Blue Earthserial data buffer and neph and check for serial read-ing following POST (Power On Self Test).
*Note: When power outages or surges occur, thedata logger may lose its program. Reset on the site.
The Nephelometer draws ambient air into a chamberwhere light of known intensity is emitted over a path par-allel to a photodiode detector. With this configurationonly the photons that are scattered will be detected. Theinstrument is designed in such a way that the samplingchamber and light source are confined to a small volumeso the instrument makes a "point" or localized measure-ment of scattering. A direct estimate of atmosphericscattering is made by measuring the light scattered fromthe front, back, and sides of the optical chamber.Because the scattered light is integrated over a largerange of scattering angles, the instrument is referred toas an INTEGRATING nephelometer.
Looking west towardthe San Joaquin
Valley and the CoastRange
(NPS photo)
Standard nephelometerstations are mountednear the top of a 14-foottower on the north face.A solar radiation and pre-cipitation shield areinstalled to protect theinstrument from severeprecipitation (rain, hail,snow) and keeps directsunlight off the monitor.This allows the instru-ment to be maintained atclose to ambient temper-atures. Temperature andrelative humidity sensorsare often installed as partof the standard neph-elometer configuration.
SolarRadiation
Shield
PrecipitationHood
Temp.& RH
Hazy and Clear Days

Originally from the Catskills of upstate New York,site operator Hassan BBasagic began workingin the national parks during his college years.Upon graduation from the State University of NewYork at New Paltz with a degree in geography, hemoved west. Hassan continued his NPS careerwith positions at Yellowstone, Yosemite, Denali,Hovenweep, Natural Bridges, Canyonlands,Joshua Tree, and now Sequoia-Kings Canyon.Hassan enjoys climbing and backpacking, budgettravel, and good cooking!
The SEKI IMPROVE station is located near AshMountain headquarters - elevation 1,650 feet. Thesite is one of three air quality stations within the
park - which makes for busyTuesdays! Weather and terrainare not usually a hindrance, but"the autumn assault by the acornwoodpeckers can be a problem!”Data collection from the aerosolsite at SEKI was 100% for the 3rdquarter 2002!
Meteorologicaltower on theedge of theGiant Forest(NPS photo) Ozone injury to Jeffrey Pine
"Today we must seek the best ways toachieve the common goal of leading to pos-terity a nation of fresh air, clean water, andnatural beauty."
President George W. Bush Announcing the National ParksLegacy Project at Sequoia National Park
IMPROVE particlesampling day
Change IMPROVEparticle cartridges.
IMPROVE particlesampling day
IMPROVE particlesampling day
IMPROVE particlesampling day
IMPROVE particlesampling day
IMPROVE particlesampling day
IMPROVE particlesampling day
IMPROVE particlesampling day
Change IMPROVEparticle cartridges.
Change IMPROVEparticle cartridges.
IMPROVE particlesampling day
Columbus Day
Daylight SavingTime Ends
UC-Davis: Sampler :General Lab
(530) 752-1123
ARS: Optical:Carter Blandford or
Dave Beichley Photography:Karen Fischer
(970) 484-7941
Halloween
Special IMPROVEparticle change.Move cassette #3from old cartridgeto new cartridge.IMPROVE particlesampling day

The two and one-quarter million acre White River National Forest is locatedin the heart of the Colorado Rocky Mountains. The scenic beauty of the area(ten of its peaks pierce 14,000 feet), along with ample recreation opportuni-ties, account for the fact that White River consistently ranks as one of the topfive forests nationwide for total recreational use. The largest concentrationof ski lifts outside of Europe's Alps is found here, as is the nation's largest elkherd.
IMPROVE aerosol monitoring began here in 1993 and IMPROVE data showthat visibility in this region is some of the best in the continental UnitedStates. Current annual average visibility is just over 100 miles with organicsand sulfates contributing 37% and 30% of the visibility-reducing particles.The monitor samples air masses common to the Maroon Bells, West Elk,Eagles Nest, and Flat Tops Wilderness Areas of Colorado.
Just as the IMPROVE monitoring program is a cooperative effort, other inter-ested parties contribute to a variety of air quality monitoring efforts in theWhite River National Forest. The Aspen Wilderness Workshop, a non-profitorganization, and the Aspen Skiing Company's environmental foundationhave funded surface water monitoring since 1985, and 35 mm camera scenemonitoring since 1991. Over 77% of forest lands in this district are desig-nated as wilderness areas (Hunter-Fryingpan, Collegiate Peaks, and MaroonBells-Snowmass). Air quality monitoring is a high priority. IMPROVE datafrom this site were used in a cooperative research effort by federal and stateagencies with the active participation of industry to determine the visibilityimpact of a coal-fired utility near Hayden, Colorado, in the Mount ZirkelWilderness Area. Since then the plant has been retrofitted with new pollutioncontrol equipment resulting in significant reductions of sulfur dioxide andnitrogen oxides.
Scene monitoring uses still and/or time-lapse pho-tography (including digital imagery) to provide aqualitative record of visual air quality. Photographydocuments the appearance of a scene under a varietyof air quality and illumination conditions at differenttimes of day and during different seasons. Images dur-ing stable periods may yield more information in areassusceptible to ground-based or elevated layeredhazes. Photography should be collocated with aerosoland optical monitoring equipment to aid in data pre-sentation. Five years of photography is consideredsufficient to create a representative record of varia-tions in visibility conditions.
TTrroouubblleesshhoooottiinngg:: The majority of unusable visibilityphotographs result from operator error or insufficientsystem maintenance.
1. Camera and system settings vary from site to site.Check the settings specified for your particular cam-era type and monitoring protocols. Call KarenFischer at ARS with questions at (970) 484-7941.
2. Timer events:Normal events are: Event 1=0900, Event 2=1200, Event 3=1500
3. Film:a: If the film did not advance…
Check/change the camera battery.Attempt to take a manual photograph.Test camera/timer/battery connections.
b. Film stored in a freezer or refrigerator must thawat room temperature for at least 2 hours beforeloading in camera.
Clear and Hazy Days
These photos from Canyonlands National Park, UT illustrate how scene qualityvaries under different lighting and atmospheric conditions.
Morning, Low SunAngle
Morning, LayeredHaze
Afternoon, Clear,Snow
Afternoon, Hazy Afternoon, Clouds

Michael BBraudis, site operator for theIMPROVE site atop Aspen Mountain at 11,200 feet,brings vitality and ingenuity to his work. A rockand ice climber and mountain bike competitor,Michael willingly hikes or snowshoes the 3,000vertical feet to and from the site each Tuesdaywhen the skier gondola is closed for "off" season.Last year, Michael moved the Version II samplerfrom outside to an enclosed building to facilitatebetter data recovery. He also moved the AspenDistrict's campsite monitoring program into thedigital age with GPS mapping and digital cameratechnologies.
“Wilderness is protected, nurtured, and sustained by increasingly competent and commit-ted managers, supported by expanded scientific knowledge and growing political strengthfrom a public that increasingly understands and appreciates wilderness.”
The Forest Service Vision for Wilderness
IMPROVE particlesampling day
Change IMPROVEparticle cartridges.
IMPROVE particlesampling day
IMPROVE particlesampling day
Change IMPROVEparticle cartridges.
IMPROVE particlesampling day
Thanksgiving
ARS: Optical:Carter Blandford or
Dave Beichley Photography:Karen Fischer
(970) 484-7941
IMPROVE particlesampling day
UC-Davis: Sampler :General Lab
(530) 752-1123
Special IMPROVEparticle change.Move cassette #3from old cartridgeto new cartridge.IMPROVE particlesampling day
IMPROVE aerosol monitor atop Aspen Mountaininside the Aspen Ski Area
IMPROVE particlesampling day
IMPROVE particlesampling day
IMPROVE particlesampling day
IMPROVE particlesampling day
Change IMPROVEparticle cartridges.

The Columbia River cuts its way through the Cascade Rangeeroding a river canyon 80 miles long and 4,000 feet deep. TheColumbia River Gorge was designated the first National ScenicArea by Congress in 1986. The Cascade Range affects climate,flora, and fauna in the region and the climate varies considerablyfrom one end of the gorge to the other. The west end has a mild,moist climate, while the east end exhibits wide temperature rangesand approaches semiarid conditions. The gorge's natural wind-tunnel effect has made this area one of the world's foremostwindsurfing playgrounds.
There are two IMPROVE monitoring stations, one installation ateach end of the gorge. The Wishram, Washington site, installed in1993 at the east end of the gorge, is operated by the ForestService. The Mount Zion site at the west end was installed in 1997and is operated by the Washington Department of Ecology.Meteorological and geographic factors combine with pollutantconcentrations to create unique air quality issues within the gorge.Valley walls and temperature inversions tend to restrict the dis-persion of pollutants that are emitted from pollution sources withinthe scenic area and those carried in with winds from either end ofthe gorge. IMPROVE data show that visibility in the area isimpaired. The worst visibility occurs in the fall and winter monthswhen prevailing winds are out of the east. Sulfur accounts formost of the visibility impairment followed by nitrogen and carbon.The primary sources of air pollutants in the gorge are from thePortland and Vancouver urban areas and from sources within thescenic area. There are two major highways, two rail lines, bargetraffic, two aluminum smelters, a pulp mill, two power plants, andseveral urban centers within and at both ends of the gorge.
Air quality related lichen monitoring shows some nitrogen-lovingspecies in high abundance and some species with known sulfursensitivities in unusually low abundance, indicating that ecosys-tem diversity and function may be affected by air pollution. Tissueanalysis of lichen shows that nitrogen and sulfur deposition is ashigh or higher in the gorge than in any other areas sampled in thePacific Northwest. In most years, ozone levels have been moni-tored at levels high enough to impact terrestrial ecosystems.
IIMMPPRROOVVEE MMoonniittoorriinnggMMeettaaddaattaa - Site informa-tion including location,sampling equipment, andhistory of changes at themonitoring site.
1. Select a sampler type.2. Select a map location.3. Select a location code
from the table to viewdetailed metadata.
DDiiuurrnnaall CCyyccllee - Diurnalcycles for light scattering,extinction, relative humid-ity, and temperature data.Diurnal cycles are pre-sented for sites withtransmissometer or neph-elometer monitors andencompass the entiredata record at each site.
1. Select a map location.Data for that site issummarized.
LLoonngg-TTeerrmm TTrreennddss - Thelong term trends (1988 -1998) for selected IMPROVEmonitoring sites are shownfor fine mass and its majoraerosol types, along withlight extinction and the con-tributions of major aerosoltypes to light scattering.
1. Select a map location.2. Select a group from the
pull-down menu:10 (best 20%), 50 (median 20%), or90 (worst 20%) days.
3. Select a variable to plot.
SSppaattiiaall aanndd SSeeaassoonnaallPPaatttteerrnnss - Annual spatialpatterns of PM2.5, lightextinction, and contribu-tions of major aerosoltypes are plotted. Sea-sonal bar charts of PM2.5,light extinction, and thecontributions of majoraerosol types are plotted.Frequency distributions ofall aggregated values arealso shown.
1. Select a map location.2. Select a variable from
the pull down menu.
Measurements from most IMPROVE sites are summarized graphically on the IMPROVE Web site using the IMPROVEgraphical viewer. The viewer is interactive and can be accessed through the IMPROVE Web site main page, atvista.cira.colostate.edu/improve/Data/GraphicViewer.
Clear and Hazy Days
The VVisibility IInformation EExchange WWeb SSystem PProgramThe VIEWS website vista.cira.colostate.edu/VIEWS provides access to other data resources,including metadata from several other monitoring networks, an integrated aerosol database,graphical summaries of data analyses, and extensive catalogs of air quality information.
For current visibility, see the Web cam at www.fsvisimages.com/cori1/cori1.html.

The IMPROVE aerosolsampling site atWishram, WA
MMaarrkk KKrreeiitteerr is the Forest Service site operatorat the Wishram site at the east end of the ColumbiaRiver Gorge. He is also the hydrologist for theColumbia River Gorge National Scenic Area andthe Mt. Hood National Forest. Currently, Mark isworking on salmon restoration projects where hecollaborates with other private and state entities.Mark’s efforts on behalf of IMPROVE resulted indata completeness of 97% for 2002!
Mark says, "I love fly fishing and fly tying, playingthe guitar, cross-country skiing, hiking and camp-ing. I have two teenage daughters that provide allkinds of excitement! I am a native Washingtoniancurrently living in the small community of WhiteSalmon, Washington. My forest service career hastaken me to some pretty awesome spots includingareas around Mt. Rainier and Mt. St. Helens."
“What it lies in our power to do, it lies in ourpower not to do.”
Aristotle
Change IMPROVEparticle cartridges.
IMPROVE particlesampling day
IMPROVE particlesampling day
Change IMPROVEparticle cartridges.
IMPROVE particlesampling day
IMPROVE particlesampling day
UC-Davis: Sampler :General Lab
(530) 752-1123
ARS: Optical:Carter Blandford or
Dave Beichley Photography:Karen Fischer
(970) 484-7941IMPROVE particlesampling day
IMPROVE particlesampling day
Change IMPROVEparticle cartridges.
Winter Begins Christmas
Special IMPROVEparticle change.Move cassette #3from old cartridgeto new cartridge.IMPROVE particlesampling day
Special IMPROVEparticle change.Move cassette #3from old cartridgeto new cartridge.IMPROVE particlesampling day
New Year’s Eve
A view of the gorge from Beacon Rock State Park
IMPROVE particlesampling day
IMPROVE particlesampling day

Bryce Canyon National Park in southern Utah is named for one of a series of horseshoe-shaped amphitheaters carved from the eastern edge of the Paunsaugunt Plateau. Thecolorful Claron limestones, sandstones, and mudstones have been shaped by erosion intothousands of pinnacles, spires, and mazes, collectively called "hoodoos". Ponderosapines, high elevation meadows, and fir-spruce forests border the rim of the plateau, whilepanoramic views of three states spread beyond the park's boundaries. Surrounded bydeserts, these highlands get much more rain than the lowlands below and stay cooler dur-ing hot summers.
One year after Congress enacted the 1977 amendments to the Clean Air Act, teleradiometerand aerosol monitoring began at Bryce Canyon National Park, one of six parks within theso-called "Golden Circle" of national parks in the Four Corners region of the Southwest.This region is one of the most intensely monitored in the network and boasts some of thenation's best air quality. The park identifies three magnificent views, or "integral vistas",deserving the most stringent visibility protection. An integral vista is a scenic view whichextends beyond Class I boundaries, which view is deemed critical to the enjoyment of thearea. Vistas from Bryce, Paria, and Yovimpa Point[s] have been identified as integral to vis-itor enjoyment, and the National Park Service seeks to protect these views from intrusionssuch as smoke plumes, strip mines, or other encroachments. Studies at the park have con-sistently identified clear air and unobstructed views among visitors' top priorities.
IMPROVE data show that annual average visibility at Bryce Canyon is about 95 miles but onthe 10% cleanest days visibility approaches natural levels of 140 miles. Preliminary trendanalyses show there may be some degradation or worsening of visibility conditions on thehaziest days at the park. Layered hazes and plumes from a nearby power plant create vis-ibility impairment that can frequently be seen from some Bryce Canyon viewpointsespecially during the winter when air masses are stable. Bryce Canyon's monitoring effortsare part of a collaborative effort by tribal governments, state governments, various federalagencies, and private industry to better understand and manage regional haze, identify vis-ibility impacted areas, and identify sources of haze on the Colorado Plateau and across thewestern states. Additionally Bryce Canyon has successfully cooperated with private enti-ties to mitigate proposed coal strip mining in the nearby Alton coal fields.
Federal Land Managers (FLMs), states, tribes, and other monitoring entities share IMPROVE monitoringinformation. A centrally located, national visibility database archive is coordinated by EPA for all his-torical and future visibility monitoring information and data. Protocols are in place to assure that datacollected today can be used in future applications and new source review models. Visibility monitoringdata are used in each of the following applications:
11.. VViissiibbiilliittyy PPrrootteeccttiioonn PPrrooggrraamm:: Data are used to identify existing conditions and determinelong-term trends. Program data are also used to assess progress toward existing national goals.
22.. PPrreevveennttiioonn ooff SSiiggnniiffiiccaanntt DDeetteerriioorraattiioonn ((PPSSDD)) PPrrooggrraamm RReeqquuiirreemmeennttss:: Visibility datathat describe existing conditions can be used as input for New Source Review (NSR) models and toassess a proposed source's potential impact on a particular PSD area.
3. SState IImplementation PPlans ((SIPs), FFederal IImplementation PPlans ((FIPs), aandTribal IImplementation PPlans ((TIPs): Visibility data can be used to quantify existing condi-tions, support trend analysis, and support impairment designation policies in SIPs, FIPs, and TIPs.Monitoring programs in turn, enable the enforcement of emission limitations and other air quality-related control measures.
44.. FFeeddeerraall DDooccuummeennttss ((ee..gg.. RReeggiioonnaall AAsssseessssmmeennttss,, MMaannaaggeemmeenntt PPllaannss,,EEnnvviirroonnmmeennttaall IImmppaacctt SSttaatteemmeennttss,, eettcc..)):: Visibility data that describe existing conditionsare often referenced in federal documents to denote resource conditions prior to land managementchanges. Data presentations can also be used in political forums to aid in the understanding of exist-ing conditions and need for future air quality-related policy and/or regulations.
55.. AAcciidd RRaaiinn PPrrooggrraamm:: The links between acid rain and visibility degradation, although indirect arequite strong. Of particular importance is the relationship of visibility to the air pollutants associatedwith acid deposition -- i.e., the relationship of visibility to nitrogen dioxide, nitrate aerosols, and(especially) sulfate aerosols.
66.. FFiirree EEmmiissssiioonnss IInnvveennttoorriieess:: Natural and prescribed fire emissions often impact visibility inClass I and other protected natural areas. With the development of increased fire programs, existingand future visibility data can be used to evaluate the visibility impacts of fire emissions.
77.. FFiinnee PPaarrttiiccuullaattee SSttaannddaarrddss:: Existing visibility-related PM2.5 and PM10 data may be used tosupplement Federal Reference Method measurements (e.g. to estimate regional background con-centrations) in association with new fine particulate standards.
88.. OOtthheerr UUsseess ffoorr NNoonn-CCllaassss II AArreeaa MMaannaaggeemmeenntt:: Visibility data can be used to documentthe frequency, dynamics, intensity, and causes of urban hazes, establish visual air quality acceptancecriteria, and evaluate daily air quality indexes.
Clear and Hazy Days

Site Operator and Park Ranger SStteevvee MMaazzuurr hasbeen the air quality specialist at Bryce CanyonNational Park since 2000. His official duties, how-ever, lead him to wear many different hats. Undersupervisor Clyde Stonaker, Steve is a NationalPark Service Ranger in the Protection Division.Collateral duties include law enforcement, search& rescue, emergency medical services, health & fit-ness, and backcountry patrol operations.
Steve has been the IMPROVE site operator andadministrator for almost three years. Additionallyhe collects ozone data and wet and dry acid depo-sition data as part of the National Acid DepositionProgram (NADP), and participates in USDA snowsurveys.
Air sampling sites are located at 8,000 and 9,000feet. Winter access is often difficult, requiring ski-ing or snowshoeing to service these sites. An avidfitness enthusiast, Steve spends free time backcountry hiking, skiing, cycling, weight training, fly-ing, running, fishing, and doing road trips.
“In the end, our society will be defined notby what we create but by what we refuse todestroy.”
John Sawhill, The Nature Conservancy
IMPROVE particlesampling day
Change IMPROVEparticle cartridges.
IMPROVE particlesampling day
IMPROVE particlesampling day
IMPROVE particlesampling day
IMPROVE particlesampling day
IMPROVE particlesampling day
IMPROVE particlesampling day
Change IMPROVEparticle cartridges.
Change IMPROVEparticle cartridges.
Special IMPROVEparticle change.Move cassette #3from old cartridgeto new cartridge.IMPROVE particlesampling day
New Year’s Day
Martin Luther KingJr.
UC-Davis: Sampler :General Lab
(530) 752-1123
ARS: Optical:Carter Blandford or
Dave Beichley Photography:Karen Fischer
(970) 484-7941
Plume blight on Navajo Mountain as captured bythe scene camera.
IMPROVE particlesampling day
IMPROVE particlesampling day
IMPROVE particlesampling day

The North Absaroka Wilderness Area lies in the ShoshoneNational Forest which encompasses the area from theMontana state line south to Lander, Wyoming, andincludes portions of the Absaroka, Wind River, andBeartooth Ranges. Yellowstone National Park borders thearea to the west. The Shoshone National Forest was setaside in 1891 as part of the Yellowstone TimberlandReserve, making it the first national forest in the UnitedStates. The terrain is varied, ranging from sagebrush flatsto rugged mountains many of which are snow-clad most ofthe year.
The North Absaroka ("Ab sor ka") IMPROVE aerosol sam-pler is located on Dead Indian Hill - so named for an Indiankilled in battle as local lore tells it. In spite of its name, the8,000 foot elevation site provides a beautiful 360 degreeview of the Greater Yellowstone Ecosystem, home to anabundance of wildlife, including the grizzly bear and wolf.The site was chosen for its proximity to the NorthAbsaroka and Washakie Wilderness Areas, both inWyoming. Particulate monitoring began here in January2000, and though access by vehicle is only about twomiles, winter drifts can make the last half mile feel consid-erably longer. Nine months of the year there is snow onthe ground and the area receives "some sort of snowfallevery month of the year," says operator Janice Stratman.
IMPROVE data show the current annual average visibilityat Absaroka is about 100 miles, compared to estimatednatural visibility of 140 miles. On the clearest days visibil-ity can be 126 miles, occurring most often during thewinter months. Visibility drops to about 58 miles on thehaziest days during late summer and early fall. The parti-cles responsible for visibility reduction in this area aremade up of biogenic carbon, which comes primarily fromforest fires, but also from secondary organic aerosolsassociated with biogenic gaseous emissions. The secondlargest contributor to visibility reduction is sulfates whichcome primarily from fossil fuel combustion.
Annual emissions of air pollutants from different major sourcecategories for 1999, in millions of tons. Particle emissionsinclude fine and coarse particles.
Visibility conditions throughout the United States reported asstandard visual range in kilometers. Annual visibility in theEastern U.S. averages between 15 and 35 miles. Annual visibilityin the Western U.S. averages between 35 and 90 miles.
Image prepared by Rudy Husar, Center for Air Pollution Impact andTrend Analysis, Washington University, St. Louis, MO.
This map represents the contributions of six major pollutants onthe 20% haziest days. Note that extinction is significantly higherin the east, largely due to higher sulfate concentrations, whilehigher nitrate concentrations contribute to haze in southernCalifornia and Washington’s Columbia River Gorge.
Comparativesizes of airborneparticles.

Site Operators Ed aand JJanice SStratmanbegan monitoring here on contract with the ForestService about 3 years ago. "We do everythingfrom cutting firewood to balancing budgets, fromsnow removal to cooking and cleaning cabins forthe guests," say the Stratmans. While the nearestpost office for receiving and sending filter sub-strates is 30 miles away in Cody and the nearestneighbor is 12 miles distant, these and otherinconveniences are taken in stride. Indeed, therewards of raising their seven children in this pris-tine landscape have been well worth the effort. Edteaches math part-time at a nearby college (50miles away) and is a member of the local volun-teer fire department. Aerosol data completenessfor 2002 averaged 90%.
"…the health of humans and ecosystems are inseparable; clean air isessential; and science is a foundation for taking action…"
National Forest Service Air Program Vision Statement
Change IMPROVEparticle cartridges.
IMPROVE particlesampling day
IMPROVE particlesampling day
IMPROVE particlesampling day
IMPROVE particlesampling day
UC-Davis: Sampler :General Lab
(530) 752-1123
ARS: Optical:Carter Blandford or
Dave Beichley Photography:Karen Fischer
(970) 484-7941
IMPROVE particlesampling day
IMPROVE particlesampling day
IMPROVE particlesampling day
Change IMPROVEparticle cartridges.
Special IMPROVEparticle change.Move cassette #3from old cartridgeto new cartridge.IMPROVE particlesampling day
Groundhog Day
President’s Day
Lincoln’s Birthday Valentine’s Day
Washington’sBirthdayWinds blew the
shelter on its sidebefore the crewarrived to install theaerosol sampler.
With a little muscleand ingenuity, theshelter was madeready.
Special IMPROVEparticle change.Move cassette #3from old cartridgeto new cartridge.IMPROVE particlesampling day

Site State Agency Completeness
Arendtsville PA EPA 100Ft Peck MT Assiniboine &
Sioux Tribes 100 *Grand Canyon AZ NPS 100Isle Royale MI NPS 100Mount Hood OR FS 100Petrified Forest AZ NPS 100Rocky Mountain CO NPS 100Three Sisters OR FS 100Bondville IL EPA 99Cabinet Mountains MT FS 99Chiracahua AZ NPS 99Hercules-Glades MO FS 99MK Goddard PA EPA 99Connecticut Hill NY EPA 99Great Basin NV NPS 99Presque Isle ME Micmac Tribe 99Saguaro AZ NPS 99Simeonof AK FWS 99Starkey OR FS 99Addison Pinnacle NY STATE 99Moosehorn ME FWS 99Seattle WA QA 99Cape Romain SC FWS 99Snoqualamie Pass WA FS 99Wheeler Peak NM FS 99Sac and Fox KS Sac & Fox
Nations 98 *Mammoth Cave KY NPS 98Nebraska NE FS 98 **Big Bend TX NPS 98Everglades FL NPS 98North Cascades WA NPS 98Lake Sugema IA STATE 98 *Denali AK NPS 98Mohawk Mountain CT STATE 98Quaker City OH EPA 98Saguaro west AZ STATE 98Hawaii Volcanoes HI NPS 98Quabbin Reservoir MA STATE 98Guadalupe Mountains TX NPS 97Great Gulf NH FS 97Bandelier NM NPS 97Gila NM FS 97Great Smoky Mtns TN NPS 97
Lostwood ND FWS 97James River VA FS 97Pinnacles CA NPS 97Bosque del Apache NM FWS 97Columbia Gorge East WA FS 97Wichita Mountain OK FWS 97Trapper Creek-Denali AK NPS 97White Mountain NM FS 97Upper Buffalo AR FS 96Medicine Lake MT FWS 96San Gabriel CA FS 96Voyageurs MN NPS 96Shenandoah VA NPS 96Casco Bay ME STATE 96Lava Beds CA NPS 96Olympic WA NPS 96Washington DC DC NPS 96Seney MI FWS 96Yosemite CA NPS 96Northern Cheyenne MT Northern
Cheyenne Tribe 96 *Badlands SD NPS 95Monture MT FS 95Wind Cave SD NPS 95Proctor Research Center VT STATE 95Pasayten WA FS 95Queen Valley (Superstition) AZ STATE 95Cherokee OK Cherokee Tribe 95 *Livonia IN EPA 94Sula MT FS 94Death Valley CA NPS 94Sycamore Canyon AZ FS 94Zion UT NPS 94Kalmiopsis OR FS 94Salt Creek NM FWS 94Okefenokee GA FWS 94Bliss CA FS 94Cadiz KY EPA 94Phoenix QA QA 94Swanquarter NC FWS 94Hoover CA FS 93Mount Baldy AZ FS 93Hells Canyon OR FS 93Mount Rainier WA NPS 93Great Sand Dunes CO NPS 93Craters of the Moon ID NPS 93
Joshua Tree CA NPS 93White Pass WA FS 93Flathead MT Confederated
Salish &KootenaiTribes of theFlathead Res. 92 *
Cloud Peak WY STATE 92 *Thunder Basin WY STATE 92 *Bridger WY FS 92Crater Lake OR NPS 92Lye Brook VT FS 92Dolly Sods WV FS 92Gates of the Mountains MT FS 92Yellowstone WY NPS 91San Gorgonio CA FS 91Lassen Volcanic CA NPS 91Sawtooth ID FS 91Caney Creek AR FS 91Great River Bluffs MN STATE 91 **Chassahowitzka FL FWS 91Weminuche CO FS 90Columbia Gorge West WA STATE 90Canyonlands UT NPS 90Brigantine NJ FWS 90Ellis OK STATE 90 *North Absaroka WY FS 90
LEGEND:NPS National Park ServiceFS USDA Forest ServiceFWS US Fish and Wildlife ServiceEPA Environmental Protection AgencySTATE State SponsoredQA Quality Assurance Site* Site started in 2nd quarter** Site started in 3rd quarter
Three new sites were added in January 2003:Organ Pipe, AZ, State of ArizonaMartha's Vineyard, MA, Wampanoags TribeZion Canyon, UT, NPS