rice yield and cost in relation to factors of production
TRANSCRIPT

Evidence from Regular Monitoring of
Rice-Based Farm Household Survey
(RBFHS) 2011-2012
Mary Grace C. Lapurga
Flordeliza H. Bordey
SED Staff
RICE YIELD AND COST
In Relation to Factors
of Production

Objectives
Costs and returns of
Rice Production
Relate rice yield and cost to
factors affecting production
Present costs and returns of
rice production in 2011WS-
2012DS
Demonstrate yield and cost
variations across provinces
and seasons
Regular Monitoring of Rice-Based Farm Households Survey (2011WS – 2012DS)

Rice Yield (t/ha)
Production
cost Social
characteristics
Spatial
distribution
Costs and Returns
of Rice Production
Factors
Regular Monitoring of Rice-Based Farm Households Survey (2011WS – 2012DS)
Part I Part II
Part III
Conclusion
Outline of presentation

RBFHS 2011-2012 Data
Costs and returns of
Rice Production
Regular Monitoring of Rice-Based Farm Households Survey (2011WS – 2012DS)
2011 WS Harvest
(Jul – Dec 2011)
2012 DS Harvest
(Jan – Jun 2012)
n = 2,399
n = 2,051
Temporarily
stopped farming
Crop failure
Missing data

Regular Monitoring of Rice-Based Farm Households Survey (2011WS – 2012DS)
Rice Yield

5
Regular Monitoring of Rice-Based Farm Households Survey (2011WS – 2012DS)
2011WS = 3.67 t/ha 2012DS = 4.13 t/ha
5.4 t/ha
6.3 t/ha

Water source
5
Regular Monitoring of Rice-Based Farm Households Survey (2011WS – 2012DS)
Out of 13 typhoons that
visited the country between
July-December 2011, three of
those traversed Nueva Ecija.
http://www.pagasa.dost.gov.ph/index.php/tropical-cyclone-information/25-tropical-cyclones/33-annual-tropical-cyclone-tracks#2011

Regular Monitoring of Rice-Based Farm Households Survey (2011WS – 2012DS)
Provinces with no color
indicate that there was
no farmer with rainfed
rice parcel.
Irrigated = 4.15 t/ha Rainfed = 2.90 t/ha
5.43 t/ha 5.32 t/ha
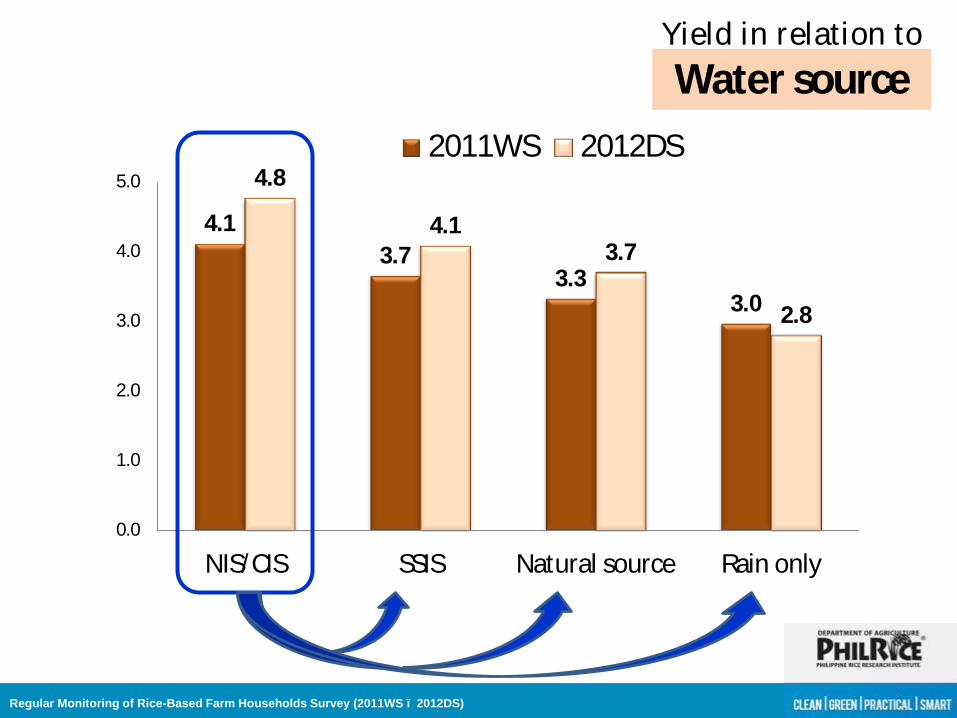
4.1
3.7 3.3
3.0
4.8
4.1 3.7
2.8
0.0
1.0
2.0
3.0
4.0
5.0
NIS/CIS SSIS Natural source Rain only
2011WS 2012DS
Regular Monitoring of Rice-Based Farm Households Survey (2011WS – 2012DS)
Water source Yield in relation to
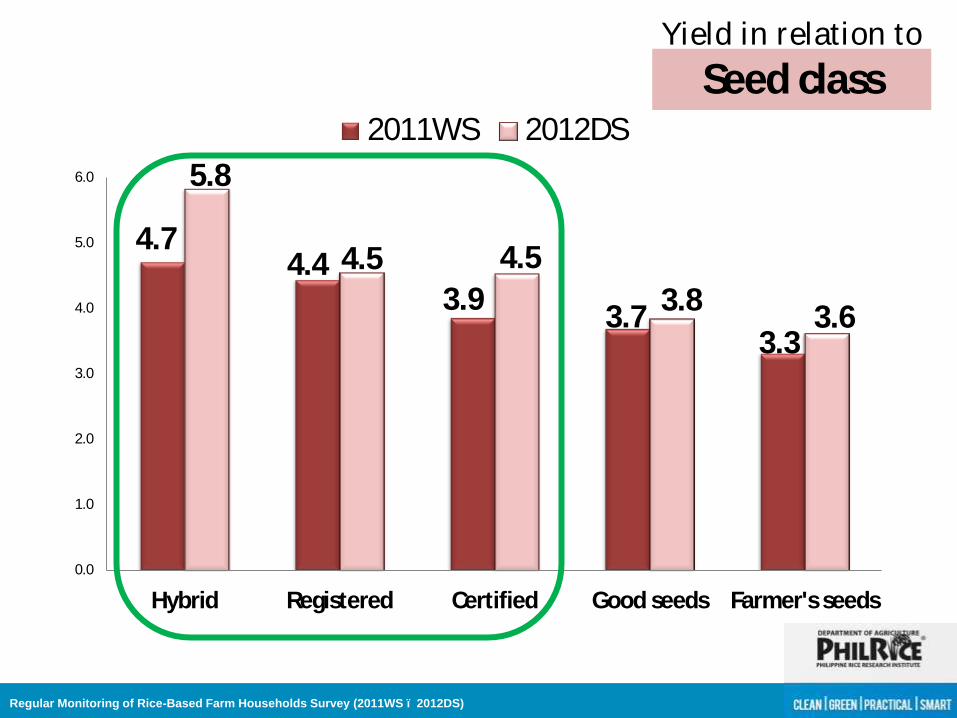
4.7 4.4
3.9 3.7
3.3
5.8
4.5 4.5
3.8 3.6
0.0
1.0
2.0
3.0
4.0
5.0
6.0
Hybrid Registered Certified Good seeds Farmer's seeds
2011WS 2012DS
Regular Monitoring of Rice-Based Farm Households Survey (2011WS – 2012DS)
Seed class Yield in relation to

3.8 3.4
4.2 3.9
0.0
1.0
2.0
3.0
4.0
5.0
Transplanted Direct-seeded
Yield (t/ha)
2011WS 2012DS
Regular Monitoring of Rice-Based Farm Households Survey (2011WS – 2012DS)
Crop establishment Yield in Relation to

Nitrogen level
2.9
3.6 4.1
4.4
3.1
3.9
4.8
5.4
0.0
1.0
2.0
3.0
4.0
5.0
6.0
0-40 kg/ha >40-80 kg/ha >80-120 kg/ha >120 kg/ha
Yield (t/ha)
2011WS 2012DS
Regular Monitoring of Rice-Based Farm Households Survey (2011WS – 2012DS)
Yield in relation to

3.5 3.9
4.3 4.2
3.7
4.6 4.9
5.5
0.0
1.0
2.0
3.0
4.0
5.0
6.0
<20 kg/ha 20-30 kg/ha >30-40 kg/ha >40 kg/ha
Yield (t/ha) 2011WS 2012DS
Regular Monitoring of Rice-Based Farm Households Survey (2011WS – 2012DS)
Phosphate (P2O5) level
Yield in relation to

3.50
4.17 4.45 4.26
3.86
4.69 4.84
5.78
0.0
1.0
2.0
3.0
4.0
5.0
6.0
<20 kg/ha 20-30 kg/ha >30-40 kg/ha >40 kg/ha
Yield (t/ha) 2011WS 2012DS
Regular Monitoring of Rice-Based Farm Households Survey (2011WS – 2012DS)
Potassium oxide (K2O) level
Yield in relation to

Regular Monitoring of Rice-Based Farm Households Survey (2011WS – 2012DS)
3.44 3.68
3.47 3.44 3.85 3.69
4.10 3.86
0.0
1.0
2.0
3.0
4.0
5.0
Weeds Insects Diseases Oth Pests
No Chem Control W/ Chem Control
2011 Wet season
Pests management Yield in relation to
Observed pests

Regular Monitoring of Rice-Based Farm Households Survey (2011WS – 2012DS)
3.7 3.5 3.6
3.4
4.3 4.1
4.6 4.3
0.0
1.0
2.0
3.0
4.0
5.0
Weeds Insects Diseases Other Pests
No Chemical Control With Chemical Control
2012 Dry Season
Pests management Yield in relation to
Observed pests

Regular Monitoring of Rice-Based Farm Households Survey (2011WS – 2012DS)
4.1 3.7
0.0
1.0
2.0
3.0
4.0
5.0
With training Without training
Training participation
Yield in relation to

Education
Regular Monitoring of Rice-Based Farm Households Survey (2011WS – 2012DS)
Education Yield in relation to
3.74 4.01
0.0
1.0
2.0
3.0
4.0
5.0
No education - Elementary High school - college

Regular Monitoring of Rice-Based Farm Households Survey (2011WS – 2012DS)
Rice Yield (t/ha) Seed class
Fertilizer
Pesticide
Ecosystem
Education
Training
Season
WHAT IF?
Rice Yield (t/ha) = All possible factors
affecting yield
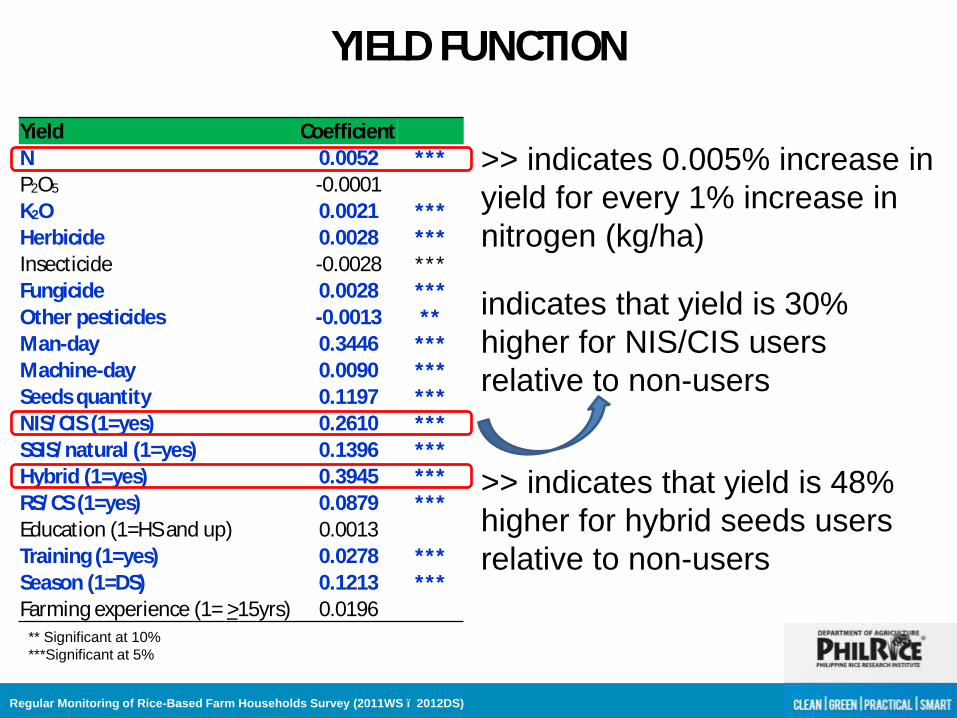
YIELD FUNCTION
Regular Monitoring of Rice-Based Farm Households Survey (2011WS – 2012DS)
** Significant at 10%
***Significant at 5%
Yield Coefficient
N 0.0052 *** P2O5 -0.0001
K2O 0.0021 *** Herbicide 0.0028 ***
Insecticide -0.0028 *** Fungicide 0.0028 ***
Other pesticides -0.0013 ** Man-day 0.3446 ***
Machine-day 0.0090 *** Seeds quantity 0.1197 *** NIS/CIS (1=yes) 0.2610 ***
SSIS/natural (1=yes) 0.1396 *** Hybrid (1=yes) 0.3945 ***
RS/CS (1=yes) 0.0879 *** Education (1=HS and up) 0.0013
Training (1=yes) 0.0278 *** Season (1=DS) 0.1213 ***
Farming experience (1= >15yrs) 0.0196
>> indicates 0.005% increase in
yield for every 1% increase in
nitrogen (kg/ha)
>> indicates that yield is 48%
higher for hybrid seeds users
relative to non-users
indicates that yield is 30%
higher for NIS/CIS users
relative to non-users

Regular Monitoring of Rice-Based Farm Households Survey (2011WS – 2012DS)
Production Cost

42% 45%
5 5
14% 13%
5 4
25% 23%
2 3
6 5
2 2
0
10
20
30
40
50
60
70
80
90
100
2011 WS 2012 DS
% Cost share
Fertilizer
Labor & power
Land rent
Regular Monitoring of Rice-Based Farm Households Survey (2011WS – 2012DS)
>seeds
>pesticides
>interest
>other inputs
>irrigation & drainage
2011WS = PhP 42,201 2012DS = PhP 44,908

Regular Monitoring of Rice-Based Farm Households Survey (2011WS – 2012DS)
2011WS = Php11.49/kg 2012DS = Php10.88/kg
PhP8.22 PhP9.05

43% 45%
5 5
14% 11%
4 5
24% 25%
0
10
20
30
40
50
60
70
80
90
100
Irrigated Rainfed
% Cost share
Fertilizer
Labor & power
Land rent
Regular Monitoring of Rice-Based Farm Households Survey (2011WS – 2012DS)
>seeds
>pesticides
>interest
>other inputs >irrigation & drainage
Irrigated = PhP 46,029 Rainfed = PhP 33,978

Water source
Regular Monitoring of Rice-Based Farm Households Survey (2011WS – 2012DS)
Irrigated = PhP11.09/kg Rainfed = PhP11.73/kg
PhP8.47
PhP8.65

Regular Monitoring of Rice-Based Farm Households Survey (2011WS – 2012DS)
COST FUNCTION Cost/kg Coefficient Yield -0.679 ***
Seed price 0.054 *** N price 0.012 **
P2O5 price -0.008 K2O price 0.022 ***
Herbicide price -0.003 Other pesticides price -0.002
Insecticide price -0.009 *** Fungicide 0.003 Man-day price 0.098 ***
Machine-day price -0.009 *** NIS/CIS (1=yes) 0.145 ***
SSIS/natural (1=yes) 0.085 *** Hybrid (1=yes) -0.079 ***
RSCS (1=yes) 0.002
Education (1= HS and up) 0.005
Training (1=yes) 0.004 Season (1=DS) 0.017 ***
Farming experience (1= >15yrs) -0.005 _cons 7.311 ***
indicates 0.679% decrease
in cost/kg for every 1%
increase in yield
0.009% decrease in cost/kg
for every 1% increase in
machine-day price >>
>>
cost/kg is 7.6% lower for
hybrid seeds users
relative to non-users
>>
** Significant at 10%
***Significant at 5%

Regular Monitoring of Rice-Based Farm Households Survey (2011WS – 2012DS)
Nueva Ecija
Nueva
Ecija
Cost/kg
Yield
(t/ha) Davao Oriental
Ilocos Norte
Cagayan
Mindoro Oriental
Tarlac
Zamboanga del Sur
Bohol
Camarines Sur
Leyte
Maguindanao
Northern Samar
Bulacan
Compostela Valley Davao del Norte
Davao del Sur Mindoro Occidental
South Cotabato Zamboanga Sibugay
Agusan del Norte
Agusan del Sur
Albay
Bukidnon
Iloilo Isabela Laguna
North Cotabato Pampanga
Quezon
Sultan Kudarat
Pangasinan Zamboanga del Norte
Aurora

Regular Monitoring of Rice-Based Farm Households Survey (2011WS – 2012DS)
Costs & Returns from Rice Production

Returns from Rice Production by season
Water source
Regular Monitoring of Rice-Based Farm Households Survey (2011WS – 2012DS)
ITEMS 2011 WS 2012 DS
Yield (kg/ha) 3,673 4,129
Price per kg (PhP/kg) 13.23 14.23
Gross Revenue (PhP/ha) 48,582 58,777
Total Production Cost (PhP/ha) 42,201 44,908
Net profit
from Rice Farming (PhP/ha) 6,381 13,868 from Rice Farming + Returns to Own Labor, Land, and Capital (PhP/ha) 20,788 29,116

Returns from Rice Production by ecosystem
Water source
Regular Monitoring of Rice-Based Farm Households Survey (2011WS – 2012DS)
ITEMS Irrigated Rainfed
Yield (kg/ha) 4,152 2,896
Price per kg (PhP/kg) 13.78 13.38
Gross Revenue (PhP/ha) 57,206 38,740
Total Production Cost (PhP/ha) 46,029 33,978
Net profit
from Rice Farming (PhP/ha) 11,177 4,762 from Rice Farming + Returns to Own Labor, Land, and Capital (PhP/ha) 26,576 17,339

0.00
2.00
4.00
6.00
8.00
10.00
12.00
14.00
16.00
18.00
20.00
22.00
24.00
0 2 4 6 8 10 12 14 16
2011 Wet season
0.00
2.00
4.00
6.00
8.00
10.00
12.00
14.00
16.00
18.00
20.00
22.00
24.00
0 2 4 6 8 10 12 14 16
2012 Dry season
Cost/kg)
Yield (t/ha)
0.6%
1.4%
40.5%
50.0%
0.1%
0.1%
48.5%
58.8%

Regular Monitoring of Rice-Based Farm Households Survey (2011WS – 2012DS)
SUMMARY & CONCLUSION

Regular Monitoring of Rice-Based Farm Households Survey (2011WS – 2012DS)
Summary
Yield Enhancing Cost Reducing
Use of high quality seeds
N & P2O5 fertilizer
application
Pesticide (except
insecticide) application
Access to irrigation
Training
Season
Higher yield
Machine-day price
Use of hybrid seeds
Insecticide AI price

Regular Monitoring of Rice-Based Farm Households Survey (2011WS – 2012DS)
Conclusion
The use of high quality seeds is still a significant factor
(across season) that can further improve the yield.
Sufficient water supply also contributes to a significant
increase in yield.
Efficient pests management, nutrient management and
farmer’s knowledge can also improve the yield.
Reducing labor cost, particularly harvesting and
threshing, can lead to lower unit cost.
Given that farmers are spending this much for rice
farming, increasing their yield is still a good strategy that
can result to lower cost/kg.

Regular Monitoring of Rice-Based Farm Households Survey (2011WS – 2012DS)
Thank you.