rice prices and growth, and poverty reduction in bangladeshrice cultivation accounts for 48 percent...
TRANSCRIPT

Rice prices and growth, and poverty reduction in Bangladesh
Background paper to the UNCTAD-FAO
Commodities and Development Report 2017Commodity Markets, Economic Growth and Development

Rice prices and growth, and poverty reduction in Bangladesh
Khan Ahmed Sayeed Murshid Mohammad Yunus
Food and Agriculture Organization of the United Nations Rome, 2018

The designations employed and the presentation of material in this information product do not imply the expression of any opinion whatsoever on the part of the Food and Agriculture Organization of the United Nations (FAO) concerning the legal or development status of any country, territory, city or area or of its authorities, or concerning the delimitation of its frontiers or boundaries. The mention of specific companies or products of manufacturers, whether or not these have been patented, does not imply that these have been endorsed or recommended by FAO in preference to others of a similar nature that are not mentioned. The views expressed in this information product are those of the author(s) and do not necessarily reflect the views or policies of FAO. ISBN 978-92-5-130107-4 © FAO, 2018 FAO encourages the use, reproduction and dissemination of material in this information product. Except where otherwise indicated, material may be copied, downloaded and printed for private study, research and teaching purposes, or for use in non-commercial products or services, provided that appropriate acknowledgement of FAO as the source and copyright holder is given and that FAO’s endorsement of users’ views, products or services is not implied in any way. All requests for translation and adaptation rights, and for resale and other commercial use rights should be made via www.fao.org/contact-us/licence-request or addressed to [email protected]. FAO information products are available on the FAO website (www.fao.org/publications) and can be purchased through [email protected]. This publication has been printed using selected products and processes so as to ensure minimal environmental impact and to promote sustainable forest management.

iii
Contents Acronyms ............................................................................................................................................ v
Abstract ………………………………………………………………………………………………………..vii I. Background and context .................................................................................................... 1
a. Importance of rice to Bangladesh’s development ........................................ 1
b. The structure of the rice sector ............................................................................ 3
c. Institutional and policy environment ................................................................ 4
d. Extent of relevance for other countries ............................................................ 6
II. Rice prices and their relationship to local growth and development .............. 8
a. Integration of domestic rice markets ................................................................ 8
b. Trends and impact of global rice prices ............................................................ 9
c. Effects of rice prices on consumers, traders, millers and producers . 12
d. Prices, poverty, food security and growth .................................................... 15
III. Impact of high food prices - a quantitative analysis ............................................. 17
a. Rice marketing patterns and household welfare ....................................... 17
b. Rice prices, real income and poverty .............................................................. 19
c. Absolute and relative rice prices and rural agricultural wages ........... 22
IV. Policy implications of the findings and conclusion .............................................. 23
References ...................................................................................................................................... 24 ANNEX A ………………………………………………………………………………………………………28
a. Integration of domestic and international rice markets ................ 28
b. Import policy of rice in Bangladesh ........................................................... 30
c. Modeling volatility of international rice prices ................................... 32
ANNEX B… ....................................................................................................................................... 34


v
Acronyms
ADF Augmented Dickey-Fuller Test ARCH Autoregressive Conditional Heteroskedasticity BADC Bangladesh Agricultural Development Corporation BBS Bangladesh Bureau of Statistics BPL Below Poverty Line BRRI Bangladesh Rice Research Institute CPI Consumer Price Index FGT Foster, Greer and Thorbecke method FOB Free On Board GARCH Generalized Autoregressive Conditional Heteroskedasticity GDP Gross Domestic Products HCR Head Count Ratio HIES Household Income and Expenditure Share HYV High-Yield Variety MMT Million Metric Tonnes NBR Net Benefit Ratio OMS Open Market Sales PFDS Public Food Distribution System TFP Total Factor Productivity VECM Vector Error Correction Model


vii
Abstract This paper examines the complex relationship between rice prices and economic
growth, poverty reduction, and food security in Bangladesh including the impact on producers and consumers. The impact on macro variables is also examined. Using available literature and knowledge of Bangladesh, the researchers examine whether or not a relationship between economic growth/poverty reduction in Bangladesh and rice prices likely exists, and also discusses the mechanisms through which the two are potentially related. The paper finds that historically, the rice sector used to dominate Bangladesh agriculture and the economy as a whole, determining GDP growth rates, inflation, wages, employment, food security and poverty with the rice price being a very sensitive economic and political economy variable. This has changed dramatically with a much more diversified agricultural economy, declining share of agriculture and rice in GDP and rapid industrialization and growth of services. The rice sector (production) has benefited immensely from the Green Revolution, tripling production in three decades and continuing to play a significant role in employment creation and food security. It also benefited from the trade liberalization and structural adjustment reforms of the 1980s and 1990s that served to open up agriculture to world market forces while also reducing subsidies and withdrawing from a number of direct interventions. The startling fact is that the performance of the sector was accompanied by a long–term decline in real rice prices. It is unlikely that this kind of performance is sustainable in the absence of any further technological, cost–reducing breakthroughs so that policy makers need to focus on how to deliver price and non–price incentives to this important sector.


1
I. Background and context
a. Importance of rice to Bangladesh’s development Rice is Bangladesh’s largest crop and the main staple food for the 157 million
people of the country. Its role in the economy is huge both at the macro level and at the micro level given the volume of production, employment (of both men and women in production), trade and processing, food security and nutrition, and potential macro effects on prices, inflation and poverty given the large weight of food and rice in the CPI, and potentially on the balance of payments and on the reserves (if, for example, a sudden shortage leads to large, unexpected imports from the world market).1
Rice cultivation accounts for 48 percent of total rural employment – a figure that
is expected to rise even more if rice trading, transport and processing activities are also taken into account. It also provides two–thirds of the caloric needs of the nation along with half the protein consumed. Its contribution to agricultural GDP is about 70 percent while its share of national income is one–sixth. In other words, rice continues to play a critical role in Bangladesh even though the long–term trajectory is one of decline (Faruqee, 2012).
Today, more than 13 million farms grow rice (BRRI2) covering some 10.5 million
hectares – a figure that has generally been stable over the last three decades. Accounting for 75 percent of the total cropped area and 80 percent of the irrigated land (Hossain and Deb, 2011).
Since 1972, a major pillar of the Government’s agricultural development policy
has been to achieve “self–sufficiency” in rice in order to attain food security, with the main approach being to popularize the new high–yield variety (HYV), seed–fertilizer–water based “Green Revolution” technology amongst traditional farmers. This was sought to be stimulated through a combination of measures intended to encourage adoption by farmers unfamiliar to the new technology.
Initial efforts were aimed at both the rainy season rice crops (Aus and Aman) as
well as the dry–season (Boro) crop. The former is rainfed while the latter requires irrigation and water control. Eventually, much of the focus essentially fell on the Boro season, which at the time contributed very little to total production. Thanks to massive investments in modern irrigation (mostly small scale techniques like pumps and tube wells to tap both surface and large ground water reserves), the Boro rice has now become the most important crop. Thus, total production tripled over 1971–2013, rising from 11 million metric tonnes (MMT) to around 34 MMT today (Hossain, 2015), turning Bangladesh into a largely rice self–sufficient nation after decades of struggle, overcoming complex constraints related to technology adoption, policy reforms and institutions. In fact, rice–dominated agriculture performed spectacularly well in the last two decades, and especially in the period after 2005, leading some observers to suggest
1 In fact Bangladesh faced exactly such a situation during the global financial crisis of 2008–2009 when world rice prices skyrocketed to over US $ 1 000 per ton, and even at this price it was difficult to obtain supplies. 2 Bangladesh Rice Research Institute.

2
that Bangladesh’s performance was not only the best in South Asia, but was better compared to even many East Asian countries.3
Today, Bangladesh no longer has to depend on massive food imports or food aid,
thus easing its balance of payments and helping foreign reserves to remain healthy. At the same time, availability of food (rice) has kept real prices generally low compared to wages – thus having a very positive impact on access issues, especially poverty. Indeed the growth in real rural wages has been rapid, especially after 2005 so that today, urban–rural wage differentials have dramatically declined.
However, given rapid economic growth in the economy, the corresponding role
of agriculture and rice is slowly diminishing over time. The agriculture’s share in the GDP of Bangladesh, broadly defined (in order to include fisheries, livestock and forestry) was 55 percent in the 1960s, falling to 44 percent and 32 percent in the 1970s and 1980s and down to less than 15 percent in 2015. The share of rice in the economy has also dropped at a slightly higher rate, currently fixed at above 70 percent of agricultural GDP (i.e. 7–8 percent of total GDP in 2013, down from 18 percent in 1996).4
Within the crops sub–sector, the structure of production has not changed much
with a low value for the Simpson Diversity Index reflecting that some 77–80 percent of the cultivated land is under paddy, as already observed. In value terms, the share of rice in total value of crops has declined somewhat from 74 percent to 64 percent since the early 1990s (World Bank, 2015). However, rice remains the largest contributor to growth in the crops sub–sector. Consumption, nutrition and poverty
Rice prices and rice consumption are a sensitive matter in Bangladesh given its huge importance in the local diet. The government is always keen to ensure that prices remain stable and within the purchasing power of the poor. For this reason the government has to preserve an adequate reserve stock for emergency off–takes as well as distribution to the poor in the event of an unforeseen shortage. Currently, official cereal stocks vary between 1.1–1.5 MMT, with reserves built up mostly through domestic procurement and sometimes imports. In fact, Bangladeshis are probably the largest per capita consumers of rice in the world today. The challenge for the future is to promote a more diverse diet that would increasingly replace rice with fruits, vegetables, pulses, fish, dairy products and meat – a trend that already is underway. Hossain (2015) shows that over the period 1983/84 to 2010, consumption of food (gram/person/day) rose from 761 to 952 – the increase being accompanied by a significant decline in rice consumption and quite acute increases in vegetables, fruits and other food consumption.
The rice price is also of great interest to the millions of rice farmers in the country.
However, the general trend over much of the last 10–15 years has been one of decline in real prices. Productivity gains in rice appear to have helped keep the cultivation profitable, especially after 2005.
3 This is based on some preliminary analysis by Bangladeshi and World Bank experts shared informally with the authors. 4 CPD (2015); Ahmed (2004).
3
The impact on poverty is quite direct. Food deficit is directly linked to rice prices, and for small and marginal farmers, to rice yields.5 In other words, the policy concerning rice is complex, requiring a fine balancing act between the interests of producers and consumers. It also has significant implications for the State budget arising out of the financing of procurement and distribution/off–takes as well as due to safety nets involving targeted distribution to vulnerable groups facing food insecurity, or price stabilization efforts through large open market sales.
The main macro impact of rice prices is on inflation (given the large weight of
food and rice in the CPI), such that rice price movements could have, at least indirectly, implications for both the budget and the balance of payments. The latter becomes a worry when there is a sudden deficit due to a poor harvest combined with a sudden commodity price surge, as happened at the time of the Global Financial Crisis in 2007–2008.
b. The structure of the rice sector Production
Rice production takes place in all districts of Bangladesh and in all kinds of agro–
ecological zones. The rice area has remained basically unchanged over the last three decades, although production seasonality has altered greatly. Thus, in the 1970s and 1980s, rice was dominated by Aman production (harvested in November–December). The introduction of irrigation made it possible to grow rice extensively in the dry Boro season harvested in May–June. This has now become the dominant rice–growing season in the country. A third rice crop is also grown in some areas, namely the Aus crop, harvested in July–August.
Rice is cultivated in small, family farms as the main food crop while other
important crops are potato, wheat, maize, jute, sugarcane and oilseeds. However, the average size of farms has been declining over the years (e.g. from 0.89 hectare in 1983/84 to 0.6 hectare in 2008 – see Hossain, 2015) and there also appears to be a decline in farm households’ that depend largely on farming for their income/livelihoods. Flourishing farming is combined with a mutitude of other non–farm work while a lot of people are leaving farming altogether resulting in a rising share of tenant farms.
In Bangladesh 70 percent of the people live in rural areas where agriculture
remains the main source of income. Some 60 percent of rural households engage in farming. The landownership however, is unequal as is the access to food directly from own production. Almost 30 percent of households own no land and another 35 percent own less than half an acre of land (World Bank, 2015). Such small pieces of land cannot provide those farmers with sufficient food for their family even with the best technology available. Thus for the majority of the population, buying food from the market is essential for food security which in turn is a function of wages and earnings.
5 The poverty line consumption–expenditure level consists of food and non–food expenditures. Food poverty refers to a situation when someone is unable to meet even the basic food needs.

4
Trade and milling Important changes have taken place in the rice trade as rice cultivation moved
away from a largely subsistence–driven activity to a much more commercial activity. The marketed surplus of rice is around 45 percent (Jabbar, 2010) indicating that some 15 MMT enter into the market annually, with the bulk of it sold by only 14 percent of farms (Bayes and Hossain, 2007). The unhusked rice is milled in semi–automatic and automatic rice mills and sold to both local and long–distance traders – the bulk of it going to the latter. This was a huge change since 20 years before when marketed quantities were much smaller and when milling technology was much more basic with a significant “traditional” segment relying on small/minor processors for initial preparations before carrying out paddy crushing in semi–automatic mills. There has been huge expansion of milling capacity with the advent of large scale, fully automatic mills since the late 1990s. Precise numbers are unavailable but micro surveys point to a doubling of capacity. Thus, in Noakhali, 20 large rice mills have been set up covering 90 percent of the market in 2010 compared to ten years before when large mills covered only 10 percent of the market (Murshid, 2015).
Similarly, the expansion of the market involving long distance trade has led to
two distinct market circuits: a small, local one that caters to local demand and tastes and a long–distance, urban oriented one that caters to urban demand and tastes. An interesting outcome of this process has been rising value addition in the milling sector where “quality” is created from basic rice through polishing, cutting and grading and bagging which allows the millers to properly allocate the bulk of the trade margin between the producer and the consumer (Murshid, 2015).
A modern retail sector is also slowly settling where higher value branded rice and
“organic” rice are being marketed for the more affluent urban consumers. This sector is projected to grow quickly although currently it has an insignificant presence in the market.
c. Institutional and policy environment
There is a long tradition of state intervention in all aspects of the rice economy –
production, trade, distribution, stocks, food relief, rationing systems, provision of a minimum price for growers, procurement operations by the Public Food Distribution System (PFDS) to meet all the different, complex objectives of the government, inter alia to stabilize food prices, ensure a fair price to growers, achieve food self–sufficiency, and channel food to safety–net operations.
Major reforms took place in the 1990s for both input and output markets. For the
first time, the private sector was allowed to import food – an activity that was hitherto the sole privilege of the government. Previously, the government had operated from the basic assumption that the private sector could not be trusted because of the widespread belief that they would control the market and cause food prices to become excessive.
5
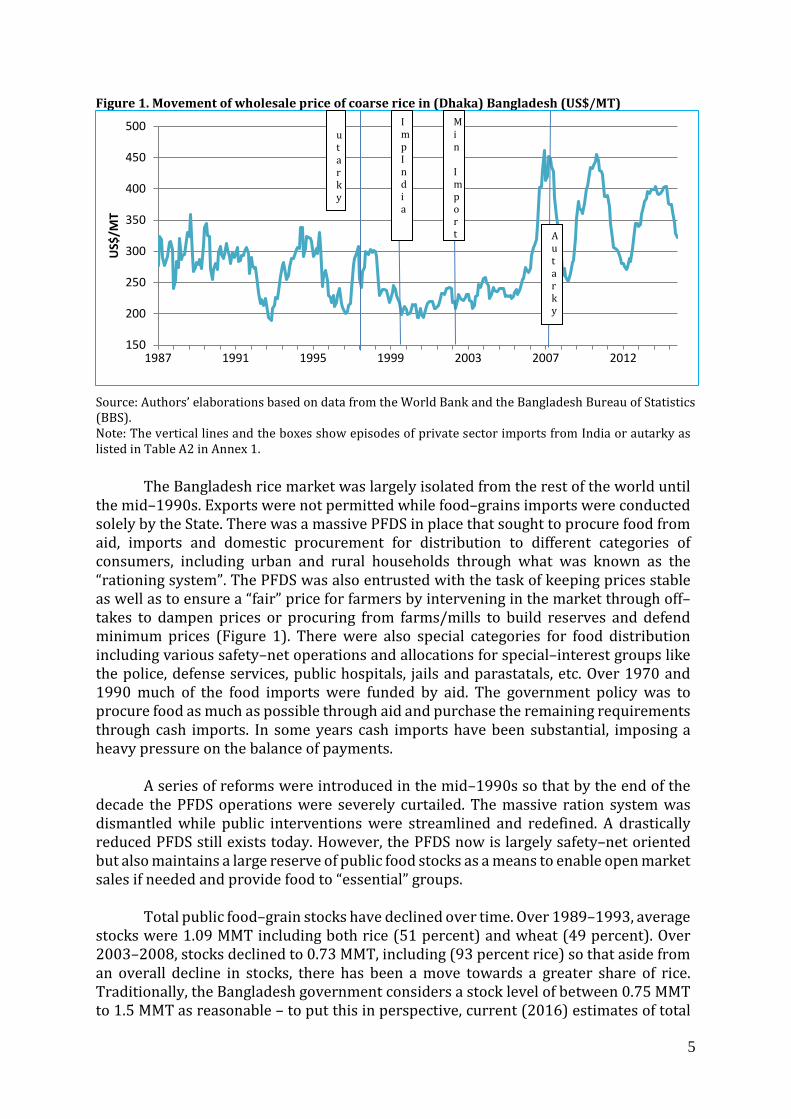
Figure 1. Movement of wholesale price of coarse rice in (Dhaka) Bangladesh (US$/MT)
Source: Authors’ elaborations based on data from the World Bank and the Bangladesh Bureau of Statistics (BBS). Note: The vertical lines and the boxes show episodes of private sector imports from India or autarky as listed in Table A2 in Annex 1.
The Bangladesh rice market was largely isolated from the rest of the world until
the mid–1990s. Exports were not permitted while food–grains imports were conducted solely by the State. There was a massive PFDS in place that sought to procure food from aid, imports and domestic procurement for distribution to different categories of consumers, including urban and rural households through what was known as the “rationing system”. The PFDS was also entrusted with the task of keeping prices stable as well as to ensure a “fair” price for farmers by intervening in the market through off–takes to dampen prices or procuring from farms/mills to build reserves and defend minimum prices (Figure 1). There were also special categories for food distribution including various safety–net operations and allocations for special–interest groups like the police, defense services, public hospitals, jails and parastatals, etc. Over 1970 and 1990 much of the food imports were funded by aid. The government policy was to procure food as much as possible through aid and purchase the remaining requirements through cash imports. In some years cash imports have been substantial, imposing a heavy pressure on the balance of payments.
A series of reforms were introduced in the mid–1990s so that by the end of the
decade the PFDS operations were severely curtailed. The massive ration system was dismantled while public interventions were streamlined and redefined. A drastically reduced PFDS still exists today. However, the PFDS now is largely safety–net oriented but also maintains a large reserve of public food stocks as a means to enable open market sales if needed and provide food to “essential” groups.
Total public food–grain stocks have declined over time. Over 1989–1993, average
stocks were 1.09 MMT including both rice (51 percent) and wheat (49 percent). Over 2003–2008, stocks declined to 0.73 MMT, including (93 percent rice) so that aside from an overall decline in stocks, there has been a move towards a greater share of rice. Traditionally, the Bangladesh government considers a stock level of between 0.75 MMT to 1.5 MMT as reasonable – to put this in perspective, current (2016) estimates of total
150
200
250
300
350
400
450
500
1987 1991 1995 1999 2003 2007 2012
US$
/MT
ImpIndia
Min
Import A
utarky
utarky

6
food grain availability in the country is around 40 MMT including 34.8 MMT of rice (see Shahabuddin et al., 2009).
Similarly, the use of the stocks has also changed over time with declining volumes
through the “sales channels” and fairly stable “non–sale channels”.6 In relative terms, the share of non–sale or targeted channels has become much more important, generally improving efficiency of the overall PFDS (Shahabuddin et al., 2013).
As part of the trade liberalization reforms, duties on imported agricultural
equipment were drastically reduced which allowed much easier access to irrigation pumps and power tillers used in rice production. At the same time, subsidies on inputs were reduced and streamlined, making the sector much more competitive and robust.
Another aspect of the story is the systematic promotion of the Green Revolution
technology by the government since the 1970s. Policies included provision of irrigation, subsidized inputs and credit, and creation of irrigation water–user groups – a policy that has continued so far with some modifications and changes. As a result, the country today has reached a position where further productivity gains will be more and more difficult to achieve although some observers feel that such gains will need to be pursued with intensity, given the continuing population pressure (Hossain, 2015).
d. Extent of relevance for other countries Bangladesh’s experience with trade liberalization, structural adjustment and
policy reforms in agriculture (mainly rice) has been exemplary. Trade liberalization in both input and output markets resulted in much cheaper availability of capital goods and inputs, lowering production costs and raising profitability (Ahmed, 1999). At the same time, the private sector quickly entered the rice import market to a great extent and was able to respond much more quickly to market demands through rice imports, mainly from India (which typically held huge reserves).
Dismantling of the PFDS and its restriction to a few basic operations (related to
market stability, targeted food distribution and safety nets) resulted in a very positive impact on the budget. Similarly, reduction in subsidies related to food and inputs has also made agriculture more competitive and less reliant on donations. Input distribution was liberalized allowing the private sector to engage in this role instead of a top–heavy public corporation (Bangladesh Agricultural Development Corporation – BADC) that allowed huge efficiency gains to be made and lowered pressure on government finances.
The food/rice sector in Bangladesh is now on a good basis although some
“distortions” still persist, principally related to subsidies on fertilizer and diesel. The main challenge is now to extend the production frontier through more recent technology and better management. The potential of the existing technology is nearing exhaustion so that a second–generation green revolution is now very much needed. Severe market failures still exist, particularly with reference to input markets and the quality of inputs
6 Sales channels mainly include essential priorities (military, paramilitary, police etc.) and open market sales. Non–sales channels include food for works and other targeted channels of distribution.

7
as spurious pesticides and fertilizers are rampant. The more recent success of the food and agricultural sector took place despite an unfavorable macro policy environment. Two major indicators of interest in this connection are the sectoral terms of trade and the external policy environment (i.e. nominal and relative rates of protection). Neither of these indicators was favorable for agriculture (Kathuria and Malouche, 2015).
The Bangladesh experience is relevant to all developing countries (and perhaps
even developed countries) that heavily protect their agriculture – both output and input markets. It is also relevant for countries with large food parastatals or public food or input distribution systems set up to regulate food/input prices. Unfortunately, there are many such countries today including India (massive subsidies for food and large reserves, regulated markets – both domestic and international, overseen by the Food Corporation of India). Other countries include those in Sub–Saharan Africa and Middle East North Africa along with countries like Thailand and Viet Nam, which intervene quite heavily in the rice market. It would also be important for countries like Cambodia that are currently exploring ways to intervene in their rice economy.
8
II. Rice prices and their relationship to local growth and development
The price of rice remains a sensitive factor for producers, poor consumers and
policy makers. At the local level, it affects poor consumers who derive the major proportion of calorie intake from rice (70 percent in 2009). It also matters to producers, for whom rice cultivation is increasingly a commercial activity and often accounts for a large share of total annual household income. As a wage–good, it affects the level of wages in the labor market in both rural and urban areas although this link appears to be weakening (Rashid, 2002).
Apart from the direct effects of rice prices on the local economy, there are a range
of indirect effects through processing, trade, transport and retailing. In other words relatively high prices are good not only for producers but also for actors along the value chain. In particular, the role of millers has become very important as this sector accounts for the lion’s share of the increasing value addition in the rice value chain (Minten et al., 2011).
a. Integration of domestic rice markets
A question that is often asked is whether the rice market is competitive or if there
are important ways in which the market is segmented or even controlled by local oligopolistic structures. A good way to examine this question is through testing for integration of spatially distributed markets, usually through co–integration analysis. This is also important for price policies like open market sales (OMS), since in a situation of well–integrated markets, OMS does not need to be as extensive as may otherwise be indicated.
Co–integration analysis of the rice market in Bangladesh generally finds that
markets are well integrated as the elasticity coefficients across markets are close to unity (see Annex 1). The estimated co–integrating vectors for wholesale market prices of coarse and medium quality rice for each of the seven regional markets are reported below. The elasticity coefficients are large and close to unity suggesting that markets are integrated but the two varieties of rice are not perfect substitutes. The speed of adjustment (α) in the vector error correction model shows that 25 to 60 percent of the disequilibrium is corrected within a month by the coarse rice price. The same ranges between 15 to 36 percent in the case of medium rice price. It should however be noted that some markets seem to be more integrated than others, the reasons for which require further study.
Co–integration of the rice market implies that open market interventions by the
government to stabilize rice prices would be effective in stabilizing market prices in both the specific market where interventions are being carried out as well as throughout the rice market system. This is also corroborated by the relative efficacy of government interventions like open market sales in stabilizing rice prices.

9
Table 1. Co–integrating vectors for coarse and medium quality rice prices Markets Coarse Rice Medium Rice Constant Chittagong 1.000 0.968*** (76.86) –0.059 Adjustment ( α) –0.255*** (–3.54) 0.275*** (4.05) – Dhaka 1.000 0.980*** (76.97) –0.090 Adjustment ( α) –0.325***(–4.89) 0.258*** (4.32) – Khulna 1.000 0.923*** (89.02) 0.070 Adjustment ( α) –0.405*** (–5.18) 0.177** (2.15) – Narayanganj 1.000 0.954*** (91.04) –0.022 Adjustment ( α) –0.327*** (–4.15) 0.269*** (3.56) – Rajshahi 1.000 0.937*** (63.21) 0.020 Adjustment ( α) –0.359*** (–5.02) 0.153* (2.52) – Rangpur 1.000 0.940*** (76.73) 0.043 Adjustment ( α) –0.577*** (–7.23) 0.208*** (3.08) – Sylhet 1.000 0.956*** (104.14) –0.018 Adjustment ( α) –0.317*** (–3.36) 0.361*** (3.89) –
Source: Authors’ elaborations. Notes: 1. Figures in the parentheses are t statistics. 2. Figures with one, two and three asterisks indicate significance at 10 percent, 5 percent and 1 percent error probability level. 3. The coarse and medium quality of rice are monthly wholesale prices across the seven regional towns between July–1975 and June–2011.
b. Trends and impact of global rice prices
In the past several decades, the Bangladesh rice market has undergone major
policy shifts, particularly moving away from extensive interventions in input and output markets and an insulated domestic rice market to a more open, more free market where major reforms were undertaken to reduce subsidies and open up the input and output markets to unrestricted/less restricted trade. At the same time, there are suggestions that the world market has become more “dependable”, less thin. Some co–integration exercises suggest that the Dhaka market is well integrated with some regional markets as well, specifically that of Indian and Thai rice markets but not with the Viet Nam (ex–Hanoi) market (see Annex 1 for a detailed treatment of the evolution of rice trade and import policies). This may encourage policy makers to increase reliance on the world rice market through open trade.
However, international rice prices have been prone to large swings and volatility.
Bangladesh is also not an exception. This is evinced by the measures of monthly price variability for the period of July 1987 and June 2015 (see table below). Figure 2 also shows similar downward trends in the FOB7 prices of rice in India, Thailand, and Viet Nam with sharp spikes in 2007–2008.
It may be noted that price variability increased throughout the last quarter of the last century, with a hiatus in the first quinquennium of the current century and sharply rising again in the second quinquennium of the last decade due, inter alia, to the global financial crises during that period. However, rice price variation since the 2010s has fallen in relation to that of other cereals.
7 Free On Board.

10
Table 2. Variability (coefficient of variation) of rice prices
Period Bangladesh Wholesale (Dhaka)
Indian Wholesale (Delhi)
Thai 5 % Broken
Vietnamese 5% Broken
87–90 0.0831 0.0660 0.1031 – 91–95 0.1411 0.0805 0.1709 – 96–00 0.1408 0.0677 0.2170 – 01–05 0.0650 0.0839 0.2004 0.0845 06–10 0.2265 0.1581 0.2946 0.2725 11–14 0.1264 – 0.1516 0.1352
Source: Authors’ elaborations. Figure 2. Movements of Thai, Vietnamese, and Indian coarse rice wholesale prices
Source: Authors’ elaborations based on data from the World Bank and the Bangladesh Bureau of Statistics (BBS). Delhi wholesale prices were received from Dr. Paul Dorosh. Notes: The graphs show monthly data across the years.
Thus, rice prices exhibited a distinct tendency to stabilize in the more recent periods, especially after 2011. The growing stability of international rice prices in recent years, contrasts with the sharp increase in the variability of trade volumes over that same period. Indeed, while the strong expansion in rice trade was associated with much larger year–to–year variations in the volume of transactions, there was no corresponding effect on international prices, which became less volatile as (i) the expansion of rice trade had a stabilizing effect on prices, (ii) the greater loyalty of exporters as sources of supplies contributed to increasing world price stability, (iii) the existence of considerable rice inventories and the willingness of governments to keep and manage larger reserves in the 1990s that have smoothened the impacts of large swings in import demand and export supplies on world prices, and (iv) improved flows of information on rice supply and demand prospects together with improved access to international price quotations have also increased transparency on the international rice market (FAO, 2004).
The volatility in international prices of rice is tested employing a GARCH model
(see Annex 1 for details). Results show significant ARCH effect for the wholesale price of Indian rice, both ARCH and GARCH effects for the FOB price of 5 percent broken rice of
- 100 200 300 400 500 600 700 800 900
1,000
1987
1987
1988
1989
1990
1991
1992
1993
1994
1995
1996
1997
1998
1998
1999
2000
2001
2002
2003
2004
2005
2006
2007
2008
2009
2009
2010
2011
2012
2013
2014
USD/ton
Ex-Bangkok (5% broken) Delhi (wholesale) Dhaka (wholesale)
11
Thailand and Viet Nam. It, thus, implies that a significant instability in international prices of rice is present. However, the instability in prices is only affected by past squared residuals in the case of India, whereas, for the other two countries it is affected by both past squared residuals and variances. This finding may be interpreted as a demonstration that there are both impacts on shocks on volatility and clustering. The economic implication of these findings is that these variables cannot be treated as random (and therefore unpredictable) in nature. This also raises the question of the nature of non–randomness that is involved along with the underlying factors contributing to it – a subject that requires further analysis.
According to Timmer and Dawe (2007) the global price of food has consistently
declined despite technological innovation and the pursuit of food security. The rice price declined on average by 1.37 percent per annum between 1900 and 2008, while the price decline for corn and wheat were somewhat lower. Despite this declining trend, the world has seen severe rice and food price shocks approximately about every 30–35 years. The last episode was in 2006–2008 which coincided with the global financial crisis from which effects Bangladesh could not entirely escape. It began with the rise in crude oil prices followed by metals. Since May 2007, wheat prices began to rise as well, followed by corn prices – and in part this was due to an actual decline in wheat production. Thus, commodity markets heated up feeding into each other as speculative trading took off. Rice prices however, remained stable both on a global level and in Bangladesh, but unexpectedly began to rise just before the wheat price peak. In fact ex–Bangkok rice prices tripled in just six months between October 2007 and April 2008 – an event that appears to have been unprecedented.8 There does not, however, appear to have been any fundamental reasons for a rice market destabilization at the time as production levels were comfortable and supplies were on the rise. A lot of effort has been made to understand the “real reasons” for the rice price debacle. The consensus seems to be to (i) blame domestic rice price policy in some of the major producing/consuming countries (e.g. India, China) or (ii) attribute this to speculation or to what has been referred to as the “financialization” of agricultural commodities (e.g. Timmer, 2011). A more basic question relates to the existence of periodic price bubbles. Some evidence seems to have been found of its existence although it would appear that failure in most studies to use daily price data makes the search for bubbles more elusive (Areal et al., 2014; Gilbert, 2010).
In Bangladesh, the domestic rice market began to react even before the world
market crisis got underway. The high price resulted in a robust supply response from farmers so that there was a bumper in Boro harvest in winter helping to smooth the market quickly. There was, however, a very alarming period when no amount of money could have purchased rice in the world market as everyone was tightly holding on to supplies given the uncertainty. Good harvests and low world (post–meltdown prices) and domestic prices actually resulted in a serious incentive problem for the rice farmers in 2009, which was countered by strong government intervention in agriculture through fertilizer and energy subsidies. However, from 2010/11, food prices went under pressure resulting in rising inflation. Food price led by inflation is common in Bangladesh given that it accounts for almost 59 percent of the CPI basket with rice, by
8 It has, however, been pointed out that in real terms the peak rice price in 2008 was less than half of the average price that prevailed in the 1972–1974 period, in real terms.

12
itself, accounting for over 20 percent. In fact, the contribution of the rice prices to the CPI in 2011/12 was as high as 23.4 percent.
Right after the Country’s independence a severe impact occurred in 1972–1973
that is attributable to weather shock whose effects were made much worse by the protective actions of various countries around the world, especially the USA and the Soviet Union. The Bangladesh famine of 1974 was certainly related to that episode since Bangladesh was recovering from the war ravages and a series of poor rice harvests leading to the 1974 debacle. As in 2006–2008, there was a critical period (nine months period between 1973 and 1974) when the world rice market completely evaporated.
These global shocks have left a deep imprint in the psyche of poor countries who
felt they were unable to completely depend on the market to ensure food security – a major barrier to further liberalization of domestic rice markets in countries like Bangladesh and India.
Independently from the effect of the food market crises, there is the additional
question related to the extent of integration of domestic rice markets within the world market. Before the mid–1990s, external influences were transmitted through the volume, and perhaps more importantly, the timing of food aid arrivals and cash imports, which were again related to shortfalls in domestic production. Since the mid–1990s, it has been observed that the domestic market became much better integrated, especially with the Indian market as the bulk of rice imports originated in India. Thus, the transmission of price influences across borders would depend on the volume of imports and its price, in addition to a pure speculative component – the latter being determined by such factors as expected harvest performance, food grain reserves with the public sector, signals emitting from large rice millers and traders.
2015 has seen the unusual situation of low rice prices as a result of good harvests
but even lower international prices – ushering in a situation of low cost imports that have lowered domestic prices even further. The inter–relationship between domestic and world prices is not straightforward and is also in development – over time this connection has certainly become much closer. This is an area where further research would be very useful.
c. Effects of rice prices on consumers, traders, millers and producers
Rice prices have far–reaching implications for consumers, wage–labor as well as
producers, processors and traders. Since more than 90 percent of the population consumes rice, the impact on consumers is the most ubiquitous. The average consumer spends around 39 percent of the household budget on cereals, mainly rice, and for the poor, this share is expected to be much higher. In terms of marginal propensity to consume for cereals, this was estimated to be around 0.3 (Islam, Hossain and Jaim, 2007).
The main challenge for consumers tends to be the high prices at the pre–harvest
periods, namely in March–April and September–October. The seasonal price highs therefore are the points in time when market interventions to stabilize prices become important, especially when there are expectations of a less–than normal harvest.

13
However, such seasonality has declined substantially despite a more even distribution of rice harvests over the year (and a smoother flow of marketed surplus) following the Green Revolution. The adverse lean–season impact is not just due to high pre–harvest prices but also due to lack of work at that time. The problem was particularly acute in the single–cropped, low–lying flood prone belts of the country that prevented multiple rice crops from being cultivated due to the flash floods. With the appearance of new, short–gestation rice varieties that were quickly adopted in these risky zones, the lean season problem has been all but eliminated. Thus the annual “Monga” which was associated with a famine-like situation in the northern districts has now become a thing of the past. Impoverished farmers and workers no longer undertake their seasonal journey out of these villages to look for work elsewhere. 9Traders provide arbitrage services over time and across space, and both require a certain degree of price variation in order to be profitable. Historically, seasonal price variations have declined due to smaller lean periods in between rice crops. At the same time, rapid urbanization and a rising labor class has led to the sharp rise in rice demand, especially in the cities. Much of the trade in rice–paddy is over space, from rural to rural or rural to urban areas. Thus, both the price and the marketing margins are important for this trade. There was a time when debt–tying was typical in the rice trade but that has now almost disappeared (Murshid, 2015; Reardon et al., 2014) leading to what could be described as a dynamic, competitive market.
The millers or processors have now emerged as the really big actors in the rice
sector. Milling capacity has expanded dramatically with large investments occurring in large–scale, completely automatic rice mills (Reardon et al., 2014). With the evolution of large, modern mills, the traditional small–minor processors have disappeared. Total value generated by the new mills has increased sharply as new technology is used to turn ordinary rice quality into fine rice, enhance appearance, and employ modern bagging/branding techniques. This has enabled millers to corner the lion’s share of the additional value thus generated (Minten et al., 2014).
Producer prices remain a policy challenge in Bangladesh. Over the years, food
policy planners have learnt the trick to soften the pressure of high prices on consumers, mainly through large off–takes, targeted distribution to vulnerable groups, and open market sales. For the purpose, the public food distribution agency would prepare itself with adequate stocks built up from domestic procurement, imports, and occasionally food aid. Trade liberalization also allowed the private sector to import cheap food from India where huge, uneconomic stockpiles of rice and wheat helped stabilize the Bangladesh rice market as well.10 The problem of low prices at harvest is a much more difficult problem to solve. Thus, the objective to provide a “fair”, remunerative price to farmers has not been very successful. This generally requires massive paddy procurement, preferably from the farmers themselves at a “fair” price. The logistics and
9 The success of the Green Revolution in rice along with the expansion of rice cultivation in the Boro season in a very big way led to considerable narrowing of traditional price–wage “seasonalities” in Bangladesh. This is well documented in numerous studies, e.g. see Ahmed (2004). More recently, the remaining seasonal lows associated with some pockets in the country (arising from adverse ecological conditions including early flooding) has also been eliminated – basically through the adoption of very short–gestation rice crops developed by the BRRI along with interventions that included credit and asset transfers (e.g. see Khandker and Mahmud, 2012). 10 This option has now become obsolete as India has substantially reduced its food grain stockpiles.

14
resources needed have generally not been available. Nevertheless, the government continues to declare a minimum procurement price and sets procurement targets every season. Procurement is in milled rice and obtained from designated millers who are able to supply the right quality in bulk. Thus, there are opportunities for millers to benefit but this rarely translates itself into higher prices for the producers themselves.
The most effective policy for producers is to provide agricultural credit and
subsidies on inputs, especially fertilizers, seeds, irrigation, energy/diesel. These subsidies allow farmers to at least avoid/reduce losses when market prices slump. Thus, despite the longer term trend in falling real rice prices, farmers have continued to expand production – tripling production in three decades, mainly because farm–level profitability could be maintained through lower input prices and better, yield–increasing technology.
The annual growth in acreage under Aus was estimated at minus 3.92 percent
for the period from 1972–73 to 2008–09 (Table 3). During the same period growth in yield was estimated at 1.86 percent. Thus, positive growth in yield arrested somewhat the decline in production of the crop. However, negative growth in the real price (0.43 percent) of Aus eroded some of the positive growth in yield leaving the implied revenue growth at minus 2.49 percent. Aman registered negative but marginal growth in both area and price during the period. Against this backdrop, the crop witnessed secular growth in yield due to gradual expansion of the HYV11 throughout the period. The most spectacular growth in rice acreage was observed for Boro; the acreage under this crop grew at 4.79 percent during the period. With steady growth in yield at more than 1.5 percent and dampened negative growth in real prices the crop provides significantly high (more than 6 percent) revenue growth to the farmers. The high growth of yield and hence devotion of more and more acreage under HYV Boro is mainly due to availability of irrigation. The differential growth of the three rice varieties implies that Boro will be critical to meeting the growing demand for food grains in the days to come. Table 3. Trends in area, yield, and price of rice, 1972/73–2008/09 (Growth rates in percentage)
Crops Area Yield Price Aus –3.92 1.86 –0.43 Aman –0.11 1.83 –0.07 Boro 4.79 1.72 –0.22
Source: Yunus and Shahabuddin (2013).
Recent price trends suggest that Bangladeshi producer prices are higher than world prices resulting in a tendency to import rice even when domestic production is satisfactory – resulting in an additional tendency to dampen local prices. Given that Bangladesh is barely self–sufficient in rice production after accounting for biases in acreage and yield (Yunus et al. 2013); price volatility of rice has been the major food security issue in recent years. The government has belatedly tried to regulate imports through imposition of import duties – suggesting a need to carefully monitor both domestic and international market prices along with returns/profitability of producers. In other words, worries about low producer prices remain a matter of greater concern today than high consumer prices during the lean season.
11 High Yielding Variety.

15
d. Prices, poverty, food security and growth The cornerstone of Bangladesh’s agricultural policy has been “food self–
sufficiency”, basically meaning rice self–sufficiency, which was considered to be essential for food security. The early thinking surrounding this objective was heavily influenced by the 1974 famine, erratic and unstable domestic production of rice, heavy dependence on food aid which had to be frequently supplemented with large own–cash imports (which was a burden on the balance of payments and foreign reserves) along with strong world price fluctuations (e.g. see the First and Second Five–Year Plans of Bangladesh).
This objective has finally been achieved although small, periodic imports of
cereals continue to be made even today. The tripling of production, the success of the Green Revolution, achievement of national level rice self–sufficiency, stability in production and price of rice was made possible by complex factors involving policy and trade liberalization, technology, modern seed–fertilizer–water inputs and institutions carried out within a stable macroeconomic environment. In addition, the government oversaw a large PFDS that was given the task of supporting both producers and consumers although the main implication was with stable food prices for poor consumers.
The impact on growth, poverty reduction and food security has occurred mainly
through rice production and yields, despite declining terms of agricultural trade and declining trend in relative price of rice. GDP growth was positively affected due to the large share of food production in the national economy and the indirect contribution through downstream trade, milling and processing. In fact the rice–based Green Revolution was a major breakthrough for the rural economy creating jobs, employment and demand. Economy–wide effects of cheap food also helped in industrialization through low wages, low inflation and a stable macro economy.
Food security was achieved nationally through much improved availability of
food grains because of rising domestic production and a gradual decline in food aid and cash imports. For non–producers, low and stable rice prices helped to increase real wages very significantly and enabled access to food for all social groups. The development of the non–farm sector is also related to agricultural production – including rice, non–rice crops, and non–crop agriculture – ushering in a period of dynamism in the rural economy not so far witnessed (see Rahman, (2015) and Ahmed, (2016) – both authors focus on the broad–based nature of agricultural growth and rising real wages).
Macro effects of high rice prices was significant over 1970–1990 operating
through the following channels:
1. Inflation was directly affected, as rice constitutes a large share of the CPI basket. While declining over time, this remains true even today.
2. Effects on the balance of payments and the exchange rate used to be a big risk in the period when Bangladesh had to regularly import large amounts of food grains with its own resources that resulted in a substantial exhaustion of already scarce foreign exchange reserves (see Murshid, 1985). This scenario has now changed,

16
due to large reserves (US$ 30 billion) held by the central bank and the much more reduced need to import.
3. Effects on the government budget was a very big problem as well, stemming from the demands of the huge PFDS, food subsidies to a large number of beneficiaries, poor and non–poor, through extended rationing, food–based safety nets, public works programs, procurement operations, open market sales, and so on. The budget continues to be affected by food operations but pressure has declined substantially as the PFDS has been down–sized and food based operations reduced even as the overall size of the budget has increased substantially (see Murshid, 1998 on fiscal implications of food policy). Food policies adopted by the government were generally focused on production
increases and stable prices, and this has worked quite well. In fact the structural reforms and trade liberalization policy of the government worked very well in lowering import prices of agricultural machinery while at the same time enabling the private sector to bring in cheap rice imports from India when there was a domestic shortfall. This ushered in a period of rapid agricultural growth based on rice production but soon spilling over to other agricultural areas. This in return led to massive investment in value chains especially in milling and storage. Thus, agricultural growth was rapid and generated employment opportunities not only for male workers but also for female workers. Remittance earnings of rural agricultural households from workers abroad as well as workers from the quickly growing readymade garments sector combined with microcredit and grass–root institutions worked well to incentivize investment and broaden access to financial services. The State policy focus on health, education, infrastructure, and electricity also contributed towards the development of an enabling climate where growth, employment and development can take place unfettered.
Therefore, while rice prices for producers could not be managed, and had to be
left to the fluctuation of the market, there was a host of direct and indirect interventions and enabling conditions that led to rapid growth in agriculture, especially after 2000. This is affirmed by the estimates of TFP (total factor productivity) growth that is available. Thus, Nin–Pratt (2015) estimates the country–specific TFP index for agriculture, as well as a decomposition of TFP growth into a technical change component and an efficiency component. TFP was shown to grow weakly at 0.2 percent per year over 1980–1995 but jumped to a remarkable 2.7 percent after 1995 for over 15 years.
Agricultural growth led by rice also created the basis for the economy to achieve
and sustain a growth rate of over 6 percent along with quite a rapid decline in poverty head count rates. Analysis of panel data confirms that agriculture has been a major driver of poverty reduction since 2000 although no single factor was found to explain this – rather the key message was that households were combining multiple activities and income sources to move out of poverty (Khandker and Mahmud, 2012).

17
III. Impact of high food prices - a quantitative analysis High food or rice prices have an unambiguous effect on urban consumers,
especially to the poor ones, while for rural consumers the net effect is slightly more complex. This depends on whether the rural household produces rice for own consumption and sale and the extent of market participation as consumer and producer. An attempt is made in this section to conduct a more quantitative analysis.
a. Rice marketing patterns and household welfare
A section of households in Bangladesh obtain part or all of their income from net
sales (NS) from rice/paddy, another section spends on net purchase (NB), and the rest do not participate (NP) in this transaction. The direct welfare effect of higher food prices on a household depends on its net sales position. Net sellers gain from higher prices, while net buyers lose. Following Mellor (1978), the income share of rice is defined as the value of rice production as a percentage of consumption expenditure (PR), the budget share of rice as the value of rice consumption as a percentage of consumption expenditure (CR), and the net benefit ratio, NBR12, for rice as the income share minus the budget share.
HIES13 (2010) provides detailed information on the patterns of rice consumption
and production for different types of households. However, upfront use of the income share and budget share as defined above on HIES (2010) data would create a nominal mismatch between the two shares as the production of rice (Aus, Aman, and Boro paddy) was valued at farmgate prices whereas consumption of rice (fine, medium, and coarse quality) is valued at retail (consumer) prices. In fact, even if real quantities of rice produced and consumed was the same for a household, a downward preference would be observed in the income share as farmgate prices are lower than retail prices. However, not all farmers sell their paddy at farmgate prices, many with good private storage facility may as well sell at a wholesale price to the millers/traders. Consequently, farmgate prices were taken as the wholesale prices that wholesalers/aratdars14 pay to the farmers. In their analyses of marketing margins and value chains of rice and two other agricultural produces, Murshid et al. (2013) found that the wholesale and retail prices of rice were Tk. 19.46 15 and Tk. 37.24 respectively. This wedge between these prices was used to adjust the price of Aus, Aman, and Boro rice to make income and budget shares comparable.
On average, rice production is equivalent to 18.38 percent of household income,
while the mean budget share of rice is 17.24 percent. The consequent NBR of 1.14 percent (18.38 to 17.24) implies that a 10 percent increase in farmgate/wholesale and retail rice prices would raise real income by 0.11 percent, on average.
12 Net Benefit Ratio. 13 Household Income and Expenditure Sale. 14 The key function of the aratdar is that of a commission agents who matches sellers and buyers although in addition wholesaling functions are often taken on. 15 One US dollar exchanges for 78 Bangladesh Taka (Tk.) at current rates (2016).

18
Among rural households, rice production and rice consumption are much larger relative to income, and the NBR is positive at 7.54, implying that rural households are net sellers. Thus, the rural households in general will, on average, gain from higher rice prices. Among urban households, rice production is minimal at 5.82 percent of income, while rice consumption represents 14.04 percent of income. The negative NBR of 8.22 percent for urban households implies that they are net buyers and will lose from higher rice prices. However, for a given price increase, the loss for the average urban household slightly compensates the gain for the average rural household.
The importance of rice in household incomes is the highest in Rangpur region
(34.87 percent) followed by Rajshahi region (28.65 percent), Khulna region (21.30 percent) and Sylhet region (19.37). Given their budget shares in rice consumption, these four regions appear to be surplus in rice production. However, the extent of surplus is not sizeable for the last two regions, as their budget shares do not lag far behind. These regions are rather self–sufficient and hence contribute little in regional trade in rice. The NBR is negative for Barisal, Dhaka, and Chittagong regions. Thus, regional trade in rice is characterized by flows from the northwest to the central and southeast. Moreover, the average of the absolute value of the positive NBRs in the surplus regions is larger than that the negative NBRs in the deficit regions. Table 4. Rice production, consumption, and net sales by household group
Household Category PR CR NBR NS NP NB
National 18.38 17.24 1.14 24.0 1.4 74.6 Location Rural 26.95 19.42 7.52 32.4 1.9 65.7 Urban 5.82 14.04 –8.22 8.9 0.6 90.5 Region Barisal 12.16 17.29 –5.13 18.9 1.3 79.8 Chittagong 10.29 13.44 –3.14 19.0 1.5 79.6 Dhaka 15.79 17.78 –1.99 21.2 1.3 77.5 Khulna 21.30 18.85 2.45 27.6 1.5 70.9 Rajshahi 28.65 19.06 9.60 28.5 1.5 70.0 Rangpur 34.87 19.98 14.89 34.3 1.1 64.6 Sylhet 19.37 17.91 1.46 22.8 1.9 75.3 Occupation Farmer 32.18 17.50 14.68 43.2 1.8 55.0 Non–farmer 7.37 15.77 –8.40 12.0 1.2 86.8 Income Group 1st Quartile 14.69 21.63 –6.94 20.1 1.7 78.2 2nd Quartile 16.10 19.97 –3.87 23.4 1.7 74.8 3rd Quartile 19.33 17.73 1.60 25.9 1.5 72.6 4th Quartile 20.67 13.38 7.28 26.5 0.7 72.8
Source: Authors’ elaboration based on HIES (2010).
Rice marketing patterns naturally vary widely between farmers and non–farmers. About one–third of the farm household incomes originate from paddy (rice) cultivation even though their budget share is comparable to the national average, resulting in a positive NBR at 14.68 percent. Non–farmers’ lower rice budget shares (reflecting their higher income), but very small rice production (7.37 percent), yield a negative NBR at 8.40 percent.
19
It is also evident from the last panel of Table 4 that the budget share of rice falls
from 21.63 percent for the poorest quartile to 13.38 percent for the richest. However, the importance of rice production relative to income rises with income, from 14.69 percent to 20.67 percent. Thus, the NBR shows a consistent pattern: rich households (4th quartile) produce and sell larger amounts of rice than medium households (3rd quartile), while the extreme poor (1st quartile) buy more amounts of rice than the moderately poor (2nd quartile).
The last three columns of Table 4 show the percentage of households that are net
sellers (NS) with NBR > 0, that have no net sales (NP) with NBR = 0, and that are net buyers (NB) with NBR < 0. Overall, less than one–fourth of households are net sellers who would gain in the short run from higher rice prices. About one–third of rural households have net rice sales and two–thirds are net buyers. The proportion of net sellers is, as expected, higher in two northwest regions and one northeast region. However, net sellers account for less than one–third of the households even in these regions. Finally, the proportion of net sellers is higher among high–income groups than among low–income groups.
Overall, it is evident that the proportion of households with zero net position in
rice markets is small. More than 98 percent of rural households have some interaction with rice markets, either as buyers or as sellers. The proportion of households with zero net sales hovers around 1–2 percent. In addition, poor households are twice as likely as rich ones to not participate in the market at all.
In brief, more than 7 out of 10 households and 4 out of 7 regions are net buyers
of rice, implying that a majority would lose from higher rice prices in the short run. The solace is that two of the regions that would gain the most, Rajshahi and Rangpur, are poorer, while the regions that would lose the most, Chittagong and Dhaka, are richer.
b. Rice prices, real income and poverty
The foregoing analysis does not tell us about the extent of the impact on the gainers and losers of an increase in rice prices. It thus cannot capture the extent of distributional impact of such perturbation in prices. Based on compensating variation (the difference in expenditure functions due to price change) to account for loss to consumers due to an increase in the consumer price of rice and change in profit functions due to an increase in the producer price of rice, Minot and Golleti (2000) developed the following expression:
(1)
where is the change in welfare for a household category i of a change in rice price by location or income group or occupation group; is the original income (consumption expenditure) of household category i; is the original value of the price used to assess
2
1
2
0
2
0000 21
T
Hic
cS
ip
p
T
ic
c
ip
p
i
i CRppPR
ppCR
ppPR
pp
xw
∆−
∆+
∆−
∆=
∆εε
iw∆
oixpp0

20
rice production; is the original value of the price used to estimate rice consumption; and are as defined before; is the price elasticity of rice supply; is the
Hicksian own–price elasticity of rice demand; is the first–order approximation of the change in welfare or impact of a change in rice price; and is the second–order approximation of the change in welfare or short–run effect of a change in rice price.
The magnitude of the impact of 10 percent increase in rice price on real income
and poverty when producers and consumers respond to price change, is assessed using household–level marketing data from the HIES (2010). The values of and are estimated from HIES (2010) data as reported in the previous section. The estimates of the short–run elasticity of supply of rice ( ) is set at 0.248, which is estimated as a weighted average of the estimates reported in Yunus and Shahabuddin (2013).16 The estimates of the Hicksian elasticity of demand for rice were taken from Murshid et al. (2008).17
The second column in Table 5 shows the before–response effect of a 10 percent increase in rice prices on the real income of different household groups. As the producer and consumer prices are both assumed to increase by the same 10 percent, the results are simply the NBRs multiplied by the proportional increase in price (0.1). These estimates evaluate the expression following Deaton (1989). Rural households, residents of the food surplus regions (Khulna, Rajshahi, Rangpur, and Sylhet), farmers and rich households gain from the increase in rice prices. But non–farmers, urban households, and residents of the southern regions lose. The net effect is a small positive effect, indicating that the average income of Bangladesh households rises.
Minot and Golleti (2000) pointed out that the change in NBR as used by Deaton (1989) is a very short–term measure that assumes no response from households as producers or as consumers. Moreover, it assumes no change in labor markets or non–farm income that might result from the price change.
Following Minot and Golleti (2000) the third column gives the after–response
effects of the rice price increase on Bangladesh households across locations, regions, occupations, and per capita monthly income quartiles. In all cases, the after–response effects are somewhat more subdued than the before–response effects. This result reflects the general rule that the welfare effects of a price change are more positive when consumer and producer responses are taken into consideration. However, the differences between short and long–term effects are small, around 0.1 percentage points, as a result of the relatively inelastic demand and supply.
The last two columns give the incidence of poverty after the 10 percent increase
in rice prices. The effect of the rice price change on the poverty rate is estimated by
16 Yunus and Shahabuddin (2013) reported shares of Aus, Aman, and Boro in gross cropped at 7.85, 38.95, and 27.97 percent respectively. Applying co–integration approach the authors estimated the short–run supply responses of Aus, Aman, and Boro at 0.321, 0.280, and 0.183 respectively. 17 As Murshid et al. (2008) provided separate estimates only for national, rural, urban and quartile groups, it has been assumed that the estimates across the seven regions are the same as the national estimate, and the estimates for farmer and non–farmer are the same as third quartile and first quartile respectively.
cp0
iPR iCR Sε Hε
1T
21 TT +
iPR iCR
Sε
1T

21
adjusting the real income of each household in the sample and calculating the proportion of households whose new income falls below the original poverty line. While urban poverty rate rises by half a percentage point, rural falls by more than half a percentage point. Table 5. Effect of a 10 percent increase in rice prices by household groups
Household category Change in real income Change in HCR of poverty Impact Short–term After impact After short–term
National 0.11 0.17 31.27 31.23 Location Rural 0.75 0.82 34.53 34.45 Urban –0.82 –0.78 21.81 21.75 Region Barisal –0.51 –0.46 39.62 39.56 Chittagong –0.31 –0.27 26.61 26.41 Dhaka –0.20 –0.14 30.53 30.45 Khulna 0.25 0.31 31.94 31.89 Rajshahi 0.96 1.03 28.96 28.75 Rangpur 1.49 1.57 44.48 44.39 Sylhet 0.15 0.21 27.87 27.78 Occupation Farmer 1.47 1.55 22.64 22.56 Non–farmer –0.84 –0.81 35.34 35.27 Income group18 1st Quartile –0.69 –0.64 100.0 100.0 2nd Quartile –0.39 –0.33 27.21 26.92 3rd Quartile 0.16 0.22 0.00 0.00 4th Quartile 0.73 0.79 0.00 0.00
Source: Authors’ estimates based on HIES (2010).
It should be emphasized that these calculations do not incorporate general equilibrium effects that take into account both the decrease in quantity demanded by consumers and increase in supply response by farmers, which will in turn generate additional employment. This induced demand for labor will put upward pressure on wage rates and hence would increase labor income of the agricultural laborers. To the extent that the poor obtain a significant share of their income from agricultural labor, this would strengthen the poverty–reducing effect of higher rice prices. As landlessness and the use of hired labor are pronounced in Bangladesh, the effect of rice prices on income via wage rates is likely to be stronger.
Thus, average income in Bangladesh would rise by 0.2 percent on average in the
long run. Consequently, the poverty rate would fall slightly from 31.5 to 31.23 percent in the long run. Even though only one–quarter of households are net sellers of rice, higher rice prices have little effect on the incidence of poverty. Still, these conclusions may not be justifiable if the percentage changes in producer and consumer prices differ widely. However, the poor consumers, regardless of rural or urban, would be worse off due to higher prices of rice, about 1 percent of consumers hitherto belonging to the 3rd quartile would slide down to the 2nd quartile and many of whom would fall into second poverty trap as evident from the lowest panel of Table 5. These findings are consistent with Khanam et al. (2015).
18 The national poverty rate of 31.5 percent in 2010 implies 100 percent poverty rate of the 1st quartile, and 26 percent of the 2nd quartile in that year.

22
c. Absolute and relative rice prices and rural agricultural wages
It was recognized that the growth of the rice price would hardly affect the poor, especially in the rural area as it was also evident from agricultural wage rate and rice price dynamics over time. The daily nominal wage rate (without food) of male agricultural laborers increased from Tk. 38 in 1993 to Tk. 291 in 2014 implying an annual growth of 9.58 percent. In contrast, the price of coarse rice per kg increased from Tk. 8.42 to Tk. 30.77 during the same period implying annual growth of 5.69 percent. Given that the average rate of non–food inflation during the period stood around 6 percent, the real price of rice hovered around Tk. 20 at constant 2005–2006 prices throughout the period without any upward or downward trend. In contrast, the rice equivalent of daily wage rate increased from 4.38 kg of rice in 1993 to 9.47 kg. While mild upward trend continued until 2008, the rice equivalent of wage rate showed a sharp rise since then (
Figure 3).
Figure 3. Trend of agricultural wage rate (kg of rice/day)
Source: Authors’ estimates based on HIES (2010).
Unlike Rashid’s (2002) findings, co–integration results show that the long elasticity of agricultural wage rate with respect to rice price is 1.89 implying that a 10 percent increase in rice price leads to about 20 percent increase in agricultural wage rate. Zhang et al. (2013) conjectured that the sharp upward trend in real agricultural wage rate testifies the arrival of a Lewis turning point of surplus labor in Bangladesh. The authors attributed the rising wages to (i) more extensive job opportunities in the non–farm sector, especially in the manufacturing sector for females, and (ii) a greater amount of remittances, primarily from overseas male workers. They conclude that an escalation in real wages boosts earnings of the workers and reduce their likelihood of being poor.
0
2
4
6
8
10
12
1993 1996 1999 2002 2005 2008 2011 2014
Kg/Day
23
IV. Policy implications of the findings and conclusion The struggle that Bangladesh had to face in the context of food policy was how to
achieve self–sufficiency and provide production incentives to farmers while at the same time ensuring that food prices were low and stable. This has meant that the principal strategy to incentivize production was through the input and credit side rather than output price side. At the same time, the government displayed extreme sensitivity to “high” prices fearing a political backlash from the vast majority of poor consumers. It is crucial to assess whether a higher rice price regime may not be the best option given reduced poverty rates, higher rural incomes, and the pass–through of higher rice prices across the economy, including to the poor. A cautious move in this direction is recommended. A higher rice price regime will also induce consumers to switch to other non–rice foods like vegetables, fruits and dairy products. This again would be highly desirable given the poor nutritional status of the population.

24
References
Ahmed, R. 1999. Liberalization of Agricultural Input Markets, in S. S. Sidhu and M. S. Mudahar (ed.): Privatization and Deregulation: Needed Policy Reforms Agribusiness Development, Kluwer Academic Publishers, Dordrecht, Holland. Ahmed, R. 2004. Rice Economy of Bangladesh: Progress and Prospects, Economic and Political Weekly, 39(36): 4043–4052. Ahmed, R., Haggblade, S. & Chowdhury, T. E. 2000. Out of the Shadow of Famine: Evolving Food Markets and Food Policy in Bangladesh, Johns Hopkins University Press (in collaboration with International Food Policy Research Institute), Baltimore, USA Ahmed, S. 2016. Growth With Equity: Contemporary Development Challenges of Bangladesh, Bangladesh Bank Training Academy, Dhaka. Areal, F. J., Balcombe K. G. & Rapsomanikis G.2014. Testing for Bubbles in Agricultural Commodity Markets, FAO Agricultural Development Economics Working Paper no. 14–07, FAO, Rome. Bayes, A. & M. Hossain. 2007. Gramer Manush – Grameen Arthaniniti – Jiban Jibikar Poribortan Parjalochona, Writers Foundation, Dhaka. Bangladesh Bureau of Statistics. 2011. Report of the Household Income and Expenditure Survey 2010. Ministry of Planning, Government of the People’s Republic of Bangladesh, Dhaka. Bangladesh Bureau of Statistics (BBS). Bollerslev, T. P. 1986. Generalized Autoregressive Conditional Heteroscedasticity. Journal of Econometrics, 31(3): 307–327. Centre for Policy Dialogue. 2015. State of the Economy in 2015–16, Centre for Policy Dialogue (CDP) Deaton, A. 1989. Rice Prices and Income Distribution in Thailand: A Non–parametric Analysis. Economic Journal, 99(395) (Supplement): 1–37. del Ninno, C., Dorosh, P. A., Smith, L. G. & Roy, D. K. 2001. The 1998 Floods in Bangladesh: Disaster Impacts Household Coping Strategies and Response. Research Report No. 122. Washington, D.C., International Food Policy Research Institute (IFPRI). Dickey, D. A. & Fuller, W. A. 1979. Distributions of the Estimators for Autoregressive Time Series with a Unit Root. Journal of the American Statistical Association, 75 (366): 427– 431. Dorosh, P. A. 2001. Trade Liberalization and National Food Security: Rice Trade between Bangladesh and India. World Development, 29 (4): 673–689. Dorosh, P. A. 2009. Price Stabilization, International Trade and National Cereal Stocks: World Price Shocks and Policy Response in South Asia. Food Security, 1(2): 137–149.
25
Engle, R. F. 1982. Autoregressive Conditional Heteroscedasticity with Estimates of the Variance of the United Kingdom Inflation, Econometrica, 50(4): 987–1008. Faruqee, R. 2012. Stock–taking of Major Studies and Reports on Agriculture and Rural Development in Bangladesh, mimeo, World Bank. FAO. 2004. World Rice Research Conference. 2004. International Trade in Rice, Recent Developments and Prospects, available at http://www.fao.org/fileadmin/templates/est/COMM_MARKETS_MONITORING/Rice/Documents/Japan_04_paper_last.pdf Foster, J., Greer, J. & Thorbecke, E. 1984. A Class of Decomposable Poverty Measures. Econometrica, 52(3): 761–766. Gilbert, C. L. 2010. Speculative Influences on Commodity Prices, Discussion Paper no. 197, United Nations Conference on Trade and Development (UNCTAD), Geneva. Hossain, M. 2015. Sustaining Food Security: Achievements and Challenges in Ahmed, S. et al (ed.) Bangladesh Vision 2030, Bangladesh Institute of Bank Management, Dhaka. Hossain, M. & Deb U. 2011. Crop Agriculture and Agrarian Reforms in Bangladesh: Present Status and Future Options, in Mujeri M.K. & Alam S. (ed.): Sixth Five Year Plan of Bangladesh 2011–15, Background Papers, Planning Commission, Government of Bangladesh, Dhaka. Islam, M. R., Hossain, M. & Jaim, W. M. H. 2007. Disaggregated Demand for Rice in Bangladesh – An Analysis Using LA/AIDS Model, Bangladesh Journal of Agricultural Economics, 30(1): 1–22. Jabbar, M. A. 2010. Empirical Estimation of Marketed Surplus of Rice in Bangladesh: A Critical Review, Bangladesh Journal of Agricultural Economics, 33 (1 and 2): 1–22. Johansen, S. 1991. Estimation and Hypothesis Testing of Co–integration Vectors in Gaussian Vector Autoregressive Models, Econometrica, 59(6): 1551–1580. Johansen, S. 1996. Likelihood–Based Inference in Co–integrated Vector Autoregressive Models, 2nd Edition, London, Oxford University Press. Kathuria, S. & Malouche M. M. 2016. Toward New Sources of Competitiveness in Bangladesh: Key Findings of the Diagnostic Trade Integration Study. Directions in Development. Washington, DC, World Bank. Khanam T. S., Bhandari, H. & Mohanty, S. 2015. Rice price inflation and its impact on poverty and livelihood: Insights from Bangladesh, Journal of Food, Agriculture and Environment, 13(2): 107–117. Khandker, S. & Mahmud, W. 2012. Seasonal Hunger and Public Policies: Evidence from North West Bangladesh. Washington, DC, World Bank.

26
Khondker, B. H. & Mahzab, M. M. 2015. Lagging District Development, Background Paper, 7th Five Year Plan, mimeo, Planning Commission, Government of Bangladesh. Dhaka. Mellor, J. 1978. Food Price Policy and Income Distribution in Low–income Countries. Economic Development and Cultural Change, 27(1): 1–26. Minot, N. & Golleti, F. 2000. Rice Market Liberalization and Poverty in Viet Nam, Research Report No. 114. Washington, D.C., International Food Policy Research Institute (IFPRI). Minten, B., Murshid, K. A. S. & Dearden, T. A. 2011. The Quiet Revolution in Agri–Food Value Chains in Asia: The Case of Increasing Quality in Rice Markets in Bangladesh, IFPRI Discussion Paper 01141, Washington, DC, International Food Policy Research Institute (IFPRI). Murshid, K.A.S. 1985. Instability in Foodgrain Production: Causes, Adjustments, Policy: A Case Study of Bangladesh, PhD. Dissertation, Faculty of Politics and Economics, Cambridge University Murshid, K.A.S. 1998. Fiscal Implications of Food Policy, IFPRI–FMRSP Working Paper 6, Government of Bangladesh, Dhaka. Murshid, K.A.S. 2015. Exploring Transition and Change in a Complex Traditional Market: The Case of the Rice Market in Bangladesh, Journal of Agrarian Change, 15(4): 480–498. Murshid, K. A. S., Khan, M. N. I., Shahabuddin, Q., Yunus, M., Akhter, S. & Chowdhury, O. H. 2008. Determination of Food Availability and Consumption Patterns and Setting up of Nutritional Standard in Bangladesh. Bangladesh, United Nations World Food Programme (WFP). Murshid, K. A. S., Yunus, M., Ali, S. M. Z. & Ahmed, N. 2013. Bangladesh Food Market Performance: Instability, Integration, and Institutions, Research Monograph 23. Dhaka, Bangladesh Institute of Development Studies (BIDS). Nin–Pratt, A. 2015. Inputs, Productivity and Agricultural Growth in Africa South of the Sahara, Discussion Paper 01432. Washington, DC, International Food Policy Research Institute (IFPRI). Rahman, R. I. 2015. Inclusive Development and Agricultural Labour, Abdul Ghafur Memorial Lecture. Dhaka, Bangladesh Institute of Development Studies (BIDS). Rashid, S. 2002. Dynamics of Agricultural Wage and Rice Price in Bangladesh, MTID Discussion Paper. Washington, DC, International Food Policy Research Institute (IFPRI). Reardon, T., Chen, K. Z., Minten, B., Adriano, L., Dao, T. A., Wang, J. & Gupta, S. D. 2014. The quiet revolution in Asia’s rice value chains, Annals of the New York Academy of Sciences, 44: 1–13.

27
Shahabuddin, Q., Asaduzzaman, M., Clay, E. & Jones, S. 2009. Price Support, Domestic Procurement Programme and Public Stock Management, Policy Paper. Dhaka, Bangladesh Institute of Development Studies (BIDS). Shahabuddin, Q., Dorosh, P. A., Yunus, M., Rashid, S. & Shahana, S. 2013. Management of Public Stock for Improved Effectiveness of PFDS in Bangladesh, Report prepared for IFPRI under the Policy Research and Strategy Support Program, mimeo. Dhaka, Bangladesh Institute of Development Studies (BIDS). Timmer, P. C. 2011. Managing Price Volatility: Approaches at the Global National and Household Levels. Stanford, USA. Center on Food Security and the Environment (FSE). Timmer, P.C. & Dawe, D. 2007. Managing Food Price Instability in Asia: A Macro Food Security Perspective, Asian Economic Journal, 21(1): 1–18. USDA. November, 2012. Grain: World Markets and Trade, Circular Series. Washinngton, DC, United States Department of Agriculture (USDA). World Bank, 2008. Poverty Assessment for Bangladesh: Creating Opportunities and Bridging the East–West Divide, Bangladesh Development Series, Paper No. 26, Dhaka, World Bank. Gautam, M. & Faruqee, R. 2016. Dynamics of Rural Growth in Bangladesh: Sustaining Poverty Reduction. Directions in Development-Agriculture and Rural Development; Washington, DC, World Bank. Yunus, M., & Shahabuddin, Q. 2013. Farmers’ Supply Response to Prices and Non–Price Factors in Bangladesh, Report prepared for IFPRI under the Policy Research and Strategy Support Program, mimeo. Dhaka, Bangladesh Institute of Development Studies (BIDS). Yunus, M., Shahabuddin, Q., Mujeri, M. K., Asaduzzaman, M., Ahmed, N., Hossain, M., Shahana, S. & Alam, M. 2013. Estimation of the Parameters Needed for Integrated and Effective PFDS Planning in Bangladesh, Report prepared for the Ministry of Food, Government of Bangladesh, mimeo. Dhaka, Bangladesh Institute of Development Studies (BIDS). Zaman, K. A. U. & Akita, T. 2012. Spatial Dimensions of Income Inequality and Poverty in Bangladesh: An Analysis of the 2005 and 2010 Household Income and Expenditure Data, Bangladesh Development Studies, 35(3): 19–50. Zhang, X., Rashid, S., Ahmad, K., Mueller, V., Lee, H. L., Lemma, S., Belal, S. & Ahmed, A. 2013. Rising Wages in Bangladesh, IFPRI Discussion Paper No. 01249. Washington, DC, International Food Policy Research Institute (IFPRI).

28
ANNEX A Integration of Bangladesh’s rice markets
a. Integration of domestic and international rice markets Researches on the integration of rice prices is often used to test the efficiency of
rice markets both within and between countries. Perfectly integrated markets are usually assumed to be efficient as well. Two markets are considered integrated, if the price on market i equals the price on market j corrected with arbitrage costs, Kijt:
(A1)
Trade between the two markets occurs only if |. To check whether
the individual series are stationary or not, ADF (Dickey and Fuller, 1979), tests have been made. In all cases a trend and a drift term were included. Results presented in Table A1 reveal that all of the series are I (1).
Table A1. ADF unit root results for wholesale prices of rice
Cities Coarse rice Medium rice Level Difference Level Difference Domestic prices Chittagong –1.633 –24.579 –1.522 –24.902 Dhaka –1.448 –24.945 –1.280 –25.951 Khulna –1.581 –21.723 –1.517 –25.423 Narayanganj –1.452 –25.834 –1.305 –26.344 Rajshahi –1.952 –24.561 –1.426 –24.120 Rangpur –2.882 –27.510 –2.035 –27.983 Sylhet –2.017 –26.582 –1.863 –26.772
International prices Delhi (BPL) –1.080 –19.453 – – Bangkok (5 % broken) –1.437 –11.406 – – Hanoi (5 % broken) –1.432 –4.910 – –
Source: Authors’ estimates.
The concept of co–integration states that if a long run relationship exists among a set of non–stationary variables, then the deviation from the long run equilibrium path should be bounded. In other words, the existence of a long–run relationship implies that co–integrated variables cannot wander too far away from each other. Formally, two non–stationary series Xt and Yt are said to be co–integrated if the following conditions are satisfied: (i) both series are integrated of the same order, and (ii) there exists a linear combination of Xt and Yt, which is I (0) i.e., stationary. Thus, co–integrating relationships among the wholesale prices of coarse and medium quality rice in seven regional markets were estimated using the Johansen (1991, 1996) procedure based on the following Vector Error Correction Model (VECM):
(A2)
ijtjtit KPP += ϕ
ijtjtit KPP >−
t
p
kktktt PPP ε+∆Γ+Π=∆ ∑
−
=−−
1
11

29
where Pt = [ Pit, Pjt]′, a (2 x 1) vector containing the prices in markets i and j, both I (1), Γi are (2x2) vectors of the short–run parameters, Π is (2x2) matrix of the long–run parameters, εt is the white noise stochastic term.
The price data consist of monthly nominal wholesale prices of coarse and
medium rice for seven regional and three international markets spanning over January 1975 to December 2010. Both the maximum eigenvalue and trace statistics are used to test for the presence of a co–integrating vector in each relationship. For all meaningful price pairs across markets one co–integrating vector (r=1) was found and the resulting co–integrating vectors are reported below.
Table A2. Co–integrating vectors for rice prices
Cities Medium quality rice Dhaka Khulna Narayanganj Rajshahi Rangpur Sylhet Chittagong 0.989 1.013 0.980 0.997 0.999 0.979 (82.71) (67.29) (83.45) (65.39) (60.68) (58.59) Dhaka – 1.024 0.990 1.007 1.010 0.989 – (97.65) (126.98) (101.69) (71.03) (72.66) Khulna – – 0.968 0.984 0.986 0.967 – – (84.23) (97.08) (69.63) (55.53) Narayanganj – – – 1.017 1.021 0.999 – – – (85.20) (64.12) (71.30) Rajshahi – – – – 1.002 0.982 – – – – (65.08) (58.64) Rangpur – – – – – 0.979 – – – – – (52.89) Coarse Quality Rice Chittagong 0.978 1.064 0.995 1.030 1.032 0.995 (66.02) (52.23) (76.06) (43.71) (50.83) (42.89) Dhaka – 1.087 1.017 1.052 1.055 1.016 – (67.04) (113.19) (57.22) (57.18) (45.82) Khulna – – 0.936 0.969 0.971 0.934 – – (69.68) (68.28) (58.77) (47.11) Narayanganj – – – 1.037 1.039 0.999 – – – (54.71) (54.49) (53.99) Rajshahi – – – – 1.001 0.964 – – – – (63.81) (41.63) Rangpur – – – – – 0.962 – – – – (41.62) International Prices Delhi 0.880 – – – – – (4.28) – – – – – Bangkok 0.596 – – – – – (6.97) – – – – –
Source: Authors’ estimates. Note: Figures in the parentheses are t statistics. As the data are in natural logarithmic form, co–integration vectors represent elasticity estimates (of the variables in the first column with respect to each of the other columns). For the sake of brevity, the coefficient of unity of the first column is suppressed.
Co–integration analysis of prices of coarse and medium qualities of rice and how
these are linked both across varieties and space have potential implications for government interventions as to procurement and distribution and hence for public stocks. Given that the prices of different markets and qualities of rice are co–integrated,

30
(i) the government interventions through of procurement and distribution especially through open market sale of coarse rice would have price stabilizing effect on other qualities of rice as well and (ii) any intervention in one market would have impact through spatial arbitrage on other markets as well.
Moreover, co–integration tests strongly indicate that the regional domestic
markets are integrated. Besides, the Dhaka market is integrated with two of the three relevant international markets. These findings may encourage policy makers to lower domestic protection on the rice sector and increase reliance on trade.
b. Import policy of rice in Bangladesh
Bangladesh rice trade policy and its rice import trade have undergone changes in the past several decades that have affected domestic rice prices. During the initial years after independence, Bangladesh encountered major difficulties in importing rice due to both shortages of foreign exchange and highly uncertain international rice markets. Consequently, the successive governments adopted a goal of rice self–sufficiency (Ahmed, Haggblade and Chowdhury (ed.), 2000) and heavily invested in agricultural research, irrigation and rural roads in an effort to increase domestic rice (and wheat) production.
During the 1970s and 1980s, imports of rice (all by the public sector since private
imports were banned) were rather small; wheat food aid helped fill in the gap between domestic supplies and target levels of national food grain consumption. Liberalization of private sector rice import trade in the early 1990s, however, made possible large scale imports of rice (and wheat) in years of major domestic production shortfalls. In years of normal harvests such as 1996/97, Bangladesh rice prices were below import parity prices for rice originating from both India and Thailand. As a result, private trade was negligible (Table A2). Private sector rice import was particularly important in adding to food grain supply and stabilizing rice prices following the 1998 flood which had resulted in a 2.2 million tonnes monsoon season (Aman) rice production shortfall (del Ninno et al., 2001; Dorosh, 2001).
During the 2000s India accumulated large public rice and wheat stocks, reaching
65 million tonnes in the summer of 2001, due to a series of good harvests and relatively high procurement prices. In order to reduce some of these stocks, the government of India implemented a program in 2002/03 to subsidize exports of rice obtained from Food Corporation of India stocks at the subsidized Below Poverty Line (BPL) price. Bangladesh imported 1.6 million tonnes of rice that year and Bangladesh domestic prices closely tracked import parity based on BPL sales prices (as opposed to import parity based on India’s wholesale market prices as following the flood in 1998). Large private sector rice imports continued through 2006/07, and Bangladesh wholesale prices closely tracked import parity based on BPL sales prices throughout this period, resulting in a high degree of price stability in Bangladesh. Table A2. Bangladesh rice import trade regimes
Period Trade Regime Private Imports (000 tonnes/year)
Description
1996/97 Autarky 30 Abundant harvests keep domestic prices below import parity

31
1997/98–98/99 Private imports from
India
1834 Consecutive poor Aman harvests raise domestic prices to import parity (ex: wholesale India)
1999/00–01/02 Autarky/minimal private imports
358 Good harvests keep domestic prices below import parity (Bangkok and BPL)
2000/01, 2002/03–07/08
Private imports from India (BPL rice?)
948 Domestic prices track BPL import parity
2007/08 Transition from import parity (BPL) to autarky
1681 India bans private rice exports as world prices rise; domestic prices rise sharply but generally far below import parity ex: Bangkok
2008/09–10/11 Autarky 172 Domestic prices above BPL India import parity, but generally below import parity ex: Bangkok and Delhi import parity.
Source: Shahabuddin et al. (2013).
Bangladesh rice markets were severely destabilized in the second half of 2007 as world prices of rice and other cereals rose sharply and India cut off rice exports in October 2007 due to relatively low public wheat stocks (Dorosh, 2009). Average wholesale rice prices in Bangladesh rose sharply and for the period from November 2007 to April 2008 they accounted for 45 percent higher in real terms than one year earlier. India later agreed to fixed quantities of rice exports to Bangladesh at a higher price than BPL prices. Yet, total rice imports by Bangladesh ultimately reached 1.7 million tonnes of rice in 2007/08.
Since 2008, domestic rice prices in Bangladesh have remained well above BPL
import parity but below import parity based on India wholesale market prices. Moreover, Bangladesh domestic wholesale prices have generally been below import parity of Thai rice. As a result, Bangladesh private sector imports have been minimal. Thus, from mid–2008 to mid–2011, expect small scale Bangladesh government commercial imports rice was essentially a non–traded commodity. In the absence of high levels of imports to boost domestic supply, Bangladesh real prices since 2008 have fallen about 15 percent comparatively to their peak of early 2008, but remain about 40 percent higher than in the 2002/03 to 2006/07 period.
Even though trade is not a major element of supply, this complacency underplays
its importance: while in aggregate it may not be much, for an individual country’s supply it may be critical. On the other hand, not many countries can and take part in grain trade. In fact, world grain trade is about 5 percent of world production. Accordingly disruption in production in the leading trading countries may be a destabilizing factor in a given country’s supply and consequently price situation.
Table A3 shows the evolution of the export trade in rice over the last three
decades. It is evident that the overall volume has more than doubled. By 2009–12, it has increased by almost a third to about 35 MMT. But countries which were in the export trade have changed over this period. Thailand had been the lead exporter and continues to remain so. India and Pakistan which were not major players in the export market became so by the end of the century. At present five countries – Thailand, Viet Nam, USA,

32
India and Pakistan – dominate the rice export market. These countries together accounted for an estimate of 84–85 percent of the total global exports of about 35 MMT. Any of these countries faltering in production can potentially destabilize the global market. In fact, it does not have to be the production of the same crop but a fall in production of a substitute crop can also do the same, as evident from the price hikes in maize due to lower production caused by a very long and severe period of drought in the USA that has led to a sympathetic rise in prices of other cereals. While Thailand, Pakistan and USA export roughly half of what they produce, Viet Nam exports nearly 30 percent. In contrast, India sells only about 3–4 percent of its domestic production.
Recent export trade has other peculiar characteristics. Due to high domestic
prices in 2007 and 2008, certain countries banned exports providing a further upward push to prices. Anyhow, while production is only partly conditioned by national policies, trade is completely dominated by it, especially during critical periods of global short supply.
Table A3. Major rice exporting countries in the world
1980–1989a 1990–1999a 2000–2003b 2009–2012b Thailand 36 Thailand 28 Thailand 29 Thailand 25 USA 21 Viet Nam 14 India 15 Viet Nam 22 Pakistan 9 USA 14 Viet Nam 14 India 16 China 6 India 11 USA 12 Pakistan 11 Myanmar 4 Pakistan 8 China 7 USA 10 India 3 China 8 Pakistan 7 Brazil 3 Australia 3 Australia 3 Uruguay 3 Uruguay 3 EC12 3 Uruguay 3 Egypt 2 Cambodia 2 Viet Nam 3 Argentina 2 Myanmar 2 Myanmar 2 Uruguay 2 EC12 1 Japan 2 Argentina 2 World 11,734 World 19,062 World 26,837 World 34,656
Sources: a. International Trade in Rice, Recent Developments and Prospects, World Rice Research Conference, 2004. b. Grain: World Markets and Trade, Circular Series November, 2012, United States Department of Agriculture. Note: Figures are in percent of world total in thousand metric tonnes. c. Modeling volatility of international rice prices
In the conventional econometric models, the variance of the disturbance term is assumed to be constant. However, many economic time series exhibit periods of unusually large volatility, followed by periods of relative tranquility. In such circumstances, the assumption of a constant variance (i.e., homoscedasticity) is inappropriate, and it is, therefore, important to model the variance of a series. The ARCH19 and the GARCH20 models have become very popular in this respect to estimate the variance of a series at a particular point in time. Following Engle (1982) and Bollerslev (1986) the GARCH (p, q) model may be specified as follows:
; and (A3)
19 Autoregressive conditional heteroskedasticity. 20 Generalized autoregressive conditional heteroskedasticity.
ttR εµ += ( )2,0~ tt N σε 2
1
2
10
2jt
p
jjit
q
iit −
=−
=∑∑ ++= σβεαασ

33
where, is the variable of interest, is the conditional mean, and is the error term of the mean equation, which is serially uncorrelated with mean zero. But the conditional variance of equals , which is a not only a function of q past lags of squared residuals, but also by p lags of past estimated volatility. Parameters andcapture the ARCH and GARCH effects respectively. For the GARCH model to be well defined, the ARCH and GARCH parameters should respectively satisfy the following:
, and .
The volatility in international prices of rice is tested employing this GARCH model. In order to select the appropriate lags in model estimation, autocorrelation function and partial autocorrelation function are carried out which indicates up to lag 1 as appropriate for model specification. Estimated results are presented in Table A4. Table A4. Estimates of GARCH (1, 1) model for international rice prices
Parameters India Thailand Viet Nam 0.0012777(0.50) 0.0016876(0.60) 0.0130622*(1.78)
0.0016236***(7.43) 0.0003252***(3.70) 0.0007171**(2.19)
0.4409314***(4.50) 0.3182959***(4.81) 0 .2144577(1.25)
0.015617(0.20) 0.6290364***(12.70) 0 .6007505***(3.25)
Source: Authors’ elaborations. Notes: 1. Figures in the parentheses are t statistics. 2. Figures with one, two, or three asterisks indicate significance at 10 percent, 5 percent, and 1 percent error probability levels, respectively.
Results show significant ARCH effect for the wholesale price of rice of India, both
ARCH and GARCH effects for the FOB price of 5 percent broken rice of Thailand and Viet Nam. It, thus, implies that there exists significant instability in international prices of rice. However, the instability in prices is only affected by past squared residuals in the case of India, whereas, for the other two countries the instability is affected by both past residuals and its volatility. This finding may be interpreted as showing that the error term is non–random and large, implying significant volatility in the series that is not due to chance. The economic implication of these findings is that one cannot treat these variables as random (and therefore unpredictable) in nature. This also raises the question of the nature of non–randomness that is involved along with the underlying factors contributing to it – a subject that requires further analysis.
tR µ tε
tε 2tσ
iα jβ
00 >α 0≥iα 0≠jβ
µ
0α
1α
1β

34
ANNEX B Poverty and inequality in Bangladesh Albeit poverty is a multidimensional concept and the recognition calls for going
beyond the traditional way of thinking about poverty primarily as inadequate income or consumption, the professional discourse in Bangladesh is still limited to use total expenditure as a metric of living standards. Given this warning, the current analysis uses the traditional concept. The Bangladesh Bureau of Statistics uses two poverty lines, an upper and a lower poverty line. The upper poverty line represents a level of expenditure that is just enough to meet both (i) the cost of a nutritionally adequate basket of diet; and (ii) the average amount of non–food expenditure incurred by those households whose food expenditure is just enough to buy a nutritionally adequate basket of diet. The lower poverty line represents a level of expenditure that is just enough to meet both (i) the cost of a nutritionally adequate basket of diet; and (ii) the average amount of non–food expenditure incurred by those households whose total expenditure is just enough to buy a nutritionally adequate basket of diet. Households and individuals whose expenditure falls below the upper poverty lines are called “poor” and those whose expenditure falls below the lower poverty lines are called “extreme poor”.
Following standard practice, poverty (as well as extreme poverty) is measured
with the help of three indices–namely, (i) the headcount poverty index (P0), which measures the proportion of the population counted as poor, i.e., whose consumptions expenditure falls below the poverty line; (ii) the poverty gap index (P1), which measures the average depth of poverty, i.e., on the average how far below the poverty line the poor people’s consumption happens to lie; and (iii) the squared poverty gap index (P2), which also measures the average depth of the poverty but it is a weighted average, with greater weights being assigned to the gaps of the poorer persons. Foster, Greer, and Thorbecke (1984) provide a technique, dubbed the FGT method, to estimate these indices. As the headcount poverty rate gives only the percentage value of poverty incidence and does not measure the distance of the poor households from the poverty line, the poverty gap estimates about the depth and severity of poverty of the population are required.
Table B1 below presents estimates of all three measures of poverty in Bangladesh
for the years 2005 and 2010. The estimates reveal the process of accelerated poverty reduction that was observed in the first half of the 2000s compared to the 1990s has not only continued but also strengthened in the second half of the decade. The headcount rate, using the upper poverty line, declined from 40 percent to 31.5 percent between 2005 and 2010. The poverty reduction rate per year is recorded at 1.5 percentage points, but the rate of reduction of poverty is higher in rural areas than in urban areas (1.7 vis–à–vis 1.4 percentage points). However, it has decreased to 17.6 percent in 2010 from 25.1 percent in 2005, using the lower poverty line. Similarly, the rate of poverty reduction is higher in rural areas than in urban areas (1.5 vis–à–vis 1.4 percentage points). Thus, in the rural areas, the rate of reduction of extreme poverty is lower than that of moderate poverty.

35
Table B1. Trends in Head Count Rate, Depth and Severity of Income Poverty Household Poverty Indices, 2010 Poverty Indices, 2005 Category Upper Poverty Line Lower Poverty Line Upper Poverty Line Lower Poverty Line HCR PG SPG HCR PG SPG HCR PG SPG HCR PG SPG National1 31.5 6.5 2.0 17.6 3.1 0.8 40.0 9.0 2.9 25.1 4.6 1.3 Rural1 35.2 7.4 2.2 21.1 3.7 1.0 43.8 9.8 3.1 28.6 5.3 1.5 Urban1 21.3 4.3 1.3 7.7 1.3 0.4 28.4 6.5 2.1 14.6 2.6 0.7 Barisal1 39.4 9.8 3.4 26.7 5.4 1.6 52.0 15.5 6.3 35.6 9.1 3.3 Chittagong1 26.2 5.1 1.5 13.1 2.2 0.6 34.0 6.3 1.7 16.1 2.2 0.5 Dhaka1 30.5 6.2 1.8 15.6 2.7 0.7 32.0 6.9 2.1 19.9 3.6 1.0 Khulna1 32.1 6.4 2.0 15.4 2.7 0.8 45.7 10.8 3.5 31.6 6.2 1.7 Rajshahi1 29.8 6.2 1.9 16.8 2.8 0.7 51.2 11.9 3.8 34.5 6.4 1.8 Rangpur1 46.2 11.0 3.5 30.1 5.5 1.4 Sylhet1 28.1 4.7 1.3 20.7 3.3 0.9 33.8 7.2 2.1 20.8 3.4 0.8 Farmer2 24.0 Non–farmer2 34.5 Sources: 1. Bangladesh Bureau of Statistics. 2011. Report of the Household Income and Expenditure Survey 2010, Dhaka. 2. Authors’ elaboration based on HIES (2010).
Using the lower poverty line, the poverty gap is estimated at 3.1 percent in 2010 at the national level. It has recorded a reduction of 1.5 percentage points since 2005. For the upper poverty line, the poverty gap is estimated at 6.5 percent in 2010. It has recorded a 2.5 percentage–point reduction over 2005. All these reductions of the poverty gap indicate that the average consumption level of the people living below the poverty lines improved between 2005 and 2010.
The squared poverty gap measures the severity of poverty. This has been
estimated by the FGT method using both the lower and upper poverty lines. At the national level, using the lower poverty line, it is estimated at 0.8 percent in 2010, previously 1.3 percent in 2005. Using the upper poverty line, the squared poverty gap is estimated at 2.0 percent in 2010, previously 2.9 percent in 2005. This indicates that the severity of poverty has decreased between 2005 and 2010.
There has been much debate on the existence nature and trend of the east–west
divide in the living standards in Bangladesh based on HIES (2005) data. These studies conclude that eastern regions enjoy a higher living standard of living than the west (World Bank, 2008; Zaman and Akita, 2012). However, the situation appears to have changed quite dramatically in the second half of the 2000s. First, the inter–division disparity in poverty has narrowed down considerably – both for the upper and lower poverty lines. While in 2005 the poverty rate ranged between 32 percent and 52 percent using the upper poverty line, and between 16 percent and 36 percent using the lower poverty line, in 2010 the corresponding ranges were between 26 percent and 46 percent using the upper poverty line, and between 13 percent and 30 percent using the lower poverty line. Second, the slower reduction in poverty in the eastern region vis–à–vis then western region has badly decrease the partition. Third, even though the east–west division has become blurred between 2005 and 2010, it masks underdeveloped districts in the east and developed districts in the west in terms of income and other socioeconomic dimensions (Khondker and Mahzab, 2015).
Table B1 also highlights the fact that rural poverty is more widespread and more
severe than urban poverty. In fact, the HCR is more than 150 percent higher in the rural areas than in urban areas. As a result, about 75 percent of poverty of the country is located in rural areas. Even though Dhaka ranks third in terms of HCR across the regions, more than 25 percent of poverty is located in the region.
