rice policy in indonesiat - ageconsearch.umn.edu · in 1966 the level was still only 52.4 per cent....
TRANSCRIPT

SALEH AFIFF AND C. PETER TIMMER*
RICE POLICY IN INDONESIAt
Most wajang golek, the traditional and popular Indonesian puppet plays, have three acts. The first introduces the characters and identifies good and evil. The second casts the good characters, usually because of some minor flaw in their character, into great tragedy and causes the audience nearly to lose hope. But in the third act the hero, after many narrow escapes and temporary reversals, manages to emerge triumphant, and banishes the evil forces to the forests in East Java. Whether it is art following life, or vice versa, many events in Indonesia seem to have a tendency to follow this heroic pattern. And the "rice problem" is no exception. In order to understand the present policies and what looks like an emerging success story, it is necessary to see acts one and two.
EVOLUTION OF TIlE POLICY: 1950-67
The overriding importance of rice as the basic Indonesian foodstuff is clearly reflected in Chart 1, based on Appendix Table I, which compares the per capita production of the basic carbohydrate foods-milled rice, maize, cassava, and sweet potatoes-on a milled rice equivalent basis. In only one year did rice fall below half the total carbohydrate production. And production data alone understate the importance of rice consumption because rice is imported while cassava (tapioca) and maize are exported. In 1960, for instance, about 1.1 kilograms per capita of tapioca was exported and 9.3 kilograms per capita of milled rice was imported. So although rice formed 55 per cent of Indonesian carbohydrate production in 1960, it was 58 per cent of carbohydrate consumption. In fact, the mere fact that rice is imported while other basic carbohydrates are exported indicates how important rice is for the population. Appendix Tables I to V at the end of this paper present a historical and statistical summary of the role of rice in Indonesia.
For the five years from 1960 to 1964 rice imports averaged a million metric tons a year. In 1965 and 1966 when imports were less than a quarter of a million tons, rice consumption was only 80 kilograms per capita, 11 per cent below the
• Dr. Miff is Head, Agriculture Bureau, Indonesian National Planning Agency (BAPPENAS). A( t the time this article was written Mr. Timmer was serving with the Harvard Advisory Group BAPPENAS).
-I- This paper was originally prepared for the IRRI Conference on Rice Policy, May 9-14, 1971. The statistics and data are drawn from various official and unofficial sources, and are the best avail~)Ie. However, even these are not very reliable and frequently provide orders of magnitude only.
he reader should keep this proviso in mind throughout.

.... t: ~ -g .-
200
~150 (::,)
~ o .s: ] - 100 .-E t1')
E E 0' 50 o ::(
o
CHART I.-COMPARATIVE PER CAPITA PRODUCTION OF BASIC CARBOHYDRATES, 1960-70*
1960 1961
Igggi 5w~t pototo<zs ~ Cassava 1:::::1 Mai5<Z _ .Mill~ rice
1962 1963 1964 1965 1966 1961 1968 1969 1910 • Data &om Appendi." Table 1.
RICE POLICY IN INDONESIA 133
1960-64 average. A further notion of the "rice problem" faced by the present government when it came to power in 1966 is evidenced in Appendix Table I. The production of rice as a percentage of total carbohydrate production declined fairly steadily from the 1960 level of 55.8 per cent to a low of only 47.9 per cent in 1964. In 1966 the level was still only 52.4 per cent.
Appendix Table II, which shows total rice production, area harvested, and yield for Java and all Indonesia, gives an even clearer picture of the problem. Throughout the 1950s and early 1960s, rice production outside Java was erratic, but around a rising trend. The 1966/67 average of 4.275 million tons was 23.2 per cent higher than the 1959/60 average of 3.470 million tons.
But production on Java, where approximately two-thirds of Indonesians live, actually declined by 4.6 per cent during the same period. This decline, from 5.055 million tons to 4.820 million tons occurred in the face of a population increase of about 17 per cent. The situation is even worse if particular years are selected so as to magnify the decline: from 1960 to 1964 production fell by 13.6 per cent on Java.
The factors responsible for this decline, primarily the political and economic instability that will be discussed shortly, took a heavy toll in rice production. If only the rather modest trends of the late 1950s-an increase of 1.5 per cent per year in production-could have been maintained on Java, output in 1966/67 would have been 5.61 million tons instead of 4.82 million tons, or 16.4 per cent higher than what was actually realized.
The production problems on Java in the early 1960s were caused jointly by declining area harvested and declining yields. Yields dropped continuously from a 1962 high of 1.26 tons of milled rice per hectare to a 1966 low of only 1.13 tons per hectare, which was no better than in 1958. Compounding the problem of lower yields, and partly causing them, was a prior decline in area harvested. This was mostly due to a deterioration, through neglect and lack of funds, in the rather sophisticated irrigation network on Java. As the extent of controlled irrigation declined, so did the area successfully double cropped. Inadequate and uncertain water supplies also led to lower yields.
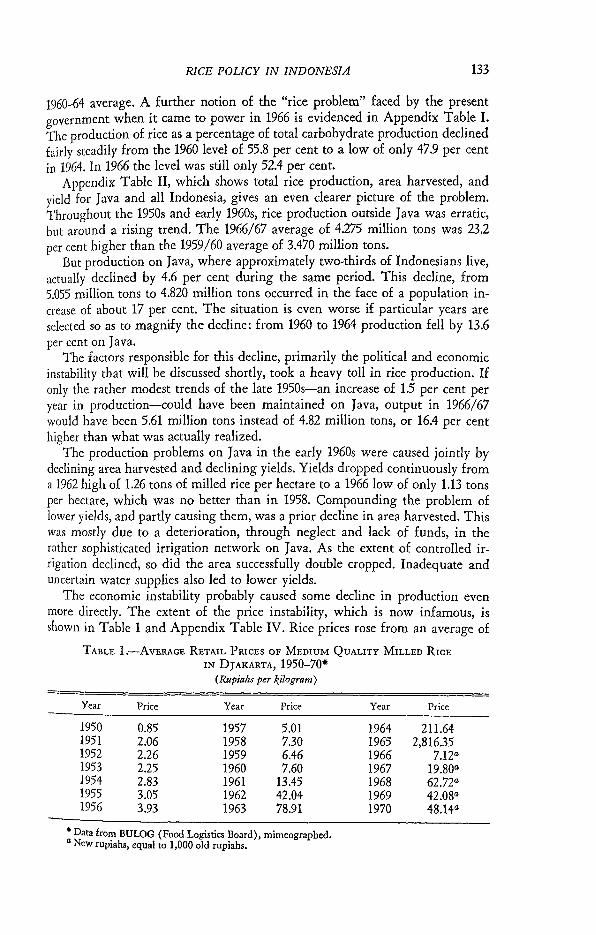
The economic instability probably caused some decline in production even more directly. The extent of the price instability, which is now infamous, is shown in Table 1 and Appendix Table IV. Rice prices rose from an average of
TABLE I.-AVERAGE RETAIL PRICES OF MEDIUM QUALITY MILLED RICE
IN I>JAKARTA, 1950-70· (Rupiahs per kilogram)
Year Price Year Price Year Price
1950 0.85 1957 5.01 1964 211.64 1951 2.06 1958 7.30 1965 2,816.35 1952 2.26 1959 6.46 1966 7.12a 1953 2.25 1960 7.60 1967 19.80a 1954 2.83 1961 13.45 1968 62.72a 1955 3.05 1962 42.04 1969 42.08a 1956 3.93 1963 78.91 1970 48.l4a
• Data from BULOG (Food Logistics Board), mimeographed. a New rupiahs, equal to 1,000 old rupiahs.

III IV V VI
INDIAN OCEAN
PROVINCE
West Java Djakarta Central Java Jogjokortc East Java Alieh
M
CAPITAL
Bandung Djakarta Semorong Jogjakorta Suroboia Bondo Alieh
VII North Sumatra Medon ViII West Sumatra Padong IX Riou Pa\canbarv
. '/ .......
SOUTH CHINA
SEA
"
JAVA SEA
PROVINCE
X Oiambi XI South Sumotrd XII Bengkulu XIII lampung XIV West Kalimantan XV Centrol Kalimantan XVI South Kalimantan XVII East Kalimantan
CAPITAL
Djombi Palembong Bengkulu T ondiungkorong-T elukbetung Pon'ianak P%ngkarojC( Bondiarmasin Samarinda
REPUBLIC OF INDONESIA
PROVINCES - CAPITALS
PACIFIC OCEAN
~f Ot , .. .:(/
"
PROVINCE CAPITAL
t XVIII North Sulawesi Monodo SYMBOLS
XIX Central Sulawesi Palu • Provincial Capital XX South Sulawesi Maleaser Province' Boundary XXI Southeast Sulawesi Kenderi XXII Maluku Ambon XXIII West Irian Djajapuro XXIV Bali Deoposar XXV West Nusa Tenggora Ma'oram XXVI East Nusa TenggQra Kupang 200 400 600 800 1000
Kilometers

RICE POLICY IN INDONESIA 135
Rp. 6.59 per kilogram in 1957-60 to Rp. 2,816.35 per kilogram in 1965, and prices had reached Rp. 8,000 per kilogram in 1966 before the 1,000 to 1 revaluation. Farmers who sold their production at harvest time were unable to buy essential living commodities a month later. Of course, even day to day credit tends to disappear in such an inflation.
But Appendix Table IV shows that the general inflation was only part of the instability that plagued the farmer. The other part, and probably even more important in terms of a disincentive to production, was the extreme movement in rice prices (both up and down) seasonally and spatially. Appendix Table IV does no more than provide a glimpse of the gyrations, but even this is astonishing.
In February 1962, rice prices in all Indonesia averaged about Rp. 39 per kilogram. But the price in Bali was only Rp. 13.25 per kilogram at the same time that the price in Palembang, in Sumatra, was Rp. 80.00 per kilogram. Physical transportation and handling costs would not have exceeded Rp. 10 per kilogram to move rice from Bali to Palembang. By October 1962, the pattern of prices had changed drastically, with the Bali price rising seasonally to Rp. 48.00 per kilogram while the Palembang price fell to Rp. 60.31 per kilogram. But the very wide degree of price deviation nationally, measured simply as the sum of the percentages that the individual high and low prices are from the average, was hardly changed. In February this sum was 171.3 per cent and in May it was 169.7 per cent. The average for 1962, based on the three representative months of February (high price on Java), May (low, harvest price on Java) and October (about average), was 148.3 per cent. This typically meant that the highest price prevailing in Indonesia was about four times the level of the lowest price. And this range is not a lowest farmgate price to a highest urban retail price, it is a comparison of urban retail prices.
The situation in 1966 was essentially the same, with an average sum of deviations for the year of 112.1 per cent, down somewhat from the 148.3 per cent of 1962. But the rice market in particular and the entire Indonesian economy in general were still characterized by an inability to match seasonal and regional price differences to the costs of storage and transportation. At fault were all the factors common to underdeveloped market economies-shortage of credit, lack of communication and information, inadequate marketing facilities (especially on the outer islands )-and these were accentuated in Indonesia by the rapid inflation and deteriorating infrastructure.
But in addition, and probably more important, the fault lay with government barriers to trade. The national government prevented rice mills from operating except on government account. Regional administrators, fearing (with some cause) that the national government would not provide adequate rice in case of shortage, prohibited the export of rice from their region, no matter how low the price fell. And at all levels almost everyone with any type of authority found the rice trade an easy source of revenue, so that taxes, both formal and informal, frequently exceeded the value of the rice traded. Rice policy, such as it was, emphasized consumer interests (rice imports from 1960 to 1964 averaged a million tons a year-see Appendix Table III) and local revenue generation. It is no wonder that production suffered and prices were unstable.

136 SALEH AFIFF AND C. PETER TIMMER
Repelita: the First Five-Year Development Plan (1969/70-1973/74)
When work on the Five-Year Plan, known in Indonesia as Repelita, began in 1968, the new government had already achieved a substantial degree of monetary stability, at least relative to the previous few years. Through tight fiscal policy (a balanced budget, quarter by quarter) and very high official interest rates (9 per cent per month) the inflation rate, as measured by the 62-commodity Djakarta cost-of-living index, was brought down to 30 to 40 per cent per year. Large imports of food aid commodities had a depressing effect directly on food prices. And in addition to a major tax collection effort, the balanced budget was financed by the rupiah proceeds from the food aid commodities. Stabilization was still the primary goal of the government, but it was possible to turn some attention to development.
It was inevitable that rice, because of its paramount importance in the national economy, would be called upon to playa dual role. Because it was the chief wage good in the economyl and has a 31 per cent weight in the cost-ofliving index, rice prices would have to be stable if the economy was to be stable. Since rice production and processing were the chief source of livelihood for about half the Indonesian population, production would have to increase if there was to be any widespread increase in per capita incomes. And finally, because of the new, high yielding rice varieties (developed partly from Indonesian rice strains), Indonesia's comparative advantage, at least in the short run, lay in agriculture. The most lucrative import substituting investments were likely to be in rice production. Self-sufficiency in the basic foodstuff became the leading priority of Repelita (13, p. 3).
It is the nature of the planning process that general goals such as self-sufficiency get translated into specific production targets. It is slightly ironic that with possible targets determinable by the requirements of stabilization, income growth, or foreign exchange savings, the ultimate rice production target in RepeJita is nutritional. The target of 15.42 million tons in 1973/74, the final year of Repelita, will be sufficient for a per capita consumption of 120 kilograms of rice. This quantity was recommended as necessary on nutritional grounds at a "Workshop on Food" sponsored by the National Academy of Sciences of the United States and LIPI, the Indonesian equivalent, in 1968.
The general strategy for agriculture is best stated in Repelita itself (13, pp. 4-5):
The present Five-Year Development Plan for the agricultural sector aims at increasing food production, especially rice, increasing the production and diversification of export crops, and enlarging employment opportunities. With increased productivity the agricultural sector will form an expanding market for the output of other sectors, especially the industrial sector, which will increase the possibilities of accumulating capital to finance the development of other sectors.
Production of food will be increased at a rate that will permit within the next 5 years the elimination of rice imports. A supplementary aim is to
1 Leon Mears calculated in 1967 that a Rp. 5 per kilogram increase in rice prices, then about Rp. 15-20 per kilogram, would lead to an increase in rubber production costs on estates of 5.5 per cent (6, p. 6).

RICE POLICY IN INDONESIA 137
improve the nutritional value of the consumption of the average Indonesian through increasing the production of foodstuffs which contain animal as well as plant protein, especially fish, nuts and beans. The positive effect of achieving the above objectives is that Indonesia will not have to import rice, which means that scarce foreign exchange can be used to import the capital goods and raw materials needed for the development of other sectors, especially the industrial sector. Moreover, increasing the production of food will result in raising the income of the food producers. This will improve the standard of living of the farmers who for such a long time have lived in poverty and misery.
It is essential for an understanding of Indonesian rice policy to realize that Repclita presents only one side of the picture-the development side. The other side, which is necessary even before any development can take place, is price stabilization and market integration. Stabilization, once achieved, tends to be taken for granted. But in Indonesia, only five years away from an inflation rate of GOO per cent a year (in 1966), stabilization is still a cornerstone of the rice policy. Development is building on that cornerstone and, probably, will eventually obscure it. But without it the whole effort crumbles.
IMPLEMENTATION OF TIlE POLICY, 1968-71
Any rice policy must have an impact on all three facets of the market-supply, demand, and price. Some policies tend to emphasize one rather than another, but in the end each is mutually determined with the others. In Indonesia, the poJicy target is consumption oriented, the implementation through the rice intensification program is production oriented, but the ultimate evaluation of the policy is determined by the level and stability of prices and the level of imports.
In discussing the details and implementation of the policy, then, it is helpful to look at supply, demand, and prices separately, realizing all along that they arc not separable. The discussion of prices especially will draw on the results in production and consumption.
Production
Early programs.-Attempts to raise rice production predate World War II. The Dutch colonial government tried to reach the peasant cultivator with an extension service system known as the "oil spot" (olie vlek) method. The idea was to demonstrate means of increasing productivity in locations with the best conditions to ensure success of the technique. The successful application of a particular way of cultivation could then be copied by farmers in an ever widening area.
The demonstration plots were generally only one-third of a hectare, and while the qualitative results were quite satisfactory, progress was much too slow even to keep pace with population growth (17, p. 4). After Independence, attempts were made to shorten the time span through a more effective extension service. But the result was merely an enlargement of the "oil spot" technique which foundered through lack of funds.
In 1959 Indonesia embarked on an ambitious three-year campaign for selfsufficiency in rice. Three separate programs were formulated:

138 SALEH AFIFF AND C. PETER TIMMER
1) intensification of rice cultivation through the use of "padi centers"; 2) rice cultivation on dry farms through mechanical clearing of land; and 3) clearing and cultivation of tidal lands. Only the first program was started in 1959. Each padi center was to coordi
nate the intensification efforts over an area of approximately 1,000 hectares; after five years the plan was to have 1,500,000 hectares in the program. Farmers in each padi center area were given credit in the form of fertilizer, seeds, and funds, with repayment in the form of dry stalk padi, generally at a price below free market prices (17, p. 7).2
The padi centers brought together, for the first time, all of the tasks of rice intensification. These included the provision of education, information, fertilizer and pesticides, and a means of collecting the padi as payment.s But the program was a failure. In 1959 Indonesia imported 610,000 tons of rice and in 1962 it imported 1,010,000 tons. The sources of the failure were important lessons in the design of current programs (17, p. 8) :
1) The strong centralization of the intensification effort in general, and the padi collection at low prices in particular, met with an unfavorable response from the farmers. Not unnaturally, they regarded it as the government practicing the usurious idjon system (17, p. 9).4
2) Easy credit, designed to bypass bureaucratic bank procedures, was badly abused, both by the officers giving the credit and by the farmers receiving it.
3) The new agency was given, "in one stroke," responsibility for disseminating information, distributing fertilizers, supplying seeds, disbursing credit, and collecting padi. Consequently, each padi center was extremely short of experienced and trained personnel, although in many cases these personnel were available and unutilized in existing specialized agencies.
BIMAS "action research."5-The failure of the apparently well conceived padi center program meant that any program to follow would be small in scale and independent of government support. Thus, the BIMAS "action research" program, conceived in 1963 at the Institute of Agriculture in Bogor, sent 12 fourthand fifth-year students to live in the villages and work closely with three blocks of about 50 farmers each. The result was rice production 50 per cent higher than on neighboring fields (16, pp. 63-64).
There were two basic innovations in the program that earlier efforts lacked: the extension agents lived in the villages alongside the farmers, and each worked
2 Rice in Indonesia is marketed by the farmer in three different forms. "Stalk padi" is primarily sold in Java-it is harvested one stalk at a time and sold with the stalk intact. "Gabah" is rough rice, or threshed stalk padi. Varieties which tend to shattcr, such as PB-5 and PB-B, arc usually marketed in this form. Lastly, "beras" is milled rice. Some farmers sell their production in this form, after hand-pounding or custom milling at a rice mill or huller unit. Because these terms arc easily confused with more standard nomenclature, but without being directly comparable, we have opted to use Indonesian nomenclature throughout for preciseness.
3 It should be noted that by this time Indonesia had developed and released rice varieties that yielded 3 to 4 tons of stalk padi (1.5 to 2.0 tons of milled rice) per hectare when adequately fertilized. See Appendix Table VI for dctails of varieties in use in Indonesia.
4 The idjon system is a form of prepurchase of the rice crop by village money lenders. The price is much below the eventual harvest price and the effective rate of interest is exceptionally high. For details see 8.
5 BIMAS is an Indonesian acronym for Bimingan Masaal, which means mass guidance. The first year of the program was actually called DEMAS, for mass demonstration, but BIMAS has been the name for intensification efforts ever since.

RICE POLICY IN INDONESIA 139
only with a limited number of farmers whose fields lay next to each other. Roekasah and Penny have recorded the impact (16, p. 64):
These two innovations made the difference between success and failure. [As has been mentioned] the students were neither skilled rice technologists nor experienced extension agents, but they were young and enthusiastic and, living in the village as they did, soon won the confidence of the farmers. A part of their task, moreover was to conduct demonstrationtype fertilizer and other experiments on farm fields, and the joint work they did with the farmers on these experiments helped them to gain the respect of the experienced practical agriculturalists. Insistence that no single student should work with more than 50 farmers whose fields lay in one block of land also meant that the students could get to know the farmer co-operators well. It meant, too, that the program was not "diluted" as had happened all too often in the past when extension efforts were ineffective because they were spread too thin. An important by-product of working with a group of neighbors was that it helped the students to organize joint or communal activities, for example cleaning the irrigation channels, that benefited the whole group.
The program was so successful in 1963/64 that it was expanded in 1964/65 to 440 students from 9 colleges of agriculture sent to 220 villages. The expanded program was sponsored and financed by the Department of Agriculture rather than the college in order to give the effort more authority. About 10,000 hectares were covered by this program, with yields almost five metric tons of dry stalk padi higher than non program yields.
The success of this program, which developed as its slogan pantja-usaha, owed much to the brashness and courage of the student workers as well as to the techniques being introduced.a Difficulties in obtaining supplies, especially fertilizer, were severe, and the student actions often direct. Roekasah and Penny note that, "Two of the groups of students were able to obtain the fertilizer only after making special return visits to the provincial capital where they interceded with the Provincial Governor and the Provincial Head of the Department of Agriculture on behalf of the farmers" (16, p. 65). The reception the farmers gave to the program was excellent so long as the supplies were actually available when needed.
But once again a successful idea was expanded too rapidly. By 1967/68 total area under the program reached almost 1.6 million hectares, and the program yield was only 2.1 tons of stalk padi higher than nonprogram yields. The inverse relationship between program area and differential yields has been identified by the BIMAS evaluation study and is summarized in Table 2.
BIMAS Gatang Rajang.7 - The declining program yields and diminished
yield differential, as well as concerns for fertilizer supplies and credit availability, induced the government to attempt still another approach in 1968. This was the BIMAS Gotong Rojong (BGR) program, under which the Indonesian Govern-
6 Pantja.t/salJa is "the five-fold way," and included 1) improved water control, 2) use of improved seed, 3) usc of fertilizer, 4) use of pesticides, and 5) better cultivation methods (16, p. 66). . 7 Gotong Rojong means mutual self· help. It was a singularly inappropriate name for this par
tIcular program.

140 SALEH AFIFF AND C. PETER TIMMER
TABLE 2.-RICE PROGRAM AREA AND RELATIONSHIP OF PROGRAM AND NONPROGRAM YIELDS, 1964/65-1969/70*
Program area Yield (tons mil/-dry stal1( padi per ha.)
Year (hectares) Program Nonprogram Differential
1964/65 9,800 7.290 2.313 4.977 1965/66 340,600 4.910 2.216 2.694 1966/67 522,000 4.890 2.l23 2.767 1967/68 1,596,200 4.038 1.905 2.133 1968/69 2,258,700 3.243 2.258 0.985 1969/70 1,748,600 4.319 2.328 1.991
.. Data from Agricultural Executives, Inc., Study and Evaluation of Rice Production Programs in Indonesia, 1961-1970, Chapter III, "Benefits and Cost of Programs," p. 11, May 1971 (draft).
ment contracted with several foreign companies to provide rice areas with fertilizers and pesticides to increase yields. The contractors also agreed to deliver seed and cash allowances to the farmers and to provide equipment and advice to the extension workers.
The contracts covered mostly suppliers' credits, for the companies used fertilizer and pesticides of their own manufacture. These credits, plus a substantial management fee, were repaid generally within one year of application. The Central Bank paid the foreign companies a fixed price per hectare treated. The farmers who were placed under the program were then obligated to deliver one-sixth of their total padi crop to the government in exchange for the inputs and services received from the foreign countries. At the same time the government continued some of its previous intensification programs, so that total area under some sort of program in 1969 reached two and a quarter million hectares.8
Relative to what had been achieved under earlier programs, and relative to the availability of most production inputs on soft-loan terms, BGR was a production and financial failure. The quantity of padi received from the farmers as repayment of the credit was substantially below expectations. The shortcomings had to be drawn from budget revenues to enable payment by the Central Bank to the contractors, and this was a serious drain on resources.
It has been difficult to determine exactly why there were such large shortfalls in padi repayments. But lower yields than anticipated (see Table 2), understatement of actual yields, and simple non-repayment seem to have been responsible.
Further difficulties with BGR were: (1) the program was located in some areas where adequate water supplies were not assured, thus wasting a portion of the inputs; (2) the rigid package of inputs caused many farmers to sell part of the fertilizer on the market at cut-rates, with the buyers frequently using the fertilizer on nomice crops; and perhaps most important in its longer run impact, (3) the BGR program had a very negative effect on the development of a market structure and credit institutions, because it bypassed the existing commercial enterprises entirely. In addition, farmers became accustomed to not repaying credits.
8 This is an oversimplified summary of a very complex subject. For a somewhat fuller discussion see the paper by Matoaka (10).

RICE POLICY IN INDONESIA 141
Perfected BIMAS.-In a remarkable show of flexibility, the government discarded the entire BGR program in 1970 after carefully evaluating the evidence. In its place, building on the foundations of the earlier BIMAS programs and a very successful 75,000 hectare pilot scheme in Jogjakarta, was a "perfected BIMAS" organized around a "Village Unit." This program, which now looks as if it will carry the major thrust of the rice intensification effort through the end of the Five-Year Plan (1973/74), can be quickly summarized as being "incentive oriented."
Observers have noted that the Indonesian rice farmer is one of the most skilled in Asia (3, p. 2) and many now have considerable experience in the use of fertilizer and pesticides. But these farmers have stubbornly refused to "modernize" unless the relative price of fertilizer to rice was favorable. This sensible attitude has even been formalized into the "Rum us Tani," or farmer's formula, which says that a kilogram of urea should cost no more, to the farmer, than a kilogram of milled rice can be sold for, at the farm gate, to make the extra cost and effort of fertilizer use worthwhile.9
The new program has thus introduced considerable flexibility into the intensification package. The implementation stresses getting seeds, fertilizer, and pesticides to the farm at favorable prices, providing subsidized credit through the village banking credit unit of BRI (Bank Rakjat Indonesia, the "People's Bank"), sending mobile teams of extension and program experts to explain the use of inputs and how the program functions, and then guaranteeing the farmer a profitable floor price of Rp. 13.20 per kilogram for his padi. The individual farmer is then free to decide whether he will participate in the program, and to what extent, up to 100 per cent of the recommended program.
One major aspect of the implementation has been to trust the private market, at least partially, to distribute fertilizer. This is in striking contrast to previous years when the state-owned P.N. Pertani was the sole distributor of fertilizer. Due to a number of institutional and managerial problems, P.N. Pertani often acted as a stock maximizer rather than a sales maximizer. Now P.N. Pertani has been joined by PUSRI and Pertamina as major distributors, as well as by a handful of smaller companies. lO All firms are charged to sell urea and trisodium phosphate at the village level at no more than Rp. 26.6 per kilogram. Beyond this injunction (enforcement of which falls largely in P.N. Pertani's hands), the firms are free to compete. The price of Rp. 26.6 per kilogram contains a subsidy of perhaps Rp. 7-8 per kilogram which is covered from the Development Budget.
The implementation of an effective floor price is the other major innovation in the program. Although attempts were made in the wet season harvest in 1969 to support padi prices at a profitable level, the effort was generally unsuccessful, as is shown in Table 3.
n This was a reasonable guideline until the high-yielding seeds emerged and significantly raised the responsc curvc. Now, a Rumus Tani ratio of less than onc is still profitable on the average for adopters of PE-S (i.e., IR-S).
10 PUSRI is an acronym for Pupuk Sriwidiaia. Pupuk means fertilizer and Sriwidiaia is an Indonesian name historically connected Witll Palembang, Sumatra, the location of the PUSRI urea plant. Pertamina is the state-owned (but largely autonomous) oil company. For further discussion of the history of fertilizer marketing and an analysis of the present scheme, see the recent article by Kol1l (4).

142 SALEH AFIFF AND C. PETER TIMMER
TABLE 3.-AVERAGE PRICES FOR FOUR TYPES OF PADI RICE IN RURAL MARKETS, APRIL-JULY (WET SEASON HARVEST), 1969 AND 1970""
(Rupiahs per lu"logram, except as otherwise indicated)
Type and year West Java Central Java East Java South Sulawesi
BuluNo.1 1969 15.82 14.19 11.81 12.92a
1970 22.12 19.24 16.69 18.58a
Per cent increase 39.8 35.6 41.3 43.8
Bulu No.2 1969 14.50 13.30 10.80 13.37b
1970 20.56 17.87 15.42 16.00b
Per cent increase 41.8 34.3 42.8 19.7
Tjere No.1 1969 13.65 12.77 11.16 11.000
1970 19.42 17.28 15.94 13.500
Per cent increase 42.2 35.3 42.8 22.7
TjereNo.2 1969 12.11 11.50 10.22 1O.83a
1970 17.95 16.10 14.86 Per cent increase 48.2 40.0 45.4
.. Data from Indonesia, Central Bureau of Statistics, IPEDA (Land Tax) Reports, Monthly Bul-letin oj Statistics, April, 1971.
a May-July only. b July only. o June only.
Rural prices in 1969 for average quality Tjere padi (Bulu variety sells at above average prices) were uniformly below the prices thought necessary to make widespread fertilizer use profitable. The policy outlined by Mears and Afiff in August 1969 was designed to raise these prices to the farmer and still maintain retail price stability (9).
The operational agency responsible for supporting the floor price is BULOG, the Food Logistics Board. Its charge is to buy as much rice from the mill as is necessary to keep the price for milled rice from falling below Rp. 36 per kilogram. On the basis of rough surveys in 1969, it was thought that this price should allow the farmer to receive Rp. 13.2 per kilogram for his dry stalk padi. This price fulfills the Rumus Tani formula when fertilizer price is Rp. 26.6 per kilogram. It also guarantees very favorable incremental benefit-cost ratios for farmers adopting the new technology (9).
BULOG offers a small incentive for better quality rice (lower percentage brokens) but makes no varietal differentiation (which is more important in Indonesia, where taste rather than quality per se is still the major factor determining price). There are no seasonal or spatial dimensions to the floor price policy.ll
11 BULoe (and its predecessors) had 25 years experience in purchasing rice from domestic rice mills to meet part of its distribution requirements for the military and civil service. Previously, however, BULOe had purchased, as cheaply as possible, a quantity target. The price policy introduced in 1969 gave BULOe a price target instead. Perhaps inevitably this led to considerable confusion and resistance on the part of the local buying agents. Substantial effort was required of national BULOe leaders to enforce the new price policy.

RICE POLICY IN INDONESIA 143
BULOG also has contracts whereby it purchases stalk padi or gabah (rough rice), but the minimum size of contracts has been five tons, which discourages most farmers from selling directly to BULOG. One of the major unresolved factual questions in Indonesian rice marketing is whether the farmer actually receives Rp. 13.20 per kilogram for his padi even if the mill receives Rp. 36 per kilogram for its milled rice, and the minimum urban retail price is Rp. 40-41 per kilogram. The bulk of the evidence suggests that he does, but it remains unsubstantial. A good example of the evidence that is beginning to accumulate has been reported recently by Atje (2).
By most standards of comparison, implementation of the floor price in 1970 was successful, with padi prices considerably higher than in 1969 (see Table 3), as BULOG bought almost 500,000 tons of milled rice. (In 1969 only about 200,000 tons were purchased.) The 1970 dry season crop was exceptionally good, spurred by heavy rainfall and, presumably, by the availability of inputs. And only in 1970 did Indonesian rice production finally make up all the ground it had lost in the mid-1960s. An optimistic trend line drawn through production in 1955 and 1960 is not reached again until the 11.4 million ton production in 1970. The 1971 crop was probably about 12.5 million tons. This would be higher than the 1955-60 trend.
Consumption
Rice policy in Indonesia has traditionally been consumer oriented, with adequate supplies at low prices (usually below world market levels) the major concern of the government. Keeping rice prices low helped keep Indonesia's laborintensive export products competitive in world markets even with inefficient production and marketing techniques, and also minimized the potential for urban unrest.
Official policy of the present government has attempted to redress this onesided policy by implementing the profitable floor price to farmers discussed above, but it has not discarded its concern for consumers' interests. Indeed, rice price stability is still the basic ingredient in the development effort, and this stability is primarily a matter of holding a ceiling price for rice. The farmer is protected by a government offer to buy all rice offered at Rp. 36 per kilogram at the rice mill and the consumer is protected by government sales of rice to hold an urban ceiling level of Rp. 50 per kilogram for medium quality rice.
The spread between these two prices was consciously designed, using the limited information available at the time, to provide at least minimum incentives to the private rice trade to accumulate and carry stocks from harvest to patjeklik, the preharvest period (9). Private costs of carrying stocks have been estimated at between 3.5-6.5 per cent per month, with interest charges making up 57-77 per cent of this total (7, p. 23). Even at the minimum rate of 3.5 per cent per month the private trade needs a price rise of 21 per cent just to carry stocks for six months. Since a price of Rp. 36 per kilogram at the mill translates to about Rp. 42 per kilogram in the urban markets (although this spread seems to vary seasonally and shows some evidence of declining), the total seasonal variation permitted is only about 19 per cent. A trader who buys in May at the floor price must sell by November at the ceiling price to earn any return at all. And indeed,

144 SALEH AFIFF AND C. PETER TIMMER
in 1969, the private trade in West Java did seem to exhaust their stocks, at least for the Djakarta market, by October or November, even though they bought the rice very cheaply before a successful floor price policy was implemented.
Still, the picture is not as bleak as it seems. At least on Java, rice is harvested all year long, with the big peak in April-June and a smaller (dry season) peak in September-October. So the private trade buys and sells rice continuously. In addition, the price spread between the floor and ceiling price is larger than it appears. BULOG makes no varietal distinction in purchasing at the floor price, and only guarantees that an "average" variety and quality rice will be available for Rp. 50 per kilogram at patjeklik. The private trade can buy BGS Krawang variety close to the floor price, for instance, but sell it in Djakarta at patjeklik for Rp. 3-5 per kilogram more than the ceiling price. The "indicator" variety is BGA Krawang, which sells for a notch below BGS at patjeklik. Whatever the trading techniques and margins, the private trade seems to be carrying a larger proportion of the marketed surplus. In 1970 they supplied the Djakarta market beyond December and into mid-February 1971, before BULOG was called upon to defend the ceiling price.
BULOG implements the ceiling price policy in two separate fashions; one direct and one indirect. The direct tool is through urban market injections whenever the retail price of the indicator variety exceeds (or threatens to exceed) Rp. 50 per kilogram. Then, working through large rice wholesalers or sometimes selling directly to the small retailers in the markets, BULOG moves rice into the markets at a price of Rp. 47 per kilogram. The Rp. 3 per kilogram margin provides adequate room to keep the final retail price at Rp. 50 per kilogram. There is no regional variation in the ceiling price at the moment (1).
With taste conscious consumers such as exist in Indonesia, the rice chosen as the indicator variety and its substitutability with the injected variety are very important. It has happened in a number of markets that BULOG has attempted to control the price of the local variety by injecting United States or Japanese imported rice, to little effect (see 15). In Palembang, for example, the local variety which had been used as the indicator variety rose in price to Rp. 60 per kilogram although United States medium grain rice (of better "quality") was amply available in the market for Rp. 49 per kilogram. Concern for these sorts of details, of course, came only after the general stabilization effort had been successful, but they are crucial for a final evaluation of the successes and failures of the program.
The second tool BULOG uses in the stabilization effort is direct rice distributions, as payment in kind, to the military, civil servants, and employees of national companies. This policy grew out of the inflation of the 1950s when the only way to protect government workers' wages was to pay a substantial part in kind. These physical distributions still total about one million tons per year, and in terms of quantities, are three to four times larger than market injections. There is some desire to reduce these distributions over time in favor of cash payments, in the interests of increased allocative efficiency (and lowering BULOG's deficit -partly caused by losses in this area). But stabilization will have to be a permanent feature of the economy before much progress is made here, and the private trade will have to be developed in many regions to handle the extra volume.

RICE POLICY IN INDONESIA 145
In the past there has been some conflict between the two demands on BULOG stocks. Since the physical distribution scheme was well established before the ceiling price policy, regional BULOG officials (in the DOLOGs, or Depot Logistics) were often reluctant to sell stocks to the markets if they were uncertain of having adequate supplies to cover their distribution needs. Resolving this conflict has called for two different approaches. The first has been a process of educating the DOLOG officials about the new government policy. The second has been to get stock levels high enough that most of the conflict disappeared. During 1970 very substantial progress was made on both fronts.
As was noted earlier, BULOG was basically unsuccessful in supporting farm prices in 1969, and purchased only 200,000 tons of milled rice instead of the 500-600 thousand tons thought necessary to keep prices up. In the face of a poor dry season crop late in 1969, BULOG's total stocks were inadequate to defend the price stabilization policy from the top. By the end of September 1969, total BULOG stocks were only 207,000 tons, about two months of normal distribution requirements, but not nearly sufficient to support extensive market operations. November injections were 14,000 tons, December 15,000 tons-less than half and possibly only a quarter of what was needed to hold a Rp. 50 per kilogram price ceiling throughout Indonesia.
This experience reinforced the need to build up a substantial buffer stock from which supplies could be drawn in the short run while imports were being arranged. The desirability of such a buffer stock was discussed as early as 1967 (6), but the holding of a substantial buffer stock as part of the price stabilization program was not really implemented until 1970. Stocks at the end of the year exceeded 500,000 tons.
The sources of rice for the buffer stock (and thus for distribution and market operations) are both domestic and foreign. The domestic rice accrues from the floor price policy. The amount forthcoming is difficult to predict until after the harvest comes in (and sometimes well after that), and since BULOG pursues a price rather than a quantity target, planning must be very flexible. These planning requirements are becoming even more exacting as the proportion of domestic rice in the BULOG supply rises as the intensification program succeeds. And the intention is that BULOG will meet all of its requirements from domestic rice by the end of the Five-Year Plan.
In the meantime, and historically, imports have been used to fill the gap between available domestic supplies and the quantity required to meet distribution requirements and market operations to hold the ceiling price. Although commercial purchases comprised the bulk of the imports in the early 1960s, a critical balance of payments deficit and the need to generate rupiah proceeds to finance the government's development effort led to large PL 480 and Japanese food aid rice imports in the past several years. This aid-financed rice, and the wheat flour that accompanied it, have had a major impact on Indonesia's economy. Most of the first year's Development Budget was financed from the rupiahs generated by the sale of these commodities, and the foreign exchange saved was used to import capital development goods. So the dual nature of the price stabilization policy is revealed once again.
Large quantities of aid-financed wheat flour were programmed in 1968, in

146 SALEH AFIFF AND C. PETER TIMMER
TABLE 4.-WHEAT FLOUR STATISTICS, 1965-70*
Year
1965 1966 1967 1968 1969 1970
Imports (thousand
metric tons)
32.4 44.9
146.7 336.8 347.1 504.1
Per capita consumption (kilograms)
0.309 0.420 1.346 2.476 3.529 4.354
~ Data from BULOG and Department of Trade, mimeographed.
Wheat flour price relative to cheap quality rice price
2.289 3.023 1.482 0.923 1.072 1.119
addition to rice, as part of the stabilization effort. Although the quantities originally envisioned (up to a million tons per year) never materialized, substantial volumes were imported, with short- and long-run effects. Table 4 shows some of the more recent statistics for wheat flour. Aid-financed flour was 12.5 per cent of the imported amount in 1968, 75.2 per cent in 1969, and 100 per cent of the 1970 supplies.
Wheat flour has long been imported into Indonesia in modest quantities, and the per capita consumption in 1956 was not exceeded until 1968. The factors determining the level of wheat flour consumption are complex, as there are four other major carbohydrates also consumed in Indonesia. But because wheat flour played a major role in the price stabilization effort, research was conducted to unravel some of these factors (19).
The results, briefly, indicate that wheat flour consumption in Indonesia is very sensitive to changes in prices. Holding other factors constant, a 1.0 per cent decrease in the price of wheat flour leads to a 1.4 per cent increase in the per capita amount consumed. Thus the own-price elasticity is -1.4.
Rice prices also affect wheat flour consumption, with a 1.0 per cent increase in rice prices leading to a 1.2 per cent increase in wheat flour consumption, holding wheat flour prices constant. The cross-price elasticity is 1.2.12 These elasticities are very high and are probably caused by two things: (1) wheat flour is still consumed in very small quantities mostly by higher income groups (the cross-section expenditure elasticity in Djakarta is 1.8), and (2) the wide range of carbohydrates available makes cross substitution very easy. The expenditure elasticity and ownprice elasticity will probably decline as wheat flour consumption increases.
Since no significant production of wheat grain is ever likely in Indonesia, all demand for wheat flour and wheat products will be met from imports. In the current financial and balance of payments situation, this hopefully means aidfinanced wheat and wheat flour. But the government has at least implicitly committed itself to the long-run consumption of wheat flour in Indonesia by licensing three wheat flour mills. By the end of 1972 they will be able to supply all of Indonesia's wheat flour requirements.
12 These elasticities were calculated from time series data using a logarithmic demand function and arc significant at a 95 per cent confidence level.

RICE POLlCY IN INDONESIA 147
Prices
The ultimate test of a price stabilization policy is prices. We measure consumer welfare not by how much rice (or cassava, or peanuts) is eaten, but by whether the population can buy as much as it wants at a fair price. For several excellent reasons, including the income and employment effects for farmers, it is desirable to produce enough rice domestically to guarantee this fair price. But in the end it is price behavior that determines how successful rice policy has been. The role that rice policy might be expected to play in the equity issues of regional and personal income distribution will be discussed in the third section.
What is the score? Clearly, 1969 might be written off as a year of trial and error and learning for all concerned. But even before that, by 1968, substantial progress was being made on the broad scope of regional integration of the rice market and dampening seasonal price movements. Appendix Table IV shows that the decline from 1962 to 1966 in the average deviation of low and high prices from average prices (from 148.3 per cent to 112.1 per cent) continued in 1968. In February the total deviation still exceeded 100 per cent, with the retail price in Palembang almost three times the level in Makassar. Just as in the earlier years, these were not isolated extremes-Djakarta's price was two and a half times as high as the price on Bali. By May and October however, the high prices were only a little more than double the low prices and there was considerably more clustering about the average. Seasonal variations were also dampened, with no region's high price varying from its low by more than 100 per cent. In 1962 Bali's high price was 260 per cent above its low. For a vivid discussion of rice price movements as they were happening, especially through the traumatic 1967 period, see the various survey articles published at the time in the Bulletin ot Indonesian Economic Studies (18).
Some further progress was made in 1969, but the dramatic gains were achieved in 1970 and in the current year. The years of learning and experimentation are paying off. From an average sum of deviations in 1968 of 83.6 per cent the 1970 average fell to 50.1 per cent, probably the lowest in modern Indonesian history. The stability in some places was especially striking: in Ambon the average price of (imported) rice never varied from Rp. 50 per kilogram. In Medan and Bandjarmasin the floor price was broken at one season and the ceiling price at another. Both aspects have now been successfully tackled in Medan (the February 1971 price was above the floor, in contrast to February 1970). Several cities in Kalimantan and the Pakanbaru area of Sumatra continue to be problems as the transportation system is still inadequate, but substantial efforts are being made to bring these areas into the national market as well.
The results, then, have been markedly increased production and consumption of rice at stable prices. Production increased from 9.05 million tons in 1967 to 11.4 million tons in 1970. Consumption has risen from 79.5 kilograms per capita to 92.6 kilograms in the same period. Deflated rice prices are slightly lower now than in 1967, and actual prices are lower than in 1968 (when rice prices were unusually high on Java). In terms of the specific goals given it, the rice policy has been a success up to now.

148 SALEH AFIFF AND C. PETER TIMMER
The price policy that has been part cause and part effect of this effort has emphasized stabilization around an equilibrium price level, not support above it or control below it. But the extremely wide spatial and temporal price variations that prevailed in Indonesia prior to the present policy gave scope for both price support and price control. The government, by breaking down barriers to trade, building infrastructure, encouraging the private trade, and utilizing a government agency to enforce reasonable seasonal price limits, was able to provide improved price incentives to farmers and better price protection to consumers. Farmers responded by using more inputs and producing (and consuming) more rice. Consumers reacted, through higher incomes and better relative prices, by consuming more rice. The stabilization policy has apparently had real welfare significance for a large proportion of the population.
REPELITA AND BEYOND: 1972-?
The rice production target in Repelita is 15.42 million tons, an increase of 51.6 per cent from the 1968 base of 10.17 million tons. With a knowledge of the production programs, consumption trends and price policy, it is now time to ask three basic questions:
(1) Can Indonesia produce 15.42 million tons of rice in 1973/74? (2) If it is produced, can Indonesia consume 15.42 million tons of rice in 1973/
74? (3) If it is produced and consumed, what will happen to rice prices, both
absolutely and relative to other food prices?
Can It Be Produced?
Table 5 shows the Repelita production targets and the necessary inputs to achieve them, on an annual basis. The plan called for substantial expansion in both area harvested and in yields per hectare. Only 400,000 hectares of the total
TABLE 5.-PLAN TARGET FOR 1973/74 RICE PRODUCTION, AND RELATED INPUTS*
Item 1969/70 1970/71 1971/72 1972/73 1973/74
Production target (million tons) 10.52 11.43 12.52 13.81 15.42 Harvested area (million hectares) 7.60 7.96 8.32 8.76 9.30 Average yields (tons per hectare) 1.38 1.43 1.51 1.58 1.66 Area under intensification
(million hectares) Total 2.59 2.90 3.15 3.48 4.00 High yielding varieties 0.79 1.40 2.15 3.08 4.00
Fertilizer applicationa (thousand tons) Urea 338 430 530 676 800 T.S.P. 169 215 265 328 400
Insecticide applicationsa ($ million) 15.70 16.60 17.50 18.50 20.10 Controlled irrigated acreage
(million hectares) 1.70 2.10
"Data from Repelita, The Indonesia Five-Year Plan, 1969/70-1973/74. a Amounts applied during the growing season of the preceding year.

RICE POLlCY IN INDONESIA 149
TABLE 6.-ExPENDITURE ELASTICITIES FOR RICE ON JAVA""
Expenditure class Elasticities Population weighs
(rupiahs per month) Urban Rural Urban Rural
Less than 300 .75 .92 .1371 .4238 301 to 1,000 .44 .63 .7217 .5434 More than 1,000 .13 .34 .1412 .0328
Weighted average" .44 .74 1.0000 1.0000
• Based on data from September-October 1967 Household Consumption Survey, as reported in C. Peter Timmer, "Estimating Rice Consumption," Bulletin of Indonesian Economic Studies, Vol. VII, No.2, July 1971.
"Weighted average rural and urban combined is .69 (urban population weight .1635, rural .8365).
1,700,000 hectare increase was to be in new controlled irrigation. The rest was expected to come from rehabilitation of presently irrigated land and expansion of rainfed padi.
The yield increases were programmed in accordance with the potential of the high-yielding seed varieties on 4,000,000 hectares and total fertilizer application that would more than double base year rates. The resulting yield and area figures are technically consistent with the production target of 15.42 million tons. The real question is whether these figures can be achieved.
The evidence to date suggests that while the irrigation work is going more slowly than anticipated, differential yields on the intensification areas are higher than planned, and the production program stayed on or above target for the first two years of the Plan. The good wet season harvest completed early in 1971 now makes the target level of 12.5 million tons in calendar 1971 at least possible, and perhaps even probable. With the advent of new seeds better adapted to Indonesian conditions/8 the odds of producing 15.42 million tons of rice in 1973 remain at least even provided the government remains committed to the target.
Can It Be Consumed?
Projecting self-sufficiency requirements is a complicated exercise, and a realistic effort must take account of the change in incomes, the likely course of prices of competing foodstuffs and the potential for substitution, and any changes in tastes. Two papers have recently examined these factors in some detail (5; 20). No specific projections emerge from either paper because the ultimate outcome depends strongly on government policy. But the factors leading to various consumption levels in 1973 are interesting indeed.
Expenditure elasticities for rice seem to be quite high for a basic foodstuff. TahJe 6 shows expenditure elasticities, estimated from cross-section data, for quantity of rice consumed, by expenditure class, for urban and rural households on Java.
The weighted average elasticity for urban and rural Java combined is 0.69, based on relative population weights of 0.1635 (urban) and 0.8365 (rural). Evidence from this survey and a later one in Djakarta in early 1969 show that the
. ~3 Two locally bred varieties with field trial yields exceeding PB-5 were released for multiplica-tion In March 1971. See Appendix Table VI for details.

150 SALEH AFIFF AND C. PETER TIMMER
expenditure elasticity declines smoothly with higher expenditure levels (the "elasticity of the elasticity decline" is -0.5). When adjustment for rising per capita incomes from 1967 to the present is carried out, an expenditure elasticity of 0.65 results as a best estimate for Java. At present income and savings levels, no distinction is made between expenditure and income elasticities.
No successful empirical research on the own- and cross-price elasticities for rice has yet been reported. The magnitude of the income elasticity would suggest a price elasticity of at least -0.5 if no cross-price elasticities are considered, but the easy extent of cross substitution with other carbohydrates has already been noted, and suppressing this would probably conceal significant sources of change. Accordingly, in the demand calculation below, a cross-price elasticity (with a composite of competing carbohydrates) of 0.3 or 0.5 is used, with an own-price elasticity (relative to the general commodity bundle excluding carbohydrates) of -0.1 or -0.3.
Table 7 shows the consumption consequences of holding the price of rice at present levels through the stabilization policy while other prices in the economy rise. The results are generated from a consumption function of the form
C = APra P} 1° N d, where
C = total rice consumption in millions of tons, a = own price elasticity of rice (-0.1 or -0.3), b = cross-price elasticity of rice with competing carbohydrates (0.3 or 0.5), c = income elasticity (0.65), d = population elasticity (1.00) (population growth rate of 2.0 per cent per
year assumed, which is probably too low.), Pr = price of rice, Po = price of other basic carbohydrates, I = per capita incomes,
N = population.
The results are rather striking in their wide range and, if nothing else, provide some rationale for explaining the large increase in per capita rice consumption in 1969 and 1970 at "stable" prices. First, of course, because of the very high rural income elasticities at low income levels, a large chunk of any increased production is eaten on the farm (average farm size on Java is well below 0.5 hectare, so the average farmer is in the low income class). But secondly, the general price level moved up about 10 per cent each year and some of the other basic carbohydrates became more expensive relative to rice. The real price of rice was low relative to previous years.
W hat Happens to Price?
In order to produce 15.42 million tons of rice in 1973/74 much of the government's energies devoted to agriculture will go to rice. Repelita calls for substantial increases in all the foodcrops, but these are simply not being realized. The suspicion is that this is not only because of government inattention, but that favorable rice prices and credit availability under the BIMAS program have shifted farmers on marginal fields out of cassava and maize and into rice.
Unless this imbalance is corrected, and there seems no good reason why it

RICE POLlCY IN INDONESIA
TABLE 7.-VARIOUS ESTIMATES OF GROSS RICE CONSUMPTION IN 1973
WITH RICE PRICES UNCHANGED FROM 1970,
AND WITH SPECIFIED OTHER CONDITIONS""
(Million tons)
Own-price elasticity of rice (a) -0.1 -0.3 Cross-price elasticity of rice with competing carbohydrates (b) +0.3 +0.5 +0.3 +0.5 Annual per cent increase in: Cost of living excluding rice 5 10 S 10 5 10 5 10
Price of rice Per capita substitutes income
0 2 13.59 13.79 13.59 13.79 13.98 14.59 13.98 14.59 0 3 13.85 14.04 13.85 14.04 14.25 14.86 14.25 14.86 0 4 14.11 14.31 14.11 14.31 14.51 15.14 14.51 IS.14 0 S 14.37 14.57 14.37 14.57 14.78 15.41 14.78 15.41
5 2 14.19 14.39 14.59 14.80 14.59 15.22 15.01 15.65 5 3 14.45 14.66 14.86 15.07 14.86 15.50 15.28 IS.93 5 4 14.72 15.16 15.14 15.35 15.14 IS.78 15.56 16.22 5 5 14.99 15.20 15.41 15.63 15.41 16.06 15.84 16.50
10 2 14.80 15.01 15.65 15.86 15.22 IS.86 16.08 16.75 IO 3 15.07 15.28 15.93 16.15 15.50 16.15 16.37 17.05 IO 4 15.35 15.56 16.22 16.44 15.78 16.44 16.66 17.35 10 5 15.63 15.84 16.50 16.73 16.06 16.73 16.96 17.65
15 2 15.43 15.65 16.75 16.98 15.86 16.53 17.21 17.91 15 3 15.71 15.93 17.05 17.28 16.15 16.82 17.51 18.21 15 4 16.00 16.22 17.35 17.58 16.44 17.12 17.81 18.53 15 5 16.28 16.50 17.65 17.88 16.73 17.42 18.12 18.84
151
• The assumptions, other than the ones shown in the table, are a 2 per cent per year population growth, an income elasticity of 0.65 for all years, and 1970 base year consumption of 12.l5 million tons. See text for the equation used.
should be except that maize is a good export crop (rice is considered a superior foodstuff by maize and cassava eaters), it appears likely that production of these alternate carbohydrates will continue to stagnate or decline. If rice prices are held at present levels, prices of maize, cassava, and sweet potatoes will likely increase, if for no other reason than the lack of a cost reducing technology (maize, because of hybrids available, may be an exception). The possibility of removing all inflation from the Indonesian economy seems slim-a rate of 5 per cent a year would probably be happily accepted by most officials over the next five years.
What this all means for rice consumption is that 15.42 million tons can be consumed if relative rice prices fall. The fall need not be much, nor out of line with experience in the past few years. For instance, if own-price elasticity is -0.3 and cross-price elasticity is 0.3, 15.42 million tons of rice can be consumed if the general price index and the prices of competing carbohydrates both increase 5 per cent per year, and per capita incomes increase at 5 per cent per year (the level of the past year, and certainly a possibility over the next 3 to 5 years if the planned rice production targets are realized). A number of other combinations, all of them within reason, will generate the same consumption. But all involve some fall in the real price of rice.
THE ROLE OF RICE IN INDONESIAN DEVELOPMENT
What then is the role of rice in Indonesian development? Can the government pursue a policy of stable money prices but declining real prices for rice and still

152 SALEH AFIFF AND C. PETER TIMMER
reach its self-sufficiency goal? The answer depends on whether the input subsidy program is continued and how widely the new cost reducing technology can be adopted. If inputs continue to cost the same and output continues to sell for the same, then the benefit/cost ratios are the same. If a high benefit/cost ratio motivates the farmer to modernize and increase output, then he will continue his efforts.
But it is total real income that the farmer is ultimately after, not a benefit/cost ratio, and here the cost reducing technology is crucial. Even lower prices can lead to higher profits if the average costs of production fall fast enough. And this is the ultimate promise of the miracle seeds. If this strategy could be successfully implemented it would provide progressively cheaper rice as agriculture's contribution to development. Achieving this agriculture-to-other-sectors transfer seems to be a critical factor in achieving self-sustaining economic progress. Whether it is too soon for Indonesia's rice sector to play this role is not yet known, but the answer is likely to emerge before the end of Repelita I.
SOME UNANSWERED QUESTIONS
It is probably fair to say that there is not a single aspect of the Indonesian rice economy that does not need substantial research. Placing priorities is difficult. But. ...
1. The rice intensification program, and the resulting increases in production, have meant substantial increases in income for farmers. It is very likely, however, that these increases have not been uniformly distributed among farmers and probably those most in need of income gain have benefited least (14). How can a rice intensification program reach the very small landowner (0.1 to 0.3 hectares) and the landless laborers? Will the cost of such an effort chew up the gains from the larger farms, leaving total income unchanged but redistributed? Can the country afford such an effort? Can it afford not to make the effort?
2. What is the employment potential of the rice program? The Javanese rice economy, including production, distribution of inputs, and marketing of the output, is exceedingly labor intensive. Does raising yields provide more work for more workers, or does it "merely" increase the productivity of the present work force? What policies can further the labor intensity of rice farming and prevent its capitalization? Does this involve a trade-off with rising output?
3. Not all regions in Indonesia have equal potential to participate in the rice intensification program. Are the efforts and resources going into this program causing regional frictions? What alternative development potentials do the nonrice growing regions have that could be fostered to promote equitable growth? Are the human and financial resources available to promote them? What will regional equity in growth cost in terms of total output foregone? How has the price stabilization policy per se benefited (or cost) each region?
4. There are a number of other important questions about the price stabilization program (see 11). How much rice is marketed (12)? What are the actual marketing margins at each stage from the farmer to the consumer? How can they be narrowed? What is the proper size of BULOG's buffer stock? Should regional price differentials be introduced into the ceiling price? The floor price? Should greater differentials be paid for better quality? For different varieties?

RICE POLICY IN INDONESIA 153
5. Indonesia has embarked on a rice self-sufficiency program without knowing exactly what the economic costs (or benefits) are. Because of the present availability and low price of rice in world markets, some fears have been expressed that Indonesia's rice intensification program produces rice at greater cost than imports. The cost involved is not just monetary, but in terms of the time and attention top level policy makers put into the rice program. Perhaps these resources could be used to better advantage in other crops or in other sectors. So it is important to know just what the marginal cost of rice is. What are the benefits and costs of the BIMAS program? If it would be cheaper to import, how much is Indonesia giving up economically to reach a noneconomic goal?
6. Our knowledge of the Indonesian farmer is pathetically sparse. What motivates him? What is his attitude toward risk? Do the very small size holdings cost anything in economic efficiency? Are there social benefits? Analysis of the extensive data collected by the Agro-Economic Survey might provide some answers.
7. The consumption function has received more attention than any of the above topics, but there are still some big holes. What is the price elasticity of demand for rice? What are the cross elasticities? What is the nature and extent of cross substitution with other carbohydrates? How are tastes changing?
There are a lot of questions and few answers. Implementation of the next Five-Year Plan is less than three years away; its drafting only two years from now. There is time to organize and conduct the research that will answer most of these questions, but a start must be made now.
CITATIONS
1 Gen. Achmad Tirtosudiro, "The Government Policy in the Effort of Attaining Stabilization of the Price of Rice," BULOe Yellow Paper (Djakarta), May 1970.
2 Atje Partadiredja, "The Marketing Margin for Rice," Bull. Indonesian Econ. Studies (Canberra), VII, 2, July 1971.
3 J. E. Hawes, Rice in Indonesia (USAID/Indonesia, May 1970). 4 John KoIff, "The Distribution of Fertilizer," Bull. Indonesian Econ. Studies
(Canberra), VII, I,Mar.1971. 5 Mahar Mangahas, "Projection of the Demand for Rice in Indonesia," Chap. XII,
Study and Evaluation of Rice Production Programs in Indonesia, 1961-1970, May 1971 (draft).
6 Leon Mears, "An Approach to the Rice Problem in Indonesia," Nov. 7, 1967 (mimeo.) .
. 7 --, "A Rational Rice Price Policy," Univ. of Philippines, School of Econ., DISC. Paper 70-18, Aug. 20, 1970.
8 --, Rice Marketing in Indonesia (Djakarta, 1961). 9 Leon Mears and Saleh Afiff, "An Operational Rice Policy for Indonesia," Eko
noml dan Keuangan Indonesia (Djakarta), Fall, 1969. 10 Takeshi Motooka, "BIMAS Gotong Rojong," Paper presented at the Confer
ence on Agriculture and Economic Development in Tokyo and Hakone, Japan, Sept. 1971.
11 Mubyarto, "Rice Price, Marketing, and Food Policy in Indonesia," Malayan Econ. Rev. (Kuala Lumpur) XII, 2, Oct. 1968.
12 ,Mubyarto and L. B. Fletcher, The Marketed Surplus of Rice in Indonesia: A Study In lava-Madura, Iowa St. Univ., Int. Studies in Econ. Mono. 4, Oct. 1966.
7 13 Republic of Indonesia, Repelita, the First Five-Year Development Plan (1969/
0-1973/74), Vo1.2A (Agriculture).

154 SALEH AFIFF AND C. PETER TIMMER
14 E. Roekasah Adiratma, Income and Expenditure Pattern of Rice Producers in Relation to Production and Rice Marketed: A Case Study in Karawang, West lava (Bogor, 1969).
15 E. Roekasah Adiratma and Zulkifli Azzaino, "The Influence of Injected Rice Upon the Price Decrease of Certain Rice Qualities in Djakarta Markets, 23 January-7 February 1970," Agr. Mktg. Sect., Inst. Pertanian, Bogor.
16 E. Roekasah Adiratma and D. H. Penny, "BIMAS: A New Approach to Agricultural Extension in Indonesia," Bull. Indonesian Econ. Studies (Canberra), 7, June 1967.
17 Soedarsono Hadisapoetro, "BIMAS Gotong Rojong and Agricultural Development," presented at Symposium on Problems of the Farmer and BIMAS Gotong Rojong.
18 "Survey of Recent Developments," Bull. Indonesian Econ. Studies (Canberra), issues 6-11, Feb. 1967-0ct. 1968.
19 C. P. Timmer, "Wheat Flour Consumption in Indonesia," ibid., VII, 1, Mar. 1971.
20 ---, "Estimating Rice Consumption," ibid., VII, 2, July 1971.
ApPENDIX TABLE I.-COMPARATIVE PER CAPITA PRODUCTION OF BASIC CARBOHYDRATES, 1960-70*
(Kilograms milled rice equivalent)
Total Rice as Milled Sweet carbohydrate per cent
Year rice Maize Cassava potatoes production of total
1960 91.9 25.0 39.3 8.4 164.6 55.8 1961 84.9 23.4 39.0 7.8 155.1 54.7 1962 89.3 32.5 38.8 11.4 172.0 51.9 1963 77.8 23.1 38.9 9.3 149.1 52.2 1964 80.6 36.0 39.9 11.7 168.2 47.9 1965 82.9 22.1 40.2 7.7 152.9 54.2 1966 83.5 33.9 34.8 7.0 160.6 52.4 1967 80.5 21.0 32.5 5.9 139.9 57.5 1968 88.3 27.5 33.5 4.7 154.0 57.3 1969 90.1 19.2 31.2 5.0 145.5 61.9 1970 94.3 20.1 29.2 4.9 148.5 63.5
• Data from Indonesia, Central Bureau of Statistics, Monthly Statistical Bulletin, March, 1971.

RICE POLICY IN INDONESIA 155
ApPENDIX TABLE I1.-RICE AREA, PRODUCTION AND YIELD
IN INDONESIA, 1953-70*
Area harvested Production (million Yield (tons milled (millions of hectares) metric tons milled rice) rice per hectare)
Outside Indo- Outside Indo- Outside Indo-Year Java Java nesia Java Java nesia Java Java nesia
1953 4.02 2.45 6.47 4.43 2.88 7.31 1.10 1.18 1.13 1954 4.16 2.46 6.61 4.82 3.02 7.84 1.16 1.23 1.18 1955 4.19 2.38 6.57 4.59 2.92 7.51 1.09 1.23 1.14 1956 4.30 2.40 6.70 4.76 2.84 7.60 1.10 1.18 1.13 1957 4.31 2.49 6.80 4.74 2.89 7.63 1.10 1.16 1.12 1958 4.39 2.60 6.99 4.95 3.03 7.98 1.13 1.16 1.14 1959 4.33 2.82 7.15 5.05 3.24 8.29 1.17 1.15 1.16 1960 4.32 2.96 7.28 5.06 3.70 8.76 1.17 1.25 1.20 1961 3.99 2.87 6.86 4.80 3.47 8.27 1.20 1.21 1.21 1962 4.09 3.19 7.28 5.14 3.75 8.89 1.26 1.17 1.22 1963 3.65 3.08 6.73 4.44 3.49 7.93 1.22 1.13 1.18 1964 3.66 3.32 6.98 4.37 4.05 8.42 1.19 1.22 1.21 1965 4.19 3.42 7.61 4.87 3.97 8.84 1.16 1.16 1.16 1966 4.11 3.67 7.78 4.66 4.48 9.14 1.13 1.22 1.17 1967 4.02 3.50 7.52 4.98 4.07 9.05 1.24 1.17 1.20 1968 4.26 3.75 8.01 5.54 4.62 10.17 1.30 1.23 1.27 1969 4.29 3.72 8.01 5.87 4.77 10.64 1.37 1.28 1.33 1970" 4.32 3.90 8.22 6.31 5.10 11.42 1.46 1.31 1.39
• Data from Indonesia, Central Bureau of Statistics, various sources. " Preliminary.
ApPENDIX TABLE IlL-RICE PRODUCTION, IMPORTS, AND CONSUMPTION
IN INDONESIA, 1958-70* (Million tons milled rice, except as otherwise noted)
Population Per capita Gross Net Total available (million consumption
Year production productiona Imports for consumption persons) (kilograms)/)
1958 7.98 7.50 0.71 8.21 91.1 90.1 1959 8.29 7.79 0.61 8.40 93.2 90.1 1960 8.76 8.23 0.89 9.12 95.3 95.7 1961 8.27 7.77 1.01 8.78 97.4 90.1 1962 8.89 8.36 1.01 9.37 99.5 94.2 1963 7.93 7.45 1.07 8.52 101.7 83.8 1964 8.42 7.91 1.02 8.93 104.0 85.9 1965 8.84 8.31 0.14 8.45 106.7 79.2 1966 9.14 8.59 0.24 8.83 109.4 80.7 1967 9.05 8.51 0.35 8.86 112.2 79.5 1968 10.17 9.56 0.63 10.19 115.1 83.8 1969 10.64 10.00 0.60 10.60 118.l 92.6 1970 11.42 10.73 0.95 11.68 121.1 92.60
L . • .Data from Indonesia, Central Bureau of Statistics, various sources, and BULOG (The Food oglslics Board) for imports.
a Estimated at 94 per cent of gross production, allowing 6 per cent for seed and losses. f b After allowance for change in government stocks and estimated changes in private stocks, as ollows: 1967, -.06; 1968, +55; 1969, -.34; 1970, +.47. f 0 The per capita consumption would be 97.3 if the 1970 headcount (for the General Election)
o 115.2 million is an accurate population figure. A full census will be conducted in 1971.

ApPENDIX TABLE IV.-AVERAGE PRICE OF MEDIUM QUALITY RICE, SPECIFIED MONTHS, 1962-71* (Rupiahs per kilogram, except as othertuise indicated)
I-' Vl
1962a 1966 1968 1970 1971 0'.
Region Feb. May Oct. Feb. May Oct. Feb. May Oct. Feb. May Oct. Feb.
latla Djakarta 56.25 30.79 38.89 4.18 6.12 8.90 73.85 50.60 43.89 57.25 44.61 46.48 50.30 Bandung 52.13 34.31 38.52 3.67 4.81 8.30 72.95 48.41 44.24 53.34 42.70 44.00 48.25 Semarang 38.25 28.78 34.25 2.90 4.75 9.40 56.99 40.00 33.74 49.17 40.98 44.13 47.19 Jogjakarta 2.35 4.10 7.50 49.16 36.29 37.55 46.73 37.17 39.26 44.88
~ Surabaja 25.39 22.16 30.00 2.80 2.90 9.00 51.38 39.58 38.00 47.50 35.38 39.63 41.50 t-<
Sumatra t">j
Medan 31.83 52.58 120.53 1.54 3.30 12.50 36.38 58.30 64.00 34.75 41.68 53.13 43.75 ::r:: Padang 51.50 66.94 69.68 2.67 3.44 10.00 39.87 53.01 52.41 42.39 43.75 43.75 47.00 ~
Pakanbaru 31.21 66.06 90.19 2.50 3.80 12.00 46.64 58.00 60.10 50.13 49.75 50.00 58.75 ~ Palembang 80.00 65.00 60.31 2.90 4.80 7.50 75.95 38.47 49.95 48.87 60.00 47.00 49.88 ~
K.alimantan ~
Pontianak 7.00 45.00 51.60 52.00 52.00 54.50 51.00 @ Bandjarmasin 24.96 60.10 3224 3.65 5.30 4.30 34.25 42.49 27.23 53.80 5025 31.25 43.06
0 Balikpapan 47.50 36.70 27.00 62.00 52.50 47.50 48.75 48.00 Sulatuesi til
Makassar 23.93 25.11 3024 3.44 3.44 4.65 26.35 4027 27.60 43.75 39.13 39.50 42.63 ~ Palu 44.34 34.37 53.75 47.00 52.25 49.25 Menado 3.80 3.50 10.00 47.60 57.l3 61.75 46.63 48.25 49.50 49.00 :j
Other Islands
~ Denpasar (Bali) l3.25 2233 48.00 1.50 2.75 6.00 31.88 39.38 41.25 43.66 44.50 43.25 47.63 Ambon 3.75 8.00 16.00 46.67 56.00 60.00 50.00 50.00 50.00 48.50
Simple average 38.97 43.11 53.36 2.98 4.53 8.97 48.23 45.93 46.l3 48.60 45.56 45.67 47.68 Per cent deviation from average
High 105.3 553 125.9 40.3 76.6 78.4 57.5 26.9 38.7 17.8 31.7 19.3 232 Low -66.0 -48.6 -43.8 -49.7 -39.3 -52.1 -45.4 -41.2 -41.0 -28.5 -223 -31.6 -l3.0
Sum of absolute per cents 1713 103.9 169.7 90.0 115.9 l30.5 102.9 68.1 79.7 453 54.0 50.9 36.2
Average of sums 148.3 112.1 83.6 50.1
• Data from BULOG (The Food Logistics Board), mimeographed. The low and high prices for the month are emphasized by underlining and double underlining respectively.
a In old rupiahs, equal to ~ooo of a new rupiah.

APPENDIX TABLE V.-LAND AREA, USE AND POPULATION PRESSURE'" (Sql/are kilometers, except as otherwise indicated)
Java Bali and Moluccas and Kali- Nusa and Total
Item Madura Sumatra mantan Sulawesi Tenggara W.Irian Indonesia
Total land area 132,174 473,606 539,460 189,035 73,614 496,456 1,904,345 1971 population (millions) 80.19 2038 531 9.17 7.19 2.00 124.24 Population per square kilometer 607 43 10 49 98 4 65 Wooded area 31,572 284,200 414,600 99,100 12,200 375,000 1,216,772 Agricultural area 97,423 25,855 8,177 12,488 10,964 1,085 155,992 Agricultural area per capita (hectares) 0.12 0.13 0.15 0.14 0.15 0.05 0.126 Farm food crop area 82,820 15,170 6,930 8,390 9,710 180 123,200 Wet paddy land, total 25,280 7,780 2,790 2,470 2,430 40,750 Wet paddy land harvested
Square kilometers 30,220 7,160 2,260 2,450 2,690 44,780 Per cent of totalG 120 92 81 99 III 110
• Data mainly from Indonesia, Central Bureau of Statistics, Statistical Pocketbook of Indonesia, 1960. Wet paddy land and wet paddy land harvested are from the 1963 AgriCtlltural Census as reported in the Statistical Pocketbook of Indonesia, 1967. The population figures are from a press release of the Central Bureau of Statistics.
a Measures the extent of double cropping of rice.
~ ~ "1::1 0 t-< -~ '< -<:
~ 0
~

ApPENDIX TABLE VI.-CHARACTERlSTICS OF LoWLAND RICE VARIETIES RELEASED FOR DISTRIBUTION IN INDONESIA'*' -Vl 00
Yield Year Maturity (qtlinta/s
Variety Parentage released (days) per hectare) Characteristics and performance
Bengawan Tjina X Latisail 1943 155-160 31 Stalk Paddy Many tillers, spreading, deep green leaf, long grain, translucent, good cooking quality; height 145-165 em, resistance to physiological disease and Piri-cularia oryzae. ~
Sigadis Blue Bonnet X Baiang 1953 140-145 33 Stalk Paddy Many tillers, erect, wide leaf, abdominal white; height 145-150 cm, resistance to lodge and physio- ~ logical diseases. ~
Remadja (Baiang X Tjina) X 1954 150-155 36 Stalk Paddy Many tillers, semispreading, long grain, abdominal ~ (Tjina X Latisail) white, not so good eating quality; height 145-165 cm, resistance to physiological diseases. ~
Djelita (Baiang X Latisail) X 1955 158-163 37 Stalk Paddy Many tillers, erect, violet leg, long panicles, abdomi- ~ (Tjina X Latisail) nal white; height 145-165 cm. 0
Dara Bengawan X Sigadis 1960 155-160 33 Stalk Paddy Many tillers, erect, violet, translucent, lodge, height "t1 t>:I
back cross III 145-165 cm, resistance to Piricularia oryzae and ~ physiological diseases.
Syntha Bengawan X Sigadis 1963 148 35 Stalk Paddy Many tillers, erect, long panicles, translucent, good :j back cross IV eating quality, height 145-165 cm.
~ Dewi Tara Bengawan X Sigadis 1963 148 34 Stalk Paddy Many tillers, erect, long panicles, translucent, good back cross IV eating quality, height 145-165 em.
Arimbi Bengawan X Sigadis 1965 150 38 Stalk Paddy Many tillers, erect, violet leg, sensitive to fertilizer back cross IV use, translucent, good eating quality.
Batara Bengawan X Sigadis 1965 148 37 Stalk Paddy Many tillers, erect, long panicles, translucent, good back cross IV eating quality, height 145-165 cm.
Peta Barn 5 (PB-5) Peta X Tangkoi Ratan 1967 130-145 50 Grain Paddy Many tillers, erect, green leaf, short grain, inferior eating quality, height 100-130 cm, resistance to lodge, sensitive to PiriCtilaria, Ri.'Wctonia and Xanthomonas oryzae.

Peta Barn 8 (PB-8) Peta X Dei-600- 1967 120 48.7 Grain Paddy Many tillers, erect, leaf flag is missing, short panicle, Woo-gen big grain, inferior eating quality, height 80-100
em, resistance to lodge, sensitive to Piricularia, Rizoctonia and Xanthomonas oryzae.
Siampat (C4-63) Peta X BPI. 76 1969 125-130 40-50 Dry Grain Medium tillers, strong sheath, leaf erect, long grain, good eating quality, resistance to lodge, height 105-112 em.
Dewi Ratih Lines 221/BC 1969 135-145 45.5 Dry Grain Medium tillers, straw, long panicle, translucent, III/20/2 X good eating quality, sensitive to Piricularia, me-Rendah Tjupok dium resistance to Xanthomonas oryzae.
IR-20 (Peta/3 X T(N)I) X 1970 122-123 54.6 Dry Grain Medium resistance to panicle blight, lodges with TRM-6 high fertilizer doses, height 98-99 em.
IR-22 IR-8 X Tadukan 1971 Pelita I.1 (back cross PB-5 X 1971 112-148 65.5 Dry Grain Medium eating quality, moderately susceptible to
Syntha) (135) bacterial leaf blight and bacterial leaf streak and No 446/2/4 P8 moderately resistant to sheath blight, height 100
em. Pelita 1.2 (back cross PB-5 X 1971 109-145 71.4 Dry Grain Good eating quality, medium tillers, resistance to
Syntha) No 440b/ll1/4
(133) bacterial leaf str~k, height 100 em.
• Data from Central Research Institute of Agriculture, Bogor. Quoted in Stlldy and Evalllation of Rice Prodtlction Programs in Indonesia, 1961-1970, May 1971 (draft).
~ Q '1::l 0 t-< -C") "<: -<:
~ 0
~
-VI \0
