rhs statistics for shaping a response to covid-19
TRANSCRIPT

Font: Stone Sans SemiBold
CMYK: 20C, 100M, 100Y, 25K
CMYK: 90K
CMYK: 0M, 20M, 100Y, 5K
CGIPNFNIGC
RGB: 9E1A1D
RGB: 414042
RGB: F3C108
PMS: 187 C
PMS: Black 7 C
PMS: 7406 C
RHS Statistics for
SHAPING A RESPONSE TO COVID-19in First Nations Communities

This publication is available online at the First Nations Information Governance Centre’s website. www.fnigc.ca
All of the data published in this report is available for download at FNIGC Data Online, FNIGC’s free-to-use data tool: www.fnigc.ca/dataonline.
This report is © 2020, First Nations Information Governance Centre. All rights reserved. These materials are to be used solely for non-commercial purposes.
This publication can be reproduced (in whole or in part) with the written permission of the First Nations Information Governance Centre. Please contact [email protected] for permission requests.
Cite this publication in the following format:
First Nations Information Governance Centre, RHS Statistics for Shaping a Response to COVID-19 in First Nations Communities, (Ottawa: 2020). 20 pages. Published in May 2020.
ISBN: 978-1-988433-07-3
The First Nations Information Governance Centre (FNIGC) is an incorporated non-profit operating with a special mandate from the Assembly of First Nations’ Chiefs in Assembly (Resolution #48, December 2009).
The First Nations Information Governance Centre envisions that every First Nation will achieve data sovereignty in alignment with its distinct world view.
www.FNIGC.ca
General inquiries: [email protected]

RHS Statistics for Shaping a Response to COVID-19 in First Nations Communities | 3
Table of Contents
INTRODUCTION ..................................................................................................................................................4
CHRONIC CONDITIONS .....................................................................................................................................5Comorbidity ....................................................................................................................................................6
BARRIERS TO ACCESSING HEALTH CARE ............................................................................................................7Percent Not Receiving Needed Care ...............................................................................................................7 Barriers to Care ...............................................................................................................................................7Language ........................................................................................................................................................7
SENIOR POPULATIONS .......................................................................................................................................9Chronic Conditions .........................................................................................................................................9Activity Limitations .......................................................................................................................................10Health Care Access .......................................................................................................................................10Importance of Grandparents and Elders .......................................................................................................10
SMOKING AND OBESITY ..................................................................................................................................12
HOUSING ..........................................................................................................................................................13Overcrowding ...............................................................................................................................................13Living Arrangements .....................................................................................................................................13Clean Water ..................................................................................................................................................13Household Mould .........................................................................................................................................13Repairs ..........................................................................................................................................................14Internet Access .............................................................................................................................................14
POVERTY ..........................................................................................................................................................15Unemployment .............................................................................................................................................15Basic Living Requirements ............................................................................................................................16Food Security ................................................................................................................................................16
CONCLUSION ...................................................................................................................................................18

4 | FNIGC
As the coronavirus pandemic continues to impact communities across Canada, it has become clear that certain populations are more vulnerable to contracting, and developing severe complications from Covid-19 due to their health, social, and economic circumstances. According to the Public Health Agency of Canada (PHAC) these populations include1:
• older adults,• anyone with underlying medical conditions (i.e.,
heart disease, hypertension, diabetes, chronic respiratory diseases, cancer), and
• anyone with a compromised immune system from a medical condition or treatment (e.g. chemotherapy).
PHAC also identifies vulnerable populations as anyone who:
• has difficulty reading, speaking, understanding, or communicating;
• has difficulty accessing medical care or health advice;
• has difficulty doing preventive activities, like frequent hand washing and covering coughs and sneezes;
• has ongoing specialized medical care or needs specific medical supplies;
• has ongoing supervision needs or support for maintaining independence;
• has difficulty accessing transportation;• faces economic barriers;• has unstable employment or inflexible working
conditions;• is living in social or geographic isolation (i.e.,
living in remote and isolated communities); and • is living in insecure, inadequate, or nonexistent
housing.
1 Source: Public Health Agency of Canada, https://www.canada.ca/content/dam/phac-aspc/documents/services/publications/diseases-conditions/coronavirus/-vulnerable-populations/-vulnerable-populations-eng.pdf (Accessed April 7, 2020)2 https://www.theglobeandmail.com/canada/article-are-we-a-top-priority-how-indigenous-communities-are-bracing-for/3 While these data are intended to be used to support community planning and response efforts, it is important to note that the data are national in scope and do not reflect variations at the regional and community level.
Given these social, economic, and health factors it is clear that First Nations people living in reserve and Northern communities are especially at risk if the coronavirus was to take hold in a community. Dr. Theresa Tam, Canada’s Chief Public Health Officer, has stated that First Nations, Inuit, and Métis communities face a higher risk of “severe outcomes” given health inequities, higher rates of underlying medical conditions, and challenges of remote and fly-in communities2.
Furthermore, First Nations are already struggling with diminished capacity to deliver health services (due to a lack of health professionals) and the low availability of health-care resources (i.e., personal protective equipment, hand sanitizers, testing kits, medications, etc.).
In light of this reality, the First Nations Information Governance Centre (FNIGC) has prepared this publication with the intent of supporting emergency preparedness efforts in First Nation communities. It contains reliable national-level data gathered in communities that can be used to advocate for additional resources, and better preparing them to deal with potential outbreaks.3
The analysis in this paper is based on results from the First Nations Regional Health Survey Phase 3 (FNRHS, or RHS) Phase 3, a large-scale survey conducted in 2015–2016 that provides national estimates for First Nations people living in reserve and Northern populations.
It is organized according to six key socio-economic themes and supported by data from the RHS Phase 3 Volumes One and Two, which were published in 2018 by the First Nations Information Governance Centre (FNIGC). These reports can be downloaded at no-cost at FNIGC’s Online Library: https://fnigc.inlibro.net/.
INTRODUCTION

RHS Statistics for Shaping a Response to COVID-19 in First Nations Communities | 5
CHRONIC CONDITIONS
As mentioned in the introduction, anyone with an existing medical condition (i.e., heart disease, hypertension, diabetes, chronic respiratory diseases, cancer) is at risk for severe illness if infected with the coronavirus which causes COVID-19. The RHS Phase 3 defines long-term health conditions as ones that are “expected to, or have already, lasted six months or more and that have been diagnosed by a healthcare professional.” RHS Phase 3 respondents were presented with a list of 35 possible health conditions to choose from.
Nearly 3 in 5 (59.8%) of First Nations adults, one-third (33.2%) of First Nations youth, and more than one-quarter (28.5%) of First Nations children reported having one or more chronic health condition.
Among First Nations adults who reported a preexisting health condition, many could be considered at risk for severe illness, such as: • 17.2% reported high blood pressure, • 15.9% reported diabetes, • 10.2% reported high cholesterol, • 9.6% reported asthma, • 4.2% reported heart disease, • 4.0% reported chronic anemia, • 3.3% reported a kidney problem, • 2.5% reported emphysema, chronic bronchitis, or
chronic obstructive pulmonary disease (COPD), • 2.0% reported cancer, • 1.4% reported effects due to stroke, • 1.3% reported tuberculosis, • 1.2% reported liver disease, • 0.9% reported hepatitis, and • 0.2%E4 reported HIV/AIDS.
Figure 1.1 Prevalence of diagnosed chronic health conditions among First Nations adults
4 E - Estimates can be considered for general unrestricted release but should be accompanied by a warning cautioning subsequent users of the high sampling variability associated with the estimates.
0.1%E
0.2%E
0.3%
0.4%E
0.6%
0.9%
1.1%
1.2%
1.3%
1.4%
1.6%
2.0%
2.2%E
2.3%
2.4%
2.5%
3.3%
3.8%
4.0%
4.2%
4.3%
5.2%
5.5%
6.9%
7.8%
8.0%
8.9%
9.6%
10.2%
12.4%
15.9%
17.2%
18.3%
21.5%
0.0% 5.0% 10.0% 15.0% 20.0% 25.0%
Autism spectrum disorder
HIV/AIDS
Alzheimer's disease and other dimentia
Neurological Disease
Epilepsy
Hepatitis
Glaucoma
Liver disease
Tuberculosis
Effects of Stroke
Speech and language difficulties
Cancer
ADD/ADHD
Learning disorder
Osteoperosis
Emphysema, chronic bronchitis, COPD
Kidney Problem
Blindness and serious vision problems
Anemia (chronic)
Heart disease
Cataracts
Thyroid
Dermatitis/atopic eczema
Hearing Impairment
Mood disorder
Stomach and intestinal problems
Anxiety disorder
Asthma
High Cholesterol
Chronic back pain
Diabetes
High blood pressure
Arthritis
Allergies

6 | FNIGC
Asthma was the second most commonly reported chronic health condition among First Nations youth (8.6%) and children (8.3%).
Many conditions can cause a person to be im-munocompromised, including cancer treatment, smoking, bone marrow or organ transplantation, immune deficiencies, poorly controlled HIV or AIDS, and prolonged use of corticosteroids and other immune weakening medications.
First Nation adults most often reported receiving treatment for their chronic health conditions - diabetes (87.9%) high blood pressure (85.5%), high cholesterol (80.0%), and asthma (67.5%).
Comorbidity
Figure 1.2: Percentage of First Nations adults receiving treatment for their chronic health condition
Figure 1.3: Percentage of First Nations adults with chronic health conditions, by number of conditions and gender
41.1%
47.7%
47.8%
51.6%
53.9%
57.9%
67.5%
80.0%
85.5%
87.9%
0.0% 20.0% 40.0% 60.0% 80.0% 100.0%
Allergies
Mood disorder
Anxiety disorder
Arthritis
Chronic back pain
Stomach and intestinal problems
Asthma
High cholesterol
High blood pressure
Diabetes
According to the RHS Phase 3, a higher proportion of female First Nations adults reported comorbidity (the presence of more than one chronic health conditions in one individual) compared to male First Nations adults, indicating that First Nations women carry a disproportionate burden of chronic illness.
Trends for First Nations adults show a significant increase in comorbidity as age increases. Comorbidity more than doubles from young adulthood (20.8%) to mid-age range (55.3%), and almost quadruples by 60 years and up (74.6%).
Figure 1.4
Figure 2.2
Did you require health care in the past 12 months? % [95% CI]
No 33.9 [32.2, 35.7]
Yes, and I received all the health care I needed 56.5 [54.5, 58.4]
Yes, but I did not receive all the health care I needed 9.6 [8.3, 11.1]
0 Health Condition 1 Health Condition 2+ Health Conditions
AGE (CHILDREN) % 95% CI % 95% CI % 95% CI
0–5 77.2 [74.8, 79.4] 14.5 [12.7, 16.5] 8.4 [6.9, 10.1]
6–11 66.8 [64.5, 69.0] 20.2 [18.1, 22.5] 13.0 [11.5, 14.6]
AGE (YOUTH) % 95% CI % 95% CI % 95% CI
12–14 70.2 [66.7, 73.4] 17.3 [14.2, 21.0] 12.5 [10.8, 14.5]
15–17 63.9 [61.6, 66.2] 18.6 [16.7, 20.7] 17.5 [15.8, 19.4]
AGE (ADULTS) % 95% CI % 95% CI % 95% CI
18–29 57.9 [54.4, 61.3] 21.3 [18.3, 24.7] 20.8 [18.4, 23.4]
30–39 48.7 [44.8, 52.6] 19.5 [17.0, 22.1] 31.8 [28.0, 35.9]
40–49 37.8 [34.2, 41.6] 18.8 [16.8, 21.1] 43.4 [40.1, 46.7]
50–59 28.1 [25.2, 31.3] 16.5 [14.7, 18.5] 55.3 [52.4, 58.2]
≥ 60 12.3 [10.8, 14.0] 13.1 [11.4, 15.0] 74.6 [72.1, 77.0]
44.7%
18.9%
36.4%35.6%
17.9%
46.5%
0%
10%
20%
30%
40%
50%
60%
70%
80%
0 1 2+
Male
Female
Figure 1.4: Number of chronic health conditions among First Nations adults, youth and children, by age group

RHS Statistics for Shaping a Response to COVID-19 in First Nations Communities | 7
BARRIERS TO ACCESSING HEALTH CARE
Remote/Special Access, 15.6%
Urban, 38.8%
Rural, 45.5%
Figure 1.4
Figure 2.2
Did you require health care in the past 12 months? % [95% CI]
No 33.9 [32.2, 35.7]
Yes, and I received all the health care I needed 56.5 [54.5, 58.4]
Yes, but I did not receive all the health care I needed 9.6 [8.3, 11.1]
0 Health Condition 1 Health Condition 2+ Health Conditions
AGE (CHILDREN) % 95% CI % 95% CI % 95% CI
0–5 77.2 [74.8, 79.4] 14.5 [12.7, 16.5] 8.4 [6.9, 10.1]
6–11 66.8 [64.5, 69.0] 20.2 [18.1, 22.5] 13.0 [11.5, 14.6]
AGE (YOUTH) % 95% CI % 95% CI % 95% CI
12–14 70.2 [66.7, 73.4] 17.3 [14.2, 21.0] 12.5 [10.8, 14.5]
15–17 63.9 [61.6, 66.2] 18.6 [16.7, 20.7] 17.5 [15.8, 19.4]
AGE (ADULTS) % 95% CI % 95% CI % 95% CI
18–29 57.9 [54.4, 61.3] 21.3 [18.3, 24.7] 20.8 [18.4, 23.4]
30–39 48.7 [44.8, 52.6] 19.5 [17.0, 22.1] 31.8 [28.0, 35.9]
40–49 37.8 [34.2, 41.6] 18.8 [16.8, 21.1] 43.4 [40.1, 46.7]
50–59 28.1 [25.2, 31.3] 16.5 [14.7, 18.5] 55.3 [52.4, 58.2]
≥ 60 12.3 [10.8, 14.0] 13.1 [11.4, 15.0] 74.6 [72.1, 77.0] The ability to access health care can be influenced by where one lives (i.e., remoteness and the size of a community). The majority of First Nations adults live in rural (45.5%) and urban (38.8%) communities, with significantly fewer living in remote and special access communities (15.6%).
Similarly, most First Nations adults live in either large (46.2%) or medium (46.5%) size communities with a small percentage living in small communities (7.3%).
Figure 2.1: Community remoteness among First Nations adults
Percent Not Receiving Needed Care
One in 10 (9.6%) First Nations adults reported requiring health care in the previous 12 months, but not receiving all the care they needed. More than 1 in 5 (21.3%) First Nations adults reported not having a primary health-care provider, compared to 15.8% among the general population5. Meanwhile, 2.0% of First Nations children who required health care in the previous 12 months did not receive all the care they required.
5 Statistics Canada. (2017). Primary health care providers, 2016. Retrieved from https://www.statcan.gc.ca/pub/82-625-x/2017001/article/54863-eng.htm
Figure 2.2: Proportion of First Nations adults who required health care in the past 12 months
Barriers to Care
Figure 2.3: Barriers to receiving health care among First Nations adults who required health care in the past 12 months
Language
One of the potential barriers to fully understanding preventive measures or receiving appropriate care is language. Although a large proportion of First Nations use English most often in their daily lives, there are those who speak a First Nations language most often.
Consequently, it is important that any method used to communicate information on how to prevent infections and how to care for and isolate infected individuals, take language into account and present the information in a clear, concise, and accessible manner.
Figure 2.3
Barriers % [95% CI] Waiting list is too long 27.0 [25.2, 29.0]
Doctor or nurse not available in my area 22.6 [20.5, 24.7]
Not covered by Non-Insured Health Benefits (NIHB) 21.8 [20.0, 23.8]
Felt health care provided was inadequate 21.2 [19.2, 23.4]
Did not know if it was covered by NIHB 19.7 [17.8, 21.8]
Could not afford direct cost of care/services 19.0 [17.1, 21.1]
Service was not available in my area 18.6 [16.4, 21.1]
Could not afford transportation costs 17.1 [15.3, 19.0]
Prior approval of Non-Insured Health Benefits (NIHB) was denied
16.2 [14.4, 18.2]
Health facility not available in my area 15.3 [13.1, 17.8]
Unable to arrange transportation 15.2 [13.6, 17.1]
Felt service was not culturally appropriate 13.2 [11.5, 15.0]
Difficulty in getting Traditional care 11.8 [10.4, 13.4]
Chose not to see health-care professional 10.3 [8.8, 12.0]
Could not afford child-care costs 6.5 [5.6, 7.5]
Other 3.5 [2.7, 4.5]
Figure 4.3
Who Helps Youth Understand Culture % [95% CI]
Grandparents 72.6 [70.8, 74.4]
Parents 66.0 [63.5, 68.3]
Aunts/Uncles 44.2 [41.7, 46.7]
Other relatives 35.5 [32.9, 38.1]
Friends 16.5 [14.6, 18.7]
Teachers/Daycare providers/Early childhood educators 47.6 [45.2, 50.1]
Community Elders 23.5 [21.4, 25.7]
Other community members 12.5 [11.0, 14.1]
No one 4.0 [3.3, 4.8]
Other 1.4E [0.9, 2.0]
Note: E High sampling variability, interpret with caution.

8 | FNIGC
Although most youth had some knowledge of a First Nations language, a majority (88.9%) still used English most often in their daily lives compared to 6.0% who used a First Nations language most often, 2.7% who
used French most often and 2.1% (95% CI [1.7, 2.6]) who used more than one language mentioned above most often.
Figure 2.4
88.9%
2.7%
6.0% 2.1%
English
French
First Nations Language
More than one of the above
76.5%
2.1%
15.3%
5.4% 0.7%
English
French
First Nations language
More than one of the above
Other
Figure 2.4: Language used by First Nations youth most often in daily life
Most First Nations adults have some knowledge of their First Nations language, although the majority speak English most often in their daily life (76.5%), 15.3% speak a First Nations language most often, 5.4% speak
more than one language mentioned above most often, 2.1% speak French most often, and 0.7% spoke an “other” language most often.
Figure 2.5: Language used by First Nations adults most often, in daily life

RHS Statistics for Shaping a Response to COVID-19 in First Nations Communities | 9
SENIOR POPULATIONS
As part of a soon-to-be-published report on seniors’ wellness, FNIGC examined First Nations adults 55 years and older (this age range was chosen in favour of the more typical 65 years and older due to the early-onset of frailty in First Nations communities6). Approximately 21.6% of First Nations adults living on reserve and Northern communities is a senior, or 55 years and older.
Chronic Conditions
Eighty-four percent of seniors (55 years and older) have at least one long-term or chronic health condition7, with the number of health conditions increasing with age. This is a statistically significant trend and is highlighted in Figure 3.1 below. The mean number of health conditions reported by seniors in the 55- to 59-year-old age group was 2.7, 3.2 chronic health conditions in the 60- to 64-year-old age group, 3.9 for the 65- to 69-year-old age group, and 4.5 for those aged 70 and older. On average, female First Nations seniors reported a higher number of chronic health conditions at 3.7, than male seniors, at 3.3.
Figure 3.1: Average number of health conditions among First Nations seniors, by sex and age group
The five most common self-reported health conditions among Fist Nations seniors were:
6 FNIGC and Walker, J. (n.d.). Aging and Frailty in First Nations Communities. Canadian Journal on Aging / La Revue Canadienne Du Vieillissement, 1-12. DOI: https://doi.org/10.1017/S07149808170003197 The First Nations Regional Health Survey Phase 3 defines “long-term” health conditions to be those which are “expected to or have already last 6 months or more and that have been diagnosed by a healthcare professional.” See RHS Phase 3 questionnaire p. 5-6 for full list of chronic health conditions: https://fnigc.ca/sites/default/files/docs/rhs_adult_phase_3_final_0_0.pdf
• high blood pressure (42.7%), • arthritis (41.9%), • diabetes (35.3%), • high cholesterol (26.5%), • allergies (25.3%).
Heart disease was present among 13.8% of First Nations seniors.
Figure 3.2: Most common chronic health conditions among First Nations seniors (55 years and older), by sex
Note: Respondents could choose more than one response
Although most First Nations seniors report having at least one existing medical condition, 63.2% described their general health as good to excellent. The proportion who reported good or better health was significantly lower among seniors aged 70 years and older (56.6%) compared to those within the 55–59 age group (67.2%).
14.0
10.1
15.6
17.0
18.1
33.5
24.5
34.2
49.2
43.6
10.0
17.8
16.4
21.5
21.1
16.3
28.7
36.5
33.9
41.7
13.0
13.8
16
19.1
19.5
25.3
26.5
35.3
41.9
42.7
0.0 10.0 20.0 30.0 40.0 50.0 60.0
Stomach and intestinal problems
Heart disease
Cataracts
Hearing Impairment
Chronic back pain (excluding arthritis)
Allergies
High Cholesterol
Diabetes
Arthritis (excluding fibromyalgia)
High Blood Pressure
% of First Nation Seniors
Chro
nic
heal
th co
nditi
on
Ovarall
Male
Female
10 | FNIGC
Activity Limitations
PHAC has identified the following individuals at risk for severe illness if infected by coronavirus: • anyone with difficulty reading, speaking,
understanding or communicating; • anyone with difficulty doing preventive activities,
like frequent hand-washing and covering coughs and sneezes;
• anyone with ongoing specialized medical care or needs specific medical supplies, or
• anyone with ongoing supervision needs or requiring support for maintaining independence.
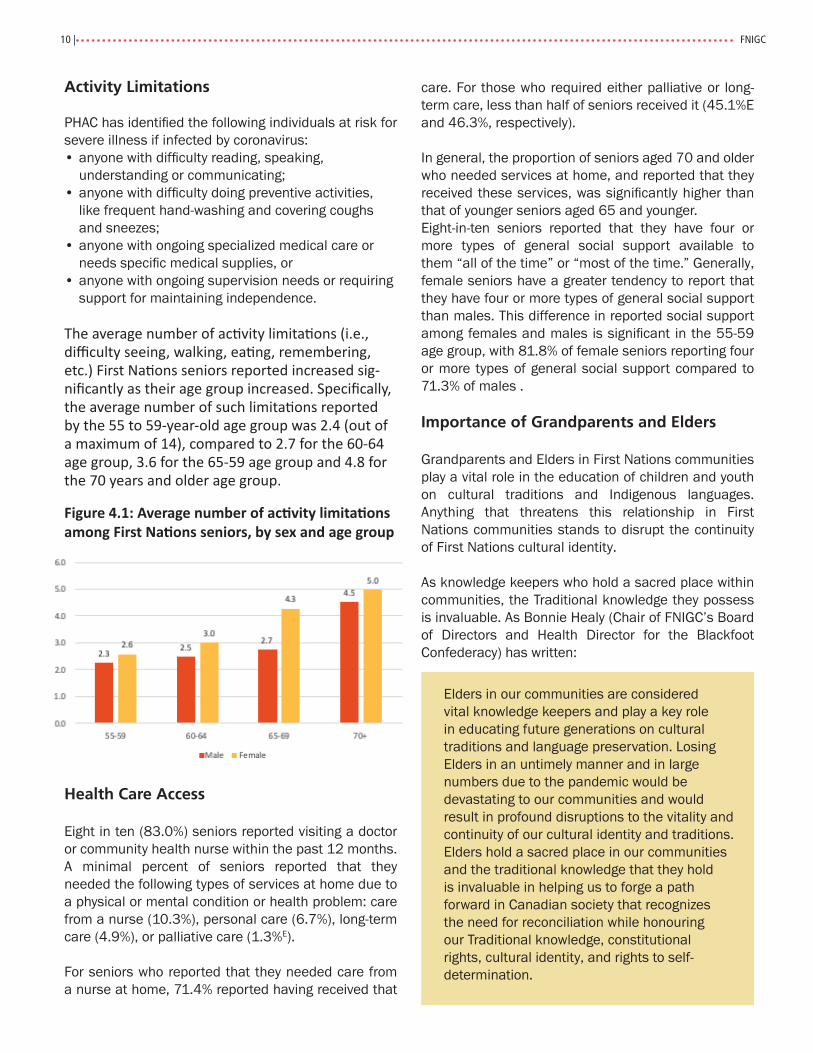
The average number of activity limitations (i.e., difficulty seeing, walking, eating, remembering, etc.) First Nations seniors reported increased sig-nificantly as their age group increased. Specifically, the average number of such limitations reported by the 55 to 59-year-old age group was 2.4 (out of a maximum of 14), compared to 2.7 for the 60-64 age group, 3.6 for the 65-59 age group and 4.8 for the 70 years and older age group.
Figure 4.1: Average number of activity limitations among First Nations seniors, by sex and age group
Health Care Access
Eight in ten (83.0%) seniors reported visiting a doctor or community health nurse within the past 12 months.A minimal percent of seniors reported that they needed the following types of services at home due to a physical or mental condition or health problem: care from a nurse (10.3%), personal care (6.7%), long-term care (4.9%), or palliative care (1.3%E).
For seniors who reported that they needed care from a nurse at home, 71.4% reported having received that
care. For those who required either palliative or long-term care, less than half of seniors received it (45.1%E and 46.3%, respectively).
In general, the proportion of seniors aged 70 and older who needed services at home, and reported that they received these services, was significantly higher than that of younger seniors aged 65 and younger. Eight-in-ten seniors reported that they have four or more types of general social support available to them “all of the time” or “most of the time.” Generally, female seniors have a greater tendency to report that they have four or more types of general social support than males. This difference in reported social support among females and males is significant in the 55-59 age group, with 81.8% of female seniors reporting four or more types of general social support compared to 71.3% of males .
Importance of Grandparents and Elders
Grandparents and Elders in First Nations communities play a vital role in the education of children and youth on cultural traditions and Indigenous languages. Anything that threatens this relationship in First Nations communities stands to disrupt the continuity of First Nations cultural identity.
As knowledge keepers who hold a sacred place within communities, the Traditional knowledge they possess is invaluable. As Bonnie Healy (Chair of FNIGC’s Board of Directors and Health Director for the Blackfoot Confederacy) has written:
Elders in our communities are considered vital knowledge keepers and play a key role in educating future generations on cultural traditions and language preservation. Losing Elders in an untimely manner and in large numbers due to the pandemic would be devastating to our communities and would result in profound disruptions to the vitality and continuity of our cultural identity and traditions. Elders hold a sacred place in our communities and the traditional knowledge that they hold is invaluable in helping us to forge a path forward in Canadian society that recognizes the need for reconciliation while honouring our Traditional knowledge, constitutional rights, cultural identity, and rights to self-determination.

RHS Statistics for Shaping a Response to COVID-19 in First Nations Communities | 11
Almost three quarters (72.6%) of First Nations children (less than 12 years of age) and 63% of youth (12-17 years of age) reported grandparents as helping them understand their culture.
Furthermore children (23.5%) and youth (27.7%) identified community Elders as important individuals
who help them understand their culture. Preventative measures are needed to protect First Nations grandparents and Elders from the coronavirus because such efforts are necessary to preserve the cultural identity of communities and to ensure their cultural continuity.
Figure 2.3
Barriers % [95% CI] Waiting list is too long 27.0 [25.2, 29.0]
Doctor or nurse not available in my area 22.6 [20.5, 24.7]
Not covered by Non-Insured Health Benefits (NIHB) 21.8 [20.0, 23.8]
Felt health care provided was inadequate 21.2 [19.2, 23.4]
Did not know if it was covered by NIHB 19.7 [17.8, 21.8]
Could not afford direct cost of care/services 19.0 [17.1, 21.1]
Service was not available in my area 18.6 [16.4, 21.1]
Could not afford transportation costs 17.1 [15.3, 19.0]
Prior approval of Non-Insured Health Benefits (NIHB) was denied
16.2 [14.4, 18.2]
Health facility not available in my area 15.3 [13.1, 17.8]
Unable to arrange transportation 15.2 [13.6, 17.1]
Felt service was not culturally appropriate 13.2 [11.5, 15.0]
Difficulty in getting Traditional care 11.8 [10.4, 13.4]
Chose not to see health-care professional 10.3 [8.8, 12.0]
Could not afford child-care costs 6.5 [5.6, 7.5]
Other 3.5 [2.7, 4.5]
Figure 4.3
Who Helps Child Understand Culture % [95% CI]
Grandparents 72.6 [70.8, 74.4]
Parents 66.0 [63.5, 68.3]
Aunts/Uncles 44.2 [41.7, 46.7]
Other relatives 35.5 [32.9, 38.1]
Friends 16.5 [14.6, 18.7]
Teachers/Daycare providers/Early childhood educators 47.6 [45.2, 50.1]
Community Elders 23.5 [21.4, 25.7]
Other community members 12.5 [11.0, 14.1]
No one 4.0 [3.3, 4.8]
Other 1.4E [0.9, 2.0]
Note: E High sampling variability, interpret with caution.
Figure 4.2
Who Helps Youth Understand Culture % [95% CI]
Grandparents 63.6 [61.5, 65.8]
Parents 54.4 [51.3, 57.5]
Aunts and uncles 35.7 [33.1, 38.5]
Other relatives 27.9 [24.9, 31.1]
Friends 14.3 [12.5, 16.3]
School teachers 38.1 [35.7, 40.5]
Community Elders 27.7 [25.1, 30.4]
Other community members 12.9 [11.0, 15.0]
No one 3.6 [3.1, 4.2]
Other 1.0E [0.6, 1.7]
Note: E High sampling variability, interpret with caution.
Figure 5.1
RHS Phase 3 (2015-2016)
Child Adult
Remoteness Overall 39.9%
[37.5, 42.3] 24.1% [22.4, 25.8]
Urban 30.2% [25.2, 35.8]
16.2% [13.6, 19.2]
Rural 46.2% [42.7, 49.6]
28.1% [25.9, 30.4]
Remote/ Special access
40.7% [33.7, 48.0]
31.8% [26.1, 38.1]
Figure 4.2: Who helps First Nations children understand their culture
Respondents could choose more than one response
Figure 4.3: Who helps First Nations youth understand their culture
Respondents could choose more than one response

12 | FNIGC
SMOKING AND OBESITY
8 Centre for Disease Control and Prevention, https://www.cdc.gov/coronavirus/2019-ncov/need-extra-precautions/people-at-higher-risk.html (Accessed April 7, 2020)
According to the Centre for Disease Control and Prevention, those at high risk for severe illness due to coronavirus include those who smoke and those with a body mass index (BMI) of >40, i.e. severely obese8.
According to the RHS Phase 3, more than half (53.5%) of First Nations adults and 17.2% of First Nations youth were smoking at the time they were
surveyed. Forty percent (40.3%) of adults and 10.4% of youth were daily smokers.
Nearly one-third of First Nations adults (30.2%) and youth (32.6%) said that someone smoked in their home every day or almost every day.
A small percentage of First Nations adults (6.8%) and youth (2.9%E) are severely obese.

RHS Statistics for Shaping a Response to COVID-19 in First Nations Communities | 13
HOUSING
The preventative actions suggested by medical officials can be difficult to apply in reserve communities, rural contexts, and low-income urban housing. For example, in order to wash one’s hands effectively you require access to clean water. Further, effective self-isolation is not feasible in overcrowded homes. Also, mould which can be found in many First Nations homes can wear down the immune system and lead to allergic or respiratory problems9.
Overcrowding
Nearly one-quarter (24.1%) of First Nations adults in reserve and Northern communities are living in overcrowded households (i.e., more than one person per room). A significantly higher percentage of adults lived in overcrowded households if they lived in rural First Nations communities (28.1%) and remote or special access communities (31.8%), when compared to those living in urban First Nations communities (16.2%).
Figure 5.1: Percentage of First Nations adults and children living in crowded households, by remoteness
9 Canadian Centre for Occupational Health and Safety, https://www.ccohs.ca/oshanswers/biol_hazards/iaq_mold.html10 Statistics Canada, https://www150.statcan.gc.ca/t1/tbl1/en/tv.action?pid=3810001801
Living Arrangements
The proportion of First Nation children and youth living with a single biological parent were similar (39.1% and 33.8%, respectively). Families with a single biological parent taking care of children would face the additional burden of child care concerns in the event that a lone parent contracts the coronavirus infection.
Clean Water
More than one-quarter (27.5%) of First Nations adults reported that their main source of water is not suitable for drinking year-round. Proper hygiene and sanitation become even more critical during an outbreak like the coronavirus.
Household Mould
According to the RHS Phase 3, the proportion of First Nations adults that reported mould or mildew in their homes in the preceding 12 months was 39.7%, which is three times higher than the rate in the general population (13%) as reported in the 2015 Households Survey and Environment Survey (Statistics Canada)10.
First Nations adults residing in rural communities reported a significantly higher prevalence of mould or mildew in their home (41.7%) compared to First Nations urban community residents (35.0%) Although remote or special access communities (45.6%) showed a higher proportion reporting household mould or mildew than either urban or rural communities, these differences were not statistically significant.
Figure 4.2
Who Helps Children Understand Culture % [95% CI]
Grandparents 63.6 [61.5, 65.8]
Parents 54.4 [51.3, 57.5]
Aunts and uncles 35.7 [33.1, 38.5]
Other relatives 27.9 [24.9, 31.1]
Friends 14.3 [12.5, 16.3]
School teachers 38.1 [35.7, 40.5]
Community Elders 27.7 [25.1, 30.4]
Other community members 12.9 [11.0, 15.0]
No one 3.6 [3.1, 4.2]
Other 1.0E [0.6, 1.7]
Note: E High sampling variability, interpret with caution.
Figure 5.1
RHS Phase 3 (2015-2016)
Child Adult
Remoteness Overall 39.9%
[37.5, 42.3] 24.1% [22.4, 25.8]
Urban 30.2% [25.2, 35.8]
16.2% [13.6, 19.2]
Rural 46.2% [42.7, 49.6]
28.1% [25.9, 30.4]
Remote/ Special access
40.7% [33.7, 48.0]
31.8% [26.1, 38.1]

14 | FNIGC
Repairs
More First Nations adults living in remote or special access communities (37.9%) reported living in a home that needed major repairs (e.g. defective plumbing or electrical wiring, structural repairs to walls, floors, ceiling, etc.), compared to those in rural (27.2%) and urban (21.8%) areas. Remote communities are often located far from amenities, such as hardware stores, and renovation costs can be extremely high.
The disparities between urban, rural, and remote or special access communities are very clear when it comes to housing conditions. First Nations adults residing in remote and special access communities were more likely to say that their home needed major repairs and more likely to say that they had mould or mildew in their home, which are linked to lower incomes and overcrowding11.
Overcrowding is a problem in remote and special access communities where isolation makes the cost of construction and repairs prohibitively expensive, especially when the cost of living in these communities is high to begin with.
Figure 5.4: Prevalence of communications devices in homes of First Nations adults, with national comparison
11 World Health Organization. (2009). WHO guidelines for indoor air quality: Dampness and mould. WHO Europe. Retrieved from http://www.euro.who.int/__data/assets/pdf_file/0017/43325/
35.0%
41.7%
45.6%
0.0%
10.0%
20.0%
30.0%
40.0%
50.0%
Urban Rural Remote/Special Access
21.8%
36.6%
41.6%
27.2%
37.8%35.0%
37.9%
28.6%
33.5%
0.0%
5.0%
10.0%
15.0%
20.0%
25.0%
30.0%
35.0%
40.0%
45.0%
Yes, major repairs Yes, minor repairs No, only regular maintenance isrequired (painting, furnace)
Urban Rural Remote/Special Acces
Figure 5.4
Communications devices RHS Phase 1 (2002-2003) [95% CI]
RHS Phase 2 (2008-2010) [95% CI]
RHS Phase 3 (2015-2016) [95% CI]
Canada (2009)*
A computer 40.8% [38.1, 43.5] 60.2% [58.2, 62.2] 61.3% [59.8, 62.9] 81.7%
An internet connection 29.3% [27.0, 31.6] 51.8% [49.6, 54.0] 66.9% [64.9, 68.9]] 77.8%
A telephone with service 81.7% [79.0, 84.4] 82.5% [80.9, 84.1] 72.6% [71.1, 74.2] 89.3%
*Source: Statistics Canada tables, reported in the RHS Phase 2 National Report (FNIGC 2012) Figure 6.1
Gender Age Total RHS Phase 3 [95% CI]
Canada Overall (2016)
Male [95% CI]
Female [95% CI]
18–29 Years [95% CI]
30–59 Years [95% CI]
60+ Years [95% CI]
Labour force participation rate
73.6% [71.4, 75.6]
65.8% [64.2, 67.4]
75.3% [72.8, 77.7]
77.1% [75.1, 78.9]
32.1% [29.6, 34.6]
69.7% [68.2, 71.2]
65.7%
Employment rate 45.0% [42.6, 47.4]
49.2% [47.1, 51.2]
38.2% [35.2, 41.2]
56.3% [54.1, 58.5]
27.4% [24.9, 29.9]
47.1% [45.3, 48.8]
61.1%
Unemployment rate
38.0% [35.0, 41.1]
24.2% [22.1, 26.5]
47.8% [43.5, 52.1]
26.4% [24.3, 28.6]
14.2% [11.7, 17.2]
31.6% [29.5, 33.7]
7.0%
Note: Data for Canada taken from Statistics Canada (2017c).
Figure 5.2: Percentage of First Nations adults reporting that there has been any mould or mildew in their home in the past 12 months, by remoteness
Figure 5.3: Percentage of First Nations adults reporting their dwelling needed repairs, by Remoteness
Internet Access
First Nations adults in rural communities reported lower levels of internet access (61.2%) compared with adults in urban (69.8%) and remote or special access communities (76.7%). Internet access has become
essential for receiving updates and current information on the pandemic. During this time of physical distancing, internet access is also vital for those working at home, for networking and social support.
RHS Statistics for Shaping a Response to COVID-19 in First Nations Communities | 15
POVERTY
Early accounts of First Nations poverty is described as a state of inequality and not having adequate access to the basic necessities of life. In a soon-to-be-published FNIGC report, the effect of colonization and the deficiency of holistic wellness was acknowledged as a more appropriate descriptor for First Nations poverty.
For those living with a low-income, purchasing emergency and essential items can be challenging, and more so if only credit or debit is accepted. Furthermore, poverty makes it difficult to maintain proper nutrition so as to prevent and fight infection.
79.9%
3.0%
14.3%
2.7%
In own First Nation community In another First Nation community
In a non-First Nation community Other
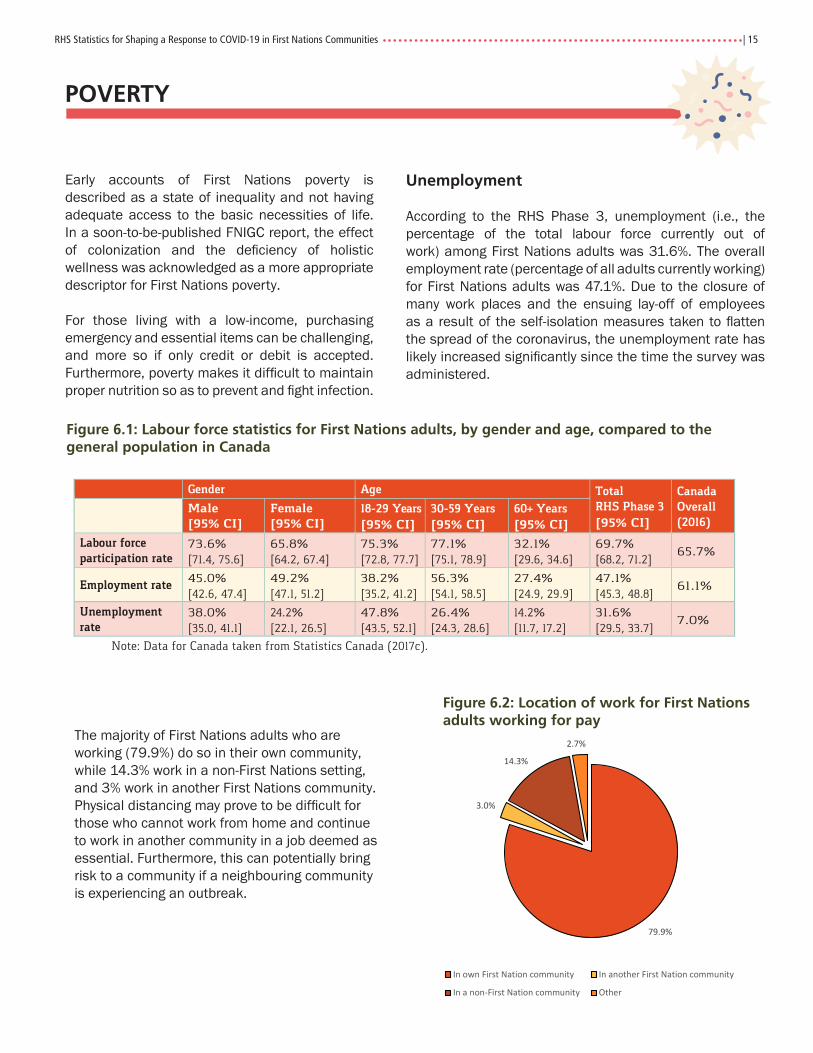
Figure 6.2: Location of work for First Nations adults working for pay
Figure 6.1: Labour force statistics for First Nations adults, by gender and age, compared to the general population in Canada
Figure 5.4
Communications devices RHS Phase 1 (2002-2003) [95% CI]
RHS Phase 2 (2008-2010) [95% CI]
RHS Phase 3 (2015-2016) [95% CI]
Canada (2009)*
A computer 40.8% [38.1, 43.5] 60.2% [58.2, 62.2] 61.3% [59.8, 62.9] 81.7%
An internet connection 29.3% [27.0, 31.6] 51.8% [49.6, 54.0] 66.9% [64.9, 68.9]] 77.8%
A telephone with service 81.7% [79.0, 84.4] 82.5% [80.9, 84.1] 72.6% [71.1, 74.2] 89.3%
*Source: Statistics Canada tables, reported in the RHS Phase 2 National Report (FNIGC 2012) Figure 6.1
Gender Age Total RHS Phase 3 [95% CI]
Canada Overall (2016)
Male [95% CI]
Female [95% CI]
18–29 Years [95% CI]
30–59 Years [95% CI]
60+ Years [95% CI]
Labour force participation rate
73.6% [71.4, 75.6]
65.8% [64.2, 67.4]
75.3% [72.8, 77.7]
77.1% [75.1, 78.9]
32.1% [29.6, 34.6]
69.7% [68.2, 71.2]
65.7%
Employment rate 45.0% [42.6, 47.4]
49.2% [47.1, 51.2]
38.2% [35.2, 41.2]
56.3% [54.1, 58.5]
27.4% [24.9, 29.9]
47.1% [45.3, 48.8]
61.1%
Unemployment rate
38.0% [35.0, 41.1]
24.2% [22.1, 26.5]
47.8% [43.5, 52.1]
26.4% [24.3, 28.6]
14.2% [11.7, 17.2]
31.6% [29.5, 33.7]
7.0%
Note: Data for Canada taken from Statistics Canada (2017c).
Unemployment
According to the RHS Phase 3, unemployment (i.e., the percentage of the total labour force currently out of work) among First Nations adults was 31.6%. The overall employment rate (percentage of all adults currently working) for First Nations adults was 47.1%. Due to the closure of many work places and the ensuing lay-off of employees as a result of the self-isolation measures taken to flatten the spread of the coronavirus, the unemployment rate has likely increased significantly since the time the survey was administered.
The majority of First Nations adults who are working (79.9%) do so in their own community, while 14.3% work in a non-First Nations setting, and 3% work in another First Nations community. Physical distancing may prove to be difficult for those who cannot work from home and continue to work in another community in a job deemed as essential. Furthermore, this can potentially bring risk to a community if a neighbouring community is experiencing an outbreak.

16 | FNIGC
Basic Living Requirements
In terms of basic living requirements, First Nations adults most commonly struggled with food-related expenses with 32.0% reporting that they struggle to meet this basic need. Again, this estimate will likely increase with the economic challenges that Canada is currently experiencing due to the coronavirus pandemic.
Transportation and utilities (heat and electricity) were the next two basic living requirements that First Nations adults were most likely to struggle with, with 26.5% and 25.3% reporting that they had struggled, at some point, to meet these basic living requirements.
Figure 6.3: Percentage of First Nations adults who reported ever struggling to meet basic living requirements
Food Security
Nearly 1 in 10 (11.3%) First Nations adults reported often struggling (i.e., having to borrow money) once a month or more to meet the basic living requirements for food in the 12 months prior to the survey. More than one-fifth (22.9%) of First Nations adults who reported struggling to meet basic living requirements for food once a month or more during the 12 months prior to the survey reported rarely or never eating nutritious, balanced meals.
Nearly one-fifth of adults (19.7%) reported cutting the size of their meals or skipping meals because there was not enough money for food. Among this group, 37.6% reported having done so almost every month in the 12 months prior to the survey.
Nearly half (49.2%) of all First Nations adults (47.3% for females and 52.7% for males) were classified as food secure, nearly two fifths were moderately food insecure (37.7%), and 13.1% were considered
severely food insecure. Among adults with children in the household, more than half (56.8%) were classified as food secure.
Figure 6.4: Food security status among First Nations adults
Food Secure, 49.2%
Moderately Food Insecure, 37.7%
Severely Food Insecure, 13.1%
Figure 6.5: Food security status of First Nations adults, by remoteness
One-third (34.7%) of households in special-access communities and more than half (58.3%) of those in remote communities were food secure. The difference between these two groups is statistically significant. Less than three-fifths of adults in urban communities (56.3%) were food secure, which is a significantly greater proportion than those living in rural (46.9%) locations.
Significantly First Nations adults were more likely to be food secure if the did not live in crowded housing (53.5%) compared to those who lived in overcrowded housing (i.e., more than one person per room) (36.2%).
9.3%
11.4%
20.5%
25.3%
26.5%
32.0%
0.0% 10.0% 20.0% 30.0% 40.0%
Childcare
Shelter
Clothing
Utilities (Heat, Electricity)
Transportation
Food
56.3%
46.9%
58.3%
34.7%32.4%
40.4%
32.4%
45.2%
11.3% 12.7%9.3%
20.1%
0.0%
10.0%
20.0%
30.0%
40.0%
50.0%
60.0%
70.0%
Urban Rural Remote Special Access
Food Secure Moderately Food Insecure Severely Food Insecure

RHS Statistics for Shaping a Response to COVID-19 in First Nations Communities | 17
Sharing Traditional Food
The sharing of traditional food becomes more difficult with physical distancing measures and can potentially increase risk without proper handling measures. Having said that, PHAC has stated that there is currently no evidence to suggest that food is a likely source or route of transmission of the virus and there are currently no reported cases of COVID-19 transmission through food12.
A significantly higher percentage of First Nations adults living in remote communities (76.5%) or special access
12 Public Health Agency of Canada, https://www.canada.ca/en/public-health/services/diseases/2019-novel-coronavirus-infection/prevention-risks.html (Accessed April 7, 2020)
communities (75.0%) reported often eating traditional foods compared to those living in rural (65.3%) or urban (63.4%) communities. The majority (90%) had received traditional food from someone in the 12 months prior to the survey.
More than half (59.1%) of First Nations adults who had traditional food shared with their household often reported that they always/almost always ate nutritious, balanced meals. It was further found that eating nutritious balanced meals improved with age.
34.7%39.2% 39.7%
45.4%
53.0%50.4%
48.5% 47.9%44.4%
40.3%
15.0%12.4% 12.4%
10.1%6.7%
0.0%
10.0%
20.0%
30.0%
40.0%
50.0%
60.0%
18-29 30-39 40-49 50-59 60+
Always/Almost Always Sometimes Rarely/Never
Often 26.9%
Sometimes44.0%
Rarely 19.1%
Never10.0%
Figure 6.6: Percentage of First Nations adults who had traditional food shared with their household in the past 12 months
Figure 6.7: Percentage of First Nations adults reporting eating nutritious, balanced meals, by age

18 | FNIGC
CONCLUSION
In reviewing the various indicators from the First Nations Regional Health Survey Phase 3, it can be concluded that First Nations people living in reserve and Northern communities are especially vulnerable to severe illness if an outbreak of coronavirus were to occur. It is important that Elders and seniors are protected as they are the knowledge keepers of Traditional knowledge and are vital for instituting the path towards Reconciliation.
In addition to preventing infection among seniors and individuals with chronic conditions, any strategy for preparing a response to coronavirus in First Nations communities will need to address barriers for being tested or receiving medical care (i.e., availability of health
professionals, testing and personal protective equipment, medications, ventilators, medical transportation, interpreters), housing (i.e., overcrowding, childcare for single parent households in which a parent falls ill, isolation tents and temporary shelters, access to clean water, mould in homes, and internet access to current information), and poverty (i.e., money to pay for bills, food, or essential items).
By preventing the coronavirus from entering First Nations communities in the first place but also preparing in advance if it does, First Nations will be less vulnerable and in a better position to confront an outbreak in their communities.


Font: Stone Sans SemiBold
CMYK: 20C, 100M, 100Y, 25K
CMYK: 90K
CMYK: 0M, 20M, 100Y, 5K
CGIPNFNIGC
RGB: 9E1A1D
RGB: 414042
RGB: F3C108
PMS: 187 C
PMS: Black 7 C
PMS: 7406 C