rhode island early warning system guide the rhode island early warning system the rhode island...
TRANSCRIPT
Rhode Island Early Warning System Guide
Rhode Island Department of Education
September 2013
2
Rhode Island Early Warning System Guide The Rhode Island Early Warning System ...................................................................................................... 4
Access to Student Records ........................................................................................................................ 5
EWS and Student Grade Levels ..................................................................................................................... 5
The Indicators ............................................................................................................................................... 6
Aggregate On-Track Percentage Indicator ................................................................................................ 7
Attendance Percentage ............................................................................................................................ 9
Number of Suspensions .......................................................................................................................... 10
Years Over-age ........................................................................................................................................ 11
NECAP Reading and Mathematics Scores ............................................................................................... 12
Guidance in Reviewing Number of Failures ............................................................................................ 13
Benchmarks ................................................................................................................................................. 14
Using the EWS to Help Students ................................................................................................................. 17
Sample Student Profile ............................................................................................................................... 19
Frequently Asked Questions ....................................................................................................................... 22
3
Part I:
The Early Warning System Tool
4
The Rhode Island Early Warning System The Rhode Island Department of Education (RIDE) Early Warning System tool includes a set of indicators
that enables educators and school teams to identify and intervene with students at risk of not
graduating high school on time. The Early Warning System (EWS) screens all students from 6th through
12th grade using six data points to help educators meet the global needs of their school and ensure that
all students are successful in graduating high school ready for college, career and life. For each student
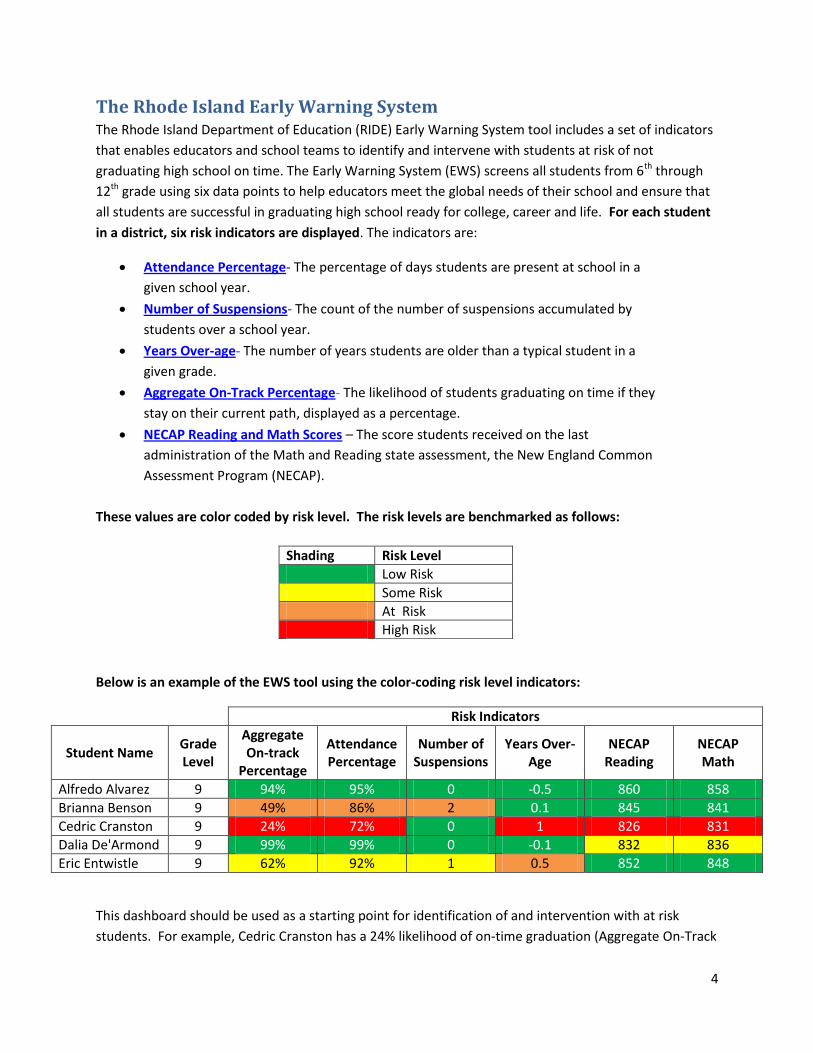
in a district, six risk indicators are displayed. The indicators are:
Attendance Percentage- The percentage of days students are present at school in a
given school year.
Number of Suspensions- The count of the number of suspensions accumulated by
students over a school year.
Years Over-age- The number of years students are older than a typical student in a
given grade.
Aggregate On-Track Percentage- The likelihood of students graduating on time if they
stay on their current path, displayed as a percentage.
NECAP Reading and Math Scores – The score students received on the last
administration of the Math and Reading state assessment, the New England Common
Assessment Program (NECAP).
These values are color coded by risk level. The risk levels are benchmarked as follows:
Below is an example of the EWS tool using the color-coding risk level indicators:
Risk Indicators
Student Name Grade Level
Aggregate On-track
Percentage
Attendance Percentage
Number of Suspensions
Years Over-Age
NECAP Reading
NECAP Math
Alfredo Alvarez 9 94% 95% 0 -0.5 860 858
Brianna Benson 9 49% 86% 2 0.1 845 841
Cedric Cranston 9 24% 72% 0 1 826 831
Dalia De'Armond 9 99% 99% 0 -0.1 832 836
Eric Entwistle 9 62% 92% 1 0.5 852 848
This dashboard should be used as a starting point for identification of and intervention with at risk
students. For example, Cedric Cranston has a 24% likelihood of on-time graduation (Aggregate On-Track
Shading Risk Level
Low Risk
Some Risk
At Risk
High Risk
5
Percentage). During the academic year, he was not suspended but he has not attended school as he
should. He is also over-age for his grade which is a further risk indicator of not graduating on time. For
more information on how each indicator is calculated, please see “The Indicators” section, beginning on
page 6.
Access to Student Records Every student in grades 6-12 in the state of Rhode Island is available to the appropriate educators and
school leaders in the EWS tool.
District personnel have access to the profiles of all students within their district.
School administrators and teachers will only access the profiles of those students in their
school building and classes, respectively.
Student data is provided through eRIDE which extracts, transfers, and loads data directly from districts
on a daily basis. Therefore, the quality of the student data is only as good and as recent as the district’s
latest provision.
There are two points of access to the Rhode Island EWS indicators. The RIDE Early Warning
System can be accessed through RIDEmap.
Log into EWS via the RIDEmap Portal
1. https://ridemap.ride.ri.gov
2. Refer to instructions from RIDE 3. Once logged into the portal, click on ‘EWS’ on the right hand side. For some districts in Rhode Island, the EWS indicators will be available through their student information system. At the time of release of this guide, no districts have an EWS module fully built within their student information system.
EWS and Student Grade Levels While the Early Warning System screens all students from 6th through 12th grade, it is most accurate in
its predictions during a student’s 9th, 10th, and 11th grade years. The data model and individual
indicators used I the EWS tool were determined using seven years of Rhode Island historical data. The
data model used for the RIDE EWS is intended to identify as many students off track to graduating on
time with their cohort as possible, based on the most current information we have on those students.
For more information on the Rhode Island EWS data model, see the Early Warning System Statistical
Modeling Report.

6
The Indicators Within the RI Early Warning System tool, there are five indicators of on-time graduation for each student
in grades 6-12. Using historical state data, these indicators have been found to be the most predictive of
high school non-(on-time) graduation. They are:
1. Aggregate On-Track Percentage Indicator
2. Attendance Percentage
3. Number of Suspensions
4. Years Over-Age
5. NECAP Reading & Math Scores
National research and best practices around early warning systems tells us that course failure is an
important predictor of student on-time graduation. The RIDE data collection to inform the EWS does
not include course failures and is, therefore, not included in the EWS tool. Schools accessing and using
the RIDE EWS tool should also be observing student’s course grades in order to get more complete data
on student risk.
7
Aggregate On-Track Percentage Indicator How is it calculated?
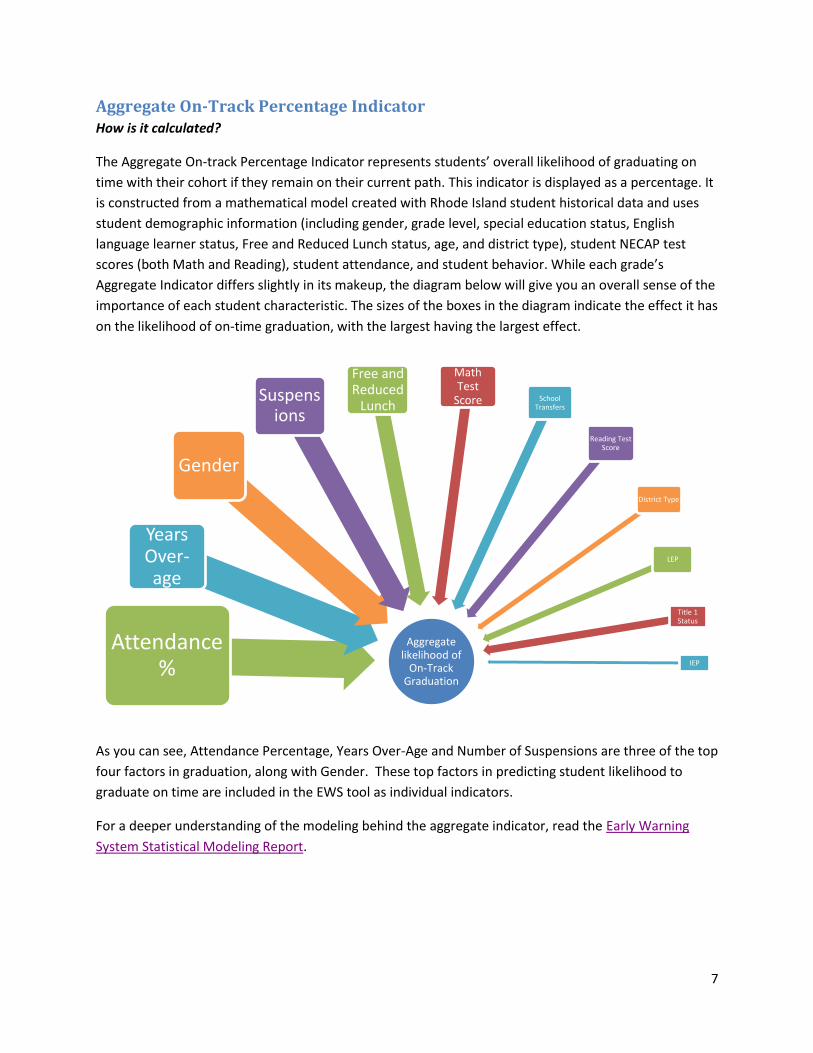
The Aggregate On-track Percentage Indicator represents students’ overall likelihood of graduating on
time with their cohort if they remain on their current path. This indicator is displayed as a percentage. It
is constructed from a mathematical model created with Rhode Island student historical data and uses
student demographic information (including gender, grade level, special education status, English
language learner status, Free and Reduced Lunch status, age, and district type), student NECAP test
scores (both Math and Reading), student attendance, and student behavior. While each grade’s
Aggregate Indicator differs slightly in its makeup, the diagram below will give you an overall sense of the
importance of each student characteristic. The sizes of the boxes in the diagram indicate the effect it has
on the likelihood of on-time graduation, with the largest having the largest effect.
As you can see, Attendance Percentage, Years Over-Age and Number of Suspensions are three of the top
four factors in graduation, along with Gender. These top factors in predicting student likelihood to
graduate on time are included in the EWS tool as individual indicators.
For a deeper understanding of the modeling behind the aggregate indicator, read the Early Warning
System Statistical Modeling Report.
Aggregate likelihood of
On-Track Graduation
Attendance %
Years Over-age
Gender
Suspensions
Free and Reduced
Lunch
Math Test
Score School Transfers
Reading Test Score
District Type
LEP
Title 1 Status
IEP
8
Why is it included in the EWS?
As you might expect, the Aggregate On-Track Percentage is the most predictive of any of the indicators.
Depending on the grade level and benchmarks, it correctly predicts the future graduation status of
students 81% to 90% of the time.
The aggregate indicator should be used as the first line of screening, to identify students or groups of
students at different levels of overall risk. Once patterns/ trends are identified using the aggregate risk
indicator, a pattern of need should be identified and validated with other supporting data.
Limitations of the Aggregate Indicator
All student data used in the Aggregate indicator is extracted from existing RIDE data collections. At
present, RIDE does not collect individual student grades and student course grades are, therefore not
included in the EWS tool. For some students, their aggregate indicator represents a low risk level, but
they may be failing multiple courses. It is important to emphasize that the aggregate indicator should
be used in concert with the other indicators – especially the number of failures and course grades.
9
Attendance Percentage How is it calculated?
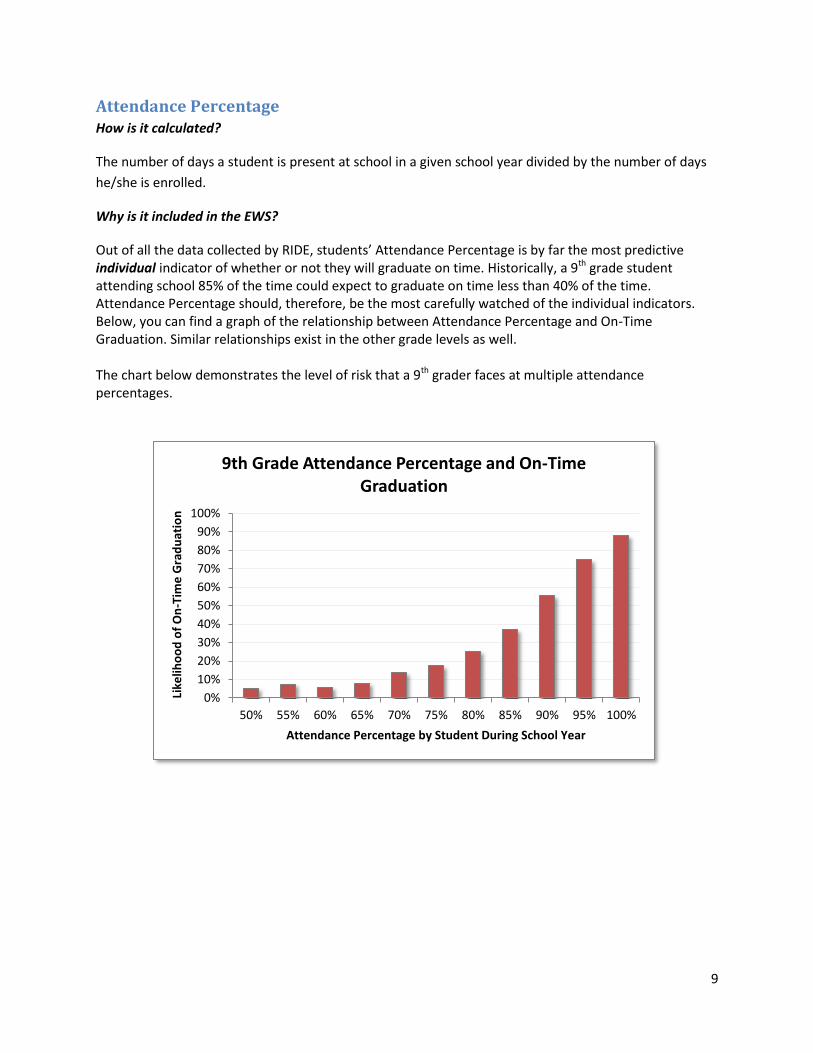
The number of days a student is present at school in a given school year divided by the number of days
he/she is enrolled.
Why is it included in the EWS?
Out of all the data collected by RIDE, students’ Attendance Percentage is by far the most predictive individual indicator of whether or not they will graduate on time. Historically, a 9th grade student attending school 85% of the time could expect to graduate on time less than 40% of the time. Attendance Percentage should, therefore, be the most carefully watched of the individual indicators. Below, you can find a graph of the relationship between Attendance Percentage and On-Time Graduation. Similar relationships exist in the other grade levels as well. The chart below demonstrates the level of risk that a 9th grader faces at multiple attendance percentages.
0%
10%
20%
30%
40%
50%
60%
70%
80%
90%
100%
50% 55% 60% 65% 70% 75% 80% 85% 90% 95% 100%
Like
liho
od
of
On
-Tim
e G
rad
uat
ion
Attendance Percentage by Student During School Year
9th Grade Attendance Percentage and On-Time Graduation
10
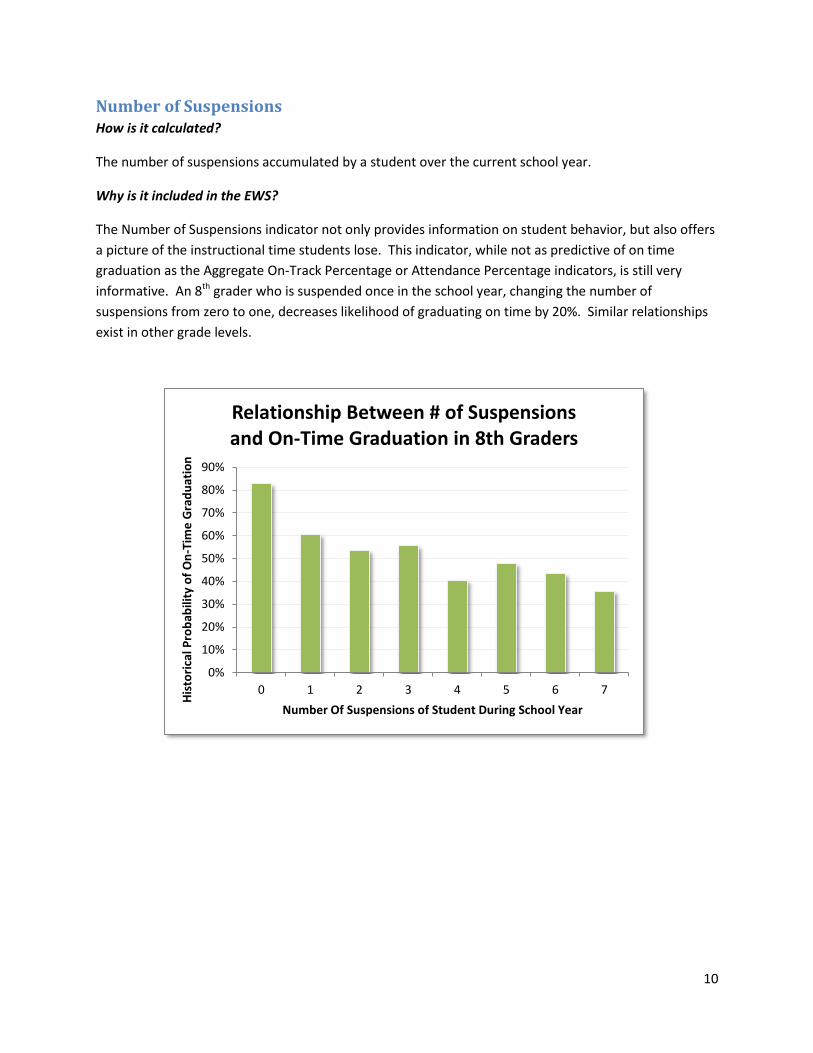
Number of Suspensions How is it calculated?
The number of suspensions accumulated by a student over the current school year.
Why is it included in the EWS?
The Number of Suspensions indicator not only provides information on student behavior, but also offers
a picture of the instructional time students lose. This indicator, while not as predictive of on time
graduation as the Aggregate On-Track Percentage or Attendance Percentage indicators, is still very
informative. An 8th grader who is suspended once in the school year, changing the number of
suspensions from zero to one, decreases likelihood of graduating on time by 20%. Similar relationships
exist in other grade levels.
0%
10%
20%
30%
40%
50%
60%
70%
80%
90%
0 1 2 3 4 5 6 7
His
tori
cal P
rob
abili
ty o
f O
n-T
ime
Gra
du
atio
n
Number Of Suspensions of Student During School Year
Relationship Between # of Suspensions and On-Time Graduation in 8th Graders
11
Years Over-age How is it calculated?
Years Over-Age is calculated by subtracting students’ grade level plus six from their age at the end of the
school year:
Years Over-Age = Age in Years at the end of the school year – (Grade Level + 6)
Therefore, if a student is exactly 14 at the end of 7th grade, his ‘Years Over-Age’ indicator would be as
follows:
Age – (Grade Level + 6) = Years Over-Age
14 – (7 + 6) = 1
The student is 1 year over-age. The typical student exiting 7th grade is 13 years old. This gives us a sense
of how old a student is, as relative to a typical student (a typical student has a ‘Years Over-Age’ value of
right around zero, plus or minus a few tenths of a year).
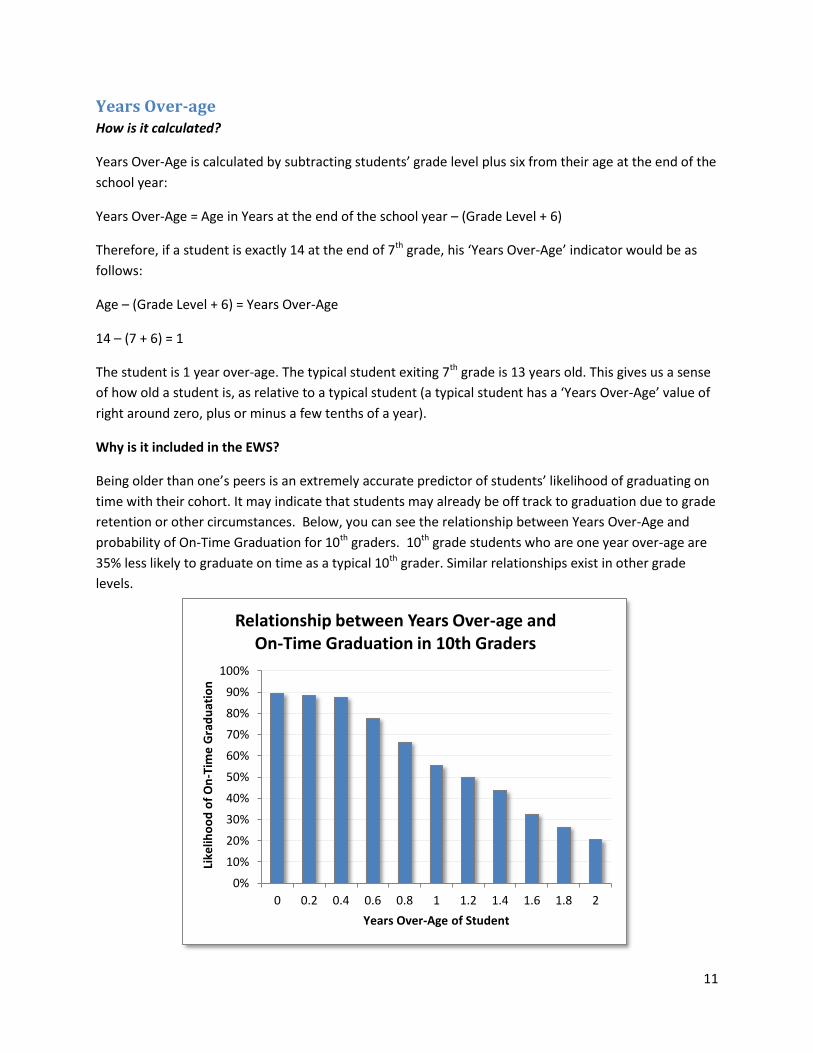
Why is it included in the EWS?
Being older than one’s peers is an extremely accurate predictor of students’ likelihood of graduating on
time with their cohort. It may indicate that students may already be off track to graduation due to grade
retention or other circumstances. Below, you can see the relationship between Years Over-Age and
probability of On-Time Graduation for 10th graders. 10th grade students who are one year over-age are
35% less likely to graduate on time as a typical 10th grader. Similar relationships exist in other grade
levels.
0%
10%
20%
30%
40%
50%
60%
70%
80%
90%
100%
0 0.2 0.4 0.6 0.8 1 1.2 1.4 1.6 1.8 2
Like
liho
od
of
On
-Tim
e G
rad
uat
ion
Years Over-Age of Student
Relationship between Years Over-age and On-Time Graduation in 10th Graders
12
NECAP Reading and Mathematics Scores How is it calculated?
NECAP Reading and Math scores are the scaled score a student received in the most recent testing year.
The cut-points determining the risk level color coding of student indicators are based on the NECAP
achievement levels [Proficient with Distinction, Proficient, Partially Proficient, and Substantially Below
Proficient]. The scaled score that determines each achievement level varies slightly year to year.
Why is it included in the EWS?
Multiple studies throughout the U.S., as well as investigations in state assessment data collected by
RIDE, have confirmed that student achievement on state standardized assessments are extremely
predictive of his or her future on-time graduation. It is one indicator of student content mastery.
13
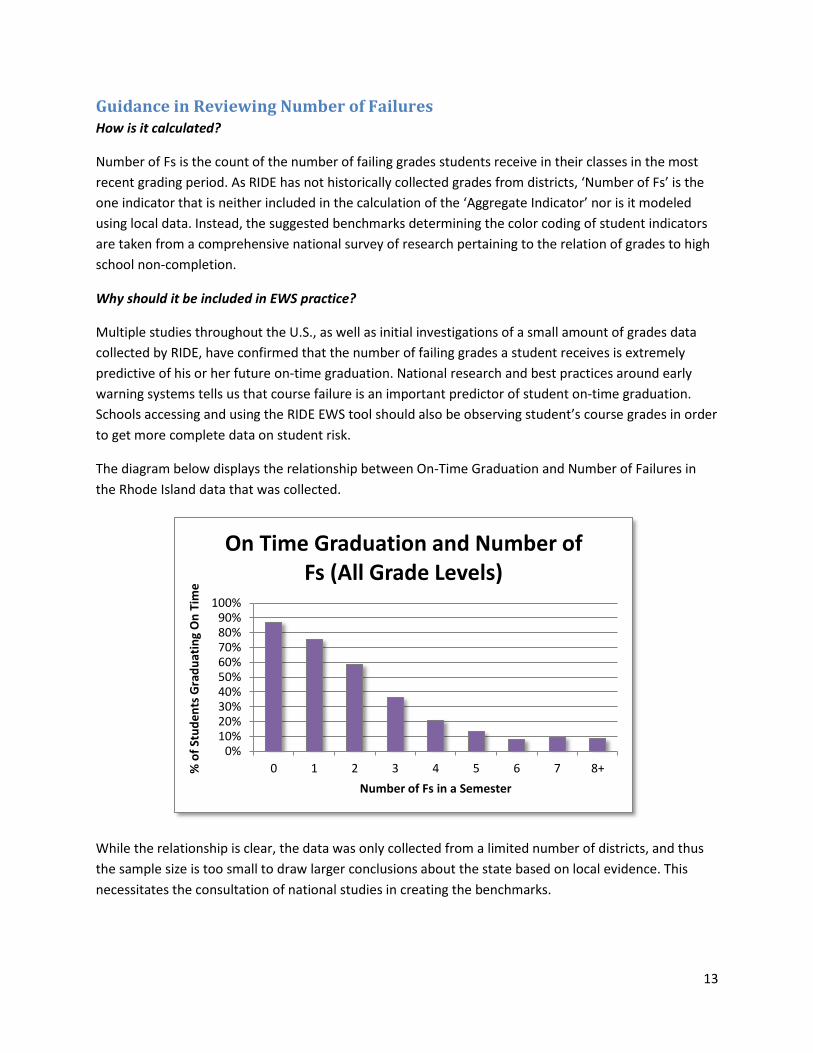
Guidance in Reviewing Number of Failures How is it calculated?
Number of Fs is the count of the number of failing grades students receive in their classes in the most
recent grading period. As RIDE has not historically collected grades from districts, ‘Number of Fs’ is the
one indicator that is neither included in the calculation of the ‘Aggregate Indicator’ nor is it modeled
using local data. Instead, the suggested benchmarks determining the color coding of student indicators
are taken from a comprehensive national survey of research pertaining to the relation of grades to high
school non-completion.
Why should it be included in EWS practice?
Multiple studies throughout the U.S., as well as initial investigations of a small amount of grades data
collected by RIDE, have confirmed that the number of failing grades a student receives is extremely
predictive of his or her future on-time graduation. National research and best practices around early
warning systems tells us that course failure is an important predictor of student on-time graduation.
Schools accessing and using the RIDE EWS tool should also be observing student’s course grades in order
to get more complete data on student risk.
The diagram below displays the relationship between On-Time Graduation and Number of Failures in
the Rhode Island data that was collected.
While the relationship is clear, the data was only collected from a limited number of districts, and thus
the sample size is too small to draw larger conclusions about the state based on local evidence. This
necessitates the consultation of national studies in creating the benchmarks.
0%10%20%30%40%50%60%70%80%90%
100%
0 1 2 3 4 5 6 7 8+% o
f St
ud
en
ts G
rad
uat
ing
On
Tim
e
Number of Fs in a Semester
On Time Graduation and Number of Fs (All Grade Levels)
14
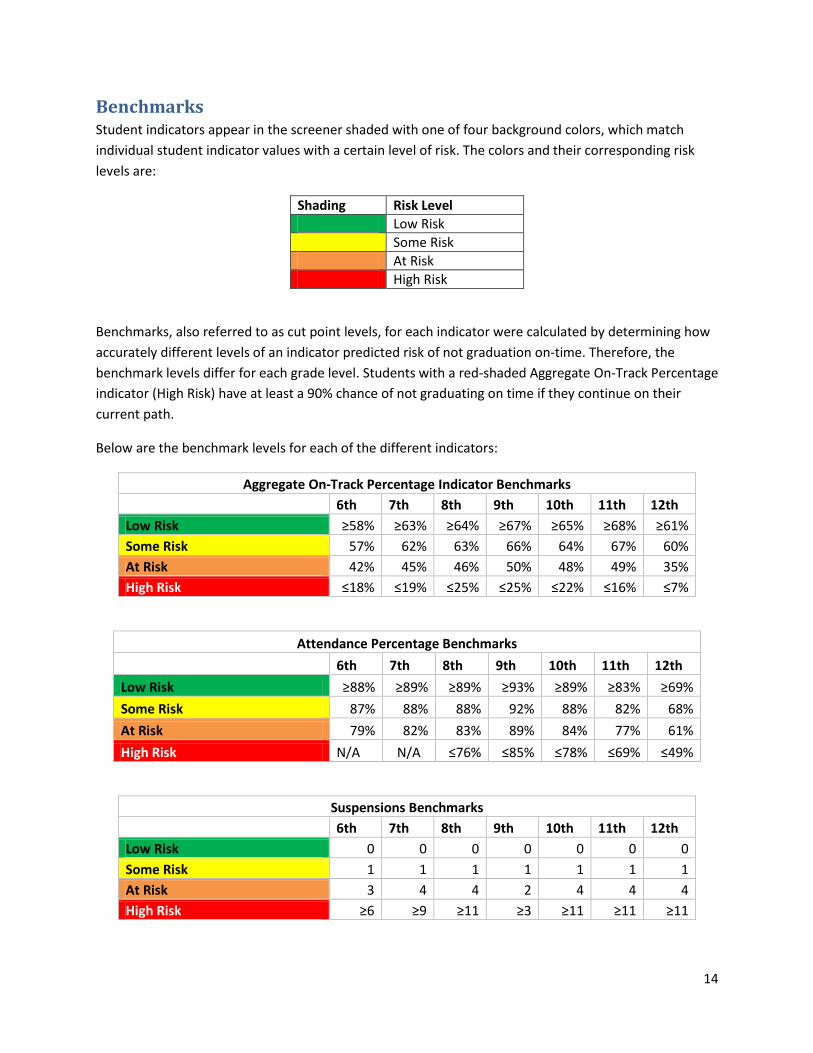
Benchmarks Student indicators appear in the screener shaded with one of four background colors, which match
individual student indicator values with a certain level of risk. The colors and their corresponding risk
levels are:
Shading Risk Level
Low Risk
Some Risk
At Risk
High Risk
Benchmarks, also referred to as cut point levels, for each indicator were calculated by determining how
accurately different levels of an indicator predicted risk of not graduation on-time. Therefore, the
benchmark levels differ for each grade level. Students with a red-shaded Aggregate On-Track Percentage
indicator (High Risk) have at least a 90% chance of not graduating on time if they continue on their
current path.
Below are the benchmark levels for each of the different indicators:
Aggregate On-Track Percentage Indicator Benchmarks
6th 7th 8th 9th 10th 11th 12th
Low Risk ≥58% ≥63% ≥64% ≥67% ≥65% ≥68% ≥61%
Some Risk 57% 62% 63% 66% 64% 67% 60%
At Risk 42% 45% 46% 50% 48% 49% 35%
High Risk ≤18% ≤19% ≤25% ≤25% ≤22% ≤16% ≤7%
Attendance Percentage Benchmarks
6th 7th 8th 9th 10th 11th 12th
Low Risk ≥88% ≥89% ≥89% ≥93% ≥89% ≥83% ≥69%
Some Risk 87% 88% 88% 92% 88% 82% 68%
At Risk 79% 82% 83% 89% 84% 77% 61%
High Risk N/A N/A ≤76% ≤85% ≤78% ≤69% ≤49%
Suspensions Benchmarks
6th 7th 8th 9th 10th 11th 12th
Low Risk 0 0 0 0 0 0 0
Some Risk 1 1 1 1 1 1 1
At Risk 3 4 4 2 4 4 4
High Risk ≥6 ≥9 ≥11 ≥3 ≥11 ≥11 ≥11
15
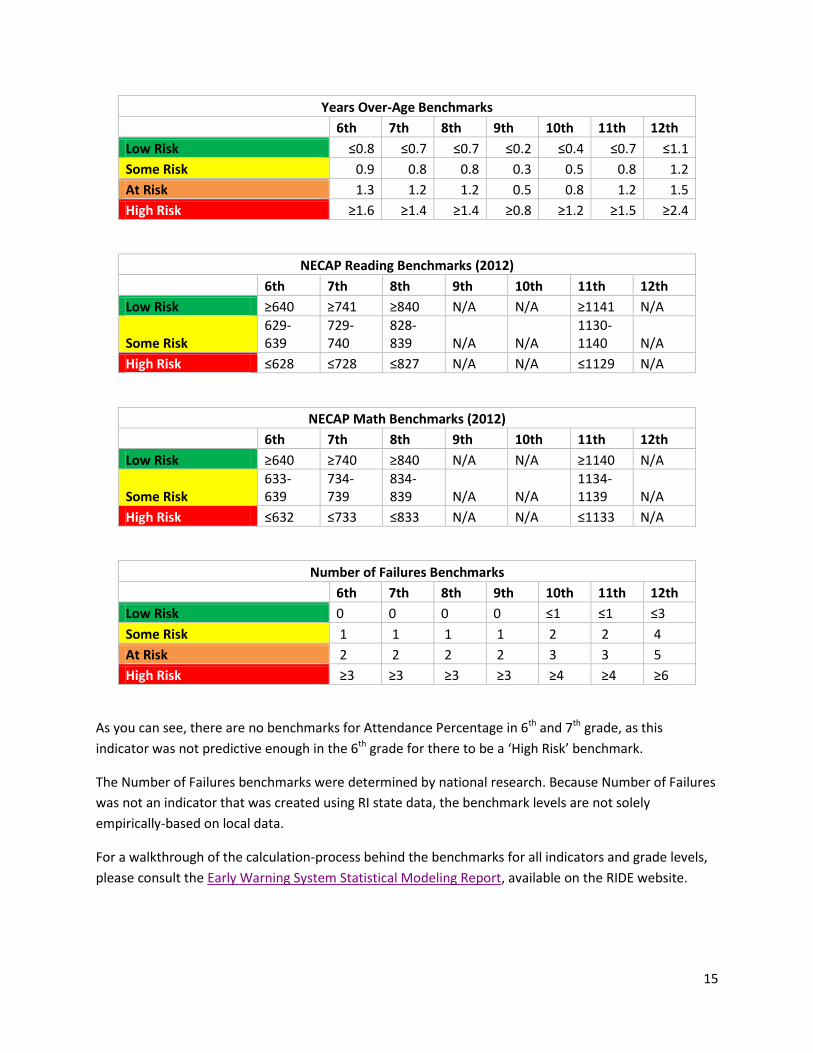
Years Over-Age Benchmarks
6th 7th 8th 9th 10th 11th 12th
Low Risk ≤0.8 ≤0.7 ≤0.7 ≤0.2 ≤0.4 ≤0.7 ≤1.1
Some Risk 0.9 0.8 0.8 0.3 0.5 0.8 1.2
At Risk 1.3 1.2 1.2 0.5 0.8 1.2 1.5
High Risk ≥1.6 ≥1.4 ≥1.4 ≥0.8 ≥1.2 ≥1.5 ≥2.4
NECAP Reading Benchmarks (2012)
6th 7th 8th 9th 10th 11th 12th
Low Risk ≥640 ≥741 ≥840 N/A N/A ≥1141 N/A
Some Risk 629-639
729-740
828-839 N/A N/A
1130-1140 N/A
High Risk ≤628 ≤728 ≤827 N/A N/A ≤1129 N/A
NECAP Math Benchmarks (2012)
6th 7th 8th 9th 10th 11th 12th
Low Risk ≥640 ≥740 ≥840 N/A N/A ≥1140 N/A
Some Risk 633-639
734-739
834-839 N/A N/A
1134-1139 N/A
High Risk ≤632 ≤733 ≤833 N/A N/A ≤1133 N/A
Number of Failures Benchmarks
6th 7th 8th 9th 10th 11th 12th
Low Risk 0 0 0 0 ≤1 ≤1 ≤3
Some Risk 1 1 1 1 2 2 4
At Risk 2 2 2 2 3 3 5
High Risk ≥3 ≥3 ≥3 ≥3 ≥4 ≥4 ≥6
As you can see, there are no benchmarks for Attendance Percentage in 6th and 7th grade, as this
indicator was not predictive enough in the 6th grade for there to be a ‘High Risk’ benchmark.
The Number of Failures benchmarks were determined by national research. Because Number of Failures
was not an indicator that was created using RI state data, the benchmark levels are not solely
empirically-based on local data.
For a walkthrough of the calculation-process behind the benchmarks for all indicators and grade levels,
please consult the Early Warning System Statistical Modeling Report, available on the RIDE website.

16
Part II:
Implementing Processes and Procedures to
Support Student Success
17
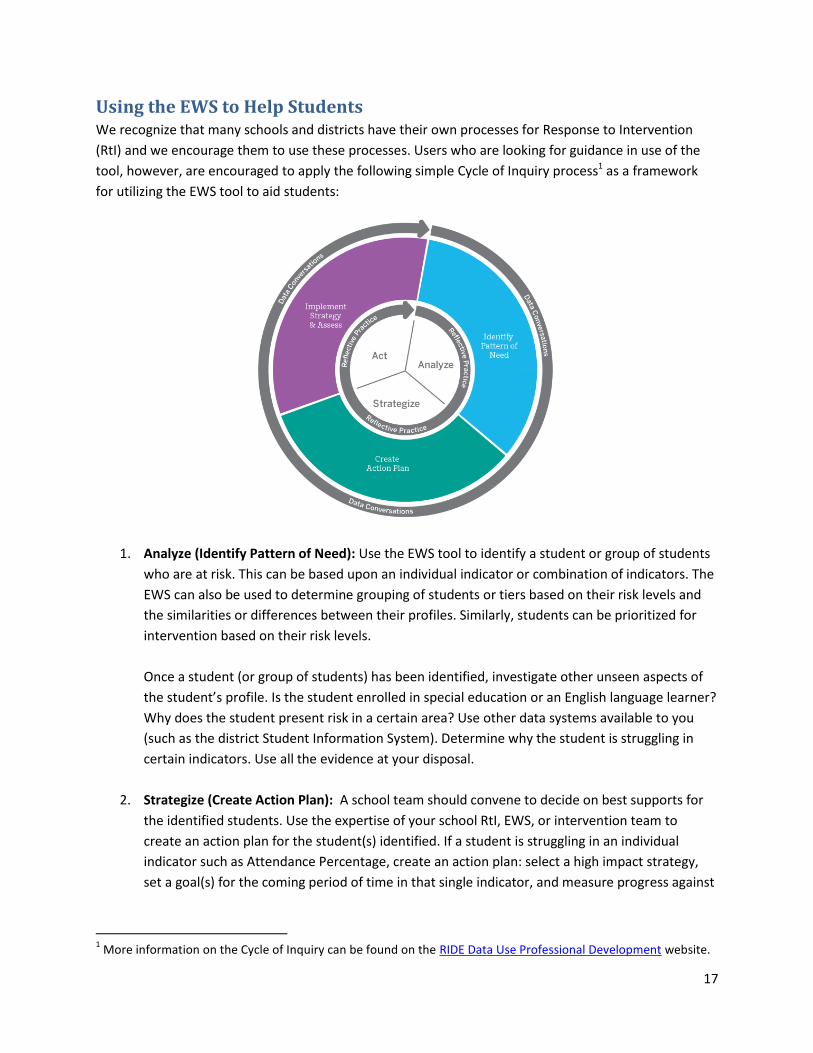
Using the EWS to Help Students We recognize that many schools and districts have their own processes for Response to Intervention
(RtI) and we encourage them to use these processes. Users who are looking for guidance in use of the
tool, however, are encouraged to apply the following simple Cycle of Inquiry process1 as a framework
for utilizing the EWS tool to aid students:
1. Analyze (Identify Pattern of Need): Use the EWS tool to identify a student or group of students
who are at risk. This can be based upon an individual indicator or combination of indicators. The
EWS can also be used to determine grouping of students or tiers based on their risk levels and
the similarities or differences between their profiles. Similarly, students can be prioritized for
intervention based on their risk levels.
Once a student (or group of students) has been identified, investigate other unseen aspects of
the student’s profile. Is the student enrolled in special education or an English language learner?
Why does the student present risk in a certain area? Use other data systems available to you
(such as the district Student Information System). Determine why the student is struggling in
certain indicators. Use all the evidence at your disposal.
2. Strategize (Create Action Plan): A school team should convene to decide on best supports for
the identified students. Use the expertise of your school RtI, EWS, or intervention team to
create an action plan for the student(s) identified. If a student is struggling in an individual
indicator such as Attendance Percentage, create an action plan: select a high impact strategy,
set a goal(s) for the coming period of time in that single indicator, and measure progress against
1 More information on the Cycle of Inquiry can be found on the RIDE Data Use Professional Development website.
18
it. If a student is struggling in all categories, choose one or multiple categories in which to set a
goal.
3. Act (Implement Strategy and Assess): Implement this plan with your set goals for the student(s)
in mind. Record when this intervention began, what its purpose and methods are, and monitor
student progress along the way.
Assess the student(s)’ progress towards the goal. Once the time period set for the action plan
has past, determine whether the student(s) has met said goal and thus if the strategy has
worked. If the assessment is made that the student(s) is still at risk, return to step 1 and repeat
the process. Make sure to reflect, record, and discuss with RtI, EWS or intervention team how
successful the intervention strategy was. This will be useful in later interventions.
19
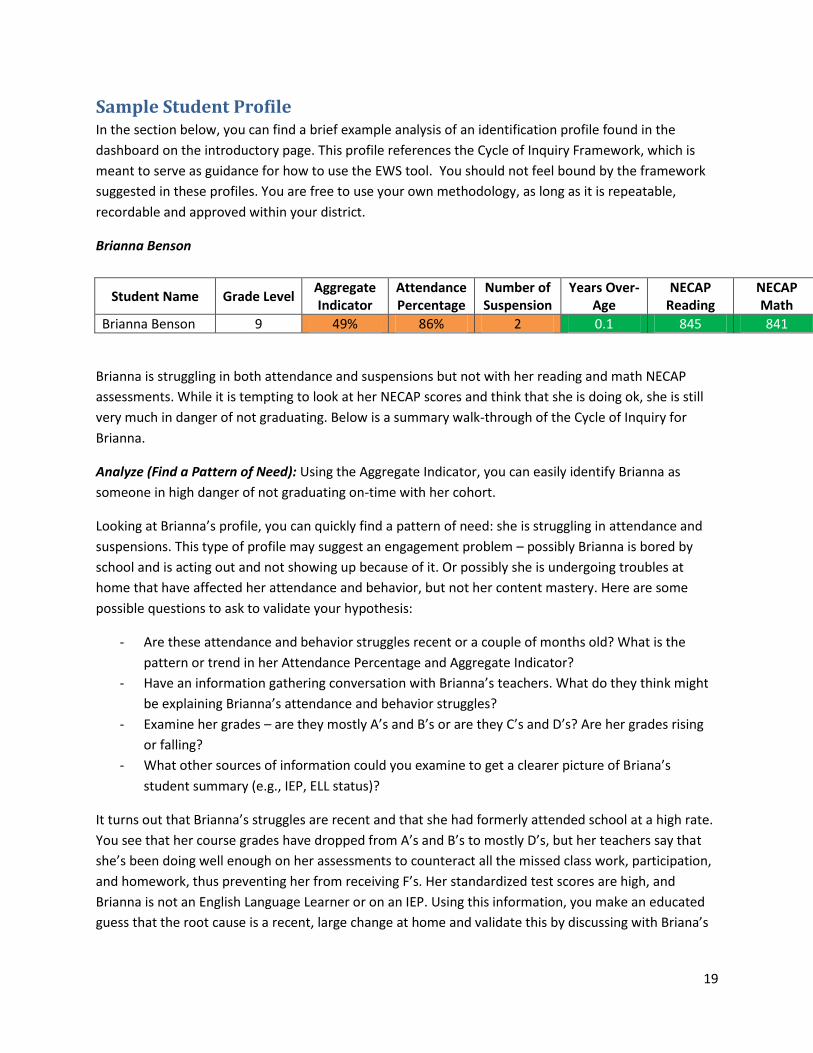
Sample Student Profile In the section below, you can find a brief example analysis of an identification profile found in the
dashboard on the introductory page. This profile references the Cycle of Inquiry Framework, which is
meant to serve as guidance for how to use the EWS tool. You should not feel bound by the framework
suggested in these profiles. You are free to use your own methodology, as long as it is repeatable,
recordable and approved within your district.
Brianna Benson
Student Name Grade Level Aggregate Indicator
Attendance Percentage
Number of Suspension
Years Over-Age
NECAP Reading
NECAP Math
Brianna Benson 9 49% 86% 2 0.1 845 841
Brianna is struggling in both attendance and suspensions but not with her reading and math NECAP
assessments. While it is tempting to look at her NECAP scores and think that she is doing ok, she is still
very much in danger of not graduating. Below is a summary walk-through of the Cycle of Inquiry for
Brianna.
Analyze (Find a Pattern of Need): Using the Aggregate Indicator, you can easily identify Brianna as
someone in high danger of not graduating on-time with her cohort.
Looking at Brianna’s profile, you can quickly find a pattern of need: she is struggling in attendance and
suspensions. This type of profile may suggest an engagement problem – possibly Brianna is bored by
school and is acting out and not showing up because of it. Or possibly she is undergoing troubles at
home that have affected her attendance and behavior, but not her content mastery. Here are some
possible questions to ask to validate your hypothesis:
- Are these attendance and behavior struggles recent or a couple of months old? What is the
pattern or trend in her Attendance Percentage and Aggregate Indicator?
- Have an information gathering conversation with Brianna’s teachers. What do they think might
be explaining Brianna’s attendance and behavior struggles?
- Examine her grades – are they mostly A’s and B’s or are they C’s and D’s? Are her grades rising
or falling?
- What other sources of information could you examine to get a clearer picture of Briana’s
student summary (e.g., IEP, ELL status)?
It turns out that Brianna’s struggles are recent and that she had formerly attended school at a high rate.
You see that her course grades have dropped from A’s and B’s to mostly D’s, but her teachers say that
she’s been doing well enough on her assessments to counteract all the missed class work, participation,
and homework, thus preventing her from receiving F’s. Her standardized test scores are high, and
Brianna is not an English Language Learner or on an IEP. Using this information, you make an educated
guess that the root cause is a recent, large change at home and validate this by discussing with Briana’s
20
parents. They notify you of some recent family troubles that seem to have hit Brianna hard. They were
not aware that Brianna’s attendance had dropped recently.
Strategize (Create an Action Plan): After brainstorming evidence-based, high impact strategies, you
decide to take a two-pronged approach in which you schedule weekly sessions for Brianna with the
school counselor and put Brianna on an incentivized attendance plan. You set a goal to get Brianna to
95% attendance over the next month (bringing her up to 90% on the year). This should increase her
Aggregate On-Track Percentage Indicator score as well.
Act (Implement Strategy and Assess): You implement the two strategies you selected: weekly sessions
with the counselor and an incentivized attendance plan. However, upon further assessment, Brianna’s
attendance does not improve over the next month. Also, she curses at a teacher and is suspended a 3rd
time. The counselor reports little success in his sessions with Brianna, as she still seems removed and
detached. You record that the attendance plan and counseling interventions did not work for Brianna in
the short term and quickly reanalyze and strategize, moving to a second intervention plan involving the
school’s truant officer and weekly check-ins with Brianna’s parents. You remind yourself to re-assess the
success of this plan weekly, and records its success after another month has passed.

21
Part III:
Frequently Asked Questions
22
Frequently Asked Questions
What do I do if I want to look at student risk levels over time?
The EWS tool dashboard is exportable. You are able to save the information as a PDF or export
to excel to keep for your records. Keep in mind that the data available in the EWS tool is only
the most current data available for students in your school or district. The tool does not keep
historical data on students, i.e. what was the Attendance Percentage during the first semester
versus the current semester.
I want a more technical explanation of the statistical modeling behind RIDE’s Early Warning System.
Read the Rhode Island EWS Modeling Document, available here.
How can I find more national research on Early Warning Systems in general?
Research and advocacy institutions like the Everyone Graduates Center at Johns Hopkins
University and the Consortium on Chicago School Research (CCSR) have done excellent work in
the fields of predicting and preventing high school dropout. Some examples (but not the only
examples) of high quality research on the subject of dropout indicators are:
Allensworth, Elaine and Eastman, John. The On-Track Indicator as a Predictor of
Graduation. Consortium on Chicago School Research: 2005.
Allensworth, Elaine and Eastman, John. What Matters for Staying on Track and
Graduating in Chicago Public High Schools. Consortium on Chicago School Research:
2007.
Balfanz, Robert and Neild, Ruth Curran. Unfulfilled Promise: The Dimensions and
Characteristics Of Philadelphia’s Dropout Crisis, 2000-2005. Project U-Turn: 2006.
Balfanz, Robert, Herzog, Lisa, and MacIver, Douglas. “Preventing Student
Disengagement and Keeping Students on the Graduation Path in Urban Middle-Grades
Schools: Early Identification and Effective Interventions.” Educational Psychologist. Vol
42(4), 2007: pp. 223-235.
Roderick, Melissa. The Path to Dropping Out: Evidence for Intervention. Auburn House
Publishers. Westport, CT: 1993.
Different existing state early warning systems and dropout prevention programs are catalogued
below:
- Arkansas Early Warning Research
- Massachusetts Early Warning Indicator System (EWIS)
- Tennessee Early Warning Data System (EWDS)
23
- Virginia Early Warning System (VEWS)
The Data Quality Campaign (DQC) is a national, collaborative effort to encourage and support
state policymakers to improve the availability and use of high-quality education data to improve
student achievement. DQC has catalogued state early warning system efforts here.
We found a school wide issue using EWS data, what do we do now?
- The RIDE Response to Intervention webpage provides tools and resources to help schools
and districts implement RtI processes.
- The National High School Center has developed implementation guides, webinars, resources,
community of practice, etc. to support EWS school teams.
For more information or questions:
Technical Issues:
Contact the RIDE Helpdesk: [email protected]
For EWS tool and training:
Cali Cornell at [email protected] or (401) 222-8251
For policy, practice on Response to Intervention systems:
Emily Klein at [email protected] or (401) 222-8985