rheological behaviour of suspensions of bubbles in … · the rheological properties of suspensions...
TRANSCRIPT

Rheological behaviour of suspensions of bubbles in yield
stress fluids
Lucie Ducloue, Olivier Pitois, Julie Goyon, Xavier Chateau, GuillaumeOvarlez
Laboratoire Navier (UMR CNRS 8205), Universite Paris-Est, 77420 Champs-sur-Marne,France
Abstract
The rheological properties of suspensions of bubbles in yield stress fluids areinvestigated through experiments on model systems made of monodispersebubbles dispersed in concentrated emulsions. Thanks to this highly tunablesystem, the bubble size and the rheological properties of the suspendingyield stress fluid are varied over a wide range. We show that the macroscopicresponse under shear of the suspensions depends on the gas volume fractionand the bubble stiffness in the suspending fluid. This relative stiffness canbe quantified through capillary numbers comparing the capillary pressureto stress scales associated with the rheological properties of the suspendingfluid. We demonstrate that those capillary numbers govern the decrease ofthe elastic and loss moduli, the absence of variation of the yield stress and theincrease of the consistency with the gas volume fraction, for the investigatedrange of capillary numbers. Micro-mechanical estimates are consistent withthe experimental data and provide insight on the experimental results.
Keywords: yield stress fluid, bubble, capillarity, suspension, emulsion,elastic modulus, yield stress, consistency
1. Introduction
Yield stress fluids are widely used in the industry where their versatilecharacter, from solid under a critical stress to liquid above that threshold,
∗corresponding authorEmail address: [email protected] (Lucie Ducloue)
Preprint submitted to Journal of Non-Newtonian Fluid Mechanics May 26, 2014
arX
iv:1
405.
6144
v1 [
cond
-mat
.sof
t] 2
3 M
ay 2
014

has many applications (Coussot, 2005). Examples include creams and gels inthe cosmetic industry, and also mud or fresh building materials like plaster orconcrete slurries. During processing of those materials, air bubbles are oftenpresent in the fluid, either because they get entrapped during mixing or asthe result of deliberate addition to confer innovative properties to the finalproduct. This is for instance the case in dairy products (van Aken, 2001) orin the building industry in which aerated materials are designed to be lighterand better insulating. Processing of these aerated yield stress fluids requiresto understand and monitor their behaviour under shear flows.
Understanding the response of a sheared bubble suspension in a non-Newtonian fluid is complex: as the suspending fluid itself is non-Newtonian,the behaviour of the suspension is expected to be non-Newtonian too, and thecontribution of additional non-linear phenomena due to the presence of thebubbles may be difficult to quantify. Some useful understanding of the phys-ical mechanisms at stake can be collected from previous results on relatedcases of simpler suspensions. The simplest type of suspension is a disper-sion of solid particles in a Newtonian fluid. The relative viscosity of suchsuspensions is an increasing function of the solid volume fraction which iswell described by a Krieger-Dougherty law (Wildemuth and Williams, 1984).From a microscopic point of view, all the shear deformation undergone by thesuspension occurs in the fluid between the solid grains. As a consequence,the effective local shear rate in the fluid has to be greater than the macro-scopic shear rate applied to the suspension, leading to increased dissipation.Suspensions of bubbles in Newtonian fluids have been studied by Rust andManga (2002a) and Llewellin et al. (2002): their experiments showed thatthe relative viscosity of the bubbly liquid in a steady shear flow increaseswith the gas volume fraction at low shear rate (with a lesser growth than therelative viscosity of particle suspensions) and decreases at high shear rate.Observation of the bubbles in the flow (also quantified in Rust and Manga(2002b)) evidenced the importance of bubble deformation in the contributionof the bubbles to the overall viscosity: bubbles in their experimental set-upare spherical at low shear rate and elongated in the flow at high shear rate.The distortion of flow lines around non-deformable bubbles leads to increasedlocal shear rates in the suspending fluid compared to the macroscopic shearrate applied to the suspension. However, the absence of friction at the bubblesurface lessens the total dissipation in the bubble suspension compared to theparticle suspension. At high shear rate, the elongation of inviscid bubbles in
2
the flow accommodates part of the shear deformation and decreases the totaldissipation. This transition from stiff to soft bubbles with increasing shearrate is the result of a competition between two physical effects: the viscousstress in the fluid tends to stretch the bubbles in the flow whereas the capil-lary stress minimizes the bubbles’ surface by favouring a spherical shape. Toquantify this competition, the authors introduce a capillary number that canbe defined as “viscous” and is the ratio of the viscous stress to the capillarystress: Cavisc = ηγ
σ/Rwhere η is the viscosity of the suspending fluid, γ is the
applied shear rate, σ is the surface tension between the gas and the liquidand R is the bubble radius.The case of suspensions in non-Newtonian fluids is more complicated as thelocal shear rate between the particles, and consequently the apparent viscos-ity of the interstitial fluid, is not known. Numerous experiments have beenperformed on filled polymer melts, which are dispersions of rigid particles invisco-elastic fluids and have large industrial applications (Mewis and Wagner,2012). The results obtained by Poslinski et al. (1988) on suspensions of glassspheres in a polymer melt shed light on two important effects of particle ad-dition in a non-Newtonian fluid. In the absence of fillers, the suspending fluidconsidered by the authors is Newtonian at low shear rate, and then shear-thinning for higher shear rates. When particles are added to the fluid, theviscosity of the suspension is increased for all shear rates, and the Newtonianplateau gets shorter and shorter as the solid volume fraction increases. Theonset of shear-thinning in the suspension for lower shear rates is due to shearamplification in the fluid between the particles, in which the effective localshear rate can be high enough to get off the Newtonian plateau even thoughat the macroscopic shear rate applied to the suspension the fluid alone wouldstill be Newtonian. The overall response of the suspension is the couplingof the fluid rheology to the flow lines perturbation caused by the inclusions.Suspensions of particles in yield stress fluids have been studied by Mahautet al. (2008) who characterized the elastic and plastic response of suspen-sions of hard spheres in a Herschel-Bulkley fluid. Below the yield stress, theelastic modulus of the suspensions grows with the solid volume fraction andfollows a Krieger-Dougherty law, as can be expected from the viscosity ofsuspensions in Newtonian fluids: both measurements characterize the linearresponse of each suspension. The yield stress increases with the solid volumefraction too, and its growth, of smaller magnitude than the one of the linearproperties of the suspensions, is well predicted by micro-mechanical esti-mates (Chateau et al., 2008). For shear thinning yield stress fluids, the lesser
3

growth of the yield stress compared to the linear properties of the suspensioncan also be understood as a manifestation of shear amplification in the fluidbetween the grains. The local shear rate in the suspending fluid is higherthan the macroscopic shear rate applied to the suspension and increases withthe solid volume fraction, leading to decreasing apparent (secant) viscosity ofthe interstitial fluid. The overall response results from the interplay of flowlines perturbation and apparent fluidification of the suspending fluid.
Bubbly yield stress fluids have been the subject of fewer studies. Be-sides stability studies (Goyon et al., 2008; Salonen et al., 2011), their elasticproperties have been studied in detail in Ducloue et al. (2014) and a firstdescription of the rheology of mixtures of foams and pastes has been given inKogan et al. (2013). However, more work is needed to investigate a broaderrange of rheological parameters for the yield stress fluid and to describe theflow properties of those suspensions. We anticipate from the results on bub-ble suspensions in Newtonian fluids that the rheology of an aerated yieldstress fluid will also be the result of the interplay of the suspending fluidrheology and capillary forces acting on the bubble surface. Yield stress fluidsbehave as visco-elastic solids below their yield stress and visco-plastic fluidsabove that threshold. We are thus interested in the visco-elastic properties,yield stress and flow curve of suspensions of bubbles in those fluids. In thisaim, we perform an experimental study of the overall rheological propertiesof model suspensions of bubbles in tunable yield stress fluids. We limit togas volume fractions up to 50% so that we do not consider foams of yieldstress fluids, in which the bubbles are deformed by geometrical constraints.
In section 2, we present the materials used for the study, and the rheo-metrical procedures. In section 3, we discuss the complex shear modulus ofa soft aerated solid. In section 4, we review our results for the plasticitythreshold of bubbly yield stress fluids. Section 5 is dedicated to the flowcharacterisation of our suspensions.
2. Materials and methods
To perform this experimental study, we prepare model suspensions ofmonodisperse bubbles in simple yield stress fluids. For most systems, thesuspensions are obtained by mixing a simple yield stress fluid with a sepa-rately produced monodisperse foam.
4

oil - vol. fraction continuous phase σ (mN.m−1)
emulsion (1) dodecane - 73% SDS 2.7% w. in water 36 ± 1
emulsion (2a) silicon (V20) - 75% Forafac R©(DuPontTM) 4% w. in water 15.5 ± 0.1
emulsion (2b) silicon (V20) - 73% Forafac R©(DuPontTM) 4% w. in water 15.5 ± 0.1
emulsion (3) silicon (V350) - 79% TTAB 3% w. in water/glycerol 50/50 w/w 35.5 ± 0.1
emulsion (4a) silicon (V350) - 70% TTAB 3% w. in water/glycerol 36/64 w/w 35 ± 1
emulsion (4b) silicon (V350) - 70% TTAB 3% w. in water/glycerol 36/64 w/w 35 ± 1
Table 1: Synthetic description of all the concentrated emulsions used as model yield stressfluids to prepare bubble suspensions: nature and volume fraction of the oil dispersed phase,composition of the aqueous continuous phase (including the surfactant) and surface tensionbetween the air and the continuous phase.
2.1. Model yield stress fluids
The simple yield stress fluids that we choose to perform the study areconcentrated oil in water emulsions. By changing the chemical compositionof the two phases and the oil volume fraction, we obtain various suspendingemulsions with elastic moduli ranging from 100 to 1000Pa and yield stressesbetween 10 and 40Pa. Unless otherwise indicated, the radius of the dropletsis around 1 to 2µm (the polydispersity, computed as in Mabille et al. (2000),is around 20%). At the considered gas volume fractions, this small dropletsize should ensure that there is scale separation between the drops and thebubbles, and consequently validate the use of the suspending emulsion as acontinuous medium embedding the bubbles (Goyon et al., 2008). The varietyof the suspending emulsions used for the study is illustrated in table 1, whichgives their composition.
2.2. Suspensions preparation
Most suspensions are prepared by gently mixing the suspending emulsionwith a separately produced monodisperse foam. The foams are obtained byblowing nitrogen plus a small amount of perfluorohexane (C6F14) through aporous glass frit or through needles: we are able to produce nearly monodis-perse foams with average bubble radii R ranging from 40µm to 800µm.Coarsening is strongly reduced by the presence of C6F14 (Gandolfo andRosano, 1997), meaning that the bubble size is stable during measurements.The continuous phase of the foam is the same as the one in the emulsion,ensuring that the dispersion of bubbles in the emulsion during mixing is easy
5

and does not induce any additional chemical effect in the suspensions. Themixing with the foam adds in a small amount of continuous phase to theemulsion, which lowers its oil volume fraction and thus alters its rheologicalbehaviour. For a series of suspensions at different gas volume fractions in agiven emulsion, we fix the oil volume fraction of the suspending emulsion byadding as necessary a complement of pure continuous phase in the system(the same protocol was used in Goyon et al. (2010); Kogan et al. (2013) forinstance). An example of a dispersion of bubbles in an emulsion is shown infigure 1. The prepared bubble suspension is then poured in the rheometer
Figure 1: Microphotograph of a bubble suspension in suspending emulsion 3. The bubbleradius is 200µm. The granulated background is emulsion 3, which is transparent.
geometry to perform measurements. Because of the random nature of themixing and pouring process, we assume that the suspension is isotropic whenit is set in place in the rheometer.
2.3. Rheometrical procedures
The rheometrical measurements are performed on a stress-controlled rheome-ter (either Bohlin C-VOR 200 or Malvern Kinexus Ultra). The geometry usedto perform the measurement does not affect the result providing the shearedthickness of suspension is larger than several bubble diameters. Depend-ing on the bubble size, different geometries were used to ensure that thiscondition was satisfied, while minimizing the required volume of material tofill in the geometry. For Rb ≤ 50µm, the material is sheared between par-allel plates (radius R=25mm, gap h=2.5mm). The planes are serrated to
6

prevent slippage of the suspension (Coussot, 2005). Suspensions containingbigger bubbles require a larger thickness of sheared material and are stud-ied in roughened Couette-like devices : for 50µm < Rb < 800µm, we usea vane in cup (exceptionally a serrated bob in cup) geometry (inner radiusRi=12.5mm, outer radius Ro=18mm), and for Rb ≥ 800µm, we use vanein cup geometries (either Ri=12.5mm and Ro=25mm or Ri=22.5mm andRo=45mm).The rheometrical procedure is described below. Typical values of the pa-rameters are given all along the description. The shear modulus G′ of thesuspensions is measured immediately after setting the material in the rheome-ter, by imposing small amplitude oscillations at a frequency of typically 1Hz.The oscillatory stress is chosen to be well below the yield stress of the sus-pensions, so that the oscillations are performed in the linear elastic regimeof each suspension. At this frequency, the loss modulus of the systems isnegligible.After the elastic modulus, the static yield stress τy of the suspensions is mea-sured by initiating flow from rest at a small and constant imposed shear rateγ, typically 0.005s−1. The low shear rate ensures that the contribution ofviscous effects to the torque is negligible. The curve obtained during themeasurement of the static yield stress of suspending emulsion 2a is shown asan example in figure 2. The suspending emulsion is elasto-plastic: the stressincreases first linearly with the strain, until it reaches a plateau at yielding.
0 , 0 0 , 2 0 , 4 0 , 6 0 , 8 1 , 0 1 , 202468
1 01 2
shea
r stre
ss (Pa
)
s h e a r s t r a i n
d γ / d t = 0 . 0 0 5 s - 1
1 E - 3 0 , 0 1 0 , 1 1 1 005
1 01 52 02 5
shea
r stre
ss (Pa
)
s h e a r r a t e ( s - 1 )
Figure 2: Yield stress measurement (left) and flow curve (right) of suspending emulsion2a. The material is elasto-plastic below the yield stress and visco-plastic beyond.
Once the plateau stress is attained, the suspensions are set to rest at zerostress for a few dozens of seconds, so that the elastic deformation stored in
7

Fluid rheology Capillarity
Emulsion G′(0) (Pa) τy(0) (Pa) R (µm) σ/(2R) (Pa)
50 ± 10 360 ± 82
1 285 ± 20 10 ± 0.4 143 ± 17 120 ± 18
800 ± 40 23 ± 1.7
2a 230 ± 20 12 ± 0.3 41 ± 5 189 ± 54
2b 163 ± 10 7.2 ± 0.5 129 ± 10 60 ± 11
3 650 ± 50 40 ± 2 1000 ± 100 18 ± 2.2
4a 650 ± 50 20.5 ± 0.5 50 ± 10 350 ± 80
4b 799 ± 40 20.5 ± 0.5 150 ± 10 117 ± 11
Table 2: Relevant stress scales for the study: rheological characteristics of the suspendingemulsions, and capillary stress scale in the bubbles. The flow curve description is discussedbelow in section 5.
the material is relaxed Cloitre et al. (2000). After that, a shear rate ramp isapplied over around 2 minutes, typically from 10−3 to 10s−1, which, with oursuspensions, is enough to ensure that the viscous contribution to the totaltorque overcomes the one of the yield stress. The flow curve of suspendingemulsion 2a is shown in figure 2. The flow curve of all suspending emulsionsis well fitted to a Herschel-Bulkley model τ(γ) = τy + kγn, where k is theconsistency and n ∼ 0.5 is the plastic index.The rheological characteristics of the suspending emulsions used for the studyare detailed in table 2, along with the radius of the bubbles that were addedto each suspending emulsion to prepare the suspensions. The parametersk and n of the flow curve of the suspending emulsions are not discussedhere, and are reserved for section 5. For a given set of suspending emulsionand bubble size, several suspensions were produced to vary the gas volumefraction in the range 0%-50%.
8

3. Complex modulus
3.1. Elastic modulus
Experimental results. For applied stresses well below the yield stress, the sus-pending emulsion behaves as a soft visco-elastic solid. The study of the linearelastic properties of suspensions of bubbles in elastic solids has been the sub-ject of previous work (Ducloue et al., 2014). Because of surface tension forcesat the interface between the gas and the suspending emulsion, bubbles resistdeformation and behave as equivalent soft elastic inclusions in the unyieldedsuspending emulsion. The overall elasticity of the suspensions depends onthe ratio of the fluid’s elastic modulus to the bubble’s equivalent elasticityin the suspending medium. This competition is quantitatively governed bya capillary number defined as the ratio of the suspending medium elasticmodulus to the capillary stress scale in the bubbles, given by the Laplacepressure:
Caelast =G′(0)
2σ/R(1)
For a suspension of bubbles with known radius in a given suspending emul-sion, Caelast is entirely determined and the elastic modulus G′(φ) of the sus-pension depends solely on the gas volume fraction φ. In the range of Caelastexperimentally accessible with our set-up (0.2 ≤ Caelast ≤ 9) G′ decreaseswith φ and this decrease is all the more significant as Caelast is large. Micro-mechanical estimates taking into account the physical parameters φ andCaelast of the systems predict dimensionless elastic moduli G = G′(φ)/G′(0)for semi-dilute suspensions (Thuy Linh et al., 2013; Palierne, 1990):
Ghomog(φ,Ca) = 1− φ(4Ca− 1)
1 + 125Ca− 2
5φ(1− 4Ca)
(2)
in the Mori-Tanaka scheme. This estimate allows to predict values for G ina broader range of Ca than is experimentally accessible with our systems.The computed G undergoes a transition for Ca = 0.25: below this value, Gincreases with φ, and it turns into a decreasing function of φ for Ca > 0.25.In this latter range of capillary numbers, the micro-mechanical estimatesare in good agreement with the experimental measurements. Experimentalresults from Ducloue et al. (2014) as well as micro-mechanical estimates forG as a function of Caelast (left) and φ (right) are presented in figure 3.
9

0 , 1 1 1 00 , 00 , 20 , 40 , 60 , 81 , 01 , 2
�
φ= 1 0 % φ= 2 0 % φ= 3 0 % φ= 4 0 %
C a e l a s t0 5 1 0 1 5 2 0 2 5 3 0 3 5 4 0 4 5 5 00 , 0
0 , 20 , 40 , 60 , 81 , 01 , 21 , 4
� � � � � � � � � � � � � � � � � � �� � � � � � � � � � � � � � � � � � � �� � � � � � � � � � � � � � � � � � �
�
�
φ� � � �
Figure 3: (left) Dimensionless elastic modulus G of the suspensions as a function of theelastic capillary number Caelast for four values of φ. Symbols are experimental data points,full lines are micro-mechanical computations (figure from Ducloue et al. (2014)). (right)Dimensionless elastic modulus G of 3 bubble dispersions in suspending emulsions as afunction of the gas volume fraction φ. Symbols are experimental data points, full linesare micro-mechanical computations; the capillary numbers are, from top to bottom: 0.3,0.6, 9. From 0.25 to 9, G turns from being roughly constant with φ to decreasing as fastas for surface tension-free pores. Dashed lines are the computed limits from equation 2,for suspensions of infinitely rigid (Caelast = 0, top) and freely deformable (Caelast →∞,bottom) bubbles (data replotted from Ducloue et al. (2014)).
3.2. Viscous modulus
The viscous modulus of the systems, defined as the imaginary part ofthe complex shear modulus, is negligible during the oscillatory measurementperformed at 1Hz. To study its evolution with the gas volume fraction, wedesign a system with high viscous effects by using an aqueous phase with ahigh glycerol weight content (64%) (emulsion 4). Because of the high glyc-erol weight content in the aqueous phase, this emulsion is unstable below25◦C. The measurements are all performed at 25◦C, but the temperaturewas poorly controlled during preparation and storage of this emulsion, whichmay explain that the two batches of this emulsion we made have slightlydifferent moduli. We accurately measure the viscous component of the com-plex modulus by performing oscillations at very small deformation over afrequency sweep, in the range 0.1Hz ≤ f ≤ 50Hz. For 1Hz ≤ f ≤ 20Hz,the viscous modulus G′′(0) of the suspending emulsion stands out againstthe noise in the oscillations and scales as the square root of the frequency:G′′(0) ∼ a(0)f 0.5. Above this frequency, we did not manage to calibrate theinertia of our geometry with enough precision to get accurate moduli. This
10

frequency dependence of the loss modulus is known for concentrated emul-sions (Mason and Weitz, 1995), as well as aqueous foams (Cohen-Addadet al., 1998), which are structurally very similar. The power law scaling re-mains the same for the suspensions of bubbles in the suspending emulsion:G′′(φ) ∼ a(φ)f 0.5 in the same range of frequency. G′(f) and G′′(f) for sus-pending emulsion 4b and a suspension of bubbles in this emulsion are plottedin figure 4. We quantify the evolution of the viscous modulus with the gasvolume fraction by computing G′′(φ) = a(φ)/a(0).G′′(φ) is plotted in figure 4 for suspensions of bubbles with two different radiiin two batches of suspending emulsion 4. G(φ) for the same suspensions isalso re-plotted for comparison. We observe that G′′ is a decreasing functionof φ. It can be noticed that this decrease is much larger than observed for theelastic modulus of the same suspensions. Remarkably, and contrary to theobservations on G, although R is three times larger in one of the suspensions,the values for G′′(φ) are similar for both series of suspensions.
0 , 1 1 1 01 0
1 0 0
1 0 0 0
G ’ , φ= 0 % G " , φ= 0 % G ’ , φ= 3 7 % G " , φ= 3 7 % p o w e r l a w f i t s
modu
li (Pa
)
f r e q u e n c y f ( H z ) 0 1 0 2 0 3 0 4 0 5 00 , 00 , 20 , 40 , 60 , 81 , 0
φ� � � �
�
dime
nsion
less m
oduli
� � � � � � � � � �� � � � � � � � � � �� � � � � � � � � � � �� � � � � � � � �
Figure 4: (left) Frequency dependence of elastic and viscous moduli of suspending emulsion4b (black symbols) and a suspension of 150µm bubbles in that emulsion. The green linesare the power law fits to the G′′(f). (right) Dimensionless elastic and viscous modulias a function of the gas volume fraction for two suspensions of bubbles in emulsion 4:50µm in emulsion 4a and 150µm in emulsion 4b. The full colored lines are the computeddimensionless elastic moduli for those systems. The thick black line is given by equation 4.
3.3. Discussion
Loss capillary number. To understand that result, we would like to compareG′′(0), which is a scale of viscous dissipation in the suspending emulsion, toa scale of viscous dissipation arising from the bubbles. In the suspending
11

emulsion, the dissipated power per unit volume scales as G′′(0)γo2f , where
γo is the oscillating strain amplitude. In the bubbles, the dissipation mainlycomes from the change in the area of the bubbles under shear. As the oscillat-ing deformation is very small (γo ∼ 10−4), there is no macroscopic surfactantflow on the surface of the bubbles and so the change of a bubble relative areais governed by the macroscopic applied strain γo and scales as γo (Palierne,1990). The surface viscosity at the bubble interface has two contributions:a shear viscosity and a dilatational viscosity. For most surfactant solutions,the contribution of the dilatational viscosity greatly overcomes the one ofthe shear viscosity (Cohen-Addad et al., 2013). Surface rheology measure-ments (Kao et al., 1992; Biance et al., 2009) indicate that the surface dilata-tional viscosity of mobile surfactant solutions (employed in our systems) isof order ηd ∼ 10−5 to 10−4N.s.m−1. The dissipated power in a bubble perunit volume is proportional to the bubble specific surface area and so finallyit scales as fηdγo
2f/R. The ratio of the power dissipated per unit volume inthe suspending emulsion compared to the one in the bubbles reads
Caloss =G′′(0)
fηd/R(3)
which defines a loss capillary number. The value of G′′ for f ∼ 8Hz, whichis located in the power-law scaling part of the experimental curve, is around95Pa in emulsion 4a and 125Pa in emulsion 4b. For the suspensions of 50µmbubbles in emulsion 4a, Caloss is around 6 to 60 depending on the exact valueof ηd and it is around 23 to 230 for the 150µm bubbles in emulsion 4b. Thehigh value of Caloss emphasizes that the dissipation is much higher in thesuspending emulsion, which can be qualitatively understood by noticing thatdissipation in the emulsion mostly arises from the same mechanisms as in thebubbles, from interfacial solicitation at the droplet surface. As the dropletsare much smaller than the bubbles, the droplets’ specific surface area is muchlarger than the bubbles’ one and the dissipation per unit volume is higherin the emulsion. This argument is only qualitative, because contrary to thebubbles, the droplets are compressed and dissipation can also occur in thefilms of continuous phase separating the droplets. Given that the decreaseof G′′(φ) that we observe in the experiments does not depend on the bubbleradius, and thus not on the bubble specific surface area, we can guess thatbubble dissipation is likely to be negligible, which in terms of loss capillarynumbers means that Caloss is very high. As the bubbles’ contribution to theoverall dissipation is very small, we can use the results established above for
12
the elastic modulus (equation 2) in the limit of infinite capillary number,by noticing that both moduli are the linear response of the suspensions andshould be described by the same equations providing we use the suitablecapillary number. This function
Ghomog(φ,Ca→∞) =1− φ
1 + (2/3)φ(4)
is plotted in figure 4 (thick black line) and is in good agreement with themeasured G′′. This function happens to be equal to the Mori-Tanaka bound,which is a classical poromechanics result for the elastic modulus of an elasticsolid containing pores with no surface tension (Dormieux et al., 2006).
Special case Ca → ∞. The moduli for small amplitude oscillations are thelinear response of our suspensions of bubbles in yield stress fluids, which wewould like to compare to the linear response of suspensions of bubbles inNewtonian fluids, that is: their relative viscosity. The viscosity measure-ments made by Rust and Manga (2002b) are not suitable for comparisonwith our experiments because they are performed in a steady shear flow,which means that deformable bubbles are elongated in the flow (whereas tothe first order in deformation they remain spherical in our systems). How-ever, Llewellin et al. (2002) have performed oscillatory measurements on thesame suspensions of bubbles in a viscous syrup to determine their relativeviscosity. Their measurements are made over a frequency sweep at constantshear stress (and consequently constant γof with γo the amplitude of theoscillating strain and f the frequency). At low frequency, γo ∼ 2, and thebubbles undergo large deformation, which cannot compare to our experi-ments. At high frequency, though, the strain is small and the bubbles re-main spherical in the liquid. The dimensionless viscosity of their suspensionson the high frequency plateau thus correspond to a similar situation as ourmoduli measurement at 1Hz. They find a rather fast decrease in this plateauviscosity with φ. Both their experimental results, G for our suspensions ofvery soft bubbles, and G′′(φ) for the suspension in emulsion 4b are plottedfor comparison in figure 5. All three data sets are very close. In all cases,the bubbles’s contribution to the measured quantity is very small comparedto that of the surrounding medium. This translates into negligible elasticcontribution compared to the yield stress fluid, and negligible viscous dissi-pation compared to the Newtonian fluid and the yield stress fluid. Althoughthe nature of the suspensions is different, the similarity in the equations for
13

the linear response of the systems and the naught contribution of the bub-bles yields to similar evolution with φ. For all systems, this evolution is welldescribed by the micro-mechanical estimate of equation 4.
0 5 1 0 1 5 2 0 2 5 3 0 3 5 4 0 4 5 5 00 , 00 , 20 , 40 , 60 , 81 , 01 , 21 , 4
� � � � � � � � � � � � � � � � � � �� � � � � � � � � � � � � � � � � � � �� η� η� � � � � � � � � � � � � � � � � � � � � � � � �
( d a t a f r o m L l e w e l l i n , 2 0 0 2 )
�
�
�����
� η(φ
)��
�
φ� � � �
Figure 5: Dimensionless viscosity (bubbles in a Newtonian liquid, data replottedfrom Llewellin et al. (2002)), dimensionless reduced dissipation G′′ and dimensionlesselastic modulus (both, bubbles in a yield stress fluid) as a function of φ. The dashed lineis, as before, the result of equation 2 in the limit case of Ca→∞.
4. Yield stress
4.1. Experimental results
The plastic properties of the suspensions exhibit a very different be-haviour from that of the moduli in solid regime. We discuss below the evo-lution of the plateau yield stress with the gas volume fraction. The shape ofthe whole stress-strain curve during the yield stress measurement is discussedin Appendix. We measured the yield stress of seven bubble suspensions withbubble radius R ranging from (41±5)µm to (800±40)µm and suspendingemulsions of yield stress τy(0) between 7Pa and 20Pa. Surprisingly, for allthese systems, we find that for gas volume fractions φ up to 50% the plateauyield stress is not affected by the presence of the bubbles. This remains trueall over the radius range mentioned above. The dimensionless yield stressτy(φ)/τy(0) as a function of φ is plotted for all these suspensions in figure 6.Given the experimental precision, τy(φ)/τy(0) ∼ 1, meaning that the yieldstress of a bubble suspension is comparable to the one of the suspendingemulsion for the range of parameters investigated. Neither the emulsion’s
14
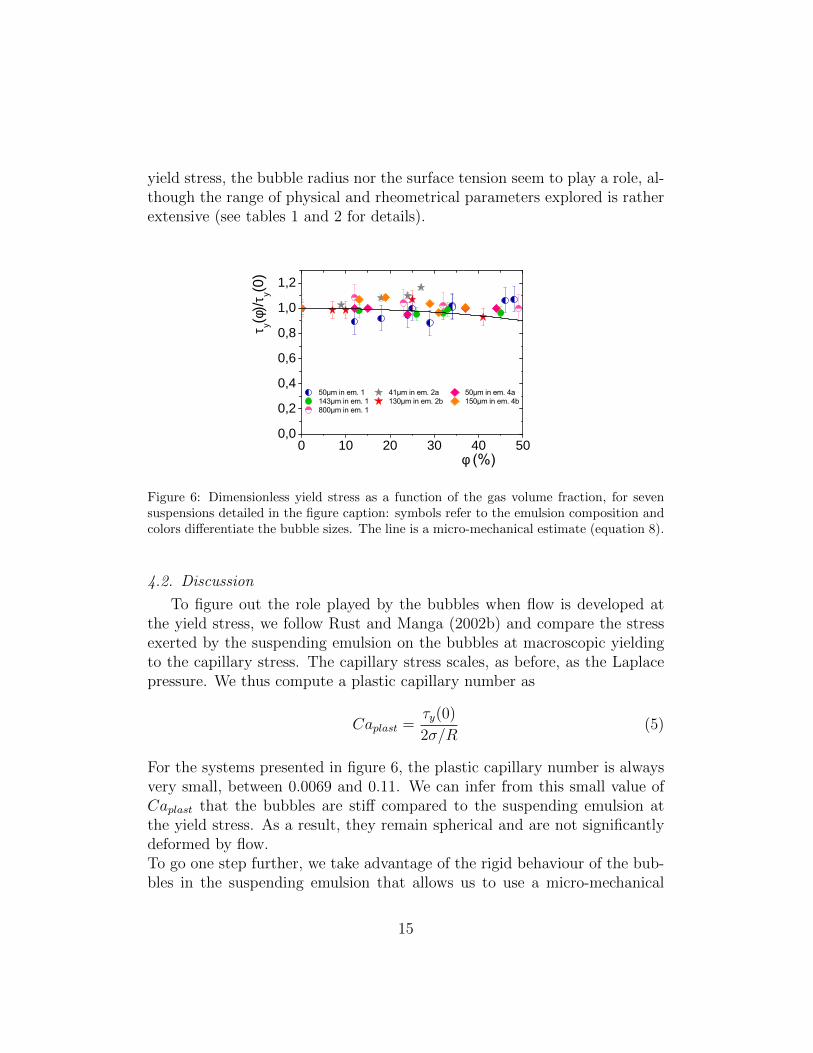
yield stress, the bubble radius nor the surface tension seem to play a role, al-though the range of physical and rheometrical parameters explored is ratherextensive (see tables 1 and 2 for details).
0 1 0 2 0 3 0 4 0 5 00 , 00 , 20 , 40 , 60 , 81 , 01 , 2
� � � � � � � � � � � � � � � � � � � � � � � � � � � � � � � � � � � � � � � � � � � � � � � � � � � � � � � � � � � � � � � � � � � � � � � � � � � � � � � � � � � � � � � � � � � � �� � � � � � � � � � � � � � �
�τ y(φ)
/τ y(0)
φ� � � �
Figure 6: Dimensionless yield stress as a function of the gas volume fraction, for sevensuspensions detailed in the figure caption: symbols refer to the emulsion composition andcolors differentiate the bubble sizes. The line is a micro-mechanical estimate (equation 8).
4.2. Discussion
To figure out the role played by the bubbles when flow is developed atthe yield stress, we follow Rust and Manga (2002b) and compare the stressexerted by the suspending emulsion on the bubbles at macroscopic yieldingto the capillary stress. The capillary stress scales, as before, as the Laplacepressure. We thus compute a plastic capillary number as
Caplast =τy(0)
2σ/R(5)
For the systems presented in figure 6, the plastic capillary number is alwaysvery small, between 0.0069 and 0.11. We can infer from this small value ofCaplast that the bubbles are stiff compared to the suspending emulsion atthe yield stress. As a result, they remain spherical and are not significantlydeformed by flow.To go one step further, we take advantage of the rigid behaviour of the bub-bles in the suspending emulsion that allows us to use a micro-mechanical
15

result obtained on suspensions of particles in yield stress fluids. Micro-mechanical computations (Chateau et al., 2008) and dedicated experiments (Ma-haut et al., 2008) with various beads type and size in different yield stressfluids have shown that the yield stress of the suspensions can be related totheir linear response g(φ) through the formula:
τy(φ)
τy(0)=√
(1− φ)g(φ) (6)
where g(φ) is the evolution with the volume fraction of any linear property ofthe dispersion. Since the bubbles are non-deformable during the yield stressmeasurement, they do not store any energy and the approach developedfor grains holds for the bubbles. Note that the boundary condition at thesurface of a particle is no-slip, whereas it is full slip at the surface of thebubble. This, however, does not modify the above result, as this boundarycondition information is implicitly enclosed in the g(φ) value. In Mahautet al. (2008), G′(φ)/G′(0) is chosen as a measurement of g(φ). The value ofg(φ) for our rigid bubbles would need be measured on a system with a closeto zero capillary number describing the linear response of the system, thatis, either Caelast → 0 or Caloss → 0. This is not experimentally possible withour systems. We thus choose G′(φ)/G′(0) as a measurement of g(φ) and relyon the theoretical limit given by equation 2 :
g(φ) = Ghomog(φ,Caelast → 0) =5 + 3φ
5− 2φ(7)
The combination of this expression and equation 6 leads to
τy(φ)
τy(0)=
√(1− φ)(5 + 3φ)
5− 2φ(8)
which is an almost steady function which is plotted in figure 6. It is in goodagreement with the experimental data.To shed light on the relevancy of a plastic capillary number, we need reachhigher Caplast for which bubbles could be deformable at yielding of the sur-rounding medium. In this aim, we try to formulate suspensions with eitherhigher yield stress or larger bubble radius. Large Caplast can not be obtainedby our method of mixing a foam with the emulsion: the bubbles are brokenin the suspending emulsion during mixing, leading to heterogeneous suspen-sions and lower capillary numbers than expected (see Kogan et al. (2013)
16

for examples). We thus prepare a series of suspensions of R = (1 ± 0.1)mmbubbles in emulsion 2, in which the yield stress is (40±2)Pa, thanks to a mil-lifluidic set-up that allows us to directly inject the bubbles in the suspendingemulsion. For this system, Caplast = 0.57, and we observe that τy(φ)/τy(0) isa decreasing function of φ, as can be seen in figure 7. As already describedfor the viscosity of bubble suspensions in Newtonian fluids at high shearrates, or the elastic modulus of bubble suspensions in yield stress fluids, therelative softness of the bubbles compared to the suspending emulsion leadsto a decrease of the macroscopic rheological properties.
0 1 0 2 0 3 0 4 0 5 00 , 00 , 20 , 40 , 60 , 81 , 01 , 2
1 m m i n e m u l s i o n ( 3 )
τ y(φ)/τ y(0)
φ ( % )Figure 7: Dimensionless yield stress as a function of the gas volume fraction, for R =1mmbubbles in emulsion 2. The grey symbols are all the other systems, re-plotted here forcomparison. The dotted line is the theoertical limit given by equation 9.
The theoretical value of τy(φ)/τy(0) for fully deformable bubbles (thatis, pores with no surface tension) can be computed thanks to the micro-mechanical approach leading to equation 6. Although the bubbles can obvi-ously not be seen as rigid particles, the energetic approach underlying equa-tion 6 holds for fully deformable bubbles because the zero surface tensioncondition means that bubble deformation does not require any energy andso it does not change the global energetic balance. Substituting g(φ) by thevalue of G′(φ)/G′(0) for infinite capillary number (given by equation 4) inequation 6, we derive an expression for the yield stress of suspensions of fullydeformable bubbles
τy(φ)
τy(0)=
(1− φ)√1 + (2/3)φ
(9)
17

which is plotted in figure 7. One can see in this figure that our experimentalsystem is rather close to the limit case of infinitely soft (zero surface tension)bubbles in the suspending emulsion at yielding, even though the value of theplastic capillary number that we define to quantify the rigidity of the bubblesduring the yield stress measurement is still lower than 1.
5. Flow consistency
5.1. Experimental results
The flow curve of the suspensions can be fully exploited only for thosestudied in parallel plates or Couette geometries, because the precise natureof flow is poorly known around a vane tool (Baravian et al., 2002; Ovarlezet al., 2011). The flow curve of the suspending emulsion is well fitted to aHerschel-Bulkley law τ(γ) = τy + kγn, with n = 0.45 for our systems. Wehave already seen that τy exhibits little dependence on φ. To highlight theviscous contribution to the total stress during the flow curve measurement,we plot as an example in figure 8 τ(γ) − τy as a function of γ for all R =50µm bubble suspensions in emulsion 4a. We can see that for a series ofsuspensions at various φ in a given suspending emulsion, the exponent n isnot modified by the presence of the bubbles. We can thus fit the flow curveswith a given n and extract the consistency k(φ) at each φ. The dimensionlessconsistency k(φ)/k(0) is plotted in figure 8 for two series of suspensions indifferent emulsions but both containing small enough bubbles to be studiedin a parallel plates geometry. It is found to be an increasing function of φfor both systems.
18

0 , 0 1 0 , 1 1
1
1 0
0 % 1 2 % 1 5 % 2 4 % 3 7 % 4 4 %
τ-τy
d γ / d t
1 / 2i n c r e a s i n g k
0 1 0 2 0 3 0 4 0 5 00 , 91 , 01 , 11 , 21 , 31 , 4
�
� � � � � � � � � � � �� � � � � � � � � � � � �� � � � � � �
k(φ)/k
(0)
φ� � �
Figure 8: (left) Log-log plot of the flow curves of R = 50µm bubble suspensions in emulsion4a. The yield stress has been substracted to emphasize the common viscous power-lawand the increasing consistency with φ. (right) Dimensionless consistency as a functionof the gas volume fraction, for two suspensions with small bubbles. Symbols refer to thesuspending emulsion composition. In both cases, n = 0.45. The full line is a micro-mechanical estimate given by equation 11.
5.2. Discussion
The capillary number relevant during flow compares the total shear stressto the capillary stress scale. As can be seen on the flow curve of a suspendingemulsion (figure 2 for instance), the maximum stress applied during flow isequal or lower to three times the yield stress of the emulsion. The flowcapillary number thus ranges from 0.01 ≤ Caflow ≤ 0.3 and is low. For thisreason, we assume that the bubbles are not significantly deformed in theflow.As we have previously done for the yield stress, because the bubbles are stiffcompared to the suspending emulsion, and thus do not store any energy, werely on a homogenization approach developed for suspensions of particles inyield stress fluids (Chateau et al., 2008). For those suspensions, the yieldstress is related to the consistency by the formula:
k(φ)
k(0)=
(τy(φ)/τy(0))n+1
(1− φ)n(10)
The information about the boundary condition is in this case implicitly en-closed in the value of the yield stress of the suspensions. For our suspensionsof rigid bubbles, the yield stress is well described by equation 8, substituting
19

equation 8 into equation 10 leads to
k(φ)
k(0)=
(5 + 3φ
5− 2φ
)n+12
(1− φ)1−n2 (11)
This function is plotted in full line in figure 8, with n = 0.45, which iscommon to both emulsions. The agreement with the experimental data isqualitatively good. Suspensions in emulsion 2a show a faster increase in theconsistency than predicted, even at relatively low gas volume fraction. Thismay be linked to the beginning of growth in the yield stress at φ ∼ 30%for this system. A reason for this difference with the other investigatedsystems could be the larger droplets in this emulsion (around 5µm of radius)that get trapped between bubbles even at relatively low gas volume fraction.The continuous medium hypothesis for the suspending emulsion would thenbecome questionable.
6. Conclusion
We have experimentally studied the rheological properties of suspensionsof bubbles in model yield stress fluids. We have seen that coupling of thesuspending fluid bulk rheology to bubble deformation occurs differently de-pending on the stress applied to the sample. In the linear visco-elastic regimeof the fluid, for the range of elastic and loss capillary numbers that we haveexplored, the bubbles are deformable compared to the suspending un-yieldedfluid. Bubble addition then leads to a softening of the suspension. At yield-ing of the suspending fluid, the bubbles are generally stiff compared to thesuspending fluid, in which case the yield stress of the suspension is the sameas the one of the suspending emulsion. If the bubbles become softer and de-formable in the suspending fluid, the yield stress of the suspensions decreaseswith the gas volume fraction. During flow, which could be analysed for oursmallest bubble suspensions only, the bubbles are stiff in the suspending fluidand lead to an increase of the consistency with the gas volume fraction. Thosedistinct behaviours, entirely ruled by the gas volume fraction and bubble rela-tive stiffness, can be quantified through different capillary numbers, relevantin each regime. Based on that approach, micro-mechanical estimates, ei-ther developed to take surface tension into account (for deformable bubbles)or adapted from developments on rigid particles (when bubbles are non- orfully deformable) prove relevant and useful. Those results are independent
20

on the exact nature of the suspending fluid, especially on its microstructureand they should apply for any soft suspending material providing its macro-scopic characteristics are taken into account to compute the relevant capillarynumber. The apparent limitation to soft porous materials is not a physicalrestriction, but it allows capillary phenomena to play a role at macroscopiclength scales, whereas capillarity only needs to be considered for nanoporesin standard materials.
On-going work will be dedicated to the study of high gas volume fractions,for which the emulsion can no longer be described as a continuous medium:finite size effects are expected to occur. In this regime, bubbles are pressedagain one another because of geometrical constraints, and the droplets ofemulsion are trapped between them. The rheology of this foamy yield stressfluid is yet to be described and understood.
Acknowledgments
Financial support from Saint-Gobain Recherche is acknowledged.
Appendix
In this appendix, we discuss in more detail the stress-strain curve obtainedduring the yield stress measurement. As we impose a constant shear rate tothe initially at rest suspending emulsion, it first deforms elastically, and thenyields, leading to a stress plateau. The very beginning of the elastic regimeis linear, and the slope is equal to the elastic modulus determined duringthe oscillatory measurement. For larger strain, non-linear elasticity and/orcreep behaviour occurs, and the stress-strain curve deviates from the initialslope. We have noted that the creep behaviour of the suspending emulsions issensitive to the history of their flow. To make precise comparisons, we chooseto present data for a system on which we have systematically made twoconsecutive yield stress measurements. At the end of the first measurement,the state of the material is such that their is very little creep below the yieldstress, and we will thus use the second measurement for all that follows. Thissample preparation should allow us to probe a possible contribution of thebubble to the softening of the suspension below the yield stress.The suspensions of bubbles in the suspending emulsions exhibit the sameshape of curves, elasto-plastic with the same plateau stress as the emulsion.
21

However, we have seen that the elastic modulus decreases with φ, meaningthat the initial slope gets less and less abrupt with higher φ. To isolate thepossible contribution of the bubbles to the creep behaviour from that to thedecreasing elastic modulus in the suspensions, we introduce a reduced strainG′(φ)γ/τy(φ), which re-scales the linear elastic part of all the curves. Wethen plot τ/τy as a function of the reduced strain. In this representation, allcurves have the same initial slope (equal to 1) and the same plateau stress(equal to 1, too). The result of this operation, as well as non-rescaled curvesfor a series of suspensions, are presented for two sets of suspensions of bubblesin figure 9. We observe that the beginning of all curves is well fitted by the
0 2 4 6 80 , 0 0
0 , 2 5
0 , 5 0
0 , 7 5
1 , 0 0
0 % 1 2 % 1 5 % 2 4 % 3 7 % 4 4 %
dimen
sionle
ss str
ess
r e d u c e d s t r a i n0 1 2 3 4 5 6 7 80 , 0 0
0 , 2 5
0 , 5 0
0 , 7 5
1 , 0 0
0 % 1 3 % 1 9 % 2 9 % 3 1 % 3 7 % 6 3 %
dimen
sionle
ss str
ess
r e d u c e d s t r a i n
s t r a i n
0 , 0 0 0 , 0 5 0 , 1 0 0 , 1 5 0 , 2 0 0 , 2 505
1 01 52 02 53 0
stres
s (Pa
)
Figure 9: Stress divided by the plateau yield stress, as a function of the reduced strain,for (left) the suspensions of 50µm bubbles in emulsion 4a and (right) the suspensions of150µm bubbles in emulsion 4b. Inset: stress versus strain for the yield stress measurement(suspensions of 150µm bubbles in emulsion 4b), given for comparison. The decrease ofG′(φ) is visible. On all graphs, the region of interest is centered on the beginning of thecurves. The black line is y = x.
y = x function, which is consistent with the chosen scaling. We can alsosee that all the systems deviate from linear elasticity well before reachingyielding. However, no clear effect of the gas volume fraction is visible: fora given suspending emulsion, all the measurements seem to follow a mastercurve. The only impact of bubble addition on the elasto-plastic behaviourof the suspensions seems to be the decrease in G′(φ). No additional history-dependent or creep behaviour seems to be introduced by the bubbles.
22
References
Baravian, C., Lalante, A., Parker, A., 2002. Vane rheometry with a large,finite gap. Applied Rheology 12 (2), 81–87.
Biance, A.-L., Cohen-Addad, S., Hohler, R., 2009. Topological transitiondynamics in a strained bubble cluster. Soft Matter 5 (23), 4672–4679.
Chateau, X., Ovarlez, G., Trung, K., 2008. Homogenization approach tothe behavior of suspensions of noncolloidal particles in yield stress fluids.Journal of Rheology 52, 489.
Cloitre, M., Borrega, R., Leibler, L., 2000. Rheological aging and rejuvena-tion in microgel pastes. Physical review letters 85 (22), 4819.
Cohen-Addad, S., Hoballah, H., Hohler, R., 1998. Viscoelastic response of acoarsening foam. Physical Review E 57 (6), 6897.
Cohen-Addad, S., Hohler, R., Pitois, O., 2013. Flow in foams and flowingfoams. Annual Review of Fluid Mechanics 45 (1), 241.
Coussot, P., 2005. Rheometry of pastes, suspensions, and granular materials:applications in industry and environment. Wiley.
Dormieux, L., Kondo, D., Ulm, F.-J., 2006. Microporomechanics. Wiley. com.
Ducloue, L., Pitois, O., Goyon, J., Chateau, X., Ovarlez, G., 2014. Cou-pling of elasticity to capillarity in soft aerated materials. Soft Matter,DOI:10.1039/C4SM00200H.
Gandolfo, F. G., Rosano, H. L., 1997. Interbubble gas diffusion and thestability of foams. Journal of Colloid and Interface Science 194 (1), 31–36.
Goyon, J., Bertrand, F., Pitois, O., Ovarlez, G., Mar 2010. Shear induceddrainage in foamy yield-stress fluids. Phys. Rev. Lett. 104, 128301.URL http://link.aps.org/doi/10.1103/PhysRevLett.104.128301
Goyon, J., Colin, A., Ovarlez, G., Ajdari, A., Bocquet, L., 2008. Spatialcooperativity in soft glassy flows. Nature 454 (7200), 84–87.
23

Kao, R., Edwards, D., Wasan, D., Chen, E., 1992. Measurement of inter-facial dilatational viscosity at high rates of interface expansion using themaximum bubble pressure method. i. gas?liquid surface. Journal of colloidand interface science 148 (1), 247–256.
Kogan, M., Ducloue, L., Goyon, J., Chateau, X., Pitois, O., Ovarlez, G.,2013. Mixtures of foam and paste: suspensions of bubbles in yield stressfluids. Rheologica Acta, 1–17.
Llewellin, E., Mader, H., Wilson, S., 2002. The rheology of a bubbly liq-uid. Proceedings of the Royal Society of London. Series A: Mathematical,Physical and Engineering Sciences 458 (2020), 987–1016.
Mabille, C., Schmitt, V., Gorria, P., Leal Calderon, F., Faye, V., Deminiere,B., Bibette, J., 2000. Rheological and shearing conditions for the prepara-tion of monodisperse emulsions. Langmuir 16 (2), 422–429.
Mahaut, F., Chateau, X., Coussot, P., Ovarlez, G., 2008. Yield stress andelastic modulus of suspensions of noncolloidal particles in yield stress fluids.Journal of Rheology 52, 287.
Mason, T., Weitz, D., 1995. Optical measurements of frequency-dependentlinear viscoelastic moduli of complex fluids. Physical Review Letters 74 (7),1250–1253.
Mewis, J., Wagner, N. J., 2012. Colloidal suspension rheology. CambridgeUniversity Press.
Ovarlez, G., Mahaut, F., Bertrand, F., Chateau, X., 2011. Flows and het-erogeneities with a vane tool: Magnetic resonance imaging measurements.Journal of Rheology (1978-present) 55 (2), 197–223.
Palierne, J., 1990. Linear rheology of viscoelastic emulsions with interfacialtension. Rheologica Acta 29 (3), 204–214.
Poslinski, A., Ryan, M., Gupta, R., Seshadri, S., Frechette, F., 1988. Rhe-ological behavior of filled polymeric systems i. yield stress and shear-thinning effects. Journal of Rheology (1978-present) 32 (7), 703–735.
Rust, A., Manga, M., 2002a. Bubble shapes and orientations in low re simpleshear flow. Journal of Colloid and Interface Science 249 (2), 476–480.
24
Rust, A., Manga, M., 2002b. Effects of bubble deformation on the viscosityof dilute suspensions. Journal of Non-Newtonian Fluid Mechanics 104 (1),53–63.
Salonen, A., Lhermerout, R., Rio, E., Langevin, D., Saint-Jalmes, A., 2011.Dual gas and oil dispersions in water: production and stability of foamul-sion. Soft Matter.URL http://dx.doi.org/10.1039/C1SM06537H
Thuy Linh, N.-T., Ducloue, L., Ovarlez, G., Chateau, X., 2013. Overall prop-erties of a soft porous material: Surface tension effects. In: PoromechanicsV: Proceedings of the Fifth Biot Conference on Poromechanics. ASCE, pp.1895–1902.
van Aken, G. A., 2001. Aeration of emulsions by whipping. Colloids andSurfaces A: Physicochemical and Engineering Aspects 190 (3), 333 – 354.URL http://www.sciencedirect.com/science/article/pii/
S0927775701007099
Wildemuth, C., Williams, M., 1984. Viscosity of suspensions modeled with ashear-dependent maximum packing fraction. Rheologica acta 23 (6), 627–635.
25