rhb-osk-gs bric equity fund annual report · pdf fileannual report 2015 incorporating the...
TRANSCRIPT

RHB-OSK-GS BRIC EQUITY FUND
ANNUAL REPORT 2015
Incorporating The Audited Financial Statements
For the financial year ended 28 February 2015
Head Office19th Floor, Plaza OSK, Jalan Ampang50450 Kuala Lumpur, MalaysiaTel : +603-2164 3036Fax : +603-2164 4226Hotline : 1-800-88-3175
RHB Asset Management Sdn Bhd (174588-X)
www.rhbgroup.com
1
GENERAL INFORMATION ABOUT THE FUND
Commencement Date
RHB-OSK-GS BRIC Equity Fund (“the Fund”) commenced operations on 11January 2011.
Fund Category and Type
Fund Category - Feeder fund
Fund Type - Growth
Investment Objective, Policy and Strategy
Objective of the Fund
The Fund‟s objective is to seek to achieve long term capital appreciation throughinvestment in a collective investment scheme, which invests primarily in securities of Brazilian, Russian, Indian and Chinese companies.
Strategy
The Fund is a feeder fund that invests in the Goldman Sachs BRICs Portfolio (“Target Fund”), which invests primarily in a portfolio of equities and equity-related investment in BRIC countries or companies that participate in the markets of BRIC countries by deriving the majority (i.e. more than 50%) proportion of their total revenue or profit from such countries.
The Manager may take temporary defensive positions that may be inconsistent with the Fund‟s principal strategy in attempting to respond to adverse economic, political or any other market conditions. In such circumstances, the Manager may attempt to cushion the portfolio‟s downside by reducing its exposure into risk free assets i.e. mainly cash. It follows therefore that there is a risk that the Fund may not track the performance of the Goldman Sachs BRICs Portfolio.
If, in the opinion of the Manager, the Target Fund no longer meets the investment objective, and/or in acting in the best interests of unit holders of the Fund, the Manager may replace the Target Fund with that of another collective investment scheme that is consistent with the objective of this Fund, subject always to the approval of the unit holders of the Fund.
1

2
The asset allocation of the Fund will be as follows:-
At least 95% of Net Asset Value
- Investments in the Target Fund
Up to 5% ofNet Asset Value
- Cash and cash equivalents
Performance Benchmark
MSCI BRIC
Investment Policies and Restrictions
At least 95% of the Fund will be invested in the Target Fund. The Fund is a feeder fund that invests principally in the Goldman Sachs BRICs Portfolio, which invests primarily in a portfolio of equities and equity-related investment in BRIC countries or companies that participate in the markets of BRIC countries by deriving the majority (i.e. more than 50%) proportion of their total revenue or profit from such countries.
Fund Distribution Policy
The Fund is not expected to make any distribution.
2
3
MANAGER‟S REPORT
MARKET REVIEW
Over the course of the year from March 1st, 2014 to February 28th, 2015 the MSCI BRIC Index returned 8.68%, in USD terms, in line with the performance of developed equity markets.
In 2014, the MSCI BRIC Index was down 2.85%. The US dollar appreciated in the second half of 2014 against most emerging market currencies, notably reducing returns for many markets expressed in dollars. India and Indonesia were among the best performing markets in the world following elections of reform-minded governments. India‟s equity market also reflected the positive impact of falling oil prices on India‟s economy and inflation. In contrast, Russian equities, which were negatively impacted earlier in 2014 by economic sanctions from the West, tumbled further with the fall in oil price and subsequent depreciation of the Ruble. Brazil was also negatively impacted by weak commodity prices and market participants expected a slower pace of reforms with the re-election of its government. Despite continued weakness in the property market, signs of slowing growth and anti-corruption measures having had a greater-than-expected impact on general consumption in 2014, Chinese equities rallied at the end of the year as investors cheered a surprise rate cut and expected further easing. The Energy and Materials sectors severely declined with the sharp drop in commodity prices.
In January the MSCI BRIC Index rose 1.13%. The Reserve Bank of India surprised markets with its first rate cut since May 2013 as low oil prices continue to bring down inflation. Indian equities rallied sharply in response. Russian equities rose significantly in local terms but gains in USD were wiped out by the depreciating currency. The Ruble tumbled further as the continued drop in oil prices led to an interest rate cut from Russia‟s central bank and a sovereign credit downgrade to junk status from Standard & Poor‟s. China outperformed during the month as investors continued to expect more liquidity measures. The MSCI BRIC Index rose again in February by 4.39% bringing year-to-date returns to 5.58% (all returns in USD), with the Energy and Materials sectors outperforming on commodity price appreciation and global bullish sentiment, whilst Healthcare and Utilities sectors underperformed. The Russian equity market benefitted from the strengthening commodity prices, the appreciation in the Ruble and a surprise interest rate cut. Despite the improvement in commodity prices, Brazil modestly underperformed as ratings agency Moody‟s downgraded Petrobras, the large state-owned enterprise, to junk status, whilst Chinese equity market performed in line with the broader EM average.
3

4
REVIEW OF FUND PERFORMANCE DURING THE FINANCIAL YEAR
During the year under review, RHB-OSK-GS BRIC Equity Fund (“the Fund”) returned a 16.71%*, compared to 19.54%* for the benchmark**. The Fundholdings in India and Brazil contributed to performance whilst China and Russia detracted from performance during the period. At a sector level, Materials and Consumer Discretionary were our top performing sectors, whilst our Consumer Staples and Health Care holdings detracted from performance.
India was the best performing country in the universe, as well as the largest contributor to performance, driven by the fund holdings in the Financials sector. Bajaj Finance, a non-banking finance company engaged in consumer finance, small and medium enterprises (SME) finance and commercial lending, was the top contributor at the stock level. The company continues to perform well in terms of loan growth, margins and asset quality relative to peers. Improving consumer sentiment and a strong outlook on consumer durable sales provide a positive backdrop to Bajaj Finance‟s consumer lending businesses. The fund manager maintained an overweight position due to the company‟s healthy return ratios and attractive valuations.
Within the Consumer Discretionary Sector, Bosch was the second largest contributor to performance at the stock level during the period. Bosch is an Indiansupplier of automotive components. The stock has performed well on the back of a pick-up in growth in the passenger car and heavy commercial vehicle segments. The fund manager continued to maintain a positive view on the company given the improving demand environment.
China was the worst performing of the BRICs during the period and also the largest detractor from relative returns. The underweight position in the Telecommunications Services sector, and notably China Mobile was a large detractor. The strong stock performance was mainly due to better than expected 4G subscriber growth and ARPU (Average Revenue Per User) improvement. However, the fund manager maintained an underweight position as the competition remains intense for the whole sector and the fund manger saw limited capacity for long term profit growth.
Elsewhere in the portfolio, Sberbank was another detractor from performance and the fund manager have since exited the position in the stock. Sberbank is Russia‟slargest bank and the stock has been impacted by sanctions imposed from the West, in response to the conflict in eastern Ukraine. Given the political and economic uncertainty, combined with the devaluation of the Ruble the fund manager decided to exit the position to fund more attractive opportunities elsewhere.
* Source: Lipper Investment Management (“Lipper IM”)
4
5
MARKET OUTLOOK AND STRATEGY GOING FORWARD
Having a single, cohesive view on the macro environment in the emerging markets is difficult as country, sector and most importantly stock specific forces, as opposed to shared issues, have and will continue to drive the asset class. Consistent with this philosophy, the fund manager believe it is important to look at each of these countries, and the opportunities within these countries, independently rather than group them together into a single asset class. Truly understanding the businesses in which one is invested; recognizing where the market is mispricing companies; and being willing to accept near-term noise and volatility that macroeconomic forces can influence; will, in the fund manager‟s opinion, underpin long-term success within emerging markets. As bottom-up fundamental investors, the fund manager constantly look across a broad range of sectors, countries and market capitalisations in order to identify the most compelling investment opportunities that are trading at attractive valuations and may outperform over the market cycle. In particular, the fund manager looks for companies with strong or improving cash flows and sustainable competitive advantages that are able to withstand inflationary pressures on their margins while taking advantage of secular growth themes in these markets. Finally, the fund manager seeks to invest in companies with strong corporate governance track records, especially with respect to their treatment of minority shareholders. With the uncertainty in the markets, the fund manager believes his focus on companies with strong fundamentals and secular growth opportunities will serve us well.
Growth and Emerging markets underperformed developed markets in 2014, as many developing markets faced macroeconomic headwinds and negative headlines. The fund manager fully acknowledge these medium-term macro headwinds and incorporate them in his bottom up fundamental analysis, including the end of Chinese double-digit growth, the impact of the Fed hiking rates, as well as some country-specific challenges. These macro concerns have not changed the fund manager‟s view that emerging markets represent a core asset class for any well diversified portfolio. As investors consider their emerging markets equity allocations, the fund manager believes his purist stock selection based approach and compelling long-term track record make the GS BRICs Portfolio one of the strongest contenders within the emerging markets equity funds universe.
5
6
PERFORMANCE REVIEW
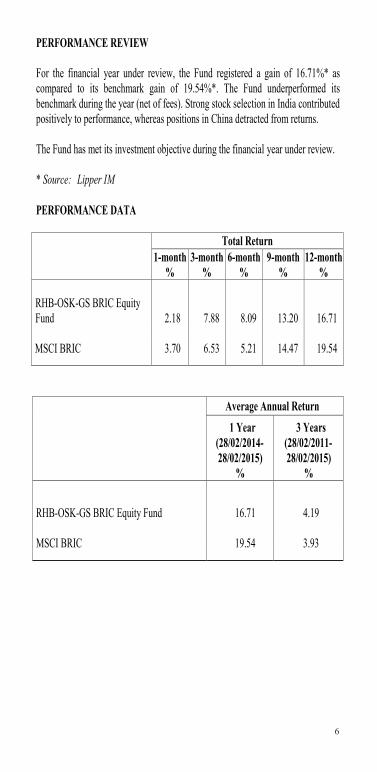
For the financial year under review, the Fund registered a gain of 16.71%* as compared to its benchmark gain of 19.54%*. The Fund underperformed its benchmark during the year (net of fees). Strong stock selection in India contributed positively to performance, whereas positions in China detracted from returns.
The Fund has met its investment objective during the financial year under review.
* Source: Lipper IM
PERFORMANCE DATA
Total Return1-month
%3-month
%6-month
%9-month
%12-month
%
RHB-OSK-GS BRIC Equity Fund 2.18 7.88 8.09 13.20 16.71
MSCI BRIC 3.70 6.53 5.21 14.47 19.54
Average Annual Return1 Year
(28/02/2014-28/02/2015)
%
3 Years(28/02/2011-28/02/2015)
%
RHB-OSK-GS BRIC Equity Fund 16.71 4.19
MSCI BRIC 19.54 3.93
6

7
Annual Total Returnfor the financial year ended
28 February2015%
2014%
2013%
RHB-OSK-GS BRIC Equity Fund- Capital Return 16.71 1.00 (4.05)- Income Return - - -- Total Return 16.71 1.00 (4.05)
MSCI BRIC 19.54 (3.24) (2.95)
* For the period since inception of the Fund
Performance of RHB-OSK-GS BRIC Equity Fund for the period from 11 January 2011 (Date of Inception) to 28 February 2015
Cumulative Return Over The Period (%)
Source: Lipper IM
1
Performance of RHB-OSK-GS BRIC Equity Fund
for the period from 11 January 2011 (Date of Inception) to 28 February 2015 Cumulative Return Over The Period (%)
Source: Lipper IM
7
8
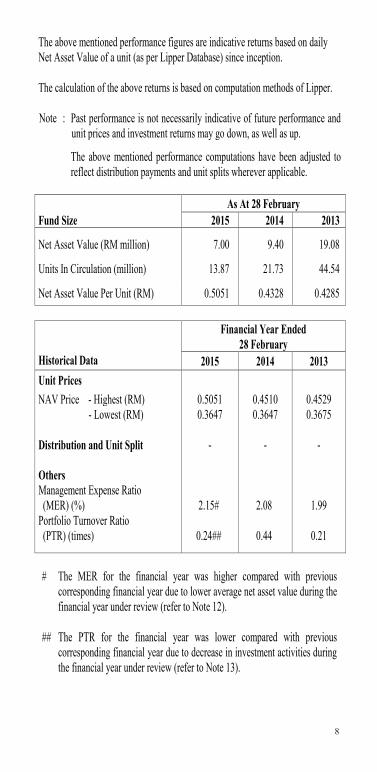
The above mentioned performance figures are indicative returns based on daily Net Asset Value of a unit (as per Lipper Database) since inception.
The calculation of the above returns is based on computation methods of Lipper.
Note : Past performance is not necessarily indicative of future performance and unit prices and investment returns may go down, as well as up.
The above mentioned performance computations have been adjusted to reflect distribution payments and unit splits wherever applicable.
As At 28 FebruaryFund Size 2015 2014 2013
Net Asset Value (RM million) 7.00 9.40 19.08
Units In Circulation (million) 13.87 21.73 44.54
Net Asset Value Per Unit (RM) 0.5051 0.4328 0.4285
Historical Data
Financial Year Ended28 February
2015 2014 2013Unit PricesNAV Price - Highest (RM) 0.5051 0.4510 0.4529 - Lowest (RM) 0.3647 0.3647 0.3675
Distribution and Unit Split - - -
OthersManagement Expense Ratio(MER) (%) 2.15# 2.08 1.99
Portfolio Turnover Ratio (PTR) (times) 0.24## 0.44 0.21
# The MER for the financial year was higher compared with previous corresponding financial year due to lower average net asset value during the financial year under review (refer to Note 12).
## The PTR for the financial year was lower compared with previous corresponding financial year due to decrease in investment activities during the financial year under review (refer to Note 13).
8

9
PORTFOLIO STRUCTURE AS AT 28 FEBRUARY 2015
The asset allocations of the Fund as at reporting date were as follows:
The asset allocations of the Fund as at reporting date were as follows:
As at 28 February2015 2014 2013
Sectors % % %Collective Investment Scheme- foreign 98.50 99.85 100.10*
Liquid assets and other netcurrent assets/(liabilities) 1.50 0.15 (0.10)
100.00 100.00 100.00
The asset allocation reflects the Fund‟s strategy to have maximum exposure to the investments. During the financial year under review, the asset allocation was relatively unchanged and was well-invested.
* The excess over 100% is attributable to provision made for expenses for the month ended 28 February 2013, which has not yet been paid as at 28 February 2013.
Collective Investment
Scheme- Foreign98.50%
Liquid assets and other net current
assets1.50%
9
10
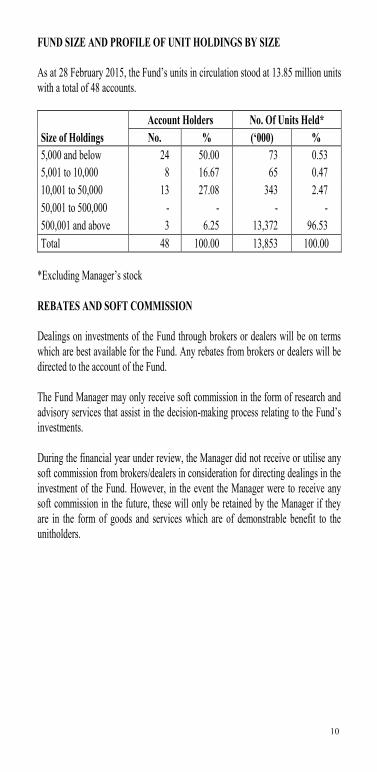
FUND SIZE AND PROFILE OF UNIT HOLDINGS BY SIZE
As at 28 February 2015, the Fund‟s units in circulation stood at 13.85 million units with a total of 48 accounts.
Account Holders No. Of Units Held*Size of Holdings No. % („000) %5,000 and below 24 50.00 73 0.535,001 to 10,000 8 16.67 65 0.4710,001 to 50,000 13 27.08 343 2.4750,001 to 500,000 - - - -500,001 and above 3 6.25 13,372 96.53Total 48 100.00 13,853 100.00
*Excluding Manager‟s stock
REBATES AND SOFT COMMISSION
Dealings on investments of the Fund through brokers or dealers will be on terms which are best available for the Fund. Any rebates from brokers or dealers will be directed to the account of the Fund.
The Fund Manager may only receive soft commission in the form of research and advisory services that assist in the decision-making process relating to the Fund‟s investments.
During the financial year under review, the Manager did not receive or utilise any soft commission from brokers/dealers in consideration for directing dealings in the investment of the Fund. However, in the event the Manager were to receive any soft commission in the future, these will only be retained by the Manager if they are in the form of goods and services which are of demonstrable benefit to the unitholders.
10

11
RHB-OSK-GS BRIC EQUITY FUND STATEMENT OF FINANCIAL POSITION AS AT 28 FEBRUARY 2015
Note 2015 2014 RM RM
ASSETS Financial assets at fair value through profit or loss 5 6,897,610 9,389,201
Deposits with licensed financial institutions 6 115,132 -
Bank balance 6 6,188 50,652 Amount due from Manager 12,114 853
───────── ─────────TOTAL ASSETS 7,031,044 9,440,706
───────── ─────────
LIABILITIES Amount due to Manager - 10,302 Accrued management fee 9,720 13,381Amount due to Trustee 5,787 2,223 Other payables and accruals 7 13,009 11,555
───────── ─────────TOTAL LIABILITIES 28,516 37,461
───────── ─────────NET ASSET VALUE 7,002,528 9,403,245
═════════ ═════════
UNITHOLDERS‟ FUNDSUnitholders‟ capital 12,048,795 15,646,528 Accumulated losses (5,046,267) (6,243,283)
───────── ───────── 7,002,528 9,403,245 ═════════ ═════════
UNITS IN CIRCULATION 8 13,865,000 21,725,000 ═════════ ═════════
NET ASSET VALUE PER UNIT 0.5051 0.4328 ═════════ ═════════
The accompanying notes are an integral part of the financial statements.
11

12
RHB-OSK-GS BRIC EQUITY FUND STATEMENT OF COMPREHENSIVE INCOME FOR THE FINANCIAL YEAR ENDED 28 FEBRUARY 2015
Note 2015 2014 RM RM
INVESTMENT INCOME/(LOSS) Interest income from deposits with licensed financial institutions 2,330 2,250
Net gain on financial assets at fair value through profit or loss (“FVTPL”) 5 1,393,503 2
Net foreign currency exchange loss (20,700) (27,599) ───────── ─────────
1,375,133 (25,347) ───────── ─────────
EXPENSES Management fee 9 (153,391) (239,478) Trustee‟s fee 10 (12,000) (12,000) Audit fee (6,000) (6,000) Tax agent‟s fee (5,000) (8,200) Other expenses (1,726) (2,387)
───────── ───────── (178,117) (268,065) ───────── ─────────
Profit/(loss) before taxation 1,197,016 (293,412)
Taxation 11 - -───────── ─────────
Profit/(loss) after taxation and total comprehensive income/(loss) for the financial year 1,197,016 (293,412)
═════════ ═════════
Profit/(loss) after taxation is made up of the following: Realised amount (259,797) (1,855,394) Unrealised amount 1,456,813 1,561,982
───────── ───────── 1,197,016 (293,412) ═════════ ═════════
The accompanying notes are an integral part of the financial statements. 12
13
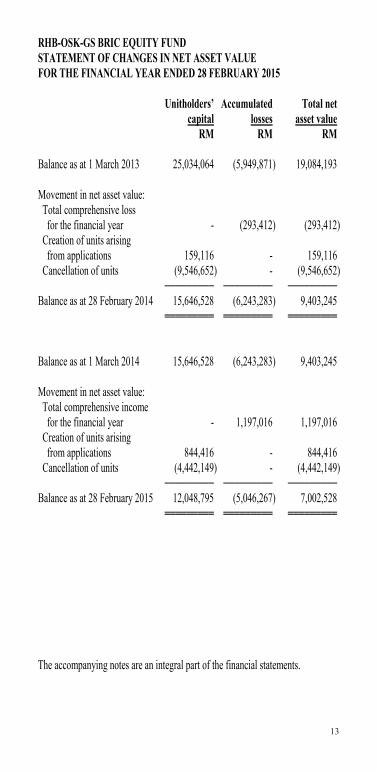
RHB-OSK-GS BRIC EQUITY FUND STATEMENT OF CHANGES IN NET ASSET VALUE FOR THE FINANCIAL YEAR ENDED 28 FEBRUARY 2015
Unitholders‟ Accumulated Total net capital losses asset value
RM RM RM
Balance as at 1 March 2013 25,034,064 (5,949,871) 19,084,193
Movement in net asset value: Total comprehensive loss for the financial year - (293,412) (293,412)
Creation of units arisingfrom applications 159,116 - 159,116
Cancellation of units (9,546,652) - (9,546,652)───────── ───────── ─────────
Balance as at 28 February 2014 15,646,528 (6,243,283) 9,403,245═════════ ═════════ ═════════
Balance as at 1 March 2014 15,646,528 (6,243,283) 9,403,245
Movement in net asset value: Total comprehensive income for the financial year - 1,197,016 1,197,016
Creation of units arisingfrom applications 844,416 - 844,416
Cancellation of units (4,442,149) - (4,442,149) ───────── ───────── ─────────
Balance as at 28 February 2015 12,048,795 (5,046,267) 7,002,528═════════ ═════════ ═════════
The accompanying notes are an integral part of the financial statements.
13
14
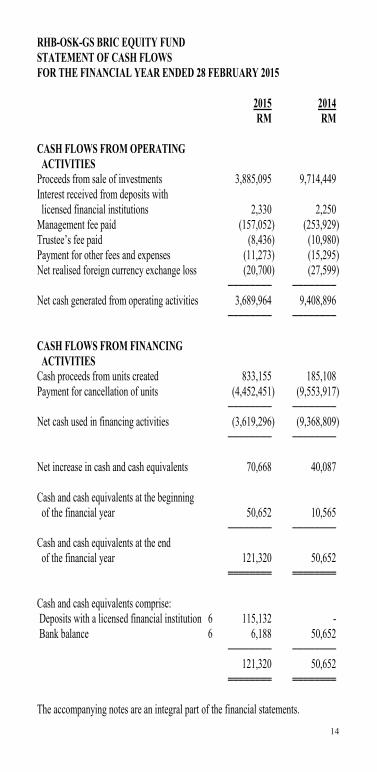
RHB-OSK-GS BRIC EQUITY FUND STATEMENT OF CASH FLOWS FOR THE FINANCIAL YEAR ENDED 28 FEBRUARY 2015
2015 2014 RM RM
CASH FLOWS FROM OPERATING ACTIVITIES
Proceeds from sale of investments 3,885,095 9,714,449 Interest received from deposits with licensed financial institutions 2,330 2,250
Management fee paid (157,052) (253,929) Trustee‟s fee paid (8,436) (10,980) Payment for other fees and expenses (11,273) (15,295) Net realised foreign currency exchange loss (20,700) (27,599)
──────── ────────Net cash generated from operating activities 3,689,964 9,408,896
──────── ────────
CASH FLOWS FROM FINANCING ACTIVITIES
Cash proceeds from units created 833,155 185,108 Payment for cancellation of units (4,452,451) (9,553,917)
──────── ────────Net cash used in financing activities (3,619,296) (9,368,809)
──────── ────────
Net increase in cash and cash equivalents 70,668 40,087
Cash and cash equivalents at the beginning of the financial year 50,652 10,565
──────── ────────Cash and cash equivalents at the end of the financial year 121,320 50,652
════════ ════════
Cash and cash equivalents comprise: Deposits with a licensed financial institution 6 115,132 - Bank balance 6 6,188 50,652
──────── ────────121,320 50,652
════════ ════════
The accompanying notes are an integral part of the financial statements. 14

15
RHB-OSK-GS BRIC EQUITY FUND NOTES TO THE FINANCIAL STATEMENTS FOR THE FINANCIAL YEAR ENDED 28 FEBRUARY 2015
1 THE FUND, THE MANAGER AND THEIR PRINCIPAL ACTIVITIES
The RHB-OSK-GS BRIC Equity Fund (hereinafter referred to as “the Fund”) was constituted pursuant to the execution of a Fifth Supplemental Master Deed dated 26 April 2010 between RHB Asset Management Sdn Bhd (“the Manager”), TMF Trustees Malaysia Berhad (“the Trustee”) and the registered Unitholders of the Fund. The Fund is governed by a Master Deed dated 12 June 2008 and subsequent Supplemental Master Deeds (collectively referred to as “the Deeds”).
The Fund was launched on 11 January 2011 and will continue its operations until terminated as provided under Clause 4 of the Master Deed.
The principal activity of the Fund is to invest in „Permitted Investments‟ as defined under Item 15 of Schedule 13 of Annexure 1 of the Fifth Supplemental Master Deed, which comprises one collective investment scheme (local or foreign) provided it is not a fund-of-funds or a feeder fund or any sub-fund of an umbrella fund which is a fund-of-funds or a feeder fund, deposits and money market instruments and any other form of investments as may be approved by the relevant authorities from time to time. The Fund is a feeder fund that invests in the Goldman Sachs BRICs Portfolio, a “Target Fund” that managed by Goldman Sachs Asset Management International, as defined under Item 18 of Schedule 13 of Annexure 1 of the Fifth Supplemental Master Deed.
If, in the opinion of the Manager, the Target Fund no longer meets the Fund‟s investment objective, and/or in acting in the best interests of Unitholders, the Manager may replace the Target Fund with that of another collective investment scheme that is consistent with the objective of this Fund, subject always to the approval of the Unitholders.
All investments will be subject to the Securities Commission‟s (“SC”) Guidelines on Unit Trust Funds, SC requirements, the Deeds, except where exemptions or variations have been approved by the SC, internal policies and procedures and objective of the Fund.
The main objective of the Fund is to seek to achieve long-term capital appreciation through investment in a collective investment scheme, which invests primarily in securities of Brazilian, Russian, Indian and Chinese companies.
15

16
1 THE FUND, THE MANAGER AND THEIR PRINCIPAL ACTIVITIES (CONTINUED)
The Manager, a company incorporated in Malaysia, is a wholly-owned subsidiary of RHB Investment Bank Berhad, effective 6 January 2003. Its principal activities include rendering of investment management services, management of unit trust funds and private retirement schemes and provision of investment advisory services.
These financial statements were authorised for issue by the Manager on 24 April 2015.
2 SUMMARY OF SIGNIFICANT ACCOUNTING POLICIES
The financial statements have been prepared under the historical cost convention, as modified by financial assets and financial liabilities (including derivatives instruments) at fair value through profit or loss, except as disclosed in this summary of significant accounting policies, and in accordance with Malaysian Financial Reporting Standards (“MFRS”) and International Financial Reporting Standards (“IFRS”).
The preparation of financial statements in conformity with MFRS and IFRS requires the use of certain critical accounting estimates and assumptions that affect the reported amounts of assets and liabilities and disclosure of contingent assets and liabilities at the date of the financial statements, and the reported amounts of revenues and expenses during the reported period. It also requires the Manager to exercise its judgment in the process of applying the Fund‟s accounting policies. Although these estimates and judgment are based on the Manager‟s best knowledge of current events and actions, actual results may differ.
(a) The new standards and amendments to published standards which are relevant to the Fund but not yet effective and have not been early adopted are as follows:
(i) Financial year beginning on/after 1 March 2017
MFRS 15 “Revenue from Contracts with Customers” (effective from 1 January 2017) deals with revenue recognition and establishes principles for reporting useful information to users of financial statements about the nature, amount, timing and uncertainty of revenue and cash flows arising from an entity‟s contracts with customers. Revenue is recognised when a customer obtains control of a good or service and thus has the ability to direct the use and obtain the benefits from the good or service. The standard replaces MFRS 118 “Revenue” and MFRS 111 “Construction Contracts” and related interpretations.
16
17
2 SUMMARY OF SIGNIFICANT ACCOUNTING POLICIES
2.1 Basis of preparation of the financial statements (Continued)
(a) The new standards and amendments to published standards which are relevant to the Fund but not yet effective and have not been early adopted are as follows: (continued)
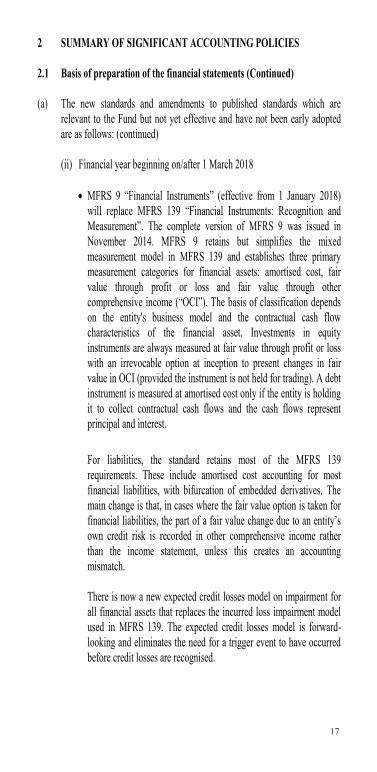
(ii) Financial year beginning on/after 1 March 2018
MFRS 9 “Financial Instruments” (effective from 1 January 2018) will replace MFRS 139 “Financial Instruments: Recognition and Measurement”. The complete version of MFRS 9 was issued in November 2014. MFRS 9 retains but simplifies the mixed measurement model in MFRS 139 and establishes three primary measurement categories for financial assets: amortised cost, fair value through profit or loss and fair value through other comprehensive income (“OCI”). The basis of classification dependson the entity's business model and the contractual cash flow characteristics of the financial asset. Investments in equity instruments are always measured at fair value through profit or loss with an irrevocable option at inception to present changes in fair value in OCI (provided the instrument is not held for trading). A debt instrument is measured at amortised cost only if the entity is holding it to collect contractual cash flows and the cash flows represent principal and interest.
For liabilities, the standard retains most of the MFRS 139 requirements. These include amortised cost accounting for most financial liabilities, with bifurcation of embedded derivatives. The main change is that, in cases where the fair value option is taken for financial liabilities, the part of a fair value change due to an entity‟s own credit risk is recorded in other comprehensive income rather than the income statement, unless this creates an accounting mismatch.
There is now a new expected credit losses model on impairment for all financial assets that replaces the incurred loss impairment model used in MFRS 139. The expected credit losses model is forward-looking and eliminates the need for a trigger event to have occurred before credit losses are recognised.
17

18
2 SUMMARY OF SIGNIFICANT ACCOUNTING POLICIES (CONTINUED)
2.1 Basis of preparation of the financial statements (Continued)
(a) The new standards and amendments to published standards which are relevant to the Fund but not yet effective and have not been early adopted are as follows: (continued)
(ii) Financial year beginning on/after 1 March 2018 (continued)
MFRS 9 relaxes the requirements for hedge effectiveness by replacing the bright line hedge effectiveness tests. It requires an economic relationship between the hedged item and hedging instrument and for the “hedged ratio” to be the same as the one management actually use for risk management purposes.
The above standards are not expected to have a significant impact on the Fund‟s financial statements.
2.2 Financial assets
Classification
Financial assets are designated as fair value through profit or loss when they are managed and their performance are evaluated on a fair value basis.
The Fund designates its investment in collective investment scheme as financial assets at fair value through profit or loss at inception.
Loans and receivables are non-derivative financial assets with fixed or determinable payments that are not quoted in an active market and have been included in current assets. The Fund‟s loans and receivables comprise cash and cash equivalents and amount due from Manager which are all due within 12 months.
18

19
2 SUMMARY OF SIGNIFICANT ACCOUNTING POLICIES (CONTINUED)
2.2 Financial assets (Continued)
Recognition and measurement
Regular purchases and sales of financial assets are recognised on the trade date, the date on which the Fund commits to purchase or sell the asset. Investments are initially recognised at fair value.
Financial assets are de-recognised when the rights to receive cash flows from the investments have expired or have been transferred and the Fund has transferred substantially all risks and rewards of ownership.
Unrealised gains or losses arising from changes in the fair value of the „financial assets at fair value through profit or loss‟ category including the effects of currency translation are presented in profit or loss within net gain or loss on financial assets at fair value through profit or loss in the financial year which they arise.
Collective investment schemes are valued based on the last published net asset value per unit or share of such collective investment schemes at each reporting year.
If a valuation based on the market price does not represent the fair value of the securities, for example during abnormal market conditions or when no market price is available, including in the event of a suspension in the quotation of the securities for a period exceeding 14 days, or such shorter period as agreed by the Trustee, then the securities are valued as determined in good faith by the Manager, based on the methods or bases approved by the Trustee after appropriate technical consultation.
Deposits with licensed financial institutions are stated at cost plus accrued interest calculated on the effective interest method over the year from the date of placement to the date of maturity of the respective deposits, which is a reasonable estimate of fair value due to the short-term nature of the deposits.
Loans and receivables are subsequently carried at amortised cost using the effective interest method.
19

20
2 SUMMARY OF SIGNIFICANT ACCOUNTING POLICIES (CONTINUED)
2.2 Financial assets (Continued)
Impairment of financial assets
For assets carried at amortised cost, the Fund assesses at the end of the reporting year whether there is objective evidence that a financial asset or group of financial assets is impaired. A financial asset or a group of financial assets is impaired and impairment losses are incurred only if there is objective evidence of impairment as a result of one or more events that occurred after the initial recognition of the asset (a „loss event‟) and that loss event (or events) has an impact on the estimated future cash flows of the financial asset or group of financial assets that can be reliably estimated.
The amount of the loss is measured as the difference between the asset‟s carrying amount and the present value of estimated future cash flows (excluding future credit losses that have not been incurred) discounted at the financial asset‟s original effective interest rate. The carrying amount is reduced and the amount of the loss is recognised in profit or loss. If „loans and receivables‟ has a variable interest rate, the discount rate for measuring any impairment loss is the current effective interest rate determined under the contract. As a practical expedient, the Fund may measure impairment on the basis of an instrument‟s fair value using an observable market price.
If, in a subsequent year, the amount of the impairment loss decreases and the decrease can be related objectively to an event occurring after the impairment was recognised (such as an improvement in the debtor‟s credit rating), the reversal of the previously recognised impairment loss is recognised in profit or loss. When an asset is uncollectible, it is written off against the related allowance account. Such assets are written off after all the necessary procedures have been completed and the amount of the loss has been determined.
20

21
2 SUMMARY OF SIGNIFICANT ACCOUNTING POLICIES (CONTINUED)
2.3 Financial liabilities
Financial liabilities are classified according to the substance of the contractual arrangements entered into and the definitions of a financial liability.
Financial liabilities, within the scope of MFRS 139 “Financial Instruments: Recognition and Measurement”, are recognised in the statement of financial position when, and only when, the Fund becomes a party to the contractual provisions of the financial instrument.
The Fund‟s financial liabilities which include amount due to Manager, accrued management fee, amount due to Trustee and other payables and accruals are recognised initially at fair value plus directly attributable transaction costs and subsequently measured at amortised cost using the effective interest method.
A financial liability is de-recognised when the obligation under the liability is extinguished. Gains and losses are recognised in profit or loss when the liabilities are de-recognised, and through the amortisation process.
2.4 Creation and cancellation of units
The Fund issues cancellable units, which are cancelled at the unitholder‟s option and are classified as equity. Cancellable units can be put back to the Fund at any time for cash equal to a proportionate share of the Fund‟s net asset value. The outstanding units are carried at the redemption amount that is payable at each reporting year if the unitholder exercises the right to put the unit back to the Fund.
Units are created and cancelled at the unitholder‟s option at prices based on the Fund‟s net asset value per unit at the time of creation or cancellation. The Fund‟s net asset value per unit is calculated by dividing the total net asset value with the total number of outstanding units.
2.5 Unitholders‟ capital
The unitholders‟ contributions to the Fund meet the definition of puttable instruments classified as equity instruments under MFRS 132 “Financial Instruments: Presentation”.
21

22
2 SUMMARY OF SIGNIFICANT ACCOUNTING POLICIES (CONTINUED)
2.6 Income recognition
Interest income from deposits with licensed financial institutions is recognised on an accrual basis using the effective interest method.
Realised gain or loss on sale of the collective investment scheme is arrived at after accounting for cost of investments, determined on the weighted average cost method.
2.7 Taxation
Current tax expense is determined according to Malaysian tax laws and includes all taxes based upon the taxable income earned during the financial year.
Tax on income distribution from foreign collective investment scheme is based on the tax regime of the respective country that the Fund invests in.
2.8 Cash and cash equivalents
For the purpose of the statement of cash flows, cash and cash equivalents comprise bank balance and deposits with licensed financial institutions that are readily convertible to known amounts of cash and which are subject to an insignificant risk of changes in value.
2.9 Presentation and functional currency
Items included in the financial statements of the Fund are measured using the currency of the primary economic environment in which the Fund operates (the “functional currency”). The financial statements are presented in Ringgit Malaysia, which is the Fund‟s presentation and functional currency.
2.10 Foreign currency translation
Foreign currency transactions in the Fund are accounted for at exchange rates prevailing at the transaction dates. Foreign currency monetary assets and liabilities are translated at exchange rates prevailing at the reporting date. Exchange differences arising from the settlement of foreign currency transactions and from the translation of foreign currency monetary assets and liabilities are recognised in profit or loss.
22
23
2 SUMMARY OF SIGNIFICANT ACCOUNTING POLICIES (CONTINUED)
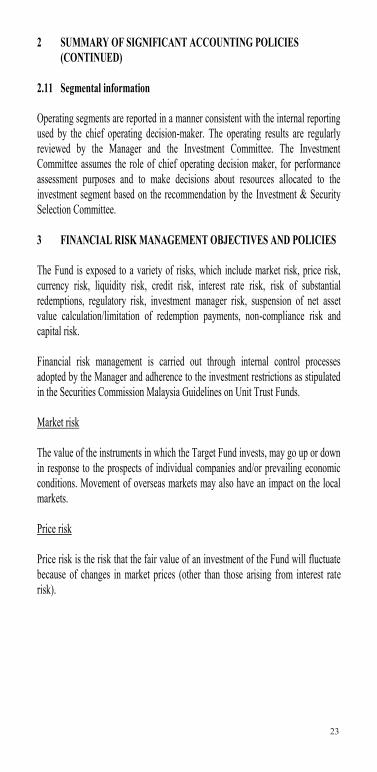
2.11 Segmental information
Operating segments are reported in a manner consistent with the internal reporting used by the chief operating decision-maker. The operating results are regularly reviewed by the Manager and the Investment Committee. The Investment Committee assumes the role of chief operating decision maker, for performance assessment purposes and to make decisions about resources allocated to the investment segment based on the recommendation by the Investment & Security Selection Committee.
3 FINANCIAL RISK MANAGEMENT OBJECTIVES AND POLICIES
The Fund is exposed to a variety of risks, which include market risk, price risk, currency risk, liquidity risk, credit risk, interest rate risk, risk of substantial redemptions, regulatory risk, investment manager risk, suspension of net asset value calculation/limitation of redemption payments, non-compliance risk and capital risk.
Financial risk management is carried out through internal control processes adopted by the Manager and adherence to the investment restrictions as stipulated in the Securities Commission Malaysia Guidelines on Unit Trust Funds.
Market risk
The value of the instruments in which the Target Fund invests, may go up or down in response to the prospects of individual companies and/or prevailing economic conditions. Movement of overseas markets may also have an impact on the local markets.
Price risk
Price risk is the risk that the fair value of an investment of the Fund will fluctuate because of changes in market prices (other than those arising from interest raterisk).
23

24
3 FINANCIAL RISK MANAGEMENT OBJECTIVES AND POLICIES
Price risk (continued)
The Fund‟s overall exposure to price risk was as follows:
2015 2014 RM RM
Financial assets at fair value through profit or loss 6,897,610 9,389,201 ════════ ════════
The table below summarises the sensitivity of the Fund‟s net asset value and profit after tax to movements in prices of investments. The analysis is based on the assumption that the price of the investments fluctuates by 5% with all other variables held constant.
Change in price of investment
%
Marketvalue
RM
Impact onprofit after tax and
net asset valueRM
2015-5 6,552,729 (344,881)0 6,897,610 -5 7,242,491 344,881
═════════ ═════════ ═════════
2014-5 8,919,741 (469,460)0 9,389,201 -5 9,858,661 469,460
═════════ ═════════ ═════════Currency risk
The Fund invests up to 95% of its net asset value in the Target Fund denominated in US Dollar (“USD”). Fluctuation in foreign exchange rates will affect the value of the Fund‟s foreign investments when converted into local currency and subsequently the value of unitholders‟ investments. When USD moves unfavourably against the Ringgit, these investments will suffer currency losses.
24
25
3 FINANCIAL RISK MANAGEMENT OBJECTIVES AND POLICIES (CONTINUED)
Currency risk (continued)
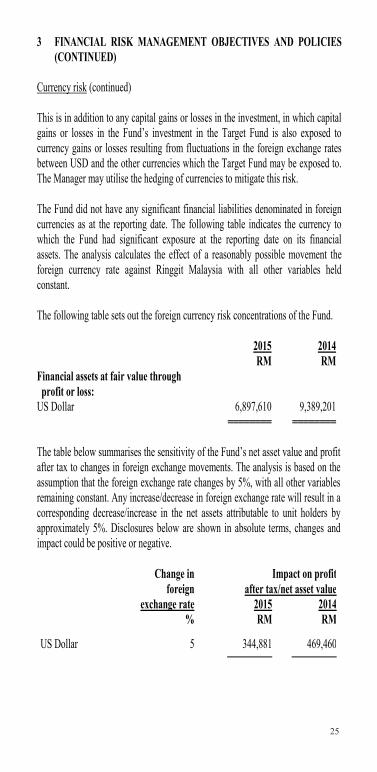
This is in addition to any capital gains or losses in the investment, in which capital gains or losses in the Fund‟s investment in the Target Fund is also exposed to currency gains or losses resulting from fluctuations in the foreign exchange rates between USD and the other currencies which the Target Fund may be exposed to. The Manager may utilise the hedging of currencies to mitigate this risk.
The Fund did not have any significant financial liabilities denominated in foreign currencies as at the reporting date. The following table indicates the currency to which the Fund had significant exposure at the reporting date on its financial assets. The analysis calculates the effect of a reasonably possible movement the foreign currency rate against Ringgit Malaysia with all other variables held constant.
The following table sets out the foreign currency risk concentrations of the Fund.
2015 2014 RM RM
Financial assets at fair value through profit or loss:
US Dollar 6,897,610 9,389,201 ════════ ════════
The table below summarises the sensitivity of the Fund‟s net asset value and profit after tax to changes in foreign exchange movements. The analysis is based on the assumption that the foreign exchange rate changes by 5%, with all other variables remaining constant. Any increase/decrease in foreign exchange rate will result in a corresponding decrease/increase in the net assets attributable to unit holders by approximately 5%. Disclosures below are shown in absolute terms, changes and impact could be positive or negative.
Change in foreign
exchange rate
Impact on profitafter tax/net asset value
2015 2014% RM RM
US Dollar 5 344,881 469,460
25
26
3 FINANCIAL RISK MANAGEMENT OBJECTIVES AND POLICIES (CONTINUED)
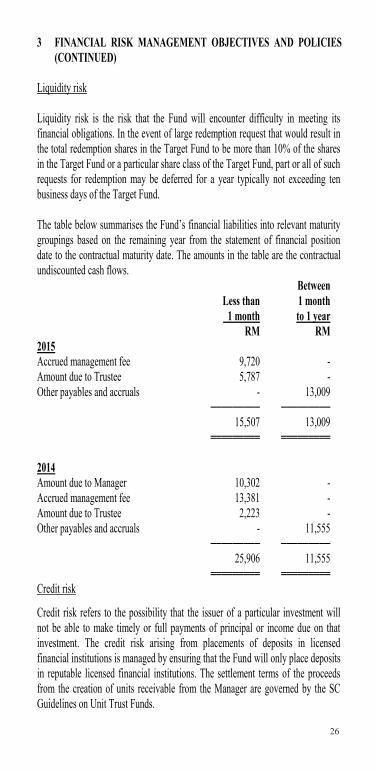
Liquidity risk
Liquidity risk is the risk that the Fund will encounter difficulty in meeting its financial obligations. In the event of large redemption request that would result in the total redemption shares in the Target Fund to be more than 10% of the shares in the Target Fund or a particular share class of the Target Fund, part or all of such requests for redemption may be deferred for a year typically not exceeding ten business days of the Target Fund.
The table below summarises the Fund‟s financial liabilities into relevant maturity groupings based on the remaining year from the statement of financial position date to the contractual maturity date. The amounts in the table are the contractual undiscounted cash flows.
Between Less than 1 month 1 month to 1 year RM RM2015 Accrued management fee 9,720 - Amount due to Trustee 5,787 -Other payables and accruals - 13,009 ───────── ─────────
15,507 13,009 ═════════ ═════════
2014 Amount due to Manager 10,302 -Accrued management fee 13,381 - Amount due to Trustee 2,223 -Other payables and accruals - 11,555 ───────── ─────────
25,906 11,555 ═════════ ═════════Credit risk
Credit risk refers to the possibility that the issuer of a particular investment will not be able to make timely or full payments of principal or income due on that investment. The credit risk arising from placements of deposits in licensed financial institutions is managed by ensuring that the Fund will only place deposits in reputable licensed financial institutions. The settlement terms of the proceeds from the creation of units receivable from the Manager are governed by the SC Guidelines on Unit Trust Funds.
26

27
3 FINANCIAL RISK MANAGEMENT OBJECTIVES AND POLICIES (CONTINUED)
Credit risk (continued)
The following table sets out the credit risk concentrations of the Fund:
Cash andcash
equivalentsRM
Otherfinancial
assets*RM
TotalRM
2015Financial institutions:- AAA 6,188 - 6,188- AA3 115,132 - 115,132Others - 12,114 12,114
121,320 12,114 133,434
2014Financial institutions:- AAA 50,652 - 50,652Others - 853 853
50,652 853 51,505
* Comprise amount due from Manager
The financial assets of the Fund are neither past due nor impaired.
Interest rate risk
Interest rate risk is the risk that the cost or the value of the financial instruments will fluctuate due to changes in market interest rates. The Fund‟s exposure to the interest rate risk is mainly from short term placements with financial institutions. In order to mitigate interest rates exposure of the Fund, the Manager will manage the duration of the portfolio via shorter or longer tenured assets depending on the view of the future interest rate trend of the Manager, which is based on its continuous fundamental research and analysis.
27
28
3 FINANCIAL RISK MANAGEMENT OBJECTIVES AND POLICIES (CONTINUED)
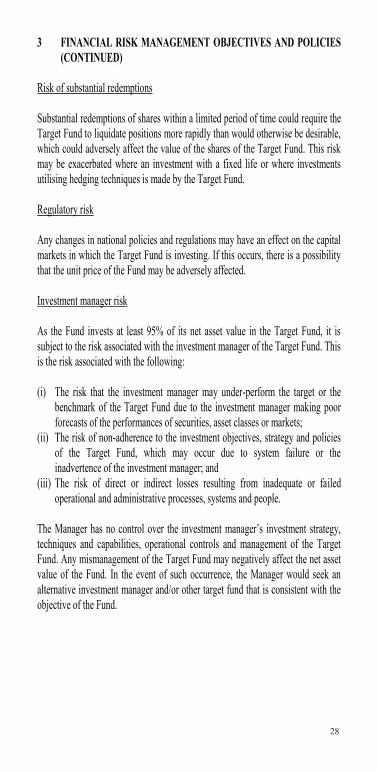
Risk of substantial redemptions
Substantial redemptions of shares within a limited period of time could require the Target Fund to liquidate positions more rapidly than would otherwise be desirable, which could adversely affect the value of the shares of the Target Fund. This risk may be exacerbated where an investment with a fixed life or where investments utilising hedging techniques is made by the Target Fund.
Regulatory risk
Any changes in national policies and regulations may have an effect on the capital markets in which the Target Fund is investing. If this occurs, there is a possibility that the unit price of the Fund may be adversely affected.
Investment manager risk
As the Fund invests at least 95% of its net asset value in the Target Fund, it is subject to the risk associated with the investment manager of the Target Fund. This is the risk associated with the following:
(i) The risk that the investment manager may under-perform the target or the benchmark of the Target Fund due to the investment manager making poor forecasts of the performances of securities, asset classes or markets;
(ii) The risk of non-adherence to the investment objectives, strategy and policies of the Target Fund, which may occur due to system failure or the inadvertence of the investment manager; and
(iii) The risk of direct or indirect losses resulting from inadequate or failed operational and administrative processes, systems and people.
The Manager has no control over the investment manager‟s investment strategy, techniques and capabilities, operational controls and management of the Target Fund. Any mismanagement of the Target Fund may negatively affect the net asset value of the Fund. In the event of such occurrence, the Manager would seek an alternative investment manager and/or other target fund that is consistent with the objective of the Fund.
28

29
3 FINANCIAL RISK MANAGEMENT OBJECTIVES AND POLICIES (CONTINUED)
Suspension of net asset value calculation/limitation of redemption payments
The Umbrella Fund may in certain circumstances temporarily suspend the determination of the net asset value per share of the Target Fund or a specific share class of the Target Fund and the issue, redemption or exchange of shares or a particular share class in the Target Fund.
As further described in the prospectus of the Target Fund, if on any given date requests for redemption of shares relate to more than 10% of the shares in the Target Fund or a particular share class of the Target Fund, part or all of such requests for redemption may be deferred for a period typically not exceeding ten (10) business days of the Target Fund.
Non-compliance risk
This is the risk of the Manager not complying with the internal policies, the Deeds of the Fund, all applicable laws or guidelines issued by the regulators. This may occur as a result of system failure or the inadvertence of the Manager. The magnitude of such risk and its impact on the Fund and/or unitholders are dependent on the nature and severity of the non-compliance. Non-compliance may adversely affect the Fund especially if the investment of the Fund has to be disposed at a lower price to rectify the non-compliance.
Capital risk
The capital of the Fund is represented by equity consisting of unitholders‟ capital and accumulated losses. The amount of equity can change significantly on a daily basis as the Fund is subject to daily subscriptions and redemptions at the discretion of unitholders. The Fund‟s objective when managing capital is to safeguard the Fund‟s ability to continue as a going concern in order to provide returns for unitholders and benefits for other stakeholders and to maintain a strong capital base to support the development of the investment activities of the Fund.
29
30
4 FAIR VALUE ESTIMATION
Fair value is defined as the price that would be received to sell an asset or paid to transfer a liability in an orderly transaction between market participants at the measurement date (i.e. an exit price).
The fair value of financial assets traded in active market (such as publicly traded derivatives and trading securities) are based on quoted market prices at the close of trading on the financial year end date.
An active market is a market in which transactions for the asset or liability take place with sufficient frequency and volume to provide pricing information on an ongoing basis.
The fair value of financial assets that are not traded in an active market is determined by using valuation techniques. The Fund uses a variety of methods and makes assumptions that are based on market conditions existing at each year end date. Valuation techniques used for non-standardised financial instruments such as options, currency swaps and other over-the-counter derivatives, include the use of comparable recent arm‟s length transactions, reference to other instruments that are substantially the same, discounted cash flow analysis, option pricing models and other valuation techniques commonly used by market participants making the maximum use of market inputs and relying as little as possible on entity-specific inputs.
For instruments for which there is no active market, the Fund may use internally developed models, which are usually based on valuation methods and techniques generally recognised as standard within the industry. Valuation models are used primarily to value unlisted equity, debt securities and other debt instruments for which market were or have been inactive during the financial year. Some of the inputs to these models may not be market observable and are therefore estimated based on assumptions.
The output of a model is always an estimate or approximation of a value that cannot be determined with certainty, and valuation techniques employed may not fully reflect all factors relevant to the positions the Fund holds.
Valuations are therefore adjusted, where appropriate, to allow for additional factors including model risk, liquidity risk and counterparty risk.
30
31
4 FAIR VALUE ESTIMATION (CONTINUED)
The fair values are based on the following methodologies and assumptions:
(i) For bank balances, deposits and placements with financial institutions with maturities less than 1 year, the carrying value is a reasonable estimate of fair value.
(ii) The carrying values less impairment of receivables and payables are assumed to approximate their fair values due to their short term nature.
Fair value hierarchy
The Fund adopted MFRS 13 “Fair Value Measurement” in respect of disclosures about the degree of reliability of fair value measurement. This requires the Fund to classify fair value measurements using a fair value hierarchy that reflects the significance of the inputs used in making the measurements. The fair value hierarchy has the following levels:
Level 1: Quoted prices (unadjusted) in active market for identical assets or liabilities
Level 2: Inputs other than quoted prices included within level 1 that are observable for the asset or liability, either directly (that is, as prices) or indirectly (that is, derived from prices)
Level 3: Inputs for the asset and liability that are not based on observable market data (that is, unobservable inputs)
The level in the fair value hierarchy within which the fair value measurement is categorised in its entirety is determined on the basis of the lowest level input that is significant to the fair value measurement in its entirety. For this purpose, the significance of an input is assessed against the fair value measurement in its entirety. If a fair value measurement uses observable inputs that require significant adjustment based on unobservable inputs, that measurement is a level 3 measurement. Assessing the significance of a particular input to the fair value measurement in its entirety requires judgment, considering factors specific to the asset or liability.
The determination of what constitutes „observable‟ requires significant judgment by the Fund. The Fund considers observable data to be that market data that is readily available, regularly distributed or updated, reliable and verifiable, not proprietary, and provided by independent sources that are actively involved in the relevant market.
31
32
4 FAIR VALUE ESTIMATION (CONTINUED)
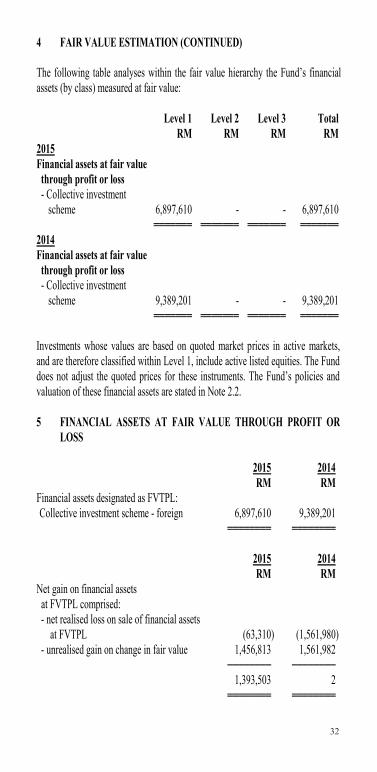
The following table analyses within the fair value hierarchy the Fund‟s financial assets (by class) measured at fair value:
Level 1 Level 2 Level 3 Total RM RM RM RM2015 Financial assets at fair value through profit or loss - Collective investment
scheme 6,897,610 - - 6,897,610 ═══════ ═══════ ═══════ ═══════2014 Financial assets at fair value through profit or loss - Collective investment
scheme 9,389,201 - - 9,389,201 ═══════ ═══════ ═══════ ═══════
Investments whose values are based on quoted market prices in active markets, and are therefore classified within Level 1, include active listed equities. The Fund does not adjust the quoted prices for these instruments. The Fund‟s policies and valuation of these financial assets are stated in Note 2.2.
5 FINANCIAL ASSETS AT FAIR VALUE THROUGH PROFIT OR LOSS
2015 2014 RM RM Financial assets designated as FVTPL: Collective investment scheme - foreign 6,897,610 9,389,201 ════════ ════════
2015 2014 RM RM Net gain on financial assets at FVTPL comprised:
- net realised loss on sale of financial assets at FVTPL (63,310) (1,561,980)
- unrealised gain on change in fair value 1,456,813 1,561,982 ──────── ──────── 1,393,503 2 ════════ ════════
32

33
5 FINANCIAL ASSETS AT FAIR VALUE THROUGH PROFIT OR LOSS (CONTINUED)
Financial assets designated as FVTPL as at 28 February 2015 are as follows: Fair value as at 28.02.2015 expressed as Fair value a percentage as at of value of
Name of Counter Quantity Cost 28.02.2015 the Fund RM RM %
COLLECTIVE INVESTMENT SCHEME - FOREIGN
United States
Goldman Sachs BRICs Portfolio 238,334 6,277,350 6,897,610 98.50
═══════ ════
ACCUMULATED UNREALISED FAIR VALUE LOSS (558,683)
ACCUMULATED UNREALISED FOREIGN EXCHANGE GAIN 1,178,943
────────TOTAL FINANCIAL ASSETS AT FVTPL 6,897,610
════════
33

34
5 FINANCIAL ASSETS AT FAIR VALUE THROUGH PROFIT OR LOSS (CONTINUED)
Financial assets designated as FVTPL as at 28 February 2014 are as follows:
Fair value as at 28.02.2014 expressed as Fair value a percentage as at of value of
Name of Counter Quantity Cost 28.02.2014 the Fund RM RM %
COLLECTIVE INVESTMENT SCHEME - FOREIGN
United States
Goldman Sachs BRICs Portfolio 388,244 10,225,754 9,389,201 99.85
═══════ ════
ACCUMULATED UNREALISED FAIR VALUE LOSS (1,625,758)
ACCUMULATED UNREALISED FOREIGN EXCHANGE GAIN 789,205
────────TOTAL FINANCIAL ASSETS AT FVTPL 9,389,201
════════
6 CASH AND CASH EQUIVALENTS
2015 2014 RM RM
Deposits with licensed financial institutions 115,132 - Bank balance 6,188 50,652 ──────── ──────── 121,320 50,652 ════════ ════════
34
35
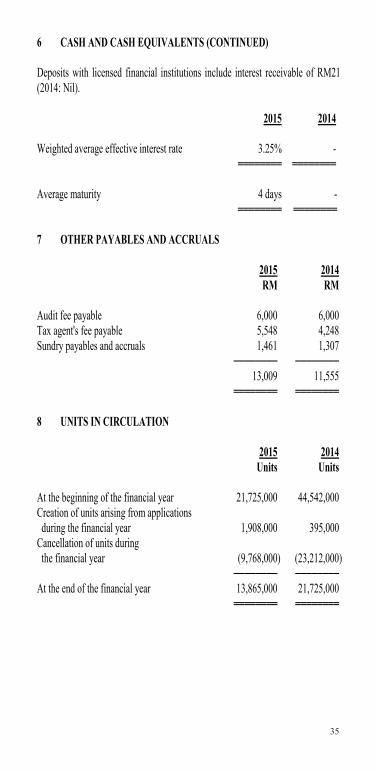
6 CASH AND CASH EQUIVALENTS (CONTINUED)
Deposits with licensed financial institutions include interest receivable of RM21 (2014: Nil).
2015 2014
Weighted average effective interest rate 3.25% - ════════ ════════
Average maturity 4 days - ════════ ════════
7 OTHER PAYABLES AND ACCRUALS
2015 2014 RM RM
Audit fee payable 6,000 6,000 Tax agent's fee payable 5,548 4,248 Sundry payables and accruals 1,461 1,307 ──────── ──────── 13,009 11,555 ════════ ════════
8 UNITS IN CIRCULATION
2015 2014 Units Units
At the beginning of the financial year 21,725,000 44,542,000 Creation of units arising from applications during the financial year 1,908,000 395,000
Cancellation of units during the financial year (9,768,000) (23,212,000)
──────── ────────At the end of the financial year 13,865,000 21,725,000
════════ ════════
35
37
11 TAXATION (CONTINUED)
2015 2014 RM RM
Profit /(loss) before taxation 1,197,016 (293,412) ════════ ════════
Tax calculated at a tax rate of 25% 299,254 (73,353) Tax effects of: - (Income not subject to tax)/losses not
deductible for tax purposes (343,783) 6,337 - Expenses not deductible for tax purposes 4,643 5,328 - Restriction on tax deductible expenses
for unit trust funds 39,886 61,688 ──────── ────────
Tax expense - - ════════ ════════
12 MANAGEMENT EXPENSE RATIO (“MER”)
2015 2014 % %
MER 2.15 2.08 ══════ ══════
Management expense ratio includes management fee, Trustee‟s fee, audit fee, tax agent's fee and other administrative expenses which is calculated as follows:
MER = (A + B + C + D + E) x 100 F
A = Management fee B = Trustee‟s fee C = Audit fee D = Tax agent's fee E = Other expenses
F = Average net asset value of the Fund for the financial year, calculated on a daily basis
The average net asset value of the Fund for the financial year, calculated on a daily basis is RM8,278,667 (2014: RM12,907,020).
36
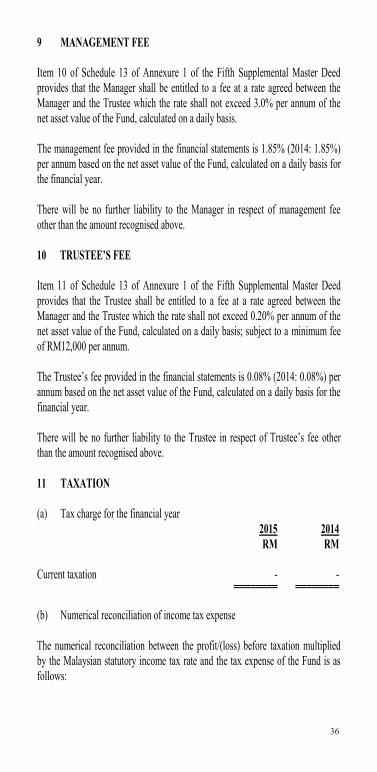
9 MANAGEMENT FEE
Item 10 of Schedule 13 of Annexure 1 of the Fifth Supplemental Master Deed provides that the Manager shall be entitled to a fee at a rate agreed between the Manager and the Trustee which the rate shall not exceed 3.0% per annum of the net asset value of the Fund, calculated on a daily basis.
The management fee provided in the financial statements is 1.85% (2014: 1.85%) per annum based on the net asset value of the Fund, calculated on a daily basis for the financial year.
There will be no further liability to the Manager in respect of management fee other than the amount recognised above.
10 TRUSTEE‟S FEE
Item 11 of Schedule 13 of Annexure 1 of the Fifth Supplemental Master Deed provides that the Trustee shall be entitled to a fee at a rate agreed between the Manager and the Trustee which the rate shall not exceed 0.20% per annum of the net asset value of the Fund, calculated on a daily basis; subject to a minimum fee of RM12,000 per annum.
The Trustee‟s fee provided in the financial statements is 0.08% (2014: 0.08%) per annum based on the net asset value of the Fund, calculated on a daily basis for the financial year.
There will be no further liability to the Trustee in respect of Trustee‟s fee other than the amount recognised above.
11 TAXATION
(a) Tax charge for the financial year 2015 2014
RM RM
Current taxation - - ════════ ════════
(b) Numerical reconciliation of income tax expense
The numerical reconciliation between the profit/(loss) before taxation multiplied by the Malaysian statutory income tax rate and the tax expense of the Fund is as follows:
36

37
11 TAXATION (CONTINUED)
2015 2014 RM RM
Profit /(loss) before taxation 1,197,016 (293,412) ════════ ════════
Tax calculated at a tax rate of 25% 299,254 (73,353) Tax effects of: - (Income not subject to tax)/losses not
deductible for tax purposes (343,783) 6,337 - Expenses not deductible for tax purposes 4,643 5,328 - Restriction on tax deductible expenses
for unit trust funds 39,886 61,688 ──────── ────────
Tax expense - - ════════ ════════
12 MANAGEMENT EXPENSE RATIO (“MER”)
2015 2014 % %
MER 2.15 2.08 ══════ ══════
Management expense ratio includes management fee, Trustee‟s fee, audit fee, tax agent's fee and other administrative expenses which is calculated as follows:
MER = (A + B + C + D + E) x 100 F
A = Management fee B = Trustee‟s fee C = Audit fee D = Tax agent's fee E = Other expenses
F = Average net asset value of the Fund for the financial year, calculated on a daily basis
The average net asset value of the Fund for the financial year, calculated on a daily basis is RM8,278,667 (2014: RM12,907,020).
37

38
13 PORTFOLIO TURNOVER RATIO
2015 2014
The portfolio turnover ratio for the financial year (times) 0.24 0.44
══════ ══════
The portfolio turnover ratio is derived from the following calculation:
(Total acquisition for the financial year + total disposal for the financial year) 2 Average net asset value of the Fund for the financial year calculated on a daily basis
where: total acquisition for the financial year = Nil (2014: Nil) total disposal for the financial year = RM3,948,405 (2014: RM11,276,429)
14 UNITS HELD BY THE MANAGER AND PARTIES RELATED TO THE MANAGER
The related parties and their relationship with the Fund are as follows:
Related parties Relationship
RHB Asset Management Sdn Bhd The Manager
RHB Investment Bank Bhd Holding company of the Manager
RHB Capital Bhd Ultimate holding company of the Manager
The number of units held by the Manager is as follows:
2015 2014 Units RM Units RM
The Manager 11,972 6,047 12,201 5,281══════ ══════ ══════ ══════
The units are held beneficially by the Manager for booking purposes and were transacted at the prevailing market price.
Other than the above, there were no units held by Directors or parties related to the Manager.
38

39
15 TRANSACTIONS BY THE FUND
Details of transactions by the Fund for the financial year ended 28 February 2015 are as follows:
Percentage Percentage of total
Fund manager/ Value of of total Brokerage brokerage financial institution trades trades fees fees RM % RM %
Goldman Sachs Asset Management International 3,885,095 63.51 - -
Affin Bank Bhd 1,455,642 23.80 - -CIMB Bank Bhd 776,000 12.69 - - ──────── ───── ─────── ───── 6,116,737 100.00 - - ════════ ═════ ═══════ ═════
Details of transactions by the Fund for the financial year ended 28 February 2014 are as follows:
Percentage Percentage of total
Fund manager/ Value of of total Brokerage brokerage financial institution trades trades fees fees RM % RM %
Goldman Sachs Asset Management International 9,714,449 76.84 - -
Affin Bank Bhd 2,927,709 23.16 - - ──────── ───── ─────── ───── 12,642,158 100.00 - - ════════ ═════ ═══════ ═════
39

40
16 SEGMENT INFORMATION
The Investment & Security Selection Committee of the Manager recommends strategic resource allocations of the Fund to the Investment Committee of the Manager (collectively referred to as “Committee”). The Investment Committee of the Manager will then endorse the strategic decision recommended by the Investment & Security Selection Committee for adoption on behalf of the Fund. The operating segments are determined based on the recommendation by the Investment & Security Selection Committee and reviewed by the Investment Committee.
The internal reporting provided to the Committee for the Fund‟s assets, liabilities and performance is prepared on a consistent basis with the measurement and recognition principles of MFRS. The Committee considers the business from both a geographic and investment perspective.
The Committee is responsible for the Fund's entire portfolio and considers the business to have a single operating segment. The Committee‟s asset allocation decisions are based on a single, integrated investment strategy and the Fund‟s performance is evaluated on an overall basis.
The reportable operating segments derive their income by seeking investments to achieve targeted returns commensurate with an acceptable level of risk within each portfolio. These returns consist of interest and gains on the appreciation in the value of investments.
There were no changes in the reportable segments during the financial year.
40

41
STATEMENT BY MANAGER
We, Patrick Chin Yoke Chung and Dato‟ Othman bin Jusoh, two of the Directors of RHB Asset Management Sdn Bhd, do hereby state that in the opinion of the Directors of the Manager, the accompanying financial statements set out on pages 11 to 40 are drawn up in accordance with the provisions of the Deeds and give a true and fair view of the financial position of the Fund as at 28 February 2015 and of its financial performance and cash flows for the financial year ended on that date in accordance with Malaysian Financial Reporting Standards and International Financial Reporting Standards.
On behalf of the Manager
PATRICK CHIN YOKE CHUND DATO‟ OTHMAN BIN JUSOHDIRECTOR DIRECTOR
Kuala Lumpur 24 April 2015
41

42
TRUSTEE‟S REPORT
We have acted as Trustee of RHB-OSK-GS BRIC Equity Fund (“the Fund”) for the financial year ended 28 February 2015. To the best of our knowledge, RHB Asset Management Sdn Bhd (“the Management Company”), has operated and managed the Fund in accordance with the following:-
(a) limitations imposed on the investment powers of the Management Company and the Trustee under the Deeds, the Securities Commission‟s Guidelines on Unit Trust Funds, the Capital Markets and Services Act 2007 and other applicable laws;
(b) valuation/pricing is carried out in accordance with the Deeds and any regulatory requirements; and
(c) creation and cancellation of units are carried out in accordance with the Deeds and any regulatory requirements.
For TMF Trustees Malaysia Berhad(Company No: 610812-W)
SHU WAI LING DIRECTOR – FUND SERVICES
Kuala Lumpur 24 April 2015
42
43
INDEPENDENT AUDITORS‟ REPORT TO THE UNITHOLDERS OFRHB-OSK-GS BRIC EQUITY FUND
REPORT ON THE FINANCIAL STATEMENTS
We have audited the financial statements of RHB-OSK-GS BRIC Equity Fund, which comprise statement of financial position as at 28 February 2015, and statement of comprehensive income, statement of changes in net asset value and statement of cash flows for the financial year then ended, and a summary of significant accounting policies and other explanatory notes, as set out on Notes 1to 16.
Manager‟s Responsibility for the Financial Statements
The Manager of the Fund is responsible for the preparation of financial statementsso as to give a true and fair view in accordance with Malaysian Financial Reporting Standards and International Financial Reporting Standards. The Manager is also responsible for such internal control as the Manager determines are necessary to enable the preparation of financial statements that are free from material misstatement, whether due to fraud or error.
Auditors‟ Responsibility
Our responsibility is to express an opinion on these financial statements based on our audit. We conducted our audit in accordance with approved standards on auditing in Malaysia. Those standards require that we comply with ethical requirements and plan and perform the audit to obtain reasonable assurance whether the financial statements are free from material misstatement.
An audit involves performing procedures to obtain audit evidence about the amounts and disclosures in the financial statements. The procedures selected depend on our judgment, including the assessment of risks of material misstatement of the financial statements, whether due to fraud or error. In making those risk assessments, we consider internal control relevant to the Fund‟s preparation of financial statements that give a true and fair view in order to design audit procedures that are appropriate in the circumstances, but not for the purpose of expressing an opinion on the effectiveness of the Manager‟s internal control. An audit also includes evaluating the appropriateness of accounting policies used and the reasonableness of accounting estimates made by the Manager, as well as evaluating the overall presentation of the financial statements.
We believe that the audit evidence we have obtained is sufficient and appropriate to provide a basis for our audit opinion.
43
44
INDEPENDENT AUDITORS‟ REPORT TO THE UNITHOLDERS OFRHB-OSK-GS BRIC EQUITY FUND (CONTINUED)
REPORT ON THE FINANCIAL STATEMENTS (CONTINUED)
Opinion
In our opinion, the financial statements give a true and fair view of the financial position of the Fund as at 28 February 2015 and of its financial performance and cash flows for the financial year then ended in accordance with Malaysian Financial Reporting Standards and International Financial Reporting Standards.
OTHER MATTERS
This report is made solely to the unitholders of the Fund and for no other purpose. We do not assume responsibility to any other person for the content of this report.
PRICEWATERHOUSECOOPERS (No. AF: 1146) Chartered Accountants
Kuala Lumpur 24 April 2015
44
45
TR
CORPORATE INFORMATION MANAGER RHB ASSET MANAGEMENT SDN BHD PRINCIPAL AND REGISTERED OFFICE 19th Floor, Plaza OSK, Jalan Ampang, 50450 Kuala Lumpur BUSINESS OFFICE 5th Floor, Plaza OSK, Jalan Ampang, 50450 Kuala Lumpur Email address: [email protected] Tel: 03-2164 3036 Fax: 03-2164 4226 Website: http://www.rhbgroup.com BOARD OF DIRECTORS Mr Patrick Chin Yoke Chung (Independent Non-Executive Chairman) Tuan Haji Khairuddin Ahmad (Senior Independent Non-Executive Director) Dato‟ Othman Jusoh (Independent Non-Executive Director) Encik Abdul Aziz Peru Mohamed (Independent Non-Executive Director) Ms Ong Yin Suen (Non-Independent Managing Director) Mr Chin Yoong Kheong (Independent Non-Executive Director) (Appointed on 7 April 2015) INVESTMENT COMMITTEE MEMBERS Tuan Haji Khairuddin Ahmad (Independent Chairman) Dato‟ Othman Jusoh (Independent Member) Mr Lim Chee Sing (Non-Independent Member) Ms Ong Yin Suen (Non-Independent Member) CHIEF EXECUTIVE OFFICER Mr Ho Seng Yee SECRETARY Encik Azman Shah Md Yaman (LS No. 0006901)
45

47
BRANCH OFFICEKuala Lumpur Office B-9-6, Megan Avenue 1
No. 189, Jalan Tun Razak50400 Kuala LumpurTel: 03-2171 2755 Fax: 03-2770 0022
Penang Office 64-D, Level 5, Lebuh Bishop10200 PenangTel: 04-264 5639 / 04-263 4848Fax: 04-264 5640 / 04-262 8844
Butterworth Office 2677, Jalan Chain FerryTaman Inderawasih13600 Prai, PenangTel: 04-390 0022 Fax: 04-390 0023
Ipoh Office 4th Floor, 21-25Jalan Seenivasagam, Greentown30450 Ipoh, PerakTel: 05-242 4311 Fax: 05-242 4312
Johor Bahru Office 2nd Floor, 21 & 23Jalan Molek 1/30, Taman Molek81100 Johor Bahru, JohorTel: 07-358 3587 Fax: 07-358 3581
Kuantan Office B 32-34, 2nd Floor, Lorong Tun Ismail 8Sri Dagangan II25000 Kuantan, PahangTel: 09-517 3611 Fax: 09-517 3612
Kota Bharu Office No 3953-H, 1st FloorJalan Kebun Sultan15350 Kota Bharu, KelantanTel: 09-741 8539 Fax: 09-741 8540
Kota Kinabalu Office Lot No. C-02-04, 2nd FloorBlock C, Warisan SquareJalan Tun Fuad Stephens88000 Kota Kinabalu, SabahTel: 088-528 686/692 Fax: 088-528 685
46

48
Melaka Office 581B, Taman Melaka Raya75000 MelakaTel: 06-284 4211 Fax: 06-292 2212
Batu Pahat Office 53, 53-A and 53-B Jalan Sultanah83000 Batu Pahat, JohorTel: 07-438 0271 Fax: 07-438 0277
Miri Office Lot 1268, First FloorCentre Point Commercial CentreJalan Melayu98000 Miri, SarawakTel: 085-422 788 Fax: 085-415 243
Kuching Office Lot 172, Section 49, K.T.L.DJalan Chan Chin Ann93100 Kuching, SarawakTel: 082-245 611 Fax: 082-242 712
Lot 7418, First FloorJalan Simpang Tiga99300 Kuching, SarawakTel: 082-231 326 Fax: 082-230 326
TRUSTEE TMF Trustees Malaysia Berhad
BANKER RHB Bank Berhad
AUDITORS PricewaterhouseCoopers
TAX ADVISER PricewaterhouseCoopers Taxation Services Sdn Bhd
DISTRIBUTORS RHB Bank BerhadiFast Capital Sdn BhdPhillip Mutual BerhadCitibank Berhad
47