rhb china bond fund second quarter report
TRANSCRIPT

RHB CHINA BOND FUND
THIRD QUARTER REPORT
For the financial period ended 31 May 2021
1
GENERAL INFORMATION ABOUT THE FUND
Name, Category and Type
Fund Name - RHB China Bond Fund
Fund Category - Feeder Fund
Fund Type - Growth Fund
Investment Objective, Policy and Strategy
Objective of the Fund
The Fund aims to maximise total return by investing in one (1) Target Fund.
Strategy
The Fund will invest principally in the Renminbi (“RMB”) denominated class 16 units
of the Target Fund.
The investment objective of the Target Fund is to maximise total return. The Target
Fund was launched on 11 November 2011. The Target Fund is one (1) of the sub-
funds of the BlackRock Global Funds, an umbrella type open-ended variable capital
investment company with segregated liability between sub-funds, incorporated with
limited liability under the laws of Luxembourg.
Although the Fund is passively managed, the investments in the Fund will be
rebalanced from time to time to meet sale and redemption transactions. This is to
enable proper and efficient management of the Fund.
This Fund is a feeder fund that invests at least 95% of its NAV in the Target Fund.
The risk management strategies and techniques employed will be at the Target Fund
level.
When appropriate for all Classes (except RM Class & RMB Class), the Manager may
participate in financial derivatives, which include but is not limited to forwards and
swaps, for the purpose of hedging the currency risk exposure (if any) of the various
currency Classes. The benefit of any upside of currency movement is limited when
hedging the various currency Classes’ exposures to foreign currency as the primary
interest is to protect the value of the various currency Classes.

2
The Fund’s portfolio will be structured as follows:
At least 95% of
Net Asset Value
- Investments in the RMB denominated class I6 units of the Target
Fund.
The balance of the NAV shall be invested in liquid assets including money market
instruments, deposits that are not embedded with or linked to financial derivative
instruments (“Deposits”) and collective investment schemes investing in money
market instruments and Deposits.
Performance Benchmark
1-year China Household Savings Deposits Rate Index.
Permitted Investments and Restrictions
The Fund will invest in BlackRock Global Funds – China Bond Fund, financial
derivatives, money market instruments and/or Deposits, units/shares of collective
investment schemes and any other investments in line with the objective of the Fund,
provided that there is no inconsistency with the Fund’s objective.
In undertaking the Fund’s investments, the Fund must not invest in a fund-of-funds,
a feeder fund, or any sub-fund of an umbrella scheme which is a fund-of-funds or a
feeder fund.
Distribution Policy
The Fund may declare distributions, if any, is declared at the end of each quarter, or
for any other period.

3
Effective from 1 July 2021, the definition of Sophisticated Investor will be as follows:
Sophisticated Investor 1. A unit trust scheme, private retirement scheme or
prescribed investment scheme; or
2. Bank Negara; or
3. A licensed person or a registered person; or
4. An exchange holding company, a stock exchange, a
derivatives exchange, an approved clearing house, a
central depository or a recognized market operator; or
5. A corporation that is licensed, registered or approved
to carry on any regulated activity or capital market
services by an authority in Labuan or outside Malaysia
which exercises functions corresponding to the
functions of the Commission; or
6. A bank licensee or an insurance licensee as defined
under the Labuan Financial Services and Securities
Act 2010 [Act 704]; or
7. An Islamic bank licensee or a takaful licensee as
defined under the Labuan Islamic Financial Services
and Securities Act 2010 [Act 705]; or
8. A chief executive officer or a director of any person
referred to in paragraphs 3, 4, 5, 6 and 7.P.U. (A) 51;
or
9. A closed-end fund approved by the Commission; or
10. A company that is registered as a trust company under
the Trust Companies Act 1949 and has assets under its
management exceeding ten million ringgit or its
equivalent in foreign currencies; or
11. A corporation that—
(a) is a public company under the Companies Act 2016
which is approved by the Commission to be a
trustee under the Act and has assets under its

4
management, exceeding ten million ringgit or its
equivalent in foreign currencies; or
(b) is carrying on the regulated activity of fund
management solely for the benefit of its related
corporations and has assets under its management
exceeding ten million ringgit or its equivalent in
foreign currencies; or
12. A corporation with total net assets exceeding ten
million ringgit or its equivalent in foreign currencies
based on the last audited accounts; or
13. A partnership with total net assets exceeding ten
million ringgit or its equivalent in foreign currencies;
or
14. A statutory body established under any laws unless
otherwise determined by the Commission.P.U. (A) 52;
or
15. A pension fund approved by the Director General of
Inland Revenue under the Income Tax Act 1967; or
16. An individual—
(a) whose total net personal assets, or total net joint
assets with his or her spouse, exceeding three
million ringgit or its equivalent in foreign
currencies, excluding the value of the individual’s
primary residence;
(b) who has a gross annual income exceeding three
hundred thousand ringgit or its equivalent in
foreign currencies in the preceding twelve months;
(c) who jointly with his or her spouse, has a gross
annual income exceeding four hundred thousand
ringgit or its equivalent in foreign currencies in the
preceding twelve months; or
(d) whose total net personal investment portfolio or
total net joint investment portfolio with his or her
spouse, in any capital market products exceeding
one million ringgit or its equivalent in foreign
currencies.

5
MANAGER’S REPORT
MARKET REVIEW
The low correlation / beta across onshore and offshore China bond markets has been
the case for the past few years and even more apparent this year. The reason for the
low correlation is the low onshore foreign exposure and the inefficient flow in money
between the two markets. The onshore Chinese Credit market reflects the onshore
view of China while the offshore Chinese Credit market reflects the offshore view of
China.
While the United States Treasury (“UST”) yields have climbed higher year to date,
onshore yield have staged a slow rally, making China’s rates insensitive to global
market. This is because the onshore market is still largely domestic driven. Over the
month, onshore yield continues to decline on back of stable liquidity condition and
slower-than-expected pace of local government bond (“LGB”) issuance. The Target
Fund Manager expects the issuance pace to pick up going forward and this will create
supply pressure. By then, the Target Fund Manager will add onshore positions
opportunistically to take advantage of the attractive yield. Meanwhile, People's Bank
of China ("PBoC") has increased the reserve requirement ratio for foreign exchange
(“FX”) deposits from 5.00% to 7.00% in order to reduce the pace of Chinese Yuan
Renminbi (“RMB”) appreciation. The Target Fund Manager believes RMB will
continue to be strong over the medium longer run driven by strong economic
fundamentals, attractive interest differentials and supportive balance of payment
(“BoP”) dynamics. The pace of appreciation is likely to turn more moderate.
Credit tightening has triggered concerns as illustrated by the increases in state-owned
entities (“SOE”) defaults and the recent noise around Huarong. The government is
striking a balance between financial stability versus enhancing market discipline. The
Target Fund Manager believes the credit default will pick up in a controlled pace
without causing systemic risk. The PBoC will continue to keep policy rates unchanged
and ensure stable liquidity. Going forward, the Target Fund Manager expects SOE
spreads bands to widen as there is more differentiation between stronger ones versus
weaker ones. Within the target portfolio, the Target Fund Manager has taken profit
on Huarong ahead of the sell-off to mitigate the losses. The Target Fund Manager has
also relocated some of their offshore Huarong positions to onshore given the structure
is more valuable compared to offshore’s keepwell structure. The Target Fund
Manager has sold all the AMCs and majority of the offshore keepwell structure bonds
which will tend to be negatively impacted from the contagion effect. Even in the worst
case scenario (ie, debt restructuring for Huarong), the return impact to the Target Fund
is limited given their defensive positioning. The Target Fund Manager onshore high
quality credit names will outperform under such scenario.
6
ECONOMIC REVIEW
China’s economic recovery is well on track with stable manufacturing Purchasing
Managers’ Index (“PMI”)s in May 2021. External sector remains robust as well as
construction suggesting overall growth remains resilient. In addition, China’s
vaccination program has picked up momentum notably in recent weeks, with an
estimation of achieving 80.00% vaccination rate by end of the year. The vaccination-
led economic recovery should help to reinforce the growth outlook led by domestic
consumptions and services.
On the inflation front, Producer Price Index (“PPI”) climbed higher driven by rising
global commodity price and recent decarbonization policies while Consumer Price
Index (“CPI”) continue to be subdued on back of declined price of pork and vegetable.
The Target Fund Manager expects PPI to be below 8.50% Year-on-Year (“YoY”)
with CPI inflation remain subdued by the end of the year. In the Target Fund
Manager’s view, while domestic inflation will be supported by recovering consumer
sentiment, slowing onshore credit growth in the public and real estate sectors will
keep the inflationary pressure in check. In this sense, the Target Fund Manager does
not foresee any broad-based tightening measures by PBoC this year and this will
provide support for onshore bond market in general.
REVIEW OF TARGET FUND PERFORMANCE AND STRATEGY DURING
THE PERIOD
The target portfolio generated 2.79%* over the period net of fees, with positive returns
from both onshore and offshore. In the offshore market, positive carry was more than
offset the widening yield. In the onshore space, positive returns are coming from carry
and yield compression.
Within the target portfolio, the Target Fund Manager has been positioned very
defensively since fourth quarter (“Q4”) last year by moving their capital from offshore
to onshore through high-quality strategic important SOEs and sovereigns. At the
moment, the Target Fund has 49.00% exposure to onshore bonds, 40.00% exposure
to offshore bonds and 11.00% cash. The Target Fund Manager has kept high cash
level to leave dry powder for dislocation opportunities if there is any market sell-off.
The Target Fund Manager has increased their HY positions from 23.00% to 25.00%
mainly through offshore HY properties driven by attractive valuations.
The target portfolio remains income-focused with a yield of 5.90% with an average
investment grade rating. The Target Fund Manager sees portfolio resilience and credit
quality increasing in importance for investments in the coming months. The target
portfolio has been resilient, exhibiting low drawdowns amidst the volatility associated
with the coronavirus given the diversification between the onshore and offshore
Chinese bond markets.
7
The target portfolio has been resilient, exhibiting low drawdowns amidst the volatility
given the diversification between the onshore and offshore Chinese bond markets.
Despite global market volatility in credit, the target portfolio has held up well; the
Target Fund has a 5-year annual return of 6.40% net of fees at a volatility of 2.40%
(monthly, annual).
*Performance refer to primary share class A2 CNH, net of fees
REVIEW OF FUND PERFORMANCE DURING THE FINANCIAL PERIOD
During the financial period under review, the Fund has generated a return of 0.56%*,
-0.44%*, -0.11%*, 8.50%*, 0.85%*, 1.64%*, and 0.02%* as compared with the
benchmark return of 8.98%*, 4.12%*, 2.65%*, 7.90%*, 7.90%*, 1.39%*, and
5.88%* for for USD-Hedged Class, AUD-Hedged Class, GBP-Hedged Class, RM
Class, RM-Hedged Class, RMB Class and SGD-Hedged Class respectively. The Fund
is working to meet its objective of maximising total return.
* Source: Lipper Investment Management (“Lipper IM”), 8 June 2021
MARKET OUTLOOK AND STRATEGY GOING FORWARD
At this juncture, the Target Fund Manager holds a constructive view on the onshore
market over offshore market. Firstly, with core personal consumption expenditure
(“PCE”) in United States (“US”) probably moving above the target by mid-year, the
Target Fund Manager does believe there is potential for US rates to move up in second
half of year 2021 (“2H21”). This will create negative impact to offshore investment
grade (“IG”) credits which generally experience sell-off with increasing UST yields.
Secondly, the Target Fund Manager continues to expect overall tightened credit
environment as the government is trying to deleverage the economy in order to
achieve longer term financial stability. The Target Fund Manager expects further
credit deterioration and more credit events which would have more weigh on the
offshore market due to the potential contagion impact. In particular, the Target Fund
Manager is cautious over the offshore AMCs, keepwell structure bonds and the
government-related sectors due to the potential spill-over impact from Huarong.
Moving forward, the Target Fund Manager will continue to focus on increasing target
portfolio resilience. In the onshore space, the Target Fund Manager expects neutral
monetary policy given subdued inflation and slower credit growth, providing support
for onshore market with yield to be range bound without sharp movement till the end
of the year. In the onshore, the Target Fund Manager like companies in strategic
important sectors which will benefit from the credit differentiation going forward.
The Target Fund Manager expects some supply pressure in coming months and would
take that opportunity to add more exposure. The Target Fund Manager also likes
onshore short-dated (<1 year maturity) HY bonds for diversification and attractive
8
relative valuations (ie. 0.5-1% yield pick up compared to offshore counterparts after
FX hedging). In the offshore space, the Target Fund Manager likes HY over IG. China
offshore HY properties continue to offer attractive carry compared to Asia United
States Dollar (“USD”) credit, Emerging Market (“EM”) and developed market
(“DM”) credit and this market would be supported by rising global demands going
forward. At the same time, the Target Fund Manager expects limited supply given
National Development and Reform Commission (“NDRC”) quota constraints. The
Target Fund Manager expects spread compression in the China HY property space
till the end of the year despite short-term volatility. The Target Fund Manager is
waiting for better entry point and to take advantage of the new issuance opportunity
to add exposure in the offshore HY property space. The Target Fund Manager is
positive on large benchmark names with more diversified funding channels, while
avoiding weaker developers in the target portfolio.
Within HY:
The Target Fund Manager is positive on China HY property fundamentally but they
do expect policy tightening could weigh on near-term sentiment. The Target Fund
Manager likes short-dated up-in-quality names as the carry play. As China’s property
sector entered its golden season, the government has introduced regulations to cool
down the sector, such as the “3 red lines” to ensure leverage in the system is being
controlled. This is equity negative but bond positive. This will force the sector to
deleverage from here, which can be seen as a good development for the sector’s credit
profile over the long run. Within the China HY Property sector, the Target Fund
Manager is mainly positive on larger issuers with more manageable leverage and
more diversified funding channels.
Within IG:
The Target Fund Manager is constructive on onshore central SOEs and strategic
important local government financing vehicle (“LGFV”)s. The Target Fund Manager
continues to expect a tighter credit environment onshore as the government is seeking
to deleverage the economy and this means the strategic important SOEs will continue
to outperform the industrial SOEs. In the Target Fund Manager’s strategy, they have
to assess both the systematic importance of the entity and also the fundamentals of
the corporate. The Target Fund Manager is avoiding industrial local SOEs as they
expect more credit deterioration going forward.

9
PERFORMANCE DATA
31.08.2020-
31.05.2021
%
Annual Total Return
Financial Period Ended
31 August 2020^
%
RHB China Bond Fund - RMB Class
- Capital Return (1.10) 5.52
- Income Return 2.77 1.92
- Total Return 1.64 7.55
1-year China Household Savings
Deposits Rate Index 1.39 1.25
31.08.2020-
31.05.2021
%
Annual Total Return
Financial Period Ended
31 August 2020^
%
RHB China Bond Fund - RM Class
- Capital Return 5.94 7.69
- Income Return 2.42 1.89
- Total Return 8.50 9.72
1-year China Household Savings
Deposits Rate Index 7.90 4.80
31.08.2020-
31.05.2021
%
Annual Total Return
Financial Period Ended
31 August 2020^
%
RHB China Bond Fund – RM-
Hedged Class
- Capital Return (1.98) 5.47
- Income Return 2.89 1.92
- Total Return 0.85 7.50
1-year China Household Savings
Deposits Rate Index 7.90 4.80

10
31.08.2020-
31.05.2021
%
Annual Total Return
Financial Period Ended
31 August 2020^
%
RHB China Bond Fund – AUD-
Hedged Class
- Capital Return (3.29) 4.12
- Income Return 2.95 1.94
- Total Return (0.44) 6.14
1-year China Household Savings
Deposits Rate Index 4.12 (3.61)
31.08.2020-
31.05.2021
%
Annual Total Return
Financial Period Ended
31 August 2020^
%
RHB China Bond Fund – USD-
Hedged Class
- Capital Return (2.25) 5.45
- Income Return 2.87 1.91
- Total Return 0.56 7.46
1-year China Household Savings
Deposits Rate Index 8.98 5.81
31.08.2020-
31.05.2021
%
Annual Total Return
Financial Period Ended
31 August 2020^
%
RHB China Bond Fund – SGD-
Hedged Class
- Capital Return (2.67) 3.85
- Income Return 2.76 1.58
- Total Return 0.02 5.49
1-year China Household Savings
Deposits Rate Index 5.88 3.38

11
31.08.2020-
31.05.2021
%
Annual Total Return
Financial Period Ended
31 August 2020^
%
RHB China Bond Fund – GBP-
Hedged Class
- Capital Return (2.76) 5.40
- Income Return 2.73 1.93
- Total Return (0.11) 7.43
1-year China Household Savings
Deposits Rate Index 2.65 0.17
Average Annual Return
1 Year
31.05.2020-
31.05.2021
%
Since Inception
04.06.2019**-
31.05.2021
%
RHB China Bond Fund - RMB Class 5.78 5.10
1-year China Household Savings
Deposits Rate Index 1.43 1.46
Average Annual Return
1 Year
31.05.2020-
31.05.2021
%
Since Inception
04.06.2019**-
31.05.2021
%
RHB China Bond Fund - RM Class 12.83 9.37
1-year China Household Savings
Deposits Rate Index 8.18 5.19
Average Annual Return
1 Year
31.05.2020-
31.05.2021
%
Since Inception
31.05.2019**-
31.05.2021
%
RHB China Bond Fund – RM-
Hedged Class 4.77 4.48
1-year China Household Savings
Deposits Rate Index 8.18 5.19

12
Average Annual Return
1 Year
31.05.2020-
31.05.2021
%
Since Inception
04.06.2019**-
31.05.2021
%
RHB China Bond Fund – AUD-
Hedged Class 2.73 3.17
1-year China Household Savings
Deposits Rate Index (2.21) 0.46
Average Annual Return
1 Year
31.05.2020-
31.05.2021
%
Since Inception
04.06.2019**-
31.05.2021
%
RHB China Bond Fund – USD-
Hedged Class 4.55 4.58
1-year China Household Savings
Deposits Rate Index 14.03 5.83
Average Annual Return
1 Year
31.05.2020-
31.05.2021
%
Since Inception
06.11.2019**-
31.05.2021
%
RHB China Bond Fund – SGD-
Hedged Class 3.71 3.48
1-year China Household Savings
Deposits Rate Index 6.57 5.94
Average Annual Return
1 Year
31.05.2020-
31.05.2021
%
Since Inception
04.11.2019**-
31.05.2021
%
RHB China Bond Fund – GBP-
Hedged Class 2.78 4.59
1-year China Household Savings
Deposits Rate Index (0.83) 1.79 ^ For the period since last day of Initial Offer Period

13
Performance of RHB China Bond Fund - RMB Class
for the period from 4 June 2019** to 31 May 2021
Cumulative Return Over The Period (%)
Performance of RHB China Bond Fund - RM Class
for the period from 4 June 2019** to 31 May 2021
Cumulative Return Over The Period (%)

14
Performance of RHB China Bond Fund – RM-Hedged Class
for the period from 4 June 2019** to 31 May 2021
Cumulative Return Over The Period (%)
Performance of RHB China Bond Fund – AUD-Hedged Class
for the period from 4 June 2019** to 31 May 2021
Cumulative Return Over The Period (%)

15
Performance of RHB China Bond Fund – USD-Hedged Class
for the period from 4 June 2019** to 31 May 2021
Cumulative Return Over The Period (%)
Performance of RHB China Bond Fund – SGD-Hedged Class
for the period from 6 November 2019** to 31 May 2021
Cumulative Return Over The Period (%)

16
Performance of RHB China Bond Fund – GBP-Hedged Class
for the period from 4 November 2019** to 31 May 2021
Cumulative Return Over The Period (%)
** Being the last day of Initial Offer Period
Source: Lipper IM, 8 June 2021
The abovementioned performance figures are indicative returns based on daily Net
Asset Value of a unit (as per Lipper Database) since inception.
The calculation of the above returns is based on computation methods of Lipper.
Note : Past performance is not necessarily indicative of future performance and
unit prices and investment returns may go down, as well as up.
The abovementioned performance computations have been adjusted to
reflect distribution payments and unit splits wherever applicable.

17
Fund Size – RMB Class
As At
31 May 2021
As At
31 August 2020
Net Asset Value (RMB million) 234.56 116.00
Units In Circulation (million) 222.50 108.91
Net Asset Value Per Unit (RMB) 1.0542 1.0651
Fund Size – RM Class
As At
31 May 2021
As At
31 August 2020
Net Asset Value (RMB million) 831.05 303.52
Units In Circulation (million) 469.40 170.35
Net Asset Value Per Unit (RMB) 1.7704 1.7818
Fund Size – RM-Hedged Class
As At
31 May 2021
As At
31 August 2020
Net Asset Value (RMB million) 751.94 543.48
Units In Circulation (million) 467.52 310.70
Net Asset Value Per Unit (RMB) 1.6084 1.7492
Fund Size – AUD-Hedged Class
As At
31 May 2021
As At
31 August 2020
Net Asset Value (RMB million) 215.14 157.06
Units In Circulation (million) 42.97 29.81
Net Asset Value Per Unit (RMB) 5.0063 5.2688
Fund Size – USD-Hedged Class
As At
31 May 2021
As At
31 August 2020
Net Asset Value (RMB million) 135.91 64.15
Units In Circulation (million) 20.45 8.77
Net Asset Value Per Unit (RMB) 6.6463 7.3171
Fund Size – SGD-Hedged Class
As At
31 May 2021
As At
31 August 2020
Net Asset Value (RMB million) 57.83 33.48
Units In Circulation (million) 11.85 6.39
Net Asset Value Per Unit s(RMB) 4.8794 5.2435
Fund Size – GBP-Hedged Class
As At
31 May 2021
As At
31 August 2020
Net Asset Value (RMB million) 18.11 9.37
Units In Circulation (million) 1.95 0.97
Net Asset Value Per Unit (RMB) 9.2659 9.6160
18
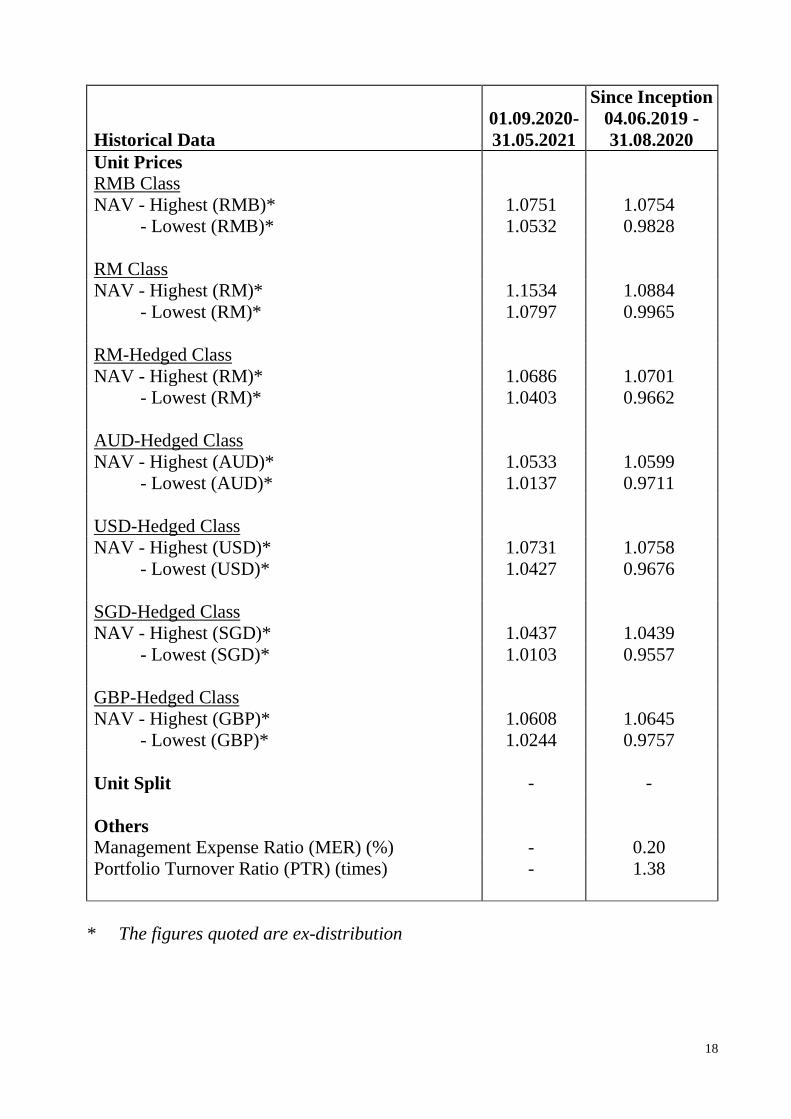
Historical Data
01.09.2020-
31.05.2021
Since Inception
04.06.2019 -
31.08.2020
Unit Prices
RMB Class
NAV - Highest (RMB)* 1.0751 1.0754
- Lowest (RMB)* 1.0532 0.9828
RM Class
NAV - Highest (RM)* 1.1534 1.0884
- Lowest (RM)* 1.0797 0.9965
RM-Hedged Class
NAV - Highest (RM)* 1.0686 1.0701
- Lowest (RM)* 1.0403 0.9662
AUD-Hedged Class
NAV - Highest (AUD)* 1.0533 1.0599
- Lowest (AUD)* 1.0137 0.9711
USD-Hedged Class
NAV - Highest (USD)* 1.0731 1.0758
- Lowest (USD)* 1.0427 0.9676
SGD-Hedged Class
NAV - Highest (SGD)* 1.0437 1.0439
- Lowest (SGD)* 1.0103 0.9557
GBP-Hedged Class
NAV - Highest (GBP)* 1.0608 1.0645
- Lowest (GBP)* 1.0244 0.9757
Unit Split - -
Others
Management Expense Ratio (MER) (%) - 0.20
Portfolio Turnover Ratio (PTR) (times) - 1.38
* The figures quoted are ex-distribution
19
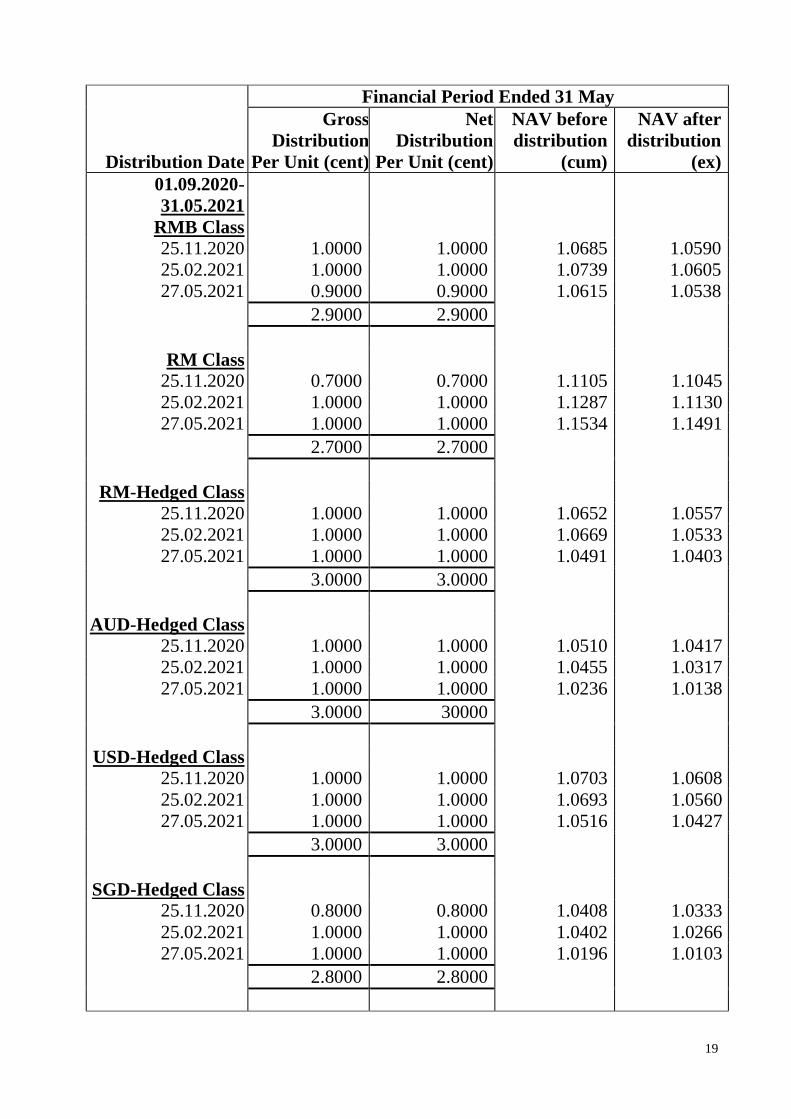
Distribution Date
Financial Period Ended 31 May
Gross
Distribution
Per Unit (cent)
Net
Distribution
Per Unit (cent)
NAV before
distribution
(cum)
NAV after
distribution
(ex)
01.09.2020-
31.05.2021
RMB Class
25.11.2020 1.0000 1.0000 1.0685 1.0590
25.02.2021 1.0000 1.0000 1.0739 1.0605
27.05.2021 0.9000 0.9000 1.0615 1.0538
2.9000 2.9000
RM Class
25.11.2020 0.7000 0.7000 1.1105 1.1045
25.02.2021 1.0000 1.0000 1.1287 1.1130
27.05.2021 1.0000 1.0000 1.1534 1.1491
2.7000 2.7000
RM-Hedged Class
25.11.2020 1.0000 1.0000 1.0652 1.0557
25.02.2021 1.0000 1.0000 1.0669 1.0533
27.05.2021 1.0000 1.0000 1.0491 1.0403
3.0000 3.0000
AUD-Hedged Class
25.11.2020 1.0000 1.0000 1.0510 1.0417
25.02.2021 1.0000 1.0000 1.0455 1.0317
27.05.2021 1.0000 1.0000 1.0236 1.0138
3.0000 30000
USD-Hedged Class
25.11.2020 1.0000 1.0000 1.0703 1.0608
25.02.2021 1.0000 1.0000 1.0693 1.0560
27.05.2021 1.0000 1.0000 1.0516 1.0427
3.0000 3.0000
SGD-Hedged Class
25.11.2020 0.8000 0.8000 1.0408 1.0333
25.02.2021 1.0000 1.0000 1.0402 1.0266
27.05.2021 1.0000 1.0000 1.0196 1.0103
2.8000 2.8000
20
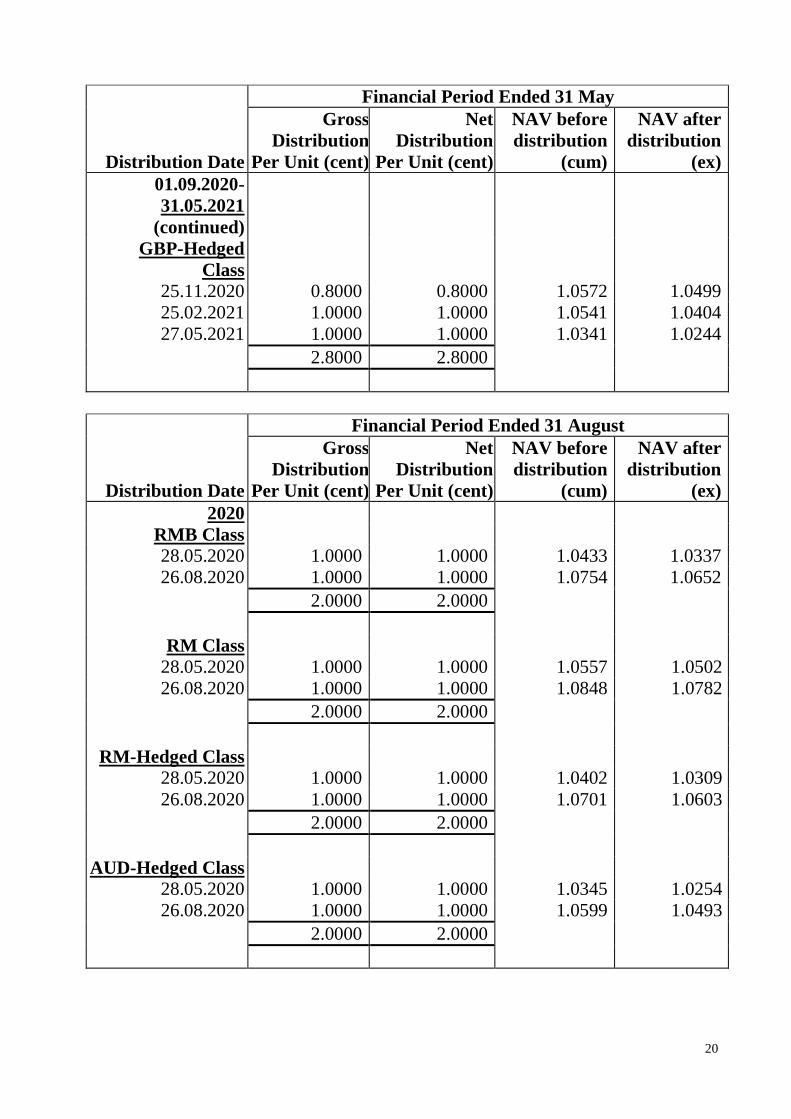
Distribution Date
Financial Period Ended 31 May
Gross
Distribution
Per Unit (cent)
Net
Distribution
Per Unit (cent)
NAV before
distribution
(cum)
NAV after
distribution
(ex)
01.09.2020-
31.05.2021
(continued)
GBP-Hedged
Class
25.11.2020 0.8000 0.8000 1.0572 1.0499
25.02.2021 1.0000 1.0000 1.0541 1.0404
27.05.2021 1.0000 1.0000 1.0341 1.0244
2.8000 2.8000
Distribution Date
Financial Period Ended 31 August
Gross
Distribution
Per Unit (cent)
Net
Distribution
Per Unit (cent)
NAV before
distribution
(cum)
NAV after
distribution
(ex)
2020
RMB Class
28.05.2020 1.0000 1.0000 1.0433 1.0337
26.08.2020 1.0000 1.0000 1.0754 1.0652
2.0000 2.0000
RM Class
28.05.2020 1.0000 1.0000 1.0557 1.0502
26.08.2020 1.0000 1.0000 1.0848 1.0782
2.0000 2.0000
RM-Hedged Class
28.05.2020 1.0000 1.0000 1.0402 1.0309
26.08.2020 1.0000 1.0000 1.0701 1.0603
2.0000 2.0000
AUD-Hedged Class
28.05.2020 1.0000 1.0000 1.0345 1.0254
26.08.2020 1.0000 1.0000 1.0599 1.0493
2.0000 2.0000

21
Distribution Date
Financial Period Ended 31 August
Gross
Distribution
Per Unit (cent)
Net
Distribution
Per Unit (cent)
NAV before
distribution
(cum)
NAV after
distribution
(ex)
2020 (continued)
USD-Hedged Class
28.05.2020 1.0000 1.0000 1.0443 1.0346
26.08.2020 1.0000 1.0000 1.0758 1.0657
2.0000 2.0000
SGD-Hedged Class
28.05.2020 1.0000 1.0000 1.0159 1.0067
26.08.2020 0.6000 0.6000 1.0439 1.0381
1.6000 1.6000
GBP-Hedged Class
28.05.2020 1.0000 1.0000 1.0421 1.0334
26.08.2020 1.0000 1.0000 1.0645 1.0542
2.0000 2.0000
DISTRIBUTION
For the financial period under review, the Fund has declared a gross distribution of
2.9000 cent per unit for RMB Class, 2.7000 cent per unit for RM Class, 3.0000 cent
per unit for RM-Hedged Class, AUD-Hedged Class, USD-Hedged Class, 2.8000 cent
per unit for GBP-Hedged Class and SGD-Hedged Class, which is equivalent to a gross
distribution yield of 2.73%, 2.42%, 2.84%, 2.89%, 2.83%, 2.71% and 2.67% based
on the average net asset value per unit for the financial period.

22
PORTFOLIO STRUCTURE
The asset allocations of the Fund as at reporting date were as follows:
As at
31 May 2021
As at
31 August 2020
Sectors % %
Collective investment scheme – foreign 98.87 94.20
Liquid assets and other net current assets
(inclusive of forward foreign currency
contracts) 1.13 5.80
100.00 100.00
The assets allocation was reflective of the Manager’s stance to risk manage its
portfolio in an environment of volatile markets.
BREAKDOWN OF UNIT HOLDINGS BY SIZE – RMB CLASS
Account Holders No. Of Units Held*
Size of Holdings No. % (‘000) %
5,000 and below - - - -
5,001 to 10,000 - - - -
10,001 to 50,000 1 9.09 36 0.02
50,001 to 500,000 2 18.18 756 0.34
500,001 and above 8 72.73 221,705 99.64
Total 11 100.00 222,497 100.00
BREAKDOWN OF UNIT HOLDINGS BY SIZE - RM CLASS
Account Holders No. Of Units Held*
Size of Holdings No. % (‘000) %
5,000 and below 6 13.64 18 -
5,001 to 10,000 3 6.82 27 0.01
10,001 to 50,000 13 29.54 370 0.08
50,001 to 500,000 8 18.18 1,136 0.24
500,001 and above 14 31.82 467,835 99.67
Total 44 100.00 469,386 100.00

23
BREAKDOWN OF UNIT HOLDINGS BY SIZE – RM-HEDGED CLASS
Account Holders No. Of Units Held*
Size of Holdings No. % (‘000) %
5,000 and below 3 13.64 4 -
5,001 to 10,000 2 9.09 14 0.01
10,001 to 50,000 - - - -
50,001 to 500,000 1 4.54 483 0.10
500,001 and above 16 72.73 467,016 99.89
Total 22 100.00 467,517 100.00
BREAKDOWN OF UNIT HOLDINGS BY SIZE – AUD-HEDGED CLASS
Account Holders No. Of Units Held*
Size of Holdings No. % (‘000) %
5,000 and below - - - -
5,001 to 10,000 - - - -
10,001 to 50,000 - - - -
50,001 to 500,000 5 45.45 1,068 2.49
500,001 and above 6 54.55 41,905 97.51
Total 11 100.00 42,973 100.00
BREAKDOWN OF UNIT HOLDINGS BY SIZE – USD-HEDGED CLASS
Account Holders No. Of Units Held*
Size of Holdings No. % (‘000) %
5,000 and below - - - -
5,001 to 10,000 - - - -
10,001 to 50,000 4 28.57 84 0.41
50,001 to 500,000 3 21.43 620 3.03
500,001 and above 7 50.00 19,745 96.56
Total 14 100.00 20,449 100.00
BREAKDOWN OF UNIT HOLDINGS BY SIZE – SGD-HEDGED CLASS
Account Holders No. Of Units Held*
Size of Holdings No. % (‘000) %
5,000 and below - - - -
5,001 to 10,000 - - - -
10,001 to 50,000 2 28.57 47 0.40
50,001 to 500,000 2 28.57 311 2.62
500,001 and above 3 42.86 11,492 96.98
Total 7 100.00 11,850 100.00
24
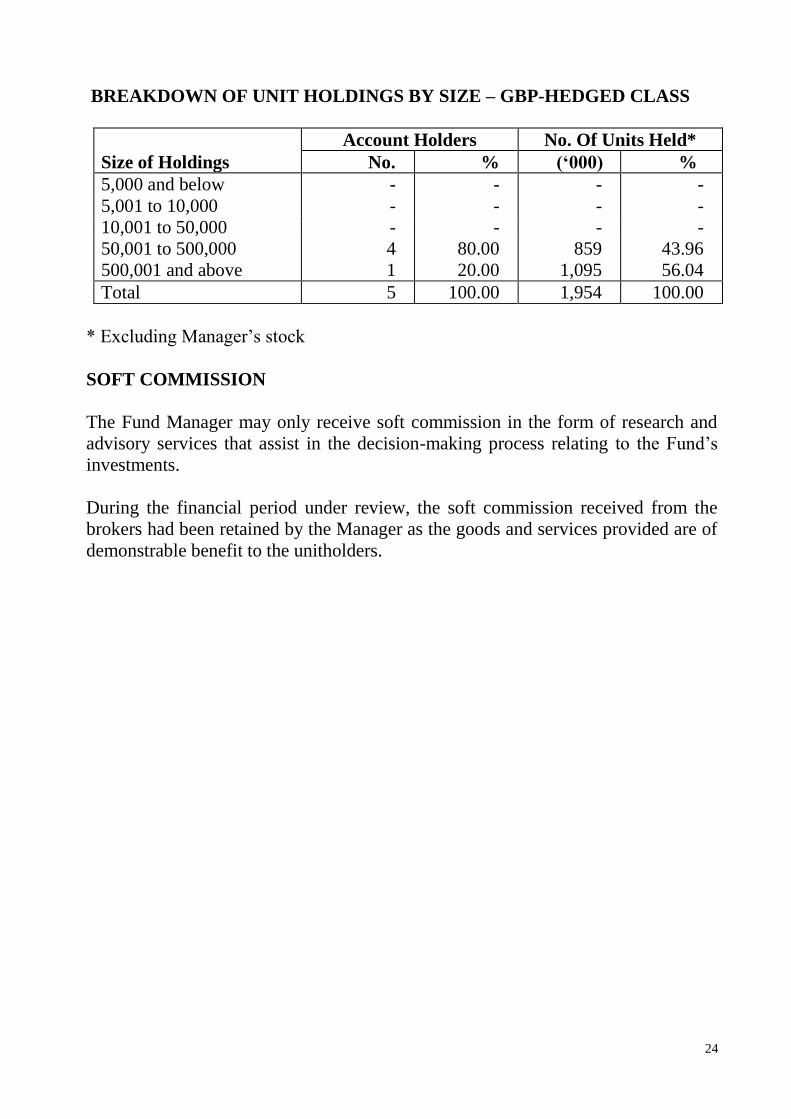
BREAKDOWN OF UNIT HOLDINGS BY SIZE – GBP-HEDGED CLASS
Account Holders No. Of Units Held*
Size of Holdings No. % (‘000) %
5,000 and below - - - -
5,001 to 10,000 - - - -
10,001 to 50,000 - - - -
50,001 to 500,000 4 80.00 859 43.96
500,001 and above 1 20.00 1,095 56.04
Total 5 100.00 1,954 100.00
* Excluding Manager’s stock
SOFT COMMISSION
The Fund Manager may only receive soft commission in the form of research and
advisory services that assist in the decision-making process relating to the Fund’s
investments.
During the financial period under review, the soft commission received from the
brokers had been retained by the Manager as the goods and services provided are of
demonstrable benefit to the unitholders.

25
RHB CHINA BOND FUND
UNAUDITED STATEMENT OF FINANCIAL POSITION
AS AT 31 MAY 2021
31.05.2021 28.02.2021
RMB RMB
ASSETS
Bank balances 17,167,991 19,004,380
Deposits with licensed financial
institutions 32,938,748 22,019,015
Investments 2,219,107,539 2,388,694,475
Amount due from fund manager of
collective investment scheme - 31,689,002
Amount due from Manager 3,961,173 64,678
Dividend receivables 9,279,282 10,725,385
TOTAL ASSETS 2,282,454,733 2,472,196,935
LIABILITIES
Amount due to fund manager of
collective investment scheme - 1,496,441
Amount due to Manager 2,829,994 21,045,732
Accrued management fee 1,542,439 1,525,030
Amount due to Trustee 77,122 76,251
Distribution payable 1,014,258 1,001,192
Forward foreign currency contracts 32,439,755 5,355,986
Other payables and accruals 20,672 35,883
TOTAL LIABILITIES (EXCLUDING
NET ASSETS ATTRIBUTABLE
TO UNITHOLDERS) 37,924,240 30,536,515
NET ASSET VALUE 2,244,530,493 2,441,660,420
NET ASSETS ATTRIBUTABLE TO
UNITHOLDERS 2,244,530,493 2,441,660,420
26
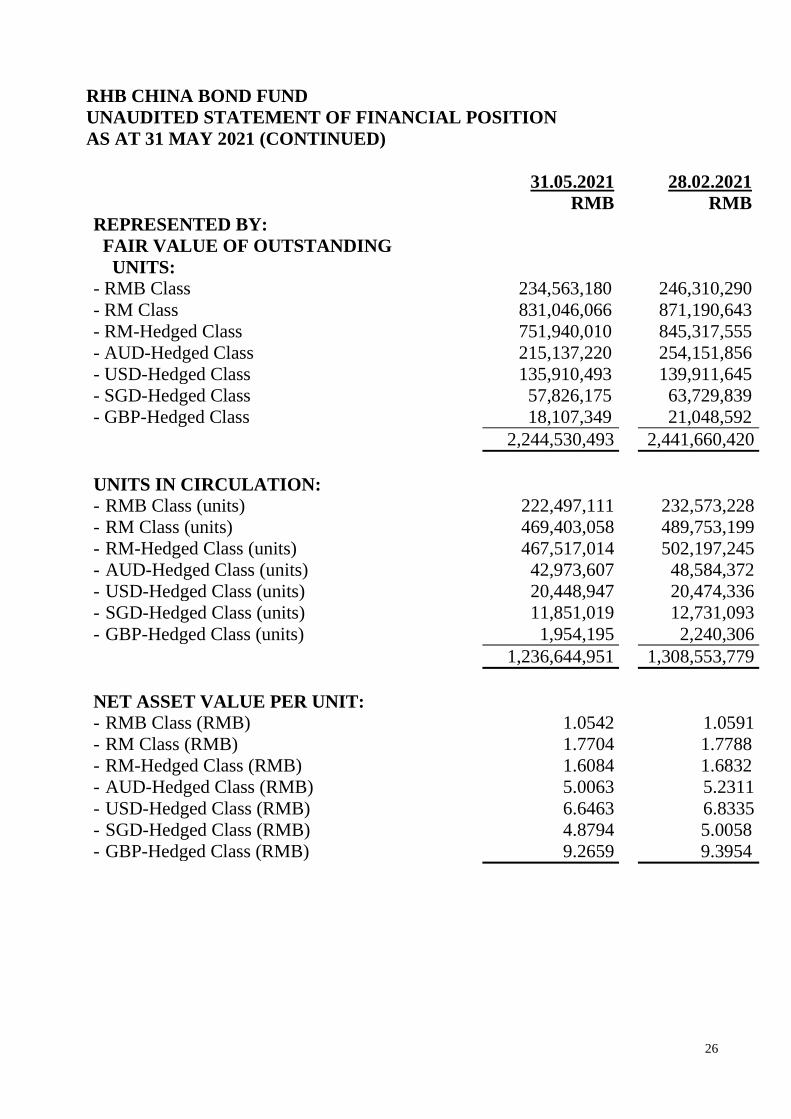
RHB CHINA BOND FUND
UNAUDITED STATEMENT OF FINANCIAL POSITION
AS AT 31 MAY 2021 (CONTINUED)
31.05.2021 28.02.2021
RMB RMB
REPRESENTED BY:
FAIR VALUE OF OUTSTANDING
UNITS:
- RMB Class 234,563,180 246,310,290
- RM Class 831,046,066 871,190,643
- RM-Hedged Class 751,940,010 845,317,555
- AUD-Hedged Class 215,137,220 254,151,856
- USD-Hedged Class 135,910,493 139,911,645
- SGD-Hedged Class 57,826,175 63,729,839
- GBP-Hedged Class 18,107,349 21,048,592
2,244,530,493 2,441,660,420
UNITS IN CIRCULATION:
- RMB Class (units) 222,497,111 232,573,228
- RM Class (units) 469,403,058 489,753,199
- RM-Hedged Class (units) 467,517,014 502,197,245
- AUD-Hedged Class (units) 42,973,607 48,584,372
- USD-Hedged Class (units) 20,448,947 20,474,336
- SGD-Hedged Class (units) 11,851,019 12,731,093
- GBP-Hedged Class (units) 1,954,195 2,240,306
1,236,644,951 1,308,553,779
NET ASSET VALUE PER UNIT:
- RMB Class (RMB) 1.0542 1.0591
- RM Class (RMB) 1.7704 1.7788
- RM-Hedged Class (RMB) 1.6084 1.6832
- AUD-Hedged Class (RMB) 5.0063 5.2311
- USD-Hedged Class (RMB) 6.6463 6.8335
- SGD-Hedged Class (RMB) 4.8794 5.0058
- GBP-Hedged Class (RMB) 9.2659 9.3954

27
RHB CHINA BOND FUND
UNAUDITED STATEMENT OF FINANCIAL POSITION
AS AT 31 MAY 2021 (CONTINUED)
31.05.2021 28.02.2021
RMB RMB
NET ASSET VALUE PER UNIT IN
RESPECTIVE CURRENCIES:
RMB Class (RMB) 1.0542 1.0591
RM Class (RM) 1.1454 1.1114
RM-Hedged Class (RM) 1.0406 1.0517
AUD-Hedged Class (AUD) 1.0140 1.0303
USD-Hedged Class (USD) 1.0428 1.0549
SGD-Hedged Class (SGD) 1.0108 1.0251
GBP-Hedged Class (GBP) 1.0249 1.0399

28
RHB CHINA BOND FUND
UNAUDITED STATEMENT OF INCOME AND EXPENSES
FOR THE FINANCIAL PERIOD ENDED 31 MAY 2021
01.03.2020-
31.05.2021
01.12.2020-
28.02.2021
RMB RMB
(LOSS)/INCOME
Dividend income 29,909,154 34,923,516
Interest income from deposits with
licensed financial institutions 106,179 104,208
Net loss on investments (15,213,531) (274,266)
Net foreign currency exchange loss (469,678) (661,560)
Net loss on forward foreign currency
contracts (45,408,168) (8,321,450)
(31,076,044) 25,770,448
EXPENSES
Management fee (4,710,501) (4,983,101)
Trustee fee (235,525) (249,155)
Audit fee (2,495) (2,439)
Tax agent's fee (1,588) (1,552)
Other expenses (11,086) (9,472)
(4,961,195) (5,245,719)
Net (loss)/income before finance cost
and taxation (36,037,239) 20,524,729

29
RHB CHINA BOND FUND
UNAUDITED STATEMENT OF INCOME AND EXPENSES
FOR THE FINANCIAL PERIOD ENDED 31 MAY 2021
01.03.2020-
31.05.2021
01.12.2020-
28.02.2021
RMB RMB
FINANCE COST (EXCLUDING
DECREASE IN NET ASSETS
ATTRIBUTABLE TO
UNITHOLDERS)
Distributions:
RMB Class (1,988,993) (2,303,828)
RM Class (7,144,312) (7,795,655)
RM-Hedged Class (7,141,433) (8,001,494)
AUD-Hedged Class (2,099,210) (2,512,808)
USD-Hedged Class (1,291,825) (1,311,378)
SGD-Hedged Class (564,850) (618,499)
GBP-Hedged Class (174,094) (203,114)
(20,404,717) (22,746,776)
Net loss before taxation (56,441,956) (2,222,047)
Taxation - -
Net decrease in net assets attributable
to unitholders (56,441,956) (2,222,047)
Net decrease in net assets attributable
to unitholders is made up of the
following:
Realised amount 10,841,930 23,192,319
Unrealised amount (67,283,886) (25,414,366)
(56,441,956) (2,222,047)

30
RHB CHINA BOND FUND
UNAUDITED STATEMENT OF CHANGES IN NET ASSET VALUE
FOR THE FINANCIAL PERIOD ENDED 31 MAY 2021
01.03.2020-
31.05.2021
01.12.2020-
28.02.2021
RMB RMB
Net assets attributable to unitholders
at the beginning of the financial
period 2,441,660,420 2,448,130,294
Movement due to units created and
cancelled during the financial period:
Creation of units from distributions
RMB Class 1,985,236 2,299,645
RM Class 6,561,991 7,272,717
RM-Hedged Class 6,812,130 7,651,808
AUD-Hedged Class 2,006,419 2,397,543
USD-Hedged Class 1,286,879 1,303,401
SGD-Hedged Class 563,736 617,378
GBP-Hedged Class 174,068 203,091
19,390,459 21,745,583
Creation of units from applications
RMB Class 6,408,124 24,349,318
RM Class 24,348,415 79,770,792
RM-Hedged Class 4,122,281 24,553,221
AUD-Hedged Class 3,726,696 15,665,225
USD-Hedged Class 8,458,248 61,133,063
SGD-Hedged Class 670,776 7,898,233
GBP-Hedged Class 541,434 5,916,883
48,275,974 219,286,735
31
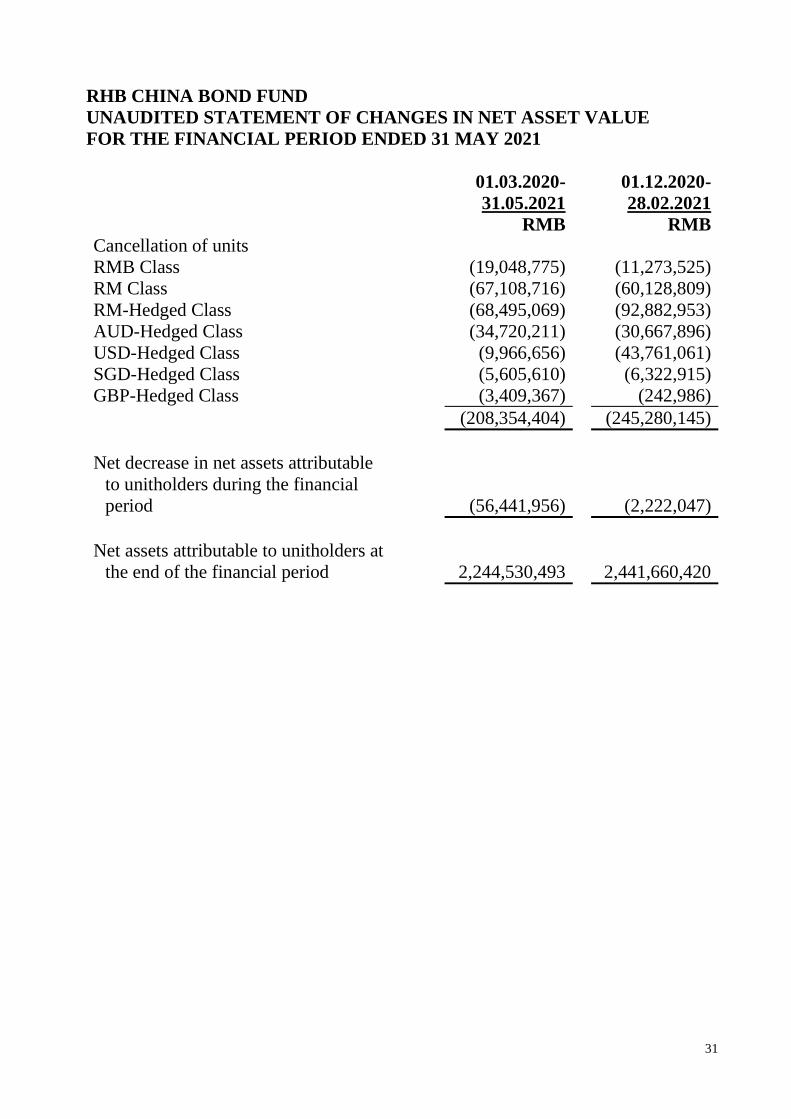
RHB CHINA BOND FUND
UNAUDITED STATEMENT OF CHANGES IN NET ASSET VALUE
FOR THE FINANCIAL PERIOD ENDED 31 MAY 2021
01.03.2020-
31.05.2021 01.12.2020-
28.02.2021
RMB RMB
Cancellation of units
RMB Class (19,048,775) (11,273,525)
RM Class (67,108,716) (60,128,809)
RM-Hedged Class (68,495,069) (92,882,953)
AUD-Hedged Class (34,720,211) (30,667,896)
USD-Hedged Class (9,966,656) (43,761,061)
SGD-Hedged Class (5,605,610) (6,322,915)
GBP-Hedged Class (3,409,367) (242,986)
(208,354,404) (245,280,145)
Net decrease in net assets attributable
to unitholders during the financial
period (56,441,956) (2,222,047)
Net assets attributable to unitholders at
the end of the financial period 2,244,530,493 2,441,660,420

32
RHB CHINA BOND FUND
UNAUDITED STATEMENT OF CASH FLOWS
FOR THE FINANCIAL PERIOD ENDED 31 MAY 2021
01.03.2020-
31.05.2021
01.12.2020-
28.02.2021
RMB RMB
CASH FLOWS FROM OPERATING
ACTIVITIES
Proceed from sale of investments 218,062,407 143,880,699
Purchase of investments (33,496,441) (233,303,559)
Interest received from deposits with licensed
financial institutions 106,179 104,208
Dividend received 31,355,257 35,627,070
Management fee paid (4,693,092) (4,953,137)
Trustee’s fees paid (234,654) (247,657)
Payment for other fees and expenses (30,380) (9,268)
Net realised loss on foreign currency forward
contracts (18,324,399) (11,157,914)
Net realised loss on foreign exchange (425,143) (633,828)
Net cash generated from/(used in) operating
activities 192,319,734 (70,693,386)
CASH FLOWS FROM FINANCING
ACTIVITIES
Cash proceeds from units created 44,379,479 270,064,283
Cash paid for units cancelled (226,570,142) (224,752,890)
Cash paid for income distribution (1,001,192) (773,425)
Net cash (used in)/generated from financing
activities (183,191,855) 44,537,968
Net increase/(decrease) in cash and cash
equivalents 9,127,879 (26,155,418)
Foreign currency translation difference (44,535) (27,732)
Cash and cash equivalents at the beginning
of the financial period 41,023,395 67,206,545
Cash and cash equivalents at the end of the
financial period 50,106,739 41,023,395

33
CORPORATE INFORMATION
MANAGER
RHB Asset Management Sdn Bhd
REGISTERED OFFICE
Level 10, Tower One, RHB Centre, Jalan Tun Razak, 50400 Kuala Lumpur
PRINCIPAL AND BUSINESS OFFICE
Level 8, Tower Two & Three, RHB Centre, Jalan Tun Razak, 50400 Kuala Lumpur
E-mail Address : [email protected]
Tel: 03 - 9205 8000
Fax: 03 - 9205 8100
Website: www.rhbgroup.com
BOARD OF DIRECTORS
Mr Yap Chee Meng (Independent Non-Executive Chairman)
Mr Chin Yoong Kheong (Senior Independent Non-Executive Director)
Dr. Ngo Get Ping (Independent Non-Executive Director)
(Retired with effect from 24 May 2021)
Ms Ong Yin Suen (Managing Director / Chief Executive Officer)
YBhg Dato’ Darawati Hussain (Independent Non-Executive Director)
YBhg Datuk Seri Dr Govindan A/L Kunchamboo (Independent Non-Executive
Director)
INVESTMENT COMMITTEE MEMBERS
Mr Yap Chee Meng (Independent Chairman)
YBhg Dato’ Darawati Hussain
Puan Sharifatu Laila Syed Ali
CHIEF EXECUTIVE OFFICER
Ms Ong Yin Suen
SECRETARIES
Encik Azman Shah Md Yaman (LS No. 0006901)
Cik Hasnita Sulaiman (MAICSA No. 7060582)

34
BRANCH OFFICE Kuala Lumpur Office B-9-6, Megan Avenue 1 No. 189, Jalan Tun Razak 50400 Kuala Lumpur Tel: 03-2171 2755/ 03-2166 7011 Fax: 03-2770 0022 Shah Alam Office B-3-1, 1st Floor Jalan Serai Wangi G16/G, Alam Avenue Persiaran Selangor, Section 16 40200 Shah Alam Tel: 03-5523 1909 Fax: 03-5524 3471 Sri Petaling Office Level 1 & 2, No 53 Jalan Radin Tengah Bandar Baru Seri Petaling 57000 Kuala Lumpur Tel: 03-9054 2470 Fax: 03-9054 0934 Batu Pahat Office 53, 53-A and 53-B Jalan Sultanah 83000 Batu Pahat, Johor Tel: 07-438 0271/ 07-438 0988 Fax: 07-438 0277 Ipoh Office No.7A, Persiaran Greentown 9 Pusat Perdagangan Greentown 30450 Ipoh, Perak Tel: 05-242 4311 Fax: 05-242 4312 Johor Bahru Office No 34 Jalan Kebun Teh 1 Pusat Perdagangan Kebun Teh 80250 Johor Bahru, Johor Tel: 07-221 0129 Fax: 07-221 0291 2nd Floor, 21 & 23 Jalan Molek 1/30, Taman Molek 81100 Johor Bahru, Johor Tel: 07-358 3587 Fax: 07-358 3581 Kuantan Office 1st Floor, Lot 10, Jalan Putra Square 1 Putra Square 25300 Kuantan, Pahang Tel: 09-517 3611/ 09-517 3612/ 09-531 6213 Fax: 09-517 3615
35
Kuching Office Lot 133, Section 20, Sublot 2 & 3 1st Floor, Jalan Tun Ahmad Zaidi Adruce 93200 Kuching, Sarawak Tel: 082-550 838 Fax: 082-550 508 Yung Kong Abell, Units 1-10
2nd Floor Lot 365
Section 50 Jalan Abell
93100 Kuching, Sarawak
Tel: 082-245 611 Fax: 082-230 326
Kota Bharu Office Ground Floor, No 3486-G
Jalan Sultan Ibrahim
15050 Kota Bharu, Kelantan
Tel: 09-740 6891 Fax: 09-740 6890
Kota Kinabalu Office Lot No. C-02-04, 2nd Floor
Block C, Warisan Square
Jalan Tun Fuad Stephens
88000 Kota Kinabalu, Sabah
Tel: 088-528 686/ 088-528 692
Fax: 088-528 685
Melaka Office 581B, Taman Melaka Raya
75000 Melaka
Tel: 06-284 4211/ 06-281 4110
Fax: 06-292 2212
Miri Office Lot 1268 & 1269, Second Floor
Centre Point Commercial Centre
Jalan Melayu
98000 Miri, Sarawak
Tel: 085-422 788 Fax: 085-415 243
Penang Office 3rd Floor, 44 Lebuh Pantai
10300 Georgetown, Penang
Tel: 04-264 5639 Fax: 04-264 5640
Prai Office No 38, First Floor
Jalan Todak 2
Seberang Jaya
13600 Perai, Penang
Tel: 04-386 6670 Fax: 04-386 6528

36
TRUSTEE CIMB Commerce Trustee Berhad
BANKER RHB Bank Berhad
AUDITORS PricewaterhouseCoopers PLT
TAX ADVISER KPMG Tax Services Sdn Bhd
DISTRIBUTORS RHB Asset Management Sdn Bhd
RHB Bank Bhd
Affin Bank Bhd
Alliance Bank Berhad
AmBank Bhd
Areca Capital Sdn Bhd
CIMB Bank Bhd
CIMB Investment Bank Bhd
Citibank Bhd
HSBC Bank (M) Bhd
iFast Capital Sdn Bhd
Kenanga Investors Bhd
Maybank Bhd
OCBC Bank (M) Bhd
Philip Mutual Bhd
United Overseas Bank (M) Bhd
UOB Kay Hian Securities (M) Sdn Bhd
