rfid in chemotherapy production & mistake-proofing
TRANSCRIPT

RFID in chemotherapy production &mistake-proofing techniques for
managing competencies in scheduling.
Sylvain Housseman, Nabil Absi, Rémi Collomp and Dominique Feillet.
Day on OR in Cancer Treatment & Operation Management.
Nov. 17, 2010, Paris
2 / 23
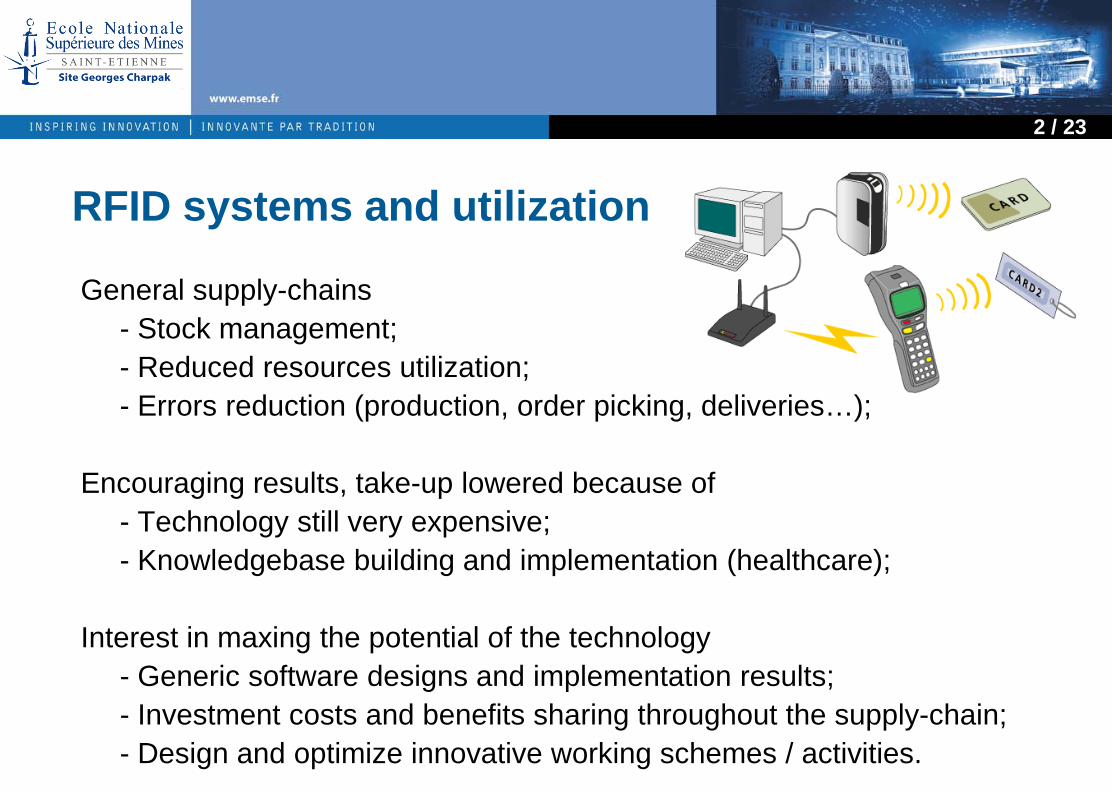
RFID systems and utilization
General supply-chains- Stock management;- Reduced resources utilization;- Errors reduction (production, order picking, deliveries…);
Encouraging results, take-up lowered because of- Technology still very expensive;- Knowledgebase building and implementation (healthcare);
Interest in maxing the potential of the technology - Generic software designs and implementation results;- Investment costs and benefits sharing throughout the supply-chain;- Design and optimize innovative working schemes / activities.

3 / 23
Problematic and assumptions
Description of the tool being developed- Simulation- Scheduling- Performance measure
First results
Conclusions / Perspectives

4 / 23
”Impacts of RFID technologies in healthcare”
Health systems objectives / performance measure:- Minimize risks;- Minimize costs;- Maximize Quality of Service.
Generic impacts of RFID in chemotherapy production:- Stocks management; - Regulatory traceability (who, what, when, where, why, how); - Errors reduction (production, deliveries, transport conditions…).
Specific impacts and implications of the previous:- Oncology pharmacy sharing, home treatment;- Production assistance;
On-the-job training and competencies management.
5 / 23
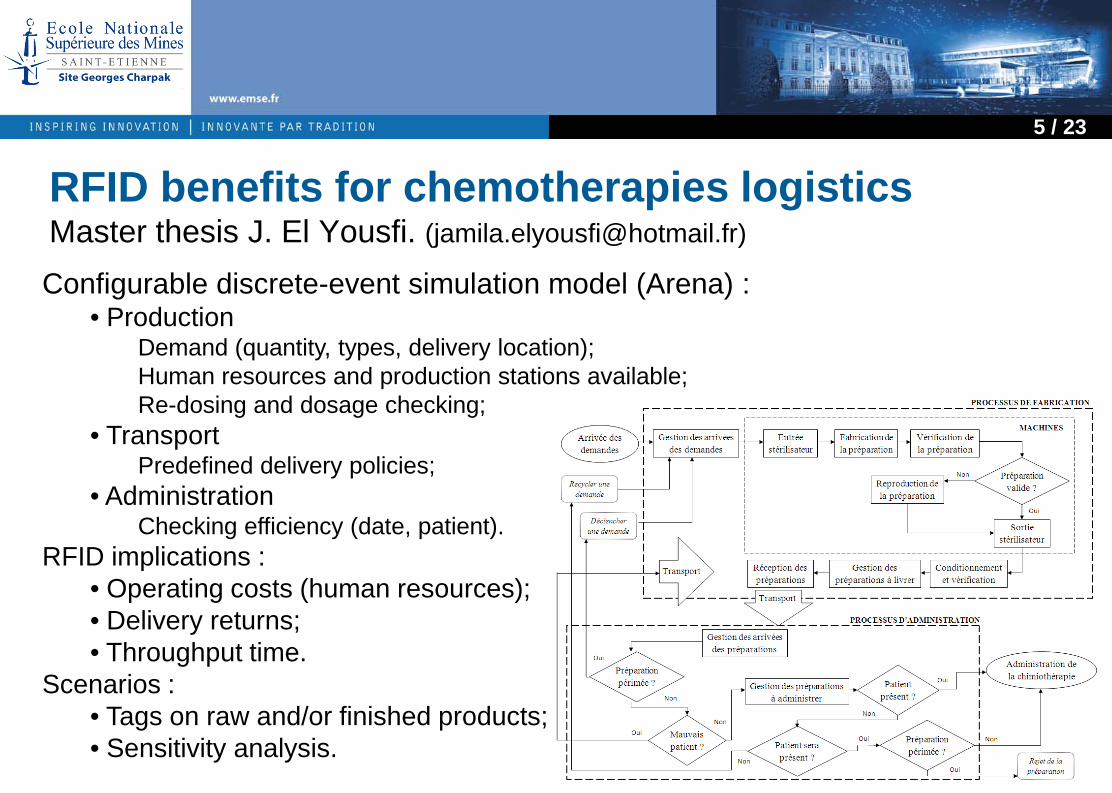
RFID benefits for chemotherapies logisticsMaster thesis J. El Yousfi. ([email protected])
Configurable discrete-event simulation model (Arena) :• Production
Demand (quantity, types, delivery location);Human resources and production stations available;Re-dosing and dosage checking;
• TransportPredefined delivery policies;
• AdministrationChecking efficiency (date, patient).
RFID implications :• Operating costs (human resources);• Delivery returns;• Throughput time.
Scenarios :• Tags on raw and/or finished products;• Sensitivity analysis.

6 / 23
Chemotherapies (Cytotoxics) concoctionTreatment containing several active molecules.Mostly perishable products, with some particular sensitiveness to light, heat, …
Low therapeutic index, dosages to measure;Respect of the protocol is important for efficient treatments.

7 / 23
Mistake-proofing devices and methods
Double-checking85% of the mistakes detected. (Facchinetti NJ, Med Care 1999;37:39-43)
Post-production detection :« Reliable real-time analytical control of monoclonal
antibodies chemotherapies preparations on Multispec automaton »
(Bazin et al., 2010).Arranging the product requires
another isolator lap…
Prospective trial :Insert the automaton within the isolator?

8 / 23
Products identification (needed on primary package):Barcodes?RFID?
Step by step guidanceof the manipulator(s)Weight control
Real-time production guidance, calculation of doses, gravimetric measurements…
Mistake-proofing devices and methods
9 / 23
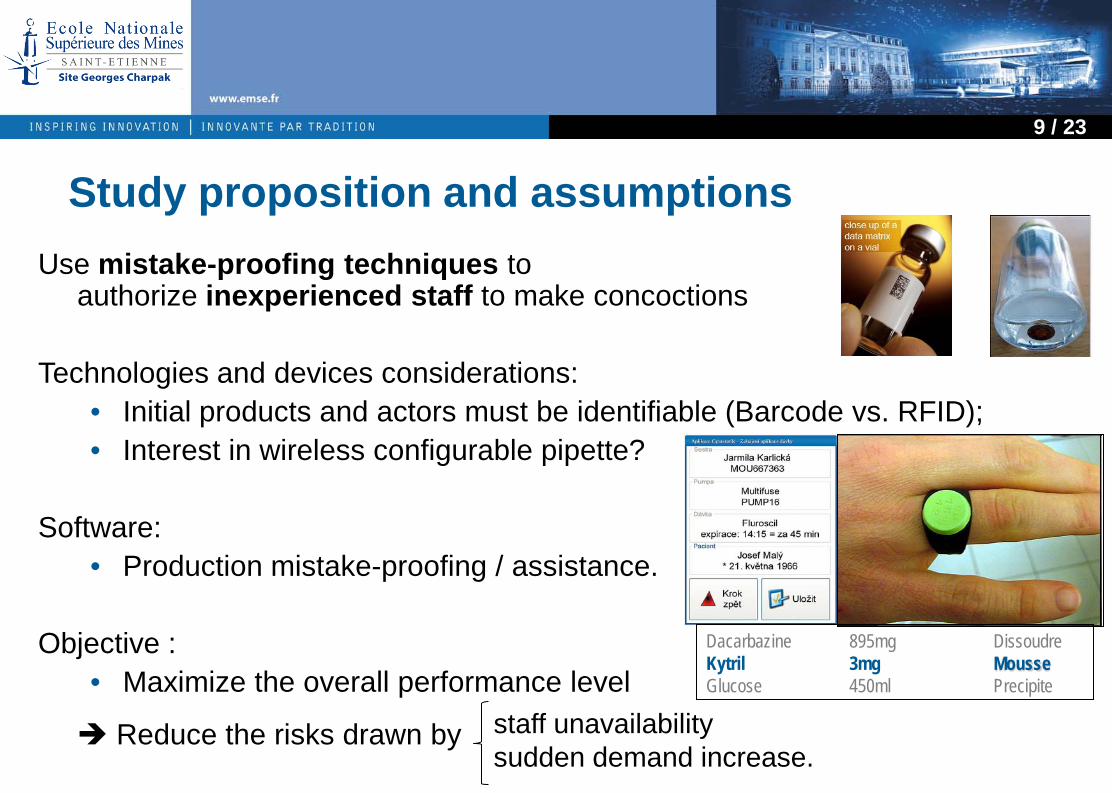
Use mistake-proofing techniques to authorize inexperienced staff to make concoctions
Technologies and devices considerations:• Initial products and actors must be identifiable (Barcode vs. RFID);• Interest in wireless configurable pipette?
Software:• Production mistake-proofing / assistance.
Objective : • Maximize the overall performance level
Reduce the risks drawn by
Study proposition and assumptions
Dacarbazine 895mg DissoudreKytril 3mg MousseGlucose 450ml Precipite
staff unavailabilitysudden demand increase.

10 / 23
Problematic and assumptions
Description of the tool being developed- Simulation- Scheduling- Performance measure
First results
Conclusions / Perspectives

11 / 23
Study approachSimulation (Real system) Schedule generator
Human resources• Profile (learning curve)• Experience level• Stochastic parameters
Processing observations• Time to process a task• Impact of processing errors• Observation variability
Tasks arrivals• Emergencies, cancellations
Resources estimated performance• Based on X observations(importance of their accurateness)• Estimation function (average, linear regression, …): Differs from simulation!
Resources selection (strategies)
Objectives• Quality of Service (QoS)• Performance improvement(purposed QoS reduction)
technology

12 / 23
Sequence of a day:Choose the isolator team (depending on the prospected activity);Generate 1st schedule;Start observations;On events (stochastic?): schedule does not fit observation, patient cancelled, unexpected request, …
Update schedule and continue.
Main parameters: Demand instances; Staff selection strategies; Resources estimated performance: frequency and function; Resources performance level and profile – learning curve, consistency; Observations precision; Delayed release dates probability; Tasks abortion probability; …
Study approach: Simulation

13 / 23
Simulation : The learning curveWright (1936), planes manufacturing cost
Whatever the tasks, the learning curve has an identical shape (Ritter et Schooler, 2001) Typical formulation :

14 / 23
Forgetting functionLearn-Forget Curve Model, LFCM (Jaber et Bonney, 1996, 1997):- Forgetting depends on the accumulated experience
when pause happens;- Competency loss depends on the amount of time
needed to acquire it; - After a long enough length without practicing,
experience is completely lost.
Adapting this model to our problem: - Products are unique but can be sorted in few types
(difficulties: foams / precipitates, complexity…);- An “ideal” processing length is associated to each
preparation order (when performance = 1).

15 / 23
Integer linear programming:- Time-indexed model (bad results);- Schedule position indexed model (no experimentation results yet);
Taboo heuristic: - Initial affectation to the earlier finishing resource
Sorting by Late-Start, Due date, Processing time, priority…- Step 1 : Minimize lateness (M * reached deadlines + Σ latenesses)(Neighborhood : 2 tasks exchange or 1 task reallocation);- Quality of service purposed degradation (%tage);- Step 2 : Maximize competencies evolution respecting the lateness score(considering the QoS degradation).
Schedule generation approach

16 / 23
Performance indicators
Quality of service:- Lateness as compared to the announced hour;- Reactivity (patient throughput time).
Competencies / experience evolution- Inexperienced manipulators are present at the beguinning of any instancy;- Quality of the competencies estimates.
Risks: Simultaneous unavailability, sudden demand augmentation- Same as above measured on « extreme scenarios »i.e. twice the usual demand with the less efficient resources…
Costs- Experimental system (devices + softwares) Cost hard to estimate.

17 / 23
Problematic and assumptions
Description of the tool being developed- Simulation- Scheduling- Performance measure
First results
Conclusions / Perspectives

18 / 23
0
0,5
1
1,5
2
2,5
0 5 10 15 20 25 30 35
Série1
Série2
Série3
0
0,5
1
1,5
2
2,5
0 5 10 15 20 25 30 35
Série1
Série2
Série3
Without performance management approach
With performance management part
First results:

19 / 23
First results: Staff selection
Random, whatever the workload
Strategy using the sum of performance level
• Lowest on easy days• Random on normal days• Largest on hard days
Strategy using competencies details• Lowest per (sorted) type on easy days• Random on normal days• Best per (sorted) type on hard days
ordoMakerStrategy_00_RandomSelection,cfg initPTimeSum
0
50000
100000
150000
200000
250000
0,01
0,13
0,19
0,26
0,36 1,1
1,18
1,24
1,36
2,07
2,14
2,21
2,28
2,37
3,11
3,19
3,28
3,37
4,09
4,15
4,23 4,3
4,38
5,13
5,21
5,35 6,1
6,16
6,22
6,34
7,08
7,14 7,2
7,27
7,36
8,07
8,17
8,29
9,06
9,14
9,22
9,34
ordoMakerStrategy_00_Str01,cfg initPTimeSum
0
50000
100000
150000
200000
250000
0,06
0,13 0,2
0,29
0,37 1,1
1,18
1,24
1,36
2,11
2,16
2,28
2,35
3,06
3,15
3,23
3,32
4,06
4,13 4,2
4,26
4,35
5,08
5,17
5,25
5,41
6,12
6,19
6,25
6,36
7,09
7,15
7,22
7,29
7,39
8,14
8,26
8,36
9,11
9,17
9,28
9,37
ordoMakerStrategy_00_Str02,cfg initPTimeSum
0
50000
100000
150000
200000
250000
0,06
0,14 0,2
0,28
0,36
1,09
1,16
1,23
1,33
2,05
2,13
2,21 2,3
2,36
3,08
3,16
3,22
3,34
4,06
4,12
4,18
4,23
4,31
4,38
5,12
5,19
5,35
6,09
6,16
6,23
6,33
7,05
7,13
7,19
7,25
7,34
8,06
8,16
8,28
9,05
9,13 9,2
9,31 9,4

20 / 23
Problematic and assumptions
Description of the tool being developed- Simulation- Scheduling- Performance measure
First results
Conclusions / Perspectives

21 / 23
Conclusion / perspectivesSimulation model • Hard to configure realistically _ Data acquisition through RFID?• Include performance shaping factors (stochastic performance)• Stochastic studies will require a (very) long computation time…
Estimation of the impacts of RFID in chemotherapy production• Regroup the different studies (multi-level simulation)• New activities: Operational modifications (staff management, production
site sharing) adds value to RFID projects
Sensitivity analysis on resources- Different initial performance levels- Personal profiles (learning curve parameters)

22 / 23
Precise impact of preparation mistakes
CATO® : Production length augmentation,Solvent and/or raw medication wasted (low quantity);
Multispec® 1 : Preparation must go for a second round in isolator,Solvent and/or raw medication wasted (large quantity);
Multispec® 2 : Production length augmentation,Solvent and/or raw medication wasted (large quantity);
Electro-Pipette : Specifications to be defined / adapted to cytotoxics,What leeway and competencies for manipulators?
Short-term perspective: Material scenarios

23 / 23
Thanks for still being there…
Questions / Suggestions?
Day on OR in Cancer Treatment & Operation Management.
Nov. 17, 2010, Paris