rewarding performance: lessons for nevada’s k-12 … · to underscore this point, rand...
TRANSCRIPT
0
POLICY REPORT OCTOBER 2016
2016
Rewarding Performance:
Lessons for Nevada’s K-12 System
KENNY GUINN CENTER FOR POLICY PRIORITIES

1
POLICY REPORT OCTOBER 2016
Table of Contents
Executive Summary ............................................................................................................................. 2
Introduction........................................................................................................................................ 8
The Landscape ................................................................................................................................... 9
Compensation Plans in the United States ............................................................................................ 10
Description of Performance-Based Plans and Incentive Programs ......................................................... 16
Overview ................................................................................................................................................. 16
Summary of Issues Related to Incentive Programs ................................................................................ 24
Teacher Retention ............................................................................................................................... 24
Size of Incentives ................................................................................................................................. 24
Incentives to Fill Hard-to-Fill positions ............................................................................................... 25
Teacher Attitudes ................................................................................................................................ 26
Individual Versus School-Based Compensation .................................................................................. 26
Best Practices .......................................................................................................................................... 27
Clarity Around Measurement and Evaluation .................................................................................... 27
School Culture ..................................................................................................................................... 28
Sustainability ....................................................................................................................................... 28
Nevada Landscape ............................................................................................................................ 29
Performance-Based Compensation Plans ............................................................................................... 32
Pay Performance and Enhanced Compensation (Assembly Bill 483) ................................................. 32
Great Teaching and Leading Fund (Senate Bill 474) ........................................................................... 33
Teach Nevada Scholarship (Senate Bill 511) ....................................................................................... 36
Additional Teacher Incentive Programs .............................................................................................. 37
Evaluating Nevada’s Classroom Educators .......................................................................................... 39
Nevada Educator Performance Framework ........................................................................................... 39
Recommendations............................................................................................................................. 41
REFERENCES ............................................................................................................................................ 47

2
POLICY REPORT OCTOBER 2016
Executive Summary
In recent years, education leaders and policy experts have directed heightened attention and resources
to assessing and evaluating the ways that states and local school districts compensate teachers for their
work. There are two distinct phenomena motivating these factors. The first is the growing teacher
shortage. Additionally, teacher turnover is an issue, particularly at at-risk schools. Second, many school
districts retain a significant number of ineffective teachers in the classrooms of our public K-12 schools.
In Nevada, personnel costs (salaries and wages) consume 80 percent of the State’s education budget.
Given the size of investment, policy makers and education officials are eager to ensure that the State is
attracting and retaining the best teachers, supporting them, and compensating them in a way that
rewards their work and their impact on student achievement.
Around the country, school districts and policy makers have attempted to address these two phenomena
by using financial incentives—namely performance-based compensation plans and incentives. This policy
report explores how states and school districts have implemented these financial incentive-based
compensation plans, describes the current landscape in Nevada, and offers recommendations that may
be taken under advisement by Nevada’s legislative leaders, policy makers, and education officials.
More than two dozen states have implemented revised performance-based compensation programs and
incentives. Unfortunately, the research is far from conclusive. In some cases, incentive programs are
associated with increases in student test scores and higher rates of teacher retention. In other districts,
the effect on positive outcomes was minimal or short-lived. Moreover, performance-based compensation
and incentive programs have been implemented along with other education reforms, thus making it
difficult to truly isolate the effect of performance-based compensation initiatives. In most cases,
performance-based compensation schemes have been accompanied by revisions to the framework for
evaluating teachers and principals.
Like many other states, Nevada has rolled out several performance-based compensation and incentive
programs. Among these are: Great Teaching and Leading Fund, Teach Nevada Scholarship and Teacher
and New Teacher Incentives Fund, and Enhanced Compensation and Performance Pay Plan (AB 483). In
addition, Victory School and Zoom School programs provide teacher incentives. Also, in recent years,
Nevada has established a new framework for evaluating teachers, the Nevada Educator Performance
Framework (NEPF), that uses student data and other qualitative measures to evaluate teachers.
To date, school districts in Nevada have been slow to use the NEPF to link teaching effectiveness with
compensation. Additionally, the State and districts have not developed an integrated implementation
plan for the various performance-based compensation and incentive programs.
Rewarding Performance: Lessons for Nevada’s K-12 System
$

3
POLICY REPORT OCTOBER 2016
To strengthen the existing system of how the State rewards the work of its licensed educational
professionals, the Guinn Center has the following recommendations that may be taken under advisement
by members of the SAGE Commission and the State’s political leaders and education officials.
1. Require an external third party evaluation on all compensation programs
Research underscores the importance of conducting independent, comprehensive program evaluations.
Recognizing the significance of accountability, the Nevada Legislature mandated an external, third party
evaluation of many of the education initiatives approved during the 78th Legislative Session in 2015. For
example, legislation approving Zoom School and Victory School funding required the Nevada Department
of Education (NDE) to “contract for an independent evaluation of the effectiveness of the programs and
services provided by the school districts and charter schools that received money.” In addition, NDE has
recently completed an external evaluation of the Great Teaching and Leading Fund. Experience from other
states and school districts suggests that pay for performance systems have failed when not administered
and monitored effectively. If not already proposed, the Nevada Board of Education should also conduct
an external evaluation of the Enhanced Compensation and Performance Pay Program and the Teach
Nevada Scholarship and Teacher Incentive Funds. The Nevada Department of Education should conduct
an external evaluation of all compensation programs, including both performance-based and incentive
programs.
2. Develop statewide guidance on existing performance-based compensation and incentive programs
a. Establish standard outcome measures
b. Require that school districts regularly evaluate the impact of teaching incentive programs
and new salary schedules on teacher retention, teacher quality, and student outcomes
c. Require that school districts link the Nevada Education Performance Framework to
performance-based compensation and incentive programs
Recently, Nevada has implemented several performance-based compensation and incentive programs.
Among these are the Teach Nevada Scholarship, the Enhanced Compensation and Performance Pay
program, and Victory and Zoom Program incentive funds. However, NDE has yet to articulate consistent
performance metrics or outcomes across all programs. To its credit, NDE allows flexibility in the
implementation of the performance-based compensation and incentive programs so that school districts
can best respond to the unique needs of each school and district. However, in exchange for this flexibility,
NDE should strengthen measures of accountability and establish statewide performance metrics to ensure
that funds are being used in effective ways that serve the goals of these programs. In consultation with
school districts, NDE should consider creating uniform, statewide measurable objectives for the
evaluation of performance-based compensation and incentive programs.
Similarly, over the last few years, school districts and the Nevada Legislature have established programs
to improve the recruitment and retention of (high-quality) teachers. For example, in 2015, the Nevada
Legislature established the Great Teaching and Leading Fund to help recruit and retain high quality

4
POLICY REPORT OCTOBER 2016
licensed educational professionals. This year, the Clark County Education Association and Clark County
School District implemented the Professional Growth System, which restructures the traditional salary
schedule in ways that reward improved educator practice and provide career advancement options for
educators who do not want to leave the classroom. To assess the State’s return on investment and identify
best practices that can be replicated in other school districts around the State, the Legislature (and/or the
State Board of Education) should require school districts to evaluate the impact of the new salary
schedules and teacher incentive programs on teacher retention, teacher quality, and student outcomes.
The State Board of Education should require these evaluations to be presented and submitted annually.
Additionally, last year, NDE provided funds, through the Great Teaching and Leading Fund (SB 474), to
help school districts understand, implement and use the Nevada Educator Performance Framework
(NEPF), the State’s new framework for evaluating teachers. Teachers have been trained on this framework
and they have expressed a degree of comfort with using the framework. A recent evaluation noted:
Overall, the framework itself is viewed positively in terms of its goals and intentions, and
educators are not overwhelmingly opposed to implementing the NEPF based on its
content and processes.
However, many districts are not using or integrating the NEPF. For instance, several districts who
dedicated funds to meet the requirements of the Enhanced Compensation and Performance Pay
legislative requirement (AB 483) did not explicitly link the distribution of funds to the NEPF. All new
programs and policies – including performance-based compensation and incentive programs-- should
incorporate the use of NEPF. The Legislature and State Board of Education should consider requiring
school districts to link the NEPF to performance-based compensation and incentive programs.
3. Improve the integration of all performance- based compensation and incentive programs
Research has documented the positive and robust relationship between teacher quality and academic
outcomes. The desire to improve the quality of the Silver State’s teaching professionals, as well as to
reduce the alarming number of teacher vacancies, has prompted law makers to direct new funds to a
performance-based compensation model, as well as teacher incentive funds. However, these new
performance-based compensation and incentive programs have been rolled out in piecemeal fashion,
rather than in an integrated, systematic manner. Similarly, to maximize local autonomy, the State has not
provided a uniform, integrated framework or plan for administering (or evaluating) these programs. In
the absence of an integrated plan, there is some risk that the implementation of these programs may
result in redundancies or fail to maximize their intended impact.
To underscore this point, RAND Corporation has conducted research evaluating several performance-
based compensation programs around the United States. The researchers found that the program did
“not produce its intended effects” and that it “did not improve student achievement at any grade level.”

5
POLICY REPORT OCTOBER 2016
They concluded by noting the key conditions that “would enable the program to be successful.” Among
these were “understanding of the program, perceived value of the bonus, and perceived fairness.” The
absence of a district level integrated plan of all performance-based compensation and incentive programs
may undermine a full understanding of the programs and reduce their impact. The State Board of
Education and Nevada Department of Education should require all school districts to develop, submit, and
present an integrated implementation plan for all performance-based compensation and incentives
programs. This requirement could serve to reduce redundancy or duplication of the various compensation
and incentive programs and could strengthen overall impact.
4. Continue State-sponsored incentive programs and consider new ways of funding them
Incentive programs around the country have had some success in improving student academic outcomes,
increasing teacher retention, filling hard-to-fill teaching positions, and/or reducing teacher vacancies at
under-performing schools. Research also indicates that performance-based bonuses may have an
advantage over performance-based salary increases. For instance, bonuses have been shown to increase
staff performance more effectively than performance-based salary increases.
In 2015, Nevada launched the Teach Nevada Scholarship and New Teacher Incentive fund. This fund
provides a one-time incentive to new teachers. Nevada should continue using incentives to attract high-
quality teachers to hard-to-fill positions and to high-need schools. The Legislature should continue
funding the Teach Nevada Scholarship and Incentive Fund program. However, the Legislature should
revise the program to target the incentives to the following categories of teachers: (1) high-quality
teachers (as demonstrated by the NEPF “highly effective” ratings) to teach in the State’s under-
performing, high poverty schools, (2) Special Education teachers, (3) and math and science teachers.
Research also indicates that teacher incentive programs could be a cost-effective alternative to other
existing programs or interventions designed to improve student achievement. For example, one study
noted that in comparison to class size reduction interventions, the cost of producing similar academic
gains through teacher incentives were estimated to be $7,000 cheaper than it would have been to reduce
class size. In elementary schools, for example, teacher transfer incentives were $13,000 cheaper than the
class-size reduction benchmark.
Earlier this year, the Nevada Department of Education proposed legislation that would allow schools to
apply for a literacy block grant that would reallocate money intended for classroom-size reduction. To
receive a grant, schools would have to present a site plan that indicates how the money will be used to
improve literacy for students in grades K-3. State education officials and legislators may want to consider
revisiting the use of classroom size reduction funds and allowing the literacy block grant proposal to
include proposals by districts to use teacher incentives to attract high-quality teachers to under-
performing schools. The Nevada State Legislature allow classroom size funds to be made available to
provide literacy block grants to school districts and that some portion of these funds could be used to
offer teacher transfer incentives to attract high quality teachers to under-performing schools.

6
POLICY REPORT OCTOBER 2016
5. Tie incentives or categorical funds to teacher absenteeism rates
Given that teaching is a human capital intensive profession, it may not be possible to reduce the overall
costs of an average school district’s personnel costs, which currently consume about 80 percent of
education expenditures. However, policy makers can adopt requirements and policies to improve the
likelihood that school districts are realizing a positive return on their investment.
One area of concern is that Nevada has the second highest absenteeism rate for teachers in the United
States. Almost half of all teachers (49 percent) miss 10 or more days of school each year. This is almost
twice the national rate of 25 percent. Research reveals that students perform worse in math and are less
engaged in school when their teachers miss at least 10 days of school. In addition to impacting student
achievement, teacher absenteeism is costly for districts since a missing teacher in the classroom means
that schools must hire substitutes.
While policy makers should not ‘reward’ absentee teachers with incentives, the State should consider
ways to link categorical funds given to districts to teacher absenteeism rates. A 2011 study examined an
incentive program in North Carolina, which awarded teachers up to $1,500 each if the standardized test
scores of the entire school improved by a predetermined amount. A program evaluation found that
teachers took 0.6 fewer sick days on average and that math and reading test scores improved. Based on
these results, researchers concluded that “compared to other popular education reforms, such as reduced
class sizes, incentives provide more than four times the amount of student improvement per dollar spent.”
Earlier this year, the Nevada Department of Education proposed legislation that would allow schools to
apply for a literacy block grant that would reallocate money intended for classroom-size reduction. To
receive a grant, schools would have to present a site plan that indicates how the money will be used to
improve literacy for students in grades K-3. State education officials and legislators may want to consider
revisiting the use of classroom size reduction funds and categorical funds in ways that align with
performance metrics and student outcomes. The State Board of Education and Nevada Department of
Education should consider including teacher absenteeism rates as a criterion for disbursing categorical
funds to districts and schools. Additionally, NDE should include teacher absenteeism rates in the State’s
Accountability System, which is currently undergoing revisions.
6. Require districts to tie teacher evaluations to increments on the local teacher salary schedule
Despite the implementation of the NEPF, very few districts are using this evaluation framework to inform
teacher compensation. For example, currently, a teacher can receive a “minimally effective” and/or
“ineffective” rating and remain eligible for salary increases (on the standard teacher salary schedule). One
notable exception is Washoe County School District, which is using the NEPF ratings to identify and
promote teachers by giving them more responsibility. Specifically, Washoe County School District requires
“master teacher” candidates to have received the highest ratings on the NEPF.
Other states have attempted to address this issue. Indiana passed a law stating that teachers were only
eligible for merit pay increases if they received “highly effective” or “effective ratings.” (In practice,
reports suggest, however, that the law has not had the intended outcome. Most teachers simply receive

7
POLICY REPORT OCTOBER 2016
high ratings.) In Tennessee, the state requires districts “to differentiate teacher compensation based on
at least one criterion in addition to years of experience and education, including additional roles or
responsibilities, hard-to-staff schools or subject areas, and performance-based on State board approved
teacher evaluation criteria.” The Nevada State Legislature should consider requiring school districts to link
advancement on the salary schedule to NEPF ratings.
7. Assess Nevada’s system for evaluating principals and administrators
Performance-based compensation programs must be aligned with additional programs to improve
student achievement and working conditions at the school sites. Research indicates that the most
effective performance-based compensation programs are “implemented as part of a broader, holistic
retention strategy, rather than as standalone initiatives.” This is because compensation is only one factor
that influences an individual’s decision to enter (and remain) in the classroom. Other considerations are
strong principals, skilled and supportive colleagues, adequate resources for teaching, smaller student
loads, autonomy, high‐quality professional development, and safety. These considerations should be
incorporated into incentive programs geared toward recruitment and retention.
As noted by the Education Commission of States, where performance-based programs have
demonstrated some success, they are usually coupled with other programs and comprehensive reform
efforts (e.g., job-embedded professional development, professional learning communities, school
leadership teams). In Charlotte, North Carolina, performance-based incentives were accompanied by
efforts to foster a positive working environment (by granting principals greater autonomy, in part). One
study noted, “Policies that create salary structures that compensate teachers for working in more difficult
school environments may not effectively retain teachers unless work conditions are also improved.”
Preliminary research indicates that Nevada does not have a robust pipeline of strong principal leaders.
For example, during the Great Recession, Clark County School District suspended it internal training and
leadership development program for future principals. Interviews with teachers and education officials
around the State reveal that the current system for recruiting, training, supporting principals has gaps.
Interviews also reveal that the roll-out of the NEPF to school leadership teams (principals and
administrators) has been “sluggish.” A robust body of research confirms that leadership and overall
working conditions are critical to retaining high quality classroom instructors. The Legislature and State
Board of Education should require a status update of how administrators and principals around the State
are being evaluated. The Nevada State Legislature should commission a comprehensive study on culture
and principal leadership development around the State.

8
POLICY REPORT OCTOBER 2016
Introduction
In recent years, education leaders and policy experts have directed heightened attention and resources
to assessing and evaluating the ways that states and local school districts compensate teachers for their
work. There are two distinct phenomena motivating these factors. The first is the growing teacher
shortage. While Nevada is acutely aware of this shortage, the situation here is not unlike that faced by
school districts around the country. Additionally, teacher turnover is an issue, particularly at under-
performing schools.1 Policy makers around the country are exploring ways to recruit and retain high
quality teachers.
Ironically, the other driver of laser focus on compensation schemes for teachers owes to the fact that
many school districts retain a high number of ineffective teachers in the classrooms of our public K-12
schools. By some accounts, “most schools can provide students with excellent teachers in only one out of
four classrooms.”2 Critics of the traditional salary schedule argue that it does not provide incentives to
produce desired results. In recent years, policy makers have experimented with performance pay plans
whereby teachers are compensated, in part, for their contribution to student outcomes (actual or growth)
“as a way to improve student performance.”3 District officials continue to explore ways to revise
traditional compensation plans as part of a “comprehensive strategy to attract, retain, and deploy high-
performing teachers to their highest need areas, subjects, and grades.”4
School districts and policy makers have attempted to address these two phenomena by using three –
largely financial – strategies: salary requirements, performance pay plans, and diversified pay (see Table
1).5 The Guinn Center for Policy Priorities addressed states’ efforts to implement salary requirements and
statewide salary schedules in its recent companion policy report, ‘The Costs of Instruction in Nevada’s K-
12 System’ (August 2016). In this paper, we address additional financial strategies – e.g., performance-
based compensation and diversified pay plans (also referred to as incentives).
This policy report explores how states and school districts around the country have implemented these
financial incentive-based compensation plans, describes the current landscape in Nevada, and offers
some recommendations that may be taken under advisement by policy makers and education leaders in
Nevada.
Rewarding Performance: Lessons for Nevada’s K-12 System
$

9
POLICY REPORT OCTOBER 2016
The Landscape
School districts around the country are dealing with teacher shortages and teacher attrition. As of April 1,
2016, Clark County School District had 961 reported teacher vacancies and Washoe County School District
had more than 240 job openings.6 (As of August 1, 2016, those numbers fell to 370 and 100, respectively.)
Statistics indicate that 17 percent of teachers leave the field within five years.7 The National Center for
Education Statistics (NCES) reported that following the conclusion of the 2007-2008 school year, 8.0
percent of teachers left and 7.6 percent moved to a different school. For new teachers (those with one to
three years of experience), 9.1 percent left the profession and 13.7 percent moved to a different school.8
During that same period, the attrition rate in Clark County School District, Nevada’s largest, was
comparable – even slightly lower (7.4 percent) than the national average (See table 1).9 However, since
2008, the teacher attrition rate in Clark County School District has increased and was 8.4 percent in 2014.
Table 1. Total teacher, teacher attrition and attrition rate for CCSD 2004-200810,a
Teacher turnover can be costly for school districts. One 2007 study estimated that the total cost of teacher
turnover in the Chicago Public Schools was more than $86 million per year, and the average cost per
departing teacher was $17,872.11 High turnover costs draw resources away from instruction as well as
effective professional development programs for teachers that remain in the classroom. Most
importantly, higher school turnover rates are associated with poor student academic performance.12
Locally, the Alliance for Excellent Education found that teacher attrition cost Nevada $12.8 million in 2003.
In a Clark County School District commissioned report, authors Brett Campbell and Judet Diaz estimated
that the cost of attrition to Clark County School District in 2008 was $14.8 million.13
Another related issue faced by school districts is chronic teacher shortages in high-need schools. High-
need schools may include schools located in remote areas, schools with high numbers of students on Free
and Reduced Lunch, English Language Learners, or students with disabilities. For example, in a recent
opinion piece, the Kenny Guinn Center for Policy Priorities researchers noted that “thirty-eight percent of
teacher vacancies in the Clark County School District’s elementary and middle schools are special
education vacancies. Additionally, 83 percent of special education teacher vacancies are in Title I schools,
which serve our community’s most under-resourced families. The Washoe County School District has
more than 240 job openings, more than 40 percent of which are for special education instructors.”14
a The author was unable to locate data for the years 2009-2011.
Teachers 2004 2005 2006 2007 2008 2012 2013 2014
Number of teachers in CCSD 15,202 15,985 16,817 18,046 18,715 . . .
Number of teachers who left CCSD 1,035 1,210 1,387 1,329 1,310 . . .
Attrition Rate 6.8% 7.6% 8.2% 7.4% 7.0% 10.3% 9.4% 8.4%

10
POLICY REPORT OCTOBER 2016
In Nevada, the state not only struggles with filling teaching positions in high-need schools, it also struggles
with attracting effective teachers to high-need schools. Over the period Fiscal Year (FY) 2009 through FY
2014, the Silver State’s highest poverty schools had a higher percentage of classes not taught by teacher
meeting “highly qualified” requirements (see Table 2). While overall, the number of classes taught by
teachers not meeting “highly qualified” requirements has declined over time, the gap between
unqualified teachers teaching at high-need schools versus schools with lower rates of poverty has
increased (3.3 percentage point difference, up from 1.1 in FY 2009) (see Table 2).15
Table 2. Percent of Core Academic Classes Not Taught by Teachers Meeting “Highly Qualified” Requirements – Highest/Lowest Poverty Quartiles16
Compensation Plans in the United States Researchers have identified the factors contributing to lower numbers of individuals entering the teaching
profession, and to high teacher turnover and teacher attrition rates (particularly at high-need schools).
Collectively, they find these problems stem largely from dissatisfaction with compensation and working
conditions (including safety and interpersonal relationships). 17 As Audrey Amrein-Beardsley (2012) writes,
teaching professionals “identify low salaries and the organization’s working conditions (e.g., a lack of
support, lack of resources, high teacher to student ratios, student discipline issues) as most often shaping
their decisions to leave their schools, or the profession.”18 Low salaries are of particular concern to
teachers working in both urban and rural high-poverty, high-need schools.19
Many teachers have expressed dissatisfaction with the traditional salary schedule. Historically, salary
schedules have only rewarded educational attainment and experience, as opposed to additional
responsibilities or performance. In some school districts, prior to reforms, the salary schedule required
twenty to thirty years of experience and additional education to reach the maximum salary.20 Table 3
presents the compensation principles included in the traditional (“step/column”) salary schedule.
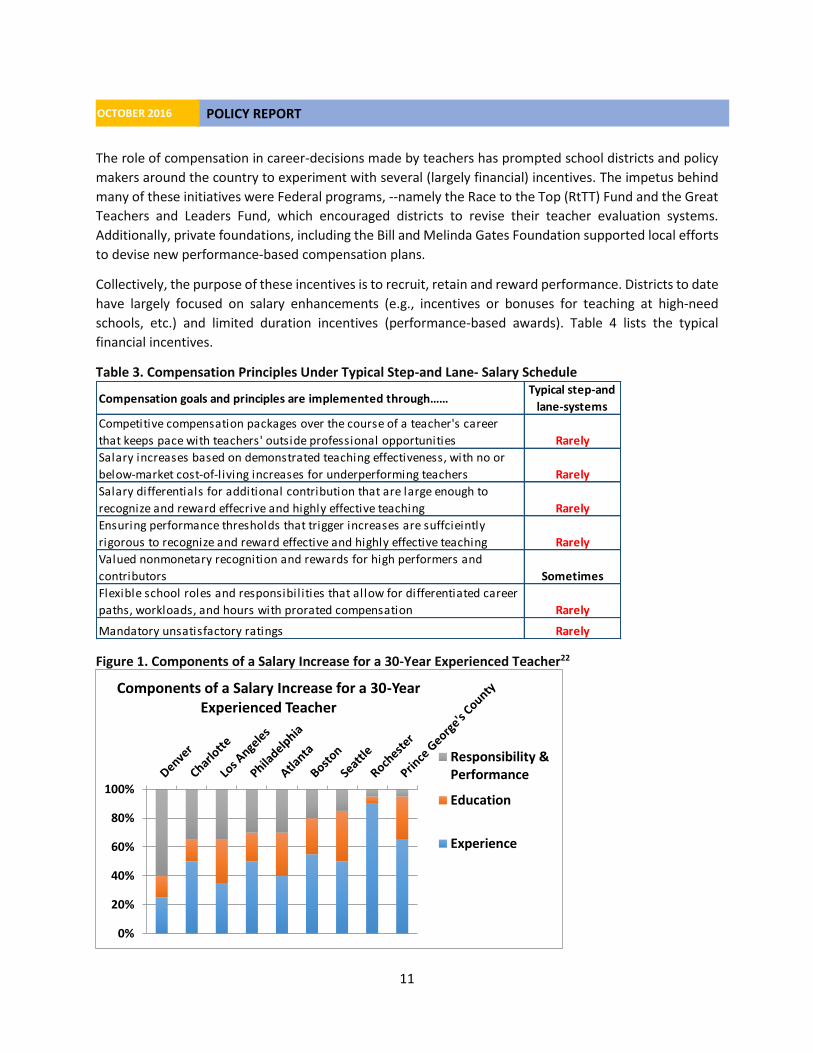
Figures 1 illustrates the composition of salaries in various districts around the country. Figure 1 presents
the components of compensation increases for an average teacher in a district that uses a traditional
salary schedule. On average, 80 percent of total compensation is based on skills and experience, while
only 10 percent accrues from performance and/or additional responsibilities.21 (Denver is an exception
because it does not use a traditional salary schedule).
School YearLowest Poverty
Quartile Schools
Highest Poverty
Quartile Schools
Gap Between Highest/
Lowest Poverty Quartile
Schools - % Point
DifferenceFY14 4.6 7.9 3.3
FY13 2.4 4.0 1.6
FY12 3.3 5.2 1.9
FY11 5.7 7.6 1.9
FY10 5.3 8.3 3.0
FY9 9.0 10.1 1.1
11
POLICY REPORT OCTOBER 2016
The role of compensation in career-decisions made by teachers has prompted school districts and policy
makers around the country to experiment with several (largely financial) incentives. The impetus behind
many of these initiatives were Federal programs, --namely the Race to the Top (RtTT) Fund and the Great
Teachers and Leaders Fund, which encouraged districts to revise their teacher evaluation systems.
Additionally, private foundations, including the Bill and Melinda Gates Foundation supported local efforts
to devise new performance-based compensation plans.
Collectively, the purpose of these incentives is to recruit, retain and reward performance. Districts to date
have largely focused on salary enhancements (e.g., incentives or bonuses for teaching at high-need
schools, etc.) and limited duration incentives (performance-based awards). Table 4 lists the typical
financial incentives.
Table 3. Compensation Principles Under Typical Step-and Lane- Salary Schedule
Figure 1. Components of a Salary Increase for a 30-Year Experienced Teacher22
Compensation goals and principles are implemented through……Typical step-and
lane-systems
Competitive compensation packages over the course of a teacher's career
that keeps pace with teachers' outside professional opportunities Rarely
Salary increases based on demonstrated teaching effectiveness, with no or
below-market cost-of-l iving increases for underperforming teachers Rarely
Salary differentials for additional contribution that are large enough to
recognize and reward effecrive and highly effective teaching Rarely
Ensuring performance thresholds that trigger increases are suffcieintly
rigorous to recognize and reward effective and highly effective teaching Rarely
Valued nonmonetary recognition and rewards for high performers and
contributors Sometimes
Flexible school roles and responsibilities that allow for differentiated career
paths, workloads, and hours with prorated compensation Rarely
Mandatory unsatisfactory ratings Rarely
0%
20%
40%
60%
80%
100%
Components of a Salary Increase for a 30-Year Experienced Teacher
Responsibility &Performance
Education
Experience

12
POLICY REPORT OCTOBER 2016 Table 4. Examples of Financial Incentive Policies Used by Districts to Retain and Recruit Teachers
As of 2003-04, almost twenty percent of school districts had “rewarded some schools with a school-wide
bonus or additional resources for a school-wide activity” and fifteen percent had provided a financial
incentive or additional resources to individual teachers.23 As noted by Stephanie Aragon in an Education
Commission of the States’ report, Mitigating Teacher Shortages: Financial Incentives, sixteen states have
established statewide pay-for-performance (or performance-based) programs.24 Under a performance-
based program, a teacher’s evaluation scores and/or student outcomes are factored into his (her) overall
compensation. This differs from the traditional model that rewards experience and educational
attainment (skills). At present, “performance pay is based on student achievement results in nine states,
and based on evaluation results in seven states.”25 See Table 5 for the different programs offered by states
in the United States.
Salary enhancements (also referred to as diversified pay or incentive pay) are often used to recruit
teachers to high-need (or “hard-to-staff”) schools (e.g., Title I, rural, under-performing schools, etc.), or
to attract teachers in high-demand skill areas (e.g., science and math, etc.), or teachers who require more
training (e.g., special education teachers).26 According to Education Week’s Quality Counts, as of 2009,
about 20 states offered financial incentives to teachers to teach in hard-to-staff schools.27 These sorts of
Incentive Categories Example Policy Types· State mandated minimum salary levels
· Across the board salary increases
· Alternative salary schedules
· "Frontloaded" or "backloaded" salary schedules
· Salary credits
· Additional pay for teaching in geographic-, or subject- shortage areas
· Additional pay for certifications or credentials· Additional pay for extra responsibilities
· Tax waivers and credits
· Transportation subsidies
· Performance-based rewards
· Signing bonuses
· Relocation incentives
· Credential or certification bonuses
· Loan forgiveness
· Home ownership assistance
· Tuition subsidies and remission
· Pre-service teacher scholarships and stipends
· Alternative routes to teacher certification
· Tuition tax credits
· Housing assistance
· Subsidized meals
· Access to local amenities
· Return to work polices
· Deferred retirement
In-kind incentives
Retirement benefit
waivers
Example of Financial Incentive Policies
Salary schedule
modifications
Salary enhancements
Limited duration
incentives
Education and training
related incentives

13
POLICY REPORT OCTOBER 2016
Table 5. Financial Incentives Offered by States to Recruit and Retain Teachers
Minimum Salary
Requirements
Salary
Schedule
Diversified
Pay
Pay-for-
PerformanceAlabama X
AlaskaArizonaArkansas X X X
California X X
Colorado X
Connecticut X
Delaware X X X
D.C.Florida X X
Georgia X X X
Hawaii X X X
Idaho X
Illinois X
Indiana X
Iowa X
KansasKentucky X X
Louisiana X X X
Maine X
Maryland X
Massachusetts X
Michigan X
Minnesota X
Mississippi X X
Missouri X
Montana NebraskaNevada X X
New HampshireNew Jersey X
New Mexico X X
New York X
North Carolina X
North DakotaOhio X X X
Oklahoma X X X
OregonPennsylvania X
Rhode IslandSouth Carolina X X
South DakotaTennessee X X X
Texas X X X
Utah X X
VermontVirginia X
Washington X X
West Virginia X X
Wisconsin X
Wyoming X
Total 7 19 23 16

14
POLICY REPORT OCTOBER 2016 financial incentives assume that additional compensation can entice teachers to accept positions they
might not otherwise take.28 Often in the literature, the terms performance-based programs and incentives
are used interchangeably.
In this paper, to the extent possible, we refer to incentive programs as those programs that provide
additional financial compensation to teachers without any (meaningful) consideration of a teacher’s
evaluation or performance. In contrast, we refer to performance-based programs as those programs that
explicitly link a teacher’s compensation to student performance and/or a teacher’s evaluation.
Nevada currently has several incentive and performance-based compensation programs, many of which
were introduced and approved in the 2015 78th Legislative Session. Among these are the New Teacher
Incentive Fund (Senate Bill 511, as well as additional funding through Senate Bill 515); Enhanced
Compensation and Performance Pay (Assembly Bill 483); and the Great Leading and Teaching Fund
(Assembly Bill 474). In addition, the State supports alternative routes to teacher certification and some of
Nevada’s school districts and charter schools offer education and training related incentives (e.g., tuition
reimbursements). The second half of this policy report will describe these programs in greater detail.
While growing, overall incentive pay and performance-based pay make up less than 1 percent of total
compensation. In contrast, pay for advanced degrees and experience account for roughly 28 percent of
all compensation.29
While performance-based plans can be costly, some have argued that revisions to the traditional salary
schedule can support reform efforts. Dr. Bryan Hassel of Public Impact, an education research consulting
firm, suggests that on average, school districts could grant the top 50 percent of teachers performance
bonuses averaging $3,000 by simply reducing post‐five year experience premiums (in the traditional salary
schedule) by 10 percent or by reducing advanced degree premiums by 20 percent.30 Hassel also proposes
that instead of using philanthropy (e.g., Gates Foundation) and U.S. Department of Education Teacher
Incentive Fund monies (TIF) to finance new performance pay plans, districts should use those resources
to “fund the transitional costs of ‘re-slicing the pie’: planning, evaluation, and holding harmless incumbent
teachers who don’t want to enter the new contribution-based system.”31
Figure 2 presents the components of a highly effective teacher’s compensation prior to and following the
implementation of performance-based programs in a select number of districts. In some districts and
cities, including Hunter School District 2 (Colorado Spring, Colorado), Baltimore (Maryland), Lawrence
(Massachusetts), and Washington, D.C., the new performance-based plans no longer reward educational
attainment (e.g., Master’s degrees, doctoral degrees). In all but one district, performance-based programs
increased the possible maximum salary for licensed educational professionals.

15
POLICY REPORT OCTOBER 2016 Figure 2. Possible Maximum Salary for Highly Effective Teachers, Before and After Reform32

16
POLICY REPORT OCTOBER 2016
Description of Performance-Based Plans and Incentive Programs The design of performance-based compensation plans varies. Some programs provide bonuses based on
quantitative measures (e.g., test scores); others use quantitative and qualitative measures (e.g., peer
and/or principal evaluations, etc. Several programs provide bonuses to entire districts, others to select
schools. In some districts, performance-based awards are distributed based on the evaluation of teams of
teachers; others evaluate the performance of individual teachers.
Despite the variation, a growing number of studies have tried to document the impact of new
performance-based compensation programs. Of interest is the impact of performance-based programs
and incentives on student achievement and teacher turnover. Still others have examined the impact of
new performance-based compensation schemes on teacher satisfaction and school climate. In the pages
that follow, the Guinn Center briefly describes the new incentive and performance-based program and
summarizes the impact, if any.b
Overview A first generation of studies found (limited) positive effects of performance-based pay on student and
teacher outcomes. However, the robustness or validity of many of the causal arguments are limited due
to research design, data limitations, or selection bias.
However, a second generation of studies that do include rigorous research design methods (i.e.,
randomized, controlled experiments, etc.) find no positive and significant relationship between incentive
programs and performance-based compensation plans and student outcomes. These studies find that
“traditional pay-for-performance systems (i.e., systems in which the opportunity to earn a bonus is
offered at the beginning of the year and rewarded at the end of the year if a teacher meets the
performance criteria) do not affect either teacher practices or student outcomes.”33
Another set of studies examining the impact of new compensation schemes on teachers’ attitudes and
working conditions also find a negative (and significant) relationship. Yuan et al (2013) analyzed surveys
from teachers who participated in one of three incentive pay programs. Summarizing the study results,
the research team wrote:
Results showed that teachers did not consider their programs as motivating. First,
teachers’ level of goal acceptance was not high due to a lack of understanding of the
program among some teachers and teachers’ concerns about using student test scores to
measure teaching performance and the fairness of the program. Second, teachers did not
have high expectancy that their personal efforts would lead to student achievement gains
due to concerns about the influence of family environment on student achievement.
b We attempt to include information on districts which have been the subject of quantitative evaluation. The level of information varies, which is a function of the level of detail presented by the primary and secondary analyses.

17
POLICY REPORT OCTOBER 2016
Third, although teachers would have liked to earn a bonus, they did not see the
opportunity as worthy of changing behavior.34
The results indicate that the incentive pay programs had no impact on instructional practices, number of
hours worked, or collegiality.35 Lauen et al (2014) notes that performance-based pay structures are “more
likely to exist in districts that have more information about individual teacher performance (high-
accountability cultures), and less likely where teachers are unionized.”36
Several studies have examined whether the design of a compensation program might have an impact on
student outcomes. But again, evidence indicates that the design of a compensation program has no
bearing on student outcomes or teacher effectiveness. Collectively, there is no overwhelming evidence to
suggest that school level incentives are more effective than individual incentives. Additionally, research
suggests that the overall monetary value of the incentive does not impact teacher effectiveness and
student outcomes (some districts offered $15,00 per individual teacher, others offered as little as $350).
Table 6 summarizes some of the programs around the country, many of which have been evaluated to
determine their impact on student achievement and teacher retention.

18
POLICY REPORT OCTOBER 2016 Table 6. Summary of Performance-Based Compensation and Incentive Plans in the United States
State Description Type Impact Notes Arkansas Achievement Challenge Pilot
∙ Gave teachers bonuses for students’ gains on standardized assessments ∙ Bonus range $350-$7,600; average is $1,585
∙ Incentives ∙ Positive impact on achievement in math and reading ∙ However, evaluation has methodological limitations, which limit reliability and generalizability of findings
Arkansas Fountain Lake Cobra Pride Incentive Program
∙ Performance-based program that rewarded all employees for student achievement gains
∙ Incentives ∙ Schoolwide ∙
∙ No evidence that incentive program had a positive impact on student achievement
Denver. Colorado Professional Compensation Program (ProComp)
∙ Compensation reforms are part of the salary schedule rather than solely as bonuses on top of the traditional salary schedule. ∙ Measures of teachers’ knowledge and skills, professional evaluations, labor market incentives, and student growth play a role in determining a percentage of the salary index. ∙ Only a small part of a teacher’s overall compensation is based on performance
∙ Voluntary
∙ Teachers who chose to participate produced slightly higher math/science achievement ∙ Teacher retention has improved ∙ Emphasis on data and instruction may have impacted professional practices of teachers ∙ However, evaluation has methodological limitations, and researchers are unable to disentangle effects of all reforms.
∙ Voters approved $25 million tax to fund program
Florida Merit Award Program
∙ Legislature mandated a performance-based system that includes student achievement ∙ Districts can devise their own plan ∙ State law dictates that teacher salary raises must be based, in part, on evaluation ratings ∙ Incentive awards range from 5-10 percent of average teacher salary
∙ Performance-based
∙ No evidence that external evaluation has been conducted. ∙ Half of teachers (46 percent) were supportive of performance-based pay using student achievement data. ∙ Teachers with 1-3 years of experience were more supportive of pay-for-performance than teachers with more than 20 years of experience ∙ Teachers in elementary schools were less supportive of incentive pay ∙ Teachers who had a positive view of their principal’s leadership ability were more supportive of performance pay.
∙ In evaluation system: 60 percent of evaluation based on student proficiency or learning gains; 40 percent based on principal evaluation

19
POLICY REPORT OCTOBER 2016
State Description Type Impact Notes Hillsborough County, Florida POWER
∙ Incentive program for teachers working in high-need schools ∙ Criteria for eligibility for an incentive based on performance ratings and student achievement ∙ Can earn up to 5 percent of salary (in addition to MAP incentive)
∙ Incentive program
∙ No evidence that external evaluation has been conducted.
∙ Cost of program was $3.1 million annually ∙ Received Gates Foundation funds to develop new teacher evaluation system
Prince George’s County, Maryland
∙ FIRST incentive program ∙ Teachers could earn up to $10,000 in incentive pay for engaging in “continuous improvement” and designated program activities
∙ Voluntary ∙ Performance- based
∙ No evidence that external evaluation has been conducted. ∙ Self-reported findings include “increased collaboration between teachers around instruction to result in increased student achievement, a collective knowledge among teachers and administrators around instruction expectations, program flexibility, and increased quality of and opportunity for professional development.”
∙ District officials note that these programs require significant resources and staff time to administer
Washington County Public Schools, Maryland
∙ Uses 3 performance-based compensation models ∙ “Sought to reward teacher leadership, recognize the unique responsibilities of a school administrator based on the needs of the school community, and/or reward effective and highly effective teachers (and school-based administrators) teaching under-resourced, low-income students in high-needs schools or in hard-to-staff subjects.”
∙ Survey analysis, no rigorous evaluation has been conducted ∙ Programs “led to increased professional development, greater collaboration between teachers and administrators, recognition of the unique needs of each school, and the potential for developing teachers as leaders.” ∙ However, district officials worried about: difficulty finding evaluation measures/ instrument; difficulty measuring teacher impact; disparities between teachers; and creation of perverse incentives
∙

20
POLICY REPORT OCTOBER 2016
State Description Type Impact Notes Minnesota Quality Compensation (Q-Comp)
∙ Compensation based on 5 components, including student growth/achievement ∙ Districts must demonstrate how at least 60 percent of a teacher’s pay increase aligns with teacher performance measures, which includes student achievement, school achievement, and research based measures. ∙ Districts can offer additional pay for hard to staff schools and subjects ∙ Average bonus is $1,800; maximum bonus is $2,000. ∙ Tenured teachers evaluated once every 3 years; non-tenured teachers are evaluated in years 1-3. Teachers can be non-renewed in first 3 yrs.
∙ Voluntary ∙ Little effect on student performance. ∙ Only significant positive impact was an increase in reading scores. ∙ Researchers found most of funding not used on teacher pay raises but instead, “district initiatives such as teacher evaluations or paying substitutes to allow teachers to work together on lesson planning.” ∙ Of $2,200 of the amount that was distributed to teachers, only $233 as directed at student achievement gains. ∙ Concern that the program is no longer based on performance. In 2014, 99 percent of teachers received performance-based pay, although only 20 percent received the maximum bonus award.
∙ Allocation for initial program rollout was ~$80 million ∙ In 2015, state adopted new teacher evaluation system. Cost for statewide adoption is $70-$200 million.
Le Crescent, Minnesota
∙ Aimed at addressing teacher retention ∙ Does not link compensation directly to student performance ∙ Instead, teachers are evaluated based on “planning and preparation; classroom environment; classroom performance; and professional responsibilities.”
∙ Performance-based
∙ No evidence that external evaluation has been conducted.
∙ Concern about added workload of teachers, administrators ∙ Concern about fairness
North Carolina Race to the Top
∙ $1,500 bonus awarded for meeting growth targets ∙ Eligible staff are those in the lowest 5% of schools (measured by performance) ∙ Offers $500 to individual teachers in tested subjects who exceed expected growth.
∙ School based performance incentive ∙ Individual ∙ Eligible to all staff at “high growth” school
∙ Formal evaluation finds limited impact. ∙ However, teachers self-reported that growth efforts in their schools had improved. ∙ While teachers recognized that the incentive provided “extra motivation,” only 22 percent reported tangible changes to teaching practice that resulted from being eligible for the performance incentive.

21
POLICY REPORT OCTOBER 2016
State Description Type Impact Notes Greensboro, North Carolina Mission Possible Program
∙ Incentive program designed to attract teachers to high needs schools ∙ Teachers are offered recruitment or retention bonuses to work in Mission Possible schools. ∙ Bonuses vary ($2,500 for teachers in grades K-5; $10,00 for teachers of Algebra 1) ∙ Student achievement increase bonus ($2,500-$4,000) ∙ Poor growth results in transfer out of Mission Possible school
∙ Voluntary ∙ Individual ∙ Recruitment bonus ∙ Performance-based bonus
∙ 2010 Evaluation found higher rates of teacher and principal evaluation ∙ Number of teachers earning performance-based awards increased over time ∙ Student test scores and graduation rates were higher than district average
North Carolina Accountability, Teaching the Basics, and Local Control (ABC)
∙ Incentive program ∙ Teachers in school with high growth on state tests received bonus ∙ Teachers could receive $750-$1,000 if results exceeded growth expectations
∙ School based ∙ Performance-based
∙ Evaluation of program found increase in math and reading proficiency scores ∙ However, did not reduce achievement gap ∙ Researchers noted many reforms implemented at the same time ∙ Difficult to attribute impact directly to program
∙ Program discontinued in 2009, morphed into Race to the Top (previous page)
Charlotte-Mecklenburg Schools, North Carolina
∙ Student growth data linked to compensation ∙ Teachers who demonstrated high growth earned 15 percent bonus ∙ Only teachers in tested subject eligible, later expanded to all teachers
∙ Performance-based ∙ Individual
∙ Received external funds∙ State moved from simple growth to value-added model
Charlotte-Mecklenburg Schools, North Carolina Strategic Staffing Initiative (SSI)
∙ Incentive to attract high quality teachers to high need schools ∙ Teachers/principals receive 10a percent increase in base salary to move to high needs school ∙ Signing bonus of $10,000 if teacher moves as part of principal’s team
∙ Incentive ∙ Individual
∙ Evaluation found SSI schools associated with increases in student scores on math, science, and reading proficiency exams ∙ Closed achievement gap in math, but not in reading

22
POLICY REPORT OCTOBER 2016
State Description Type Impact Notes North Carolina High Needs Incentives
∙ In 2001, North Carolina gave bonus of $1,800 to certified math, science, Special Ed teachers working in high-poverty schools
∙ Incentive ∙ Evaluation found bonus reduced teacher turnover by 12 percent. ∙ Experienced teachers had strongest response to the program
New York, New York Schoolwide Performance Bonus Program (SPBP)
∙ Performance targets established. ∙ Bonuses up to $3,000. ∙ District later raised proficiency thresholds. ∙ In first year, 62 percent of eligible schools received bonuses; in second year, 84 percent of schools received bonus.
∙ School wide ∙ Voluntary ∙ Performance-based
∙ Rigorous evaluation found that the program did not improve student achievement or school performance ∙ Program did not impact teachers’ attitudes ∙ Researchers cautioned that officials must understand conditions that foster motivation
∙ Program suspended in 2011 ∙ Total cost of $54 million
Tennessee Project on Incentive in Teaching
∙ Teachers could earn $15,000 award; lower amounts available ∙ Based on student performance in middle school math
∙ Performance-based
∙ Using randomized controlled experiment, RAND Corporation evaluation found increase in math scores for 5th graders, but no long-lasting effect
Texas District Awards for Teacher Excellence (DATE)
∙ All districts eligible ∙ Districts given the option of applying for all schools or select schools ∙ Districts required to use 60 percent of funds to directly reward teachers based on student achievement; 40 percent of funds distributed to other personnel, professional development, or district capacity building
∙ Incentive ∙ Voluntary ∙ Individual and Group Evaluation
∙ Achievement gaps decreased in DATE schools ∙ Academic gains faster in DATE schools ∙ Students in DATE select schools had higher gains in math/reading tests than students in DATE districts ∙ Size of award was correlated with increases in math scores ∙ Higher retention rates among teachers who received awards ∙ Higher retention when evaluation based on both group and individual performance
∙ Cost was $197 million ∙ Discontinued; morphed into TEEG
Texas Educator Excellence Grants (TEEG)
∙ Grants to high-poverty, high-performing schools. ∙ Grants given to schools ($40,000-$295,000). ∙ Individual awards less than $3,000 ∙ 75 percent of award for teacher incentives; 25 percent of award for faculty collaboration.
∙ Performance-based ∙ Individual performance
∙ Rigorous evaluation found that retention increased with size of award ∙ No impact on student achievement
∙ $100 million in funding annually ∙ Relies on student achievement data

23
POLICY REPORT OCTOBER 2016 State
Description
Type
Impact
Notes
Texas Governor’s Educator Excellence Grant (GEEG)
∙ Grant amount ranges from $60,000-$220,000 ∙ Given to high-poverty, high-performing schools ∙ 75 percent of award for teacher incentives; 25 percent of awards for faculty collaboration that is directly linked to student achievement ∙ Program later revised to reward all teachers regardless of performance
∙ Performance-based (later revised) ∙ Individual
∙ Rigorous evaluation found that retention increased with size of award and failure to receive award predicted teacher turnover ∙ No impact on student achievement
∙ $10 million in noncompetitive, 3 year grants to 99 schools ∙ Relied heavily on student achievement data
Round Rock, Texas
∙ Based on growth in 9 middle schools ∙ Bonuses ranged from $3,800 to $5,500
∙ Performance-based
∙ RAND Corporation evaluation found intervention had no impact on student scores in any subject
∙ Randomized controlled experiment
Washington, DC IMPACT
∙ Bonus directly linked to student outcomes ∙ Highly effective teachers received $25,000 bonus
∙ Performance-based
∙ Voluntary teacher attrition increased by 50 percent among teachers who received minimally effective rating ∙ Performance increased for highly effective teachers ∙ Program improved “teacher retention and performance”
∙ If teacher is rated as ineffective or minimally effective for two straight years, they are dismissed.

24
POLICY REPORT OCTOBER 2016
Summary of Issues Related to Incentive Programs
Based on the findings reported in several studies, one striking conclusion is that performance-based
compensation plans have achieved some, albeit, limited success. Strong, consistent evidence that
performance-based programs have had a substantial positive impact on student achievement has yet to
emerge. This may be, in part, because many of the evaluations were administered only a few years after
performance-based incentive programs had been implemented. Or, this may be because many of the
states and districts undertook a variety of reforms simultaneously as they were adopting performance-
based compensation plans, thus making it difficult to truly isolate and assess the impacts of the
performance-based programs. There are, however, several conclusions that emerge from a review of the
studies and the literature.
Teacher Retention
While there is an absence of methodologically rigorous analysis confirming a positive link between
performance-based programs and incentives and student achievement, the evidence linking
performance-based programs and incentives to teacher retention appears more consistently positive and
significant. Given the seemingly more robust relationship between performance-based compensation and
teacher retention, district officials and policy makers may want to view these programs not as an effective
means of increasing student achievement, but as a way primarily to address teacher retention or turnover,
or to attract highly effective teachers to under-performing schools.
Additionally, district and state education officials could consider using performance-based incentives to
address teacher absenteeism, which has significant impact on academic achievement. Research reveals
that students perform worse in math and are less engaged in school when their teachers miss at least 10
days of school.37 Based on recent data from the Education Week Research center, Nevada has the second
highest absenteeism rate for teachers in the country. Almost half of all teachers (49 percent) miss 10 or
more days of school each year. This is almost twice the national rate of 25 percent.38 Districts may want
to consider performance-based bonuses to address teacher absenteeism.
Size of Incentives
Several studies have tried to determine whether the size or value of performance-based or incentive
awards has any impact on positive outcomes. For instance, one study looked at data from New York City
and found that “it would be necessary to pay teachers an additional $2,900 to induce them to teach in a
classroom with a 25-percentage point increase in the proportion of minority students but only an
additional $350 to teach in a classroom with a 25-percentage point increase in the proportion of students
receiving free or reduced price lunch.”39 Another study found that “a California program offering a
$20,000 incentive for academically talented novice teachers to work in low-performing schools for at least
four years increased their probability of them taking such a position by 23 percentage points.”40

25
POLICY REPORT OCTOBER 2016
A 2013 multi-site, randomized experimental national study provided targeted incentives of $20,000 to
encourage high-performing teachers to transfer and fill vacancies in under-performing schools. The
experiment was implemented in ten diverse districts around the country, including 40 elementary schools
with high free and reduced lunch populations. An evaluation found that the program had a positive effect
on both student outcomes and teacher retention.
Specifically, the evaluation of the intervention revealed that a “$20,000 incentive for high-performing
teachers to move to low-performing schools helped raise the math and reading test scores of elementary
students by 4 to 10 percentile points,” although there was no impact in middle schools.41 The program
also had a positive impact on teacher-retention rates during the first two years while transfer teachers
received incentive payments. Ninety-three percent of teachers who received the incentives remained in
their new schools during that period, versus 70 percent of traditionally hired teachers. And 60 percent of
those teachers continued to teach in the low-performing schools in their third year, after the incentives
ended.
The findings of this experimental study suggest that teacher incentives could be a cost-effective
alternative to other existing programs, particularly class size reduction funds. Researchers note that in
comparison to reducing class size, the cost of producing these academic gains through targeted incentives
were estimated to be $7,000 cheaper than it would have been to reduce class size by adding enough
teachers to produce a similar academic outcome. For example, in elementary schools, the incentive
program was $13,000 cheaper than the class-size reduction benchmark.42
Incentives to Fill Hard-to-Fill positions
Research suggests that efforts to attract highly effective teachers to high-poverty, low achievement
schools have been mixed. In some cases, teachers left after the bonuses ended and there was no
improvement in student achievement. However, in other instances, teacher retention improved (even
after the bonus ran out) and there was some impact on student gains.
Research suggests that a 20 percent to 50 percent premium is required to induce teachers to teach in
hard-to-staff schools. Yet, as stated, even then results are mixed and successful outcomes are not
guaranteed.43 According to researchers, “Rather than one-size-fits-all incentives for every teacher, hard-
to-staff pay plans that work best most likely will include scaled performance bonuses with very significant
performance rewards for teachers who increase student progress more. Research suggests that such
plans would attract and retain more high performers. Pay opportunity is one way to send the signal that
the highest performance is particularly valued and rewarded in this setting.”44
Ultimately, significant restructuring of chronically low-performing schools to make them places where
high achievement by both students and teachers is expected and supported is a necessary condition for
effective performance-based or incentive programs.

26
POLICY REPORT OCTOBER 2016
Teacher Attitudes
Many studies have examined the relationship between performance-based compensation plans and
teacher attitudes. Not surprisingly, opinions varied, although teachers seem moderately supportive of
performance-based compensation plans. One 2009 study found that teachers’ opinions on financial
incentives varied, depending on how the incentive were determined:
80 percent of teachers favored incentives for “teachers who work in tough neighborhoods with low-
performing schools”
58 percent supported incentives for “teachers who consistently receive outstanding evaluations by
their principals”
53 percent favored incentives for “teachers who specialize in hard-to-fill subjects such as science or
mathematics”
42 percent favored “teachers whose students routinely score higher than similar students on
standardized tests.”45
In 2006, researchers at the Center on Reinventing Public Education surveyed teachers in Washington.
While 83 percent opposed performance-based awards, 72 percent supported incentives for teaching in
high-needs schools, and 41 percent supported incentives for teachers in hard-to-fill subjects.
Experienced and new teachers and teachers teaching different grade levels had different views on these
topics. Veteran teachers were slightly less supportive of performance-based compensation programs than
new teachers. High school teachers were more supportive. Interestingly, teachers who expressed a high
degree of trust for their principals were almost twice as likely to be supportive of performance-based
compensation pay.46
Summarizing the literature on teacher attitudes on performance-based compensation programs, several
conclusions emerge. First, teachers appear more likely to support performance-pay programs targeted to
high-needs schools than to all schools. Second, new teachers appear to be more receptive to
performance-pay programs than veteran teachers. Teachers are likely to support performance-based
compensation programs that rely on several evaluation methods (e.g., principal evaluation, student test
score growth, peer evaluations, surveys, etc.) as opposed to only one evaluation measure. Teachers are
more likely to support performance-based compensation programs that are based on an evaluation of the
group of teachers or a combination of group and individual evaluation, rather than an individual
evaluation. Finally, teachers appear to be more supportive of performance pay if they trust their
principals.47
Individual Versus School-Based Compensation
The evidence on whether education policy makers should implement individual pay‐for‐performance or
school-based models is mixed. Some studies have shown that when teachers’ pay is linked to students’
academic outcomes, achievement increases.48 However, other studies have noted that individual merit

27
POLICY REPORT OCTOBER 2016
pay has negative consequences for teacher collaboration and commitment.49 Often, when individual
incentive programs evaluate teacher performance to determine (the size of) rewards, educators tend to
criticize the assessment instruments. Concerns regarding the fairness of the evaluation framework can
adversely impact teacher effectiveness (and buy-in). Similarly, individual-based incentive programs
increase competition among teachers and may undermine collaboration.50
Some research based on analysis of district level experiments finds a positive relationship between school-
based performance incentives and student achievement, teacher retention, and teacher satisfaction.
However, a randomized study in New York City conducted by RAND Corporation found no impact of the
school-based performance-based compensation program on academic outcomes. The study authors
attributed this finding to “’free‐riding’ teachers who, because there was little monitoring or individual
accountability for group goals, may not have put in the requisite effort to improve student test scores.”51
Best Practices
In this section, we summarize best practices that research teams and policy makers have offered following
their experiences with the implementation and evaluation of various performance-based compensation
programs.
Clarity Around Measurement and Evaluation
An essential requirement of successful performance-based compensation programs is rigorous data that
can accurately assess teacher performance in order to inform appropriate compensation.52 However,
experts agree that models that attempt to evaluate and account for teacher performance are messy,
complicated, and expensive, and most evaluation systems are not sufficiently rigorous; “there are still few
proven ways to measure teacher effectiveness beyond test scores.”53 In districts that use these
performance-based models, “teachers are often unable to identify why they did or did not receive a
performance incentive.”54
However, research underscores the importance of using a variety of “fair and proven” measurements and
data points to assess teacher performance and reliably distinguish among levels of teacher effectiveness.55
Programs that relied solely on standardized test scores, for example, have faced political opposition
subsequently forcing some states to revise their performance-based compensation programs. More
importantly, the lack of clear understanding can impact the overall effectiveness of the program, either
by failing to influence the desired behavioral responses, or by instigating opposition to the program. After
finding no significant relationship between student achievement and school-based team bonuses, RAND
researchers noted that “teachers in both the control and study groups did not understand and/or had
misgivings about the program. These findings indicate limited utility in collective pay‐for‐performance
models and highlight the importance of teacher understanding and “buy‐in” for such programs.”56
Additionally, since almost 70 percent of teachers cannot be tied directly to tests of student achievement,
districts that want to provide incentives to a broad range of licensed educational professionals should
include additional performance measures. Among the measures that school districts have used are: value-
28
POLICY REPORT OCTOBER 2016
added estimates of teacher effectiveness, surveys, peer and principal evaluations, and the teacher’s
portfolio of work.57 As the evaluators of the Texas DATE program noted, “States and districts must
institute valid systems that track the contributions of individual teachers to student learning gains.
Ongoing improvement of student testing to measure student learning progress accurately is an important
complement to pay reform. Without quality measures of learning, teachers will doubt the fairness of pay
reforms based on assessment results.”58 Experts caution that districts should refine their teacher
evaluation systems until teachers and principals have confidence in these new systems before tying them
to compensation. As noted in one study, ‘Performance pay plans that both get the best results and that
employees prefer […] are based on fair measures related to performance; reward all important goals of a
job; include frequent feedback on progress during the year; provide substantial, motivating rewards for
higher performance; and reward high-average, not just stellar, performers.59
School Culture
For maximum effect, performance-based compensation programs should be aligned with other reforms
to improve student achievement and working conditions at the school sites. Research indicates that the
most effective performance-based compensation programs are “implemented as part of a broader,
holistic retention strategy, rather than as standalone initiatives.”60 This is because compensation is only
one factor that influences an individual’s decision to enter (and remain) in the classroom. Other
considerations are strong principals, skilled and supportive colleagues, adequate resources for teaching,
smaller student loads, autonomy, high‐quality professional development, and safety.61 These
considerations should be incorporated into incentive programs designed to improve recruitment and
retention. 62 As noted by Jensen et al (2010), “Policies that create salary structures that compensate
teachers for working in more difficult school environments may not effectively retain teachers unless work
conditions are also improved.”63
A report authored by the Education Commission of States noted that where performance-based programs
have demonstrated some success, they are usually coupled with other programs and/or comprehensive
reform efforts (e.g., job-embedded professional development, professional learning communities, school
leadership teams).64 Research indicates that mentoring and induction programs are promising workplace
incentives that may help to improve teacher retention.65 Washington, D.C.’s IMPACT model provides
teachers with personalized coaching and online access to instructional resources.66 And in Charlotte-
Mecklenburg Schools, performance-based incentives were accompanied by teacher transfer incentives
and efforts to grant principals greater autonomy.67
Sustainability
Experts caution that districts and policy makers should identify the long-term sustainability of a
performance-based compensation program. As noted above, these programs are costly both in terms of
direct resources as well as time to administer and oversee. Many of the states and districts who

29
POLICY REPORT OCTOBER 2016
implemented performance-based compensation and incentive programs received external funds from
foundations, including the Bill and Melinda Gates Foundation.
Nevada Landscape
As noted previously, the standard way states and school districts provide compensation to teachers is
through salaries and benefits. Historically, these compensation programs have been calculated largely
based upon years of teaching experience as well as levels of educational attainment.
Stagnant academic outcomes and even declining academic performance in many state and districts
around the country have forced decision makers to reconsider how teachers are compensated (see Table
7 that illustrates quality of teaching professionals in Nevada).
As Governor Sandoval noted in his “Nevada at 150” annual report of the state publication, “achievement
gaps remain and there is no progress with low performing schools. Many of the Silver State’s under-
performing schools have been failing for more than a decade and the numbers continue to rise: sadly, the
number of one-star schools (reported in the Nevada School Performance Framework) in Nevada increased
from 19 in 2012-13 to 27 in 2014-15. The continued achievement gaps prompted Governor Sandoval to
propose several new programs in the 78th Legislative Session designed to “strengthen the existing pay for
performance laws, requiring districts to set aside money to reward the very best teachers and principals,
and to attract teachers to underperforming and other high need schools.” Proposed legislation also
substantially increased the Silver State’s commitment to teacher and leader preparation, retention, and
professional development through a new fund, which seeks to improve the teaching profession, attract
new teachers, and train high quality leaders in our schools.68
As noted by the Legislative Counsel Bureau (2012), “Changing the way teachers are paid, to include
student performance outcomes or incentives for teaching in at-risk schools, is gaining support in districts
and states across the country.”69 A significant body of research indicates that teacher quality is highly
correlated to student achievement.70
Table 7. Teacher Quality in Nevada71
2009 2011 2013 2015
Delivering Well Prepared Teachers D- D- D- D-
Expanding the Pool of Teachers D- D+ D D
Identifying Effective Teachers D- B- B- C-
Retaining Effective Teachers D C- D+ C-
Exiting Effective Teachers D+ B- B B+
Pensions C-
Averall Grade D- C- C- C-
Average U.S. Grade D D+ C- C-

30
POLICY REPORT OCTOBER 2016
As was done in Florida, Maryland, North Carolina, and Washington, D.C., Nevada also, in recent years, has
started down the pathway of exploring different models of teacher compensation systems, particularly
models that include performance measures.
During the 2015 78th Nevada Legislative Session, lawmakers approved a several programs aimed at
recruiting and retaining teachers. Table 8 presents data on most of education-related programs that were
funded in 2015.c The columns show the funds that have been disbursed to school districts through April
2016. The columns highlighted in green indicate those earmarked for recruiting and retaining teachers.
Among the programs are: Great Teaching and Leading Fund, the Teach Nevada Scholarship, New Teacher
Incentives, and Teacher Supplies Reimbursement Fund. Almost 8 percent of all education-related funds
target teacher recruitment and retention. Interestingly, teacher-related funds make up a significant share
of total funds in Lincoln County School District (almost 40 percent), Mineral County School District (10
percent), and State charters (almost 11 percent). It accounted for 8 percent in Clark County School District
and 6 percent in Washoe County School District.
c This list includes categorical funds. It does not include programs funded through the Distributive School Account (e.g. classroom size reduction, etc.).

31
POLICY REPORT OCTOBER 2016 Table 8. FY 2016 State Funding Allocations for Educational Programs, by District (Through April 2016)
District Zoom Victory Full Day K Read by 3 NV Ready 21 Turnaround
Social
Worker
Great
Teaching and
Leading
Teach
Nevada
Scholarshi
p
New Teacher
Incentives
Teacher
Supplies
Reimburse.
Peer Assist &
Review CTE
College &
Career / AP /
GATE
Jobs for
America's
Graduates Total
Total for
Teacher
Recruitment,
Retention
Teacher $
as % of
Total
County %
of Totals
Carson 915,016$ -$ 1,796,469$ 400,000$ 1,481,538$ -$ 443,751$ 254,000$ -$ 120,000$ 46,331$ -$ 361,560$ 305,811$ 68,711$ 6,193,187$ 420,331$ 6.8% 2.95%
Churchill 182,343$ -$ 457,682$ 191,223$ 425,335$ -$ 106,501$ -$ -$ 20,000$ 17,772$ -$ 172,629$ 229,999$ -$ 1,803,485$ 37,772$ 2.1% 0.86%
Clark 39,350,342$ 20,945,004$ 51,068,230$ 2,261,135$ 9,202,980$ 467,063$ 4,196,777$ 977,285$ -$ 8,320,000$ 1,703,469$ 1,000,000$ 6,479,619$ 4,728,138$ 508,504$ 151,208,546$ 12,000,754$ 7.9% 71.92%
Douglas 220,661$ -$ 1,025,557$ 277,332$ -$ -$ 275,126$ -$ -$ -$ 38,318$ -$ 624,577$ 231,444$ -$ 2,693,015$ 38,318$ 1.4% 1.28%
Elko 739,280$ 1,102,189$ 2,007,868$ 100,995$ 796,394$ -$ 246,401$ -$ -$ 52,000$ 62,973$ -$ 283,812$ 147,450$ 78,270$ 5,617,633$ 114,973$ 2.0% 2.67%
Esmerelda 8,589$ -$ 56,531$ 274,475$ -$ -$ -$ -$ -$ 8,000$ 616$ -$ -$ -$ -$ 348,211$ 8,616$ 2.5% 0.17%
Eureka 3,964$ -$ 28,266$ -$ -$ -$ -$ -$ -$ -$ 2,774$ -$ -$ -$ -$ 35,004$ 2,774$ 7.9% 0.02%
Humboldt 304,565$ 97,821$ 448,255$ -$ -$ 50,445$ 72,776$ -$ 36,800$ 64,000$ 20,341$ -$ 92,174$ 71,935$ 44,564$ 1,303,675$ 121,141$ 9.3% 0.62%
Lander 62,102$ -$ -$ -$ 185,881$ -$ 39,051$ -$ -$ 21,000$ 7,191$ -$ 68,070$ -$ -$ 383,295$ 28,191$ 7.4% 0.18%
Lincoln 7,928$ -$ 84,797$ -$ -$ -$ -$ 149,428$ -$ 16,000$ 8,424$ -$ 98,084$ -$ 74,237$ 438,898$ 173,852$ 39.6% 0.21%
Lyon 346,187$ -$ 1,709,734$ -$ -$ -$ 211,676$ 82,470$ -$ 90,000$ 50,030$ -$ 338,706$ 74,953$ 45,685$ 2,949,440$ 222,500$ 7.5% 1.40%
Mineral 9,249$ -$ 169,593$ -$ -$ -$ -$ -$ -$ 30,000$ 4,006$ -$ 74,358$ 10,009$ 35,632$ 332,848$ 34,006$ 10.2% 0.16%
Nye 243,124$ 103,508$ 1,285,470$ -$ -$ 140,000$ 210,176$ -$ -$ 180,000$ 28,456$ -$ -$ 81,460$ 8,518$ 2,280,712$ 208,456$ 9.1% 1.08%
Pershing 31,051$ -$ 240,373$ -$ -$ 7,701$ -$ -$ -$ 8,000$ 5,856$ -$ 108,325$ 416$ -$ 401,722$ 13,856$ 3.4% 0.19%
Storey 661$ -$ 67,715$ -$ -$ -$ -$ -$ -$ -$ 3,390$ -$ 14,476$ 10,402$ -$ 96,644$ 3,390$ 3.5% 0.05%
Washoe 6,935,838$ 2,601,348$ 10,215,258$ 1,000,000$ -$ 31,920$ 140,226$ -$ 288,000$ 960,000$ 383,019$ -$ 1,487,788$ 2,662,978$ 435,147$ 27,141,521$ 1,631,019$ 6.0% 12.91%
White Pine 21,802$ -$ 332,673$ 154,672$ 179,550$ 104,079$ 39,051$ -$ -$ 40,000$ 8,629$ -$ 76,531$ -$ 42,281$ 999,269$ 48,629$ 4.9% 0.48%
State Charters 517,298$ -$ 2,282,780$ 219,656$ 1,843,942$ 258,978$ 196,350$ 541,056$ -$ -$ 108,227$ -$ -$ 52,470$ -$ 6,020,758$ 649,283$ 10.8% 2.86%
TOTAL 49,900,000$ 24,849,870$ 73,277,251$ 4,879,489$ 14,115,622$ 1,060,186$ 6,177,862$ 2,004,239$ 324,800$ 9,929,000$ 2,499,823$ 1,000,000$ 10,280,709$ 8,607,464$ 1,341,549$ 210,247,863$ 15,757,862$ 7.5% 100%
FY2016 State Funding Allocations by District through April 2016

32
POLICY REPORT OCTOBER 2016
Performance-Based Compensation Plans
Pay Performance and Enhanced Compensation (Assembly Bill 483)
In 2011, the Nevada Legislature passed Assembly Bill 229, which proposed changing the way teachers are
compensated. Specifically, it begins transitioning away from a model that provides compensation using a
‘step and column’ model to one that provides compensation based on performance (which is linked to
improved academic outcomes). The statute requires “the board of trustees of each school district to: (1)
establish a program of performance pay and enhanced compensation for the recruitment and retention
of licensed teachers and administrators; and (2) implement the program commencing with the 2014–2015
school year.”
In 2015, the Nevada Legislature passed Assembly Bill 483, which amends provided more specific guidance
on the performance pay and enhanced compensation model (established by NRS 391.168).72
Specifically, the legislation requires that each school district shall annually “reserve for each fiscal year a
sum of money sufficient to pay an increase in base salaries, not to exceed 10 percent, for not less than 5
percent of the teachers and administrators employed by the school district.”73 This new system will be
implemented in 2016—2017 school year. Additionally, AB 483 eliminates the “requirement that the
program of performance pay and enhanced compensation be the subject of collective bargaining.”74
Moreover, the legislation requires the school district to prioritize implementation of the performance pay
and enhanced compensation program and the disbursement of funds to the “lowest-rated schools”
(based on the Nevada School Performance Framework).75
Based on the broad guidelines of the legislation, we provide a preliminary analysis of the potential fiscal
impact of the performance pay model (see Table 9). The fiscal impact ranges from an annual $1.8 million
on the low end to $3.7 million on the high end of the range).
Despite the guidance, there is tremendous variation across school districts in how they have decided to
implement AB 483 in 2016-2017. Table 10 provides a comparison of the school district plans. For example,
although 95 of the 343 rated schools in Clark County School District are 1 or 2 star schools, the district is
planning on distributing AB 483 funds only in 4 schools for a total amount of $400,000. Despite explicit
guidance from the Nevada Department of Education, only five school districts (Elko, Esmeralda, Lander,
Pershing, and Washoe) have linked the financial bonus to performance. Other school districts are giving
bonuses to all licensed teachers and administrators (Carson City) or to all licensed teachers and
administrators at select schools (Lincoln and Storey County School Districts). Collectively, school districts
have allocated $2.1 million collectively to AB 483, which is within the Guinn Center’s estimated range
($1.8-$3.7 million).
Researchers Johnson and Papay suggest that any district exploring a performance-based compensation
question should ask (and answer) three questions to inform the design of the compensation framework:
1. Which measures will be used in assessing performance— standardized tests, professional
evaluation, or a combination of both?

33
POLICY REPORT OCTOBER 2016
2. Whether state leaders and/or district officials will identify top performers using relative
rankings or a fixed standard? and
3. Whether state leaders and/or district officials will provide awards at the individual or group
(e.g., school) level?76
Upon review, most districts, in distributing the AB 483 funds, are not linking the award to an individual’s
teacher performance. Some, but not all, are linking it to school-wide performance.
Great Teaching and Leading Fund (Senate Bill 474)
Additionally, Nevada in recent years has established a new program, the Great Teaching and Leading Fund
(Senate Bill 474), that provides additional money ($9.8 million over the 2015-2017 biennium) to support
teacher recruitment and retention. Specifically, the funds are intended to support: (1) Professional
development for teachers, administrators and other licensed educational personnel; (2) Programs of
preparation for teachers, administrators and other licensed educational personnel; (3) Programs of peer
assistance and review for teachers, administrators and other licensed educational personnel; (4) Programs
for leadership training and development; and (5) Programs to recruit, select and retain effective teachers
and principals.”77 The first round of awards were announced in the Fall 2015. Per the legislation, as of
2017, the Nevada State Board of Education “will coordinate activities by prescribing annual priorities for
the Fund, based in part on considerations of the assessment of the training needs of teachers and
administrators made by the governing body of each regional training program for the professional
development of teachers and administrators.”78
The legislation also created the Advisory Task Force on Educator Professional Development to study issues
relating to professional development of licensed educational professionals. By the end of 2016, the Task
Force is required to submit a final report “to the Governor, the State Board of Education, the Legislative
Committee on Education and the Director of the Legislative Counsel Bureau,” that includes “findings and
recommendations regarding budgets, changes to regulations, and legislation and the adoption of
statewide standards for professional development.”79

34
POLICY REPORT OCTOBER 2016 Table 9. Estimated Cost of Pay for Performance Legislation, Guinn Center estimates
The legislation states that school districts must “reserve for each fiscal year a sum of money sufficient to pay an increase in base salaries, not to exceed 10 percent, for not less than 5 percent of the teachers and administrators employed by the school district.” Our research team assumes that “lowest-rated schools” include all schools that receive 1-2 stars in the Nevada State Performance Framework (NSPF). Column A: Number of teaching staff in the school district Column M: Ten percent of Column I (5 percent of administrators) Column B: Five percent of Column A (number of teachers in the district) Column N: Ten percent of Column J (10 percent of administrators) Column C: Ten percent of Column A (number of teachers in the district) Column O: Low range of cost (Columns F and M) Column D: Average salary of teacher Column P: High range of cost (Columns G and N) Column E: Ten percent of Column D (average teacher salary) Column F: Ten percent of Column B (5 percent of teaching staff) Column G: Ten percent of Column B (10 percent of teaching staff) Column H: Number of teaching staff in the school district Column I: Five percent of Column H (total number of administrators in the district) Column J: Ten percent of Column H (total number of administrators) Column K: Average salary of administrator Column L: Ten percent of Column L (average administrator salary)
A B C D E F G H I J K L M N O
Number
of admin
5% of
staff
10% of
staff
Average
Salary
10% of
Salary
(D)
Cost at 5%
of staff
(B*E)
Cost at
10% of
staff (C*E)
Number
of
teachers
5% of
staff
10% of
staff
Average
Salary
10% of
salary (L)
Cost at 5%
of teachers
(I*L)
Cost at 10%
of teachers
(J*L)
% schools
that are 1-2
stars NSPF
Lower End of
Cost
(F+M)*O)
Higher End of
Cost (G+N)*O
Carson City 24 1 2 87,492$ 8,749$ 10,499$ 20,998$ 439 22 44 53,874$ 5,387$ 118,253$ 236,507$ 9.1% 11,705$ 23,410$
Churchi l l 10 1 1 91,491$ 9,149$ 4,575$ 9,149$ 180 9 18 55,995$ 5,599$ 50,395$ 100,791$ 40.0% 21,988$ 43,976$
Clark 931 47 93 100,064$ 10,006$ 465,798$ 931,596$ 18,844 942 1,884 50,403$ 5,040$ 4,748,971$ 9,497,941$ 27.7% 1,444,324$ 2,888,647$
Douglas 21 1 2 99,313$ 9,931$ 10,428$ 20,856$ 385 19 39 53,967$ 5,397$ 103,887$ 207,773$ 7.7% 8,793$ 17,587$
Elko 33 2 3 88,681$ 8,868$ 14,632$ 29,265$ 523 26 52 61,480$ 6,148$ 160,770$ 321,540$ 17.2% 30,242$ 60,484$
Esmeralda 1 0 0 108,654$ 10,865$ 543$ 1,087$ 8 0 1 40,933$ 4,093$ 1,637$ 3,275$ 33.3% 727$ 1,454$
Eureka 4 0 0 121,872$ 12,187$ 2,437$ 4,875$ 32 2 3 77,207$ 7,721$ 12,353$ 24,706$ 11.1% 1,643$ 3,287$
Humboldt 15 1 2 101,335$ 10,134$ 7,600$ 15,200$ 209 10 21 55,551$ 5,555$ 58,051$ 116,102$ 44.4% 29,178$ 58,356$
Lander 5 0 1 103,334$ 10,333$ 2,583$ 5,167$ 68 3 7 59,388$ 5,939$ 20,192$ 40,384$ 25.0% 5,694$ 11,388$
Lincoln 9 0 1 91,634$ 9,163$ 4,124$ 8,247$ 81 4 8 56,640$ 5,664$ 22,939$ 45,878$ 12.5% 3,383$ 6,766$
Lyon 43 2 4 87,213$ 8,721$ 18,751$ 37,502$ 465 23 47 52,434$ 5,243$ 121,909$ 243,818$ 10.0% 14,066$ 28,132$
Mineral 3 0 0 104,156$ 10,416$ 1,562$ 3,125$ 38 2 4 50,036$ 5,004$ 9,507$ 19,014$ 100.0% 11,069$ 22,138$
Nye 18 1 2 90,653$ 9,065$ 8,159$ 16,318$ 290 15 29 56,044$ 5,604$ 81,264$ 162,528$ 45.5% 40,647$ 81,293$
Pershing 5 0 1 111,480$ 11,148$ 2,787$ 5,574$ 61 3 6 60,868$ 6,087$ 18,565$ 37,129$ 25.0% 5,338$ 10,676$
Storey 3 0 0 53,407$ 5,341$ 801$ 1,602$ 34 2 3 61,764$ 6,176$ 10,500$ 21,000$ 25.0% 2,825$ 5,650$
Washoe 219 11 22 95,379$ 9,538$ 104,440$ 208,880$ 3,538 177 354 53,996$ 5,400$ 955,189$ 1,910,378$ 17.5% 185,178$ 370,356$
White Pine 9 0 1 90,079$ 9,008$ 4,054$ 8,107$ 80 4 8 51,744$ 5,174$ 20,698$ 41,395$ 62.5% 15,469$ 30,939$
TOTAL PROJECTED COST OF IMPLEMENTATION OF PERFORMANCE PAY PLAN (AB483) 1,832,269$ 3,664,538$
ADMINISTRATORS TEACHERS PROJECTED COST

35
POLICY REPORT OCTOBER 2016 Table 10: Stated Cost of Pay for Performance Legislation, Based on School District Reports
# Licensed
Teachers
# School
Admin
# Eligible
Teachers
# Eligible
Admin
Fund
Allocation
Est. #
Teacher
Awards
Est. #
Admin
Awards
Est. Pay,
Teachers
Est. Pay,
Admin
Tied to indiv
evaluation?
Carson 498 23 25 1 60,000$ 498 23 100$ 100$ No
Churchill 175 9 9 1 60,161$ 9 1 TBD
Clark 18,362 973 5,975 298 500,000$ 160 8 2,900$ 4,000$ No
Douglas 408 23 22 1 50,000$ 78 combined 500$ 500$ No
Elko 552 33 28 2 250,000$ 76 6 Yes
Esmeralda 8 2 8 2 6,858$ 8 2 Yes
Eureka 28 1 0 300$ 1 0 100$ Unknown
Humbolt 209 15 12 1 100,000$ 12 1 No
Lander 70 6 4 1 10,000$ 350$ 350$ Yes
Lincoln 91 9 5 1 10,000$ No
Lyon 545 37 47 3 150,000$ 47 3 3,000$ No
Mineral
Nye 330 combined 17 combined 250,000$ 17 combined No
Pershing 61 3 32 combined 11,000$ 32 combined Yes
Storey 34 2 2 1 3,600$ 36 combined 100$ 100$ No
Washoe 4153 228 208 12 623,198$ 310 10 1,500$ 1,500$ Yes
White Pine 84 6 4 2 23,450$ 4 2 3,611$ 4,503$ No
Funds dis tributed on 1st come, 1st serve bas is ; meri t of proposal
NO INFORMATION AVAILABLE
Al l teachers at low-performing, at ri sk schools el igible for 2 days
of pay for Kagan PD; $1000 tui tion reimbursement
Al l teachers/admin wi l l receive $250 i f at 4 s tar school ; $500 i f at
5 s tar school . Highly Effective teachers wi l l receive $500
"Each certi fied s taff" at 3+ s tar schools wi l l receive $100 bonus
Must have Highly Effective evaluation, 90% teacher attendance
Used to advance career of teachers (PD) & retain adminis trators
Funds wi l l be disbursed to support s i te based leadership,
technology cmtes , rura l schools , PDWil l be awarded to a l l teachers/admin at top performing school
based on the fol lowing: teacher attendance, PLC attendance, MAP
test score growth, parent teacher conference increase
Based on NSPF rating: $100 for teachers/ admin at 5 s tar school ;
$75 for those at 4 s tar school ; $50 for those at 3 s tar school
Focus on specia l ed
"Certi fied s taff have engaged in s igni ficant and meaningful PD"
Wil l give awards to teachers/admin at 4 high performing (SBAC,
WIDA, ROI), at-risk schools
"Only avai lable to individuals rated as Highly Effective or
Effective"; Amt of pay based on movement across NSPF or
maintenance at 4/5 s tar schools
Tied to NEPF; $857 for Effective teachers/admin; $1,714 for highly
effective teachers/admin
Other Notes

36
POLICY REPORT OCTOBER 2016
Teach Nevada Scholarship (Senate Bill 511)
Additionally, in 2015, the Nevada Legislature passed Senate Bill 511, which established the Teach Nevada
Scholarship Program (see Table 10 for a list of recipients of SB 511) and provides $10 million each year of
the 2015-2017 biennium. The bill requires that school districts who apply for Teach Nevada Scholarship
Funds use the monies to “recruit teachers to certain schools that have a high need for teachers through
its program of performance pay and enhanced compensation.”80 Specifically, school districts must use the
grant money they receive to “increase the base salary of newly hired teachers at such schools for their
first two years of employment,” and “provide professional development to said teachers during their first
two years of employment.”81 The amount is not to exceed $5,000 per school year. The Nevada
Department of Education provided guidance to indicate that “For School Year 2016-2017, these State
funds are not subject to collective bargaining.”82
Teachers are not entitled to continue to receive the incentive after the 2016-17 school year, and districts
shall provide professional development to each teacher who receives an incentive. A total of $9,929,000
will be disbursed to fourteen districts for 2,457 teachers at 327 eligible schools (see Table 11). (Douglas,
Eureka and Storey County did not request funding, as they do not have schools which met the criteria
outlined in SB511.)
In July 2015, the State Board approved the Nevada Department of Education’s recommendation that the
maximum size of the award be capped at $4,000 to meet demand. A review of the recipients of SB 511
funds suggest that the lion’s share of the funds has been channeled to professional development.

37
POLICY REPORT OCTOBER 2016
Table 11. Distribution of Teach Nevada Scholarship and Incentive funds
Additional Teacher Incentive Programs
In 2013, the Nevada Legislature approved Senate Bill 405, which provided additional funds for
underperforming schools (known as “Zoom Schools”) with significant populations of English Language
Learners.83 In 2015, the Legislature increased funding for Zoom Schools and added funding for a similar
program (Senate Bill 432) that directed additional funds toward underperforming schools with significant
populations of students “living in poverty.”84
The legislation provides school districts with grant funds which they can use to provide reading skill
centers, a summer academy, and professional development. Additionally, both pieces of legislation
provide incentives for teachers. However, there are some differences.
New Teacher Incentives (SB511)
District # Schools # Teachers
Incentive
Amount
Requested by
District
NDE Recommends
($4,000/teacher)Professional Development for SB511
Teachers
Carson 5 30 5,000$ 150,000$ 120,000$
PD plan outl ined for a l l new teachers ;
not di fferentiated by SB511 recipients
Churchill 4 5 5,000$ 25,000$ 20,000$
PD plan outl ined for a l l new teachers ;
not di fferentiated by SB511 recipients
Clark 186 2,080 up to $5,000 9,504,000$ 8,320,000$
30 hours PD for new to Nevada w/prior
exp. and 60 hours for no prior exp. (15
more than other brand new, non SB511)
Elko 6 13 5,000$ 65,000$ 52,000$
PD plan outl ined for a l l new teachers ;
not di fferentiated by SB511 recipients
Esmeralda 1 2 5,000$ 10,000$ 8,000$
Humboldt 11 16 up to $5,000 72,000$ 64,000$
30 additional hours of PD for SB511
recipients
Lander 2 7 3,000$ 21,000$ 21,000$
PD plan in development; no indication
of di fferentiated by SB511 recipients
Lincoln 3 4 up to $5,000 20,000$ 16,000$
30 additional hours of PD for SB511
recipients
Lyon 9 30 3,000$ 90,000$ 90,000$
PD plan outl ined for a l l new teachers ;
not di fferentiated by SB511 recipients
Mineral 1 8 5,000$ 37,500$ 30,000$
Nye 45 16 5,000$ 225,000$ 180,000$
Pershing 1 2 5,000$ 10,000$ 8,000$ PD plan not included
Washoe 43 240 up to $5,000 978,375$ 960,000$
PD plan outl ined for a l l new teachers ;
not di fferentiated by SB511 recipients
(additional tui tion ass is tance for SB511
Specia l Ed)
White Pine 10 4 5,000$ 50,000$ 40,000$
Total
Requested 327 2,457 N/A 11,257,875$ 9,929,000$ N/A

38
POLICY REPORT OCTOBER 2016
Victory Schools can offer incentives from $250 to $3,000 to recruit and retain more teachers to the
classroom in these high-needs schools. Principals can use up to 51 percent of the extra state aid for
recruitment and retention incentives, among other uses. As of May, the incentives appeared to be
working. Between April and May 2016, more than half of Victory Schools in Clark County School District
had filled every open teaching position listed for the 2016-17 school year.85
In contrast, Zoom School principals are only allowed to use up to two percent of their funds for incentives,
parent engagement, and teacher training. For example, while Clark County School District received $39.4
million in Zoom funds, teachers are only able to receive an incentive totaling $350. (During the first year
of Zoom School funds, principals were unable to offer incentives). One reason for the small award size is
that Clark County School District has decided to distribute school-based awards, meaning that everyone
in the Zoom school will receive the same size (value) of incentive award. Informal conversations with
district officials suggest that they read the research that suggests individual performance awards can
adversely impact morale and collaboration. Ironically, principals of Zoom Schools shared that they wanted
However, despite the similar legislation, the implementation has not been uniform. For example, Clark
County School District officials and school leaders have confirmed that they can use Victory School funds
to provide teacher incentives. In contrast, some school leaders in Clark County School District have not
been able to use Zoom School funds to provide teacher incentives. According to one education official,
one school district believed the Zoom school funds were subject to collective bargaining agreements.
However, another school district confirmed that it believed it could use Zoom School funds for teacher
incentives, but chose instead to direct the funds toward professional development.
Based on our research and analysis, we identify two areas of potential inefficiencies, which could
undermine the overall impact of these performance pay and teacher incentive programs and their desired
impact. First, there is little state guidance on how the school districts should implement the performance
pay and teacher incentive programs. While it is important to provide flexibility to school districts (and
schools and classroom teachers) so that they can implement programs in a way that reflects the needs
and preferences of their students and community, the absence of consistent legal and administrative
guidance may ultimately undermine the State’s goals.
For example, school districts must submit performance-based compensation plans (AB 483) to the State
Board of Education for review, and as part of the application to request SB 511 funds. As indicated in Table
XX, there is significant variation in the implementation of the plans. Moreover, school districts appear to
have significantly different interpretations or understandings of the legislation. Notwithstanding the
State’s interest in preserving local autonomy, the State should seek to clarify the requirements of the
program. Moreover, the State should provide evidence based research on best practices. For example,
educational experts suggest that school districts should “emphasize extra pay for effectiveness and career
pathways instead of small bonuses.”86
Second, teacher vacancies and the desire to recruit and retain (highly effective) teachers have prompted
the State to propose several compensation and recruitment incentive programs, which we discussed
previously. However, these new compensation and incentive programs have been rolled out in piecemeal
fashion. Similarly, to maximize local autonomy, there is no uniform, integrated framework or plan for

39
POLICY REPORT OCTOBER 2016
administering these programs. In the absence of an integrated plan – that could be designed and
implemented by State policy makers or at the local level – there is some risk that the implementation
could be piecemeal and even redundant. To underscore this point, RAND Corporation has conducted
research evaluating several pay-for-performance programs around the United States. RAND Corporation
researchers found that the program did “not produce its intended effects” and that it “did not improve
student achievement at any grade level.”87 They concluded by noting the key conditions that “would
enable the program to be successful.”88 Among these were “understanding of the program, perceived
value of the bonus, and perceived fairness.”89 The absence of an integrated compensation plan may
undermine a full understanding of the program, which could subsequently raise concerns about the
fairness of the program.
Evaluating Nevada’s Classroom Educators
Nevada Educator Performance Framework
In recent years, Nevada has reformed its teacher evaluation system, called the Nevada Educator
Performance Framework. Nevada’s evaluation system is mandated by NRS 386.650. Per Assembly Bill 222
and Assembly Bill 229, teachers must be evaluated in three ways:
(a) Use of student data must account for 50 percent of the evaluation and 50 percent
accounts for qualitative measures (e.g., observations and an evaluation rubric)
(b) Four differentiated designations that define levels of effectiveness (highly effective,
effective, minimally effective, ineffective);
(c) Two consecutive minimally effective or ineffective evaluations can return the individual to probationary status and educators under probationary status must serve three years in probationary status and will need to receive a highly effective or effective evaluation rating in order to become post-probationary.
While an evaluation of the Silver State’s teacher evaluator system is beyond the immediate scope of this
report, there are two observations we offer based on the research. First, several other districts and states
who implemented performance-based compensation programs had provisions in their evaluation system
that indicated that a teacher who received consecutive poor (i.e., minimally effective or ineffective)
evaluations could be terminated. We also note that in other states (districts), teachers who are on
probationary status are not eligible to receive incentives or merit pay. In contrast, in Clark County School
District, a teacher on probation status or who has received a “minimally effective” or “effective” rating
remains eligible for salary increases under the traditional salary schedule. Despite the recent reforms,
school districts in Nevada are not yet tying performance to compensation.
In Indiana, a new code states that a teacher rated “ineffective” or “improvement necessary” may not
receive a salary increase or increment, regardless of the local approach to determining increases in base
salaries. The new code requires collective bargaining agreements to conform to a requirement that
40
POLICY REPORT OCTOBER 2016
“increases or increments in a local salary scale” must be based on a combination of the following factors:
(1) The number of years of a teacher’s experience, (2) The attainment of additional content area credits
or degrees, (3) Teacher evaluation results, (4) The assignment of instructional leadership roles, including
conducting evaluations, and (5) The academic needs of the students in the school corporation.”90
Currently, in Nevada, there is nothing in statute or regulation that requires school districts around the
Silver State to use the Nevada Educator Performance Framework ratings (ineffective, minimally effective,
effective, highly effective) when developing salary schedules and compensation structures. The result is
that teachers who receive “minimally effective” or “ineffective” ratings remain eligible for “step and
column” increases.
Although the NEPF was adopted was first implemented in 2014-2015, school districts have been slow to
factor the ratings into the salary structure or even any of the compensation programs funded recently by
the State. One district official stated that the district intends to fully operationalize the NEPF but cannot
do so currently because student growth data is limited.4
However, some districts are doing this. For example, Washoe County School District, which received a
Federal Teacher Incentive Fund (TIF) grant, indicated that it is linking teacher evaluation to its career
leader and identifying teachers who are eligible to become “master” teachers and “teacher leaders.”91
(However, in Clark County School District, master teachers are not required to have highly effecting
ratings). These positions require teachers to take on additional responsibilities, but they also increase base
salary and compensation. With the TIF funds, Washoe County has distributed performance-based awards
to principals, teachers, and staff upon reaching school-wide performance targets (not individual
performance targets).
4 In 2014-2015, there was a technical problem statewide with administering the Smarter Balanced Assessment Consortium (SBAC) assessment exam.

41
POLICY REPORT OCTOBER 2016
Recommendations
Based on our analysis, the Guinn Center proposes the following recommendations.
1. Require an external third party evaluation on all compensation programs
Research underscores the importance of conducting independent, comprehensive program evaluations.
Recognizing the significance of accountability, the Nevada Legislature mandated an external, third party
evaluation of many of the education initiatives approved during the 78th Legislative Session in 2015. For
example, legislation approving Zoom School and Victory School funding required the Nevada Department
of Education (NDE) to “contract for an independent evaluation of the effectiveness of the programs and
services provided by the school districts and charter schools that received money.” In addition, NDE has
recently completed an external evaluation of the Great Teaching and Leading Fund. Experience from other
states and school districts suggests that pay for performance systems have failed when not administered
and monitored effectively. If not already proposed, the Nevada Board of Education should also conduct
an external evaluation of the Enhanced Compensation and Performance Pay Program and the Teach
Nevada Scholarship and Teacher Incentive Funds. The Nevada Department of Education should conduct
an external evaluation of all compensation programs, including both performance-based and incentive
programs.
2. Develop statewide guidance on existing performance-based compensation and incentive programs
a. Establish standard outcome measures
b. Require that school districts regularly evaluate the impact of teaching incentive programs
and new salary schedules on teacher retention, teacher quality, and student outcomes
c. Require that school districts link the Nevada Education Performance Framework to
performance-based compensation and incentive programs
Recently, Nevada has implemented several performance-based compensation and incentive programs.
Among these are the Teach Nevada Scholarship, the Enhanced Compensation and Performance Pay
program, and Victory and Zoom Program incentive funds. However, NDE has yet to articulate consistent
performance metrics or outcomes across all programs. To its credit, NDE allows flexibility in the
implementation of the performance-based compensation and incentive programs so that school districts
can best respond to the unique needs of each school and district. However, in exchange for this flexibility,
NDE should strengthen measures of accountability and establish statewide performance metrics to ensure
that funds are being used in effective ways that serve the goals of these programs. In consultation with
school districts, NDE should consider creating uniform, statewide measurable objectives for the
evaluation of performance-based compensation and incentive programs.
Similarly, over the last few years, school districts and the Nevada Legislature have established programs
to improve the recruitment and retention of (high-quality) teachers. For example, in 2015, the Nevada
Legislature established the Great Teaching and Leading Fund to help recruit and retain high quality

42
POLICY REPORT OCTOBER 2016
licensed educational professionals. This year, the Clark County Education Association and Clark County
School District implemented the Professional Growth System, which restructures the traditional salary
schedule in ways that reward improved educator practice and provide career advancement options for
educators who do not want to leave the classroom. To assess the State’s return on investment and identify
best practices that can be replicated in other school districts around the State, the Legislature (and/or the
State Board of Education) should require school districts to evaluate the impact of the new salary
schedules and teacher incentive programs on teacher retention, teacher quality, and student outcomes.
The State Board of Education should require these evaluations to be presented and submitted annually.
Additionally, last year, NDE provided funds, through the Great Teaching and Leading Fund (SB 474), to
help school districts understand, implement and use the Nevada Educator Performance Framework
(NEPF), the State’s new framework for evaluating teachers. Teachers have been trained on this framework
and they have expressed a degree of comfort with using the framework. A recent evaluation noted:
Overall, the framework itself is viewed positively in terms of its goals and intentions, and
educators are not overwhelmingly opposed to implementing the NEPF based on its
content and processes.
However, many districts are not using or integrating the NEPF. For instance, several districts who
dedicated funds to meet the requirements of the Enhanced Compensation and Performance Pay
legislative requirement (AB 483) did not explicitly link the distribution of funds to the NEPF. All new
programs and policies – including performance-based compensation and incentive programs-- should
incorporate the use of NEPF. The Legislature and State Board of Education should consider requiring
school districts to link the NEPF to performance-based compensation and incentive programs.
3. Improve the integration of all performance- based compensation and incentive programs
Research has documented the positive and robust relationship between teacher quality and academic
outcomes. The desire to improve the quality of the Silver State’s teaching professionals, as well as to
reduce the alarming number of teacher vacancies, has prompted law makers to direct new funds to a
performance-based compensation model, as well as teacher incentive funds. However, these new
performance-based compensation and incentive programs have been rolled out in piecemeal fashion,
rather than in an integrated, systematic manner. Similarly, to maximize local autonomy, the State has not
provided a uniform, integrated framework or plan for administering (or evaluating) these programs. In
the absence of an integrated plan, there is some risk that the implementation of these programs may
result in redundancies or fail to maximize their intended impact.
To underscore this point, RAND Corporation has conducted research evaluating several performance-
based compensation programs around the United States. The researchers found that the program did
“not produce its intended effects” and that it “did not improve student achievement at any grade level.”

43
POLICY REPORT OCTOBER 2016
They concluded by noting the key conditions that “would enable the program to be successful.” Among
these were “understanding of the program, perceived value of the bonus, and perceived fairness.” The
absence of a district level integrated plan of all performance-based compensation and incentive programs
may undermine a full understanding of the programs and reduce their impact. The State Board of
Education and Nevada Department of Education should require all school districts to develop, submit, and
present an integrated implementation plan for all performance-based compensation and incentives
programs. This requirement could serve to reduce redundancy or duplication of the various compensation
and incentive programs and could strengthen overall impact.
4. Continue State-sponsored incentive programs and consider new ways of funding them
Incentive programs around the country have had some success in improving student academic outcomes,
increasing teacher retention, filling hard-to-fill teaching positions, and/or reducing teacher vacancies at
under-performing schools. Research also indicates that performance-based bonuses may have an
advantage over performance-based salary increases. For instance, bonuses have been shown to increase
staff performance more effectively than performance-based salary increases.
In 2015, Nevada launched the Teach Nevada Scholarship and New Teacher Incentive fund. This fund
provides a one-time incentive to new teachers. Nevada should continue using incentives to attract high-
quality teachers to hard-to-fill positions and to high-need schools. The Legislature should continue
funding the Teach Nevada Scholarship and Incentive Fund program. However, the Legislature should
revise the program to target the incentives to the following categories of teachers: (1) high-quality
teachers (as demonstrated by the NEPF “highly effective” ratings) to teach in the State’s under-
performing, high poverty schools, (2) Special Education teachers, (3) and math and science teachers.
Research also indicates that teacher incentive programs could be a cost-effective alternative to other
existing programs or interventions designed to improve student achievement. For example, one study
noted that in comparison to class size reduction interventions, the cost of producing similar academic
gains through teacher incentives were estimated to be $7,000 cheaper than it would have been to reduce
class size. In elementary schools, for example, teacher transfer incentives were $13,000 cheaper than the
class-size reduction benchmark.
Earlier this year, the Nevada Department of Education proposed legislation that would allow schools to
apply for a literacy block grant that would reallocate money intended for classroom-size reduction. To
receive a grant, schools would have to present a site plan that indicates how the money will be used to
improve literacy for students in grades K-3. State education officials and legislators may want to consider
revisiting the use of classroom size reduction funds and allowing the literacy block grant proposal to
include proposals by districts to use teacher incentives to attract high-quality teachers to under-
performing schools. The Nevada State Legislature allow classroom size funds to be made available to
provide literacy block grants to school districts and that some portion of these funds could be used to
offer teacher transfer incentives to attract high quality teachers to under-performing schools.

44
POLICY REPORT OCTOBER 2016
5. Tie incentives or categorical funds to teacher absenteeism rates
Given that teaching is a human capital intensive profession, it may not be possible to reduce the overall
costs of an average school district’s personnel costs, which currently consume about 80 percent of
education expenditures. However, policy makers can adopt requirements and policies to improve the
likelihood that school districts are realizing a positive return on their investment.
One area of concern is that Nevada has the second highest absenteeism rate for teachers in the United
States. Almost half of all teachers (49 percent) miss 10 or more days of school each year. This is almost
twice the national rate of 25 percent. Research reveals that students perform worse in math and are less
engaged in school when their teachers miss at least 10 days of school. In addition to impacting student
achievement, teacher absenteeism is costly for districts since a missing teacher in the classroom means
that schools must hire substitutes.
While policy makers should not ‘reward’ absentee teachers with incentives, the State should consider
ways to link categorical funds given to districts to teacher absenteeism rates. A 2011 study examined an
incentive program in North Carolina, which awarded teachers up to $1,500 each if the standardized test
scores of the entire school improved by a predetermined amount. A program evaluation found that
teachers took 0.6 fewer sick days on average and that math and reading test scores improved. Based on
these results, researchers concluded that “compared to other popular education reforms, such as reduced
class sizes, incentives provide more than four times the amount of student improvement per dollar spent.”
Earlier this year, the Nevada Department of Education proposed legislation that would allow schools to
apply for a literacy block grant that would reallocate money intended for classroom-size reduction. To
receive a grant, schools would have to present a site plan that indicates how the money will be used to
improve literacy for students in grades K-3. State education officials and legislators may want to consider
revisiting the use of classroom size reduction funds and categorical funds in ways that align with
performance metrics and student outcomes. The State Board of Education and Nevada Department of
Education should consider including teacher absenteeism rates as a criterion for disbursing categorical
funds to districts and schools. Additionally, NDE should include teacher absenteeism rates in the State’s
Accountability System, which is currently undergoing revisions.
6. Require districts to tie teacher evaluations to increments on the local teacher salary schedule
Despite the implementation of the NEPF, very few districts are using this evaluation framework to inform
teacher compensation. For example, currently, a teacher can receive a “minimally effective” and/or
“ineffective” rating and remain eligible for salary increases (on the standard teacher salary schedule). One
notable exception is Washoe County School District, which is using the NEPF ratings to identify and
promote teachers by giving them more responsibility. Specifically, Washoe County School District requires
“master teacher” candidates to have received the highest ratings on the NEPF.
Other states have attempted to address this issue. Indiana passed a law stating that teachers were only
eligible for merit pay increases if they received “highly effective” or “effective ratings.” (In practice,
reports suggest, however, that the law has not had the intended outcome. Most teachers simply receive

45
POLICY REPORT OCTOBER 2016
high ratings.) In Tennessee, the state requires districts “to differentiate teacher compensation based on
at least one criterion in addition to years of experience and education, including additional roles or
responsibilities, hard-to-staff schools or subject areas, and performance-based on State board approved
teacher evaluation criteria.” The Nevada State Legislature should consider requiring school districts to link
advancement on the salary schedule to NEPF ratings.
7. Assess Nevada’s system for evaluating principals and administrators
Performance-based compensation programs must be aligned with additional programs to improve
student achievement and working conditions at the school sites. Research indicates that the most
effective performance-based compensation programs are “implemented as part of a broader, holistic
retention strategy, rather than as standalone initiatives.” This is because compensation is only one factor
that influences an individual’s decision to enter (and remain) in the classroom. Other considerations are
strong principals, skilled and supportive colleagues, adequate resources for teaching, smaller student
loads, autonomy, high‐quality professional development, and safety. These considerations should be
incorporated into incentive programs geared toward recruitment and retention.
As noted by the Education Commission of States, where performance-based programs have
demonstrated some success, they are usually coupled with other programs and comprehensive reform
efforts (e.g., job-embedded professional development, professional learning communities, school
leadership teams). In Charlotte, North Carolina, performance-based incentives were accompanied by
efforts to foster a positive working environment (by granting principals greater autonomy, in part). One
study noted, “Policies that create salary structures that compensate teachers for working in more difficult
school environments may not effectively retain teachers unless work conditions are also improved.”
Preliminary research indicates that Nevada does not have a robust pipeline of strong principal leaders.
For example, during the Great Recession, Clark County School District suspended it internal training and
leadership development program for future principals. Interviews with teachers and education officials
around the State reveal that the current system for recruiting, training, supporting principals has gaps.
Interviews also reveal that the roll-out of the NEPF to school leadership teams (principals and
administrators) has been “sluggish.” A robust body of research confirms that leadership and overall
working conditions are critical to retaining high quality classroom instructors. The Legislature and State
Board of Education should require a status update of how administrators and principals around the State
are being evaluated. The Nevada State Legislature should commission a comprehensive study on culture
and principal leadership development around the State.

46
POLICY REPORT OCTOBER 2016 ___________________________________________________________________
Board of Directors Phil Satre President Tom Gallagher Vice President Stephanie Tyler Vice President Missy Young Secretary/Treasurer Deane Albright, CPA Joe Crowley, Ph.D. Jill Derby, Ph.D. Dan Hamilton, Ph.D. Carol Harter, Ph.D. Mick Hitchcock, Ph.D. Ken Ladd Erin McMullen Dana Lee Chris Roman Douglas Seastrand
About the Kenny C. Guinn Center for Policy Priorities The Kenny C. Guinn Center for Policy Priorities is a 501(c)(3) nonprofit, independent research center focused on providing fact-based, relevant, and well-reasoned analysis of critical policy issues facing Nevada and the Intermountain West. The Guinn Center engages policy-makers, experts, and the public with innovative, data-driven research and analysis to advance policy solutions, inform the public debate, and expand public engagement. © 2016 Kenny C. Guinn Center for Policy Priorities. All rights reserved. Contact information: Kenny Guinn Center for Policy Priorities c/o inNEVation Center 6795 Edmond Street, Suite 300/Box 10 Las Vegas, Nevada 89118 Phone: (702) 522-2189 Email: [email protected] Nancy E. Brune, Ph.D., Executive Director Email: [email protected] Megan K. Rauch, Director of Education Policy | Director of Policy Outreach Email: [email protected] Erika R. Marquez, Ph.D., Director of Health Policy Email: [email protected] Meredith A. Levine, Director of Economic Policy Email: [email protected]

47
POLICY REPORT OCTOBER 2016
REFERENCES
1 Hanover Research. 2014. “Review of Teacher Incentive Programs.” Available: http://www.ccresa.net/wp-content/uploads/2014/12/Review-of-Teacher-Incentive-Programs-1.pdf. 2 Opportunity Culture. 2014. “Teacher Pay and Career Paths in an Opportunity Culture: A Practical Policy Guide.” Public Impact. Available: http://opportunityculture.org/wp-content/uploads/2014/10/Teacher_Pay_and_Career_Paths_in_an_Opportunity_Culture_A_Practical_Policy_Guide-Public_Impact.pdf 3 David M. Adamson. 2012. “No Evidence That Incentive Pay for Teacher Teams Improves Student Outcomes: Results from a Randomized Trial.” RAND Corporation. Available: http://www.rand.org/pubs/research_briefs/RB9649/index1.html; Susan Moore Johnson and John P. Papay. 2009. “Redesigning Teacher Pay: A System for the Next Generation of Educators.” Economic Policy Institute. Available: http://www.epi.org/publication/book-redesigning_teacher_pay/ 4 Karen Hawley Miles, Kaitlin Pennington, and David Bloom. 2015. “Do More, Add More, Earn More: Teacher Salary Redesign Lessons from 10 First-Mover Districts.” Center for American Progress. Available: https://cdn.americanprogress.org/wp-content/uploads/2015/02/TeacherCompensation-report2.pdf 5 Stephanie Aragon. 2016. “Mitigating Teacher Shortages: Financial Incentives.” Education Commission of the States. Available: http://www.ecs.org/ec-content/uploads/Mitigating-Teacher-Shortages-Financial-incentives.pdf 6 Nancy Brune, Megan Rauch, and Leslie Strasser Murdock. “Teacher-Shortage Crisis Hurts Students with Disabilities Most.” Las Vegas Sun. May 28, 2016. Available: http://lasvegassun.com/news/2016/may/28/teacher-shortage-crisis-hurts-students-with-disabi/. 7 John Fensterwald. 2015. “Half of New Teachers Quit Profession in 5 Years? Not True, New Study Says.” EdSource. Available: https://edsource.org/2015/half-of-new-teachers-quit-profession-in-5-years-not-true-new-study-says/83054 8 Sheryn Waterman and Ye He. 2011. “Effects of Mentoring Programs on New Teacher Retention: A Literature Review.” Mentoring and Tutoring: Partnership in Learning. Volume 19, No. 2. Available: https://boardofed.idaho.gov/board_initiatives/education_improvement_taskforce/06-21-13/Waterman Ye He 2011.pdf 9 Brett Campbell and Judet Diaz. 2008. “Clark County School District Teacher Attrition Information.” Clark County School District (Commissioned by: Martha Tittle, Chief Human Resources Officer). Available: http://ccsd.net/resources/assessment-accountability-research-school-improvement-division/pdf/research/ccsd-teacher-attrition-final-12-5-08.pdf 10 Campbell and Diaz. 2008. “Clark County School District Teacher Attrition Information.” Clark County School District (Commissioned by: Martha Tittle, Chief Human Resources Officer). Available: http://ccsd.net/resources/assessment-accountability-research-school-improvement-division/pdf/research/ccsd-teacher-attrition-final-12-5-08.pdf 11 Gary Barnes, Edward Crowe, and Benjamin Schaefer. 2007. “The Cost of Teacher Turnover in Five School Districts: A Pilot Study.” National Commission on Teaching and America’s Future. Available: http://files.eric.ed.gov/fulltext/ED497176.pdf 12 Loretta A. Terry and William Allan Kritsonis. 2008. “A National Issue: Whether the Teacher Turnover Effects Students’ Academic Performance?” National Journal for Publishing and Mentoring Doctoral Student Research. Volume 5, No. 1. Available: http://files.eric.ed.gov/fulltext/ED499543.pdf; Kacey Guin. 2004. “Chronic Teacher Turnover in Urban Elementary Schools.” Education Policy Analysis Archives. Volume 12, No. 42. Available: http://epaa.asu.edu/ojs/article/view/197/323 13 Campbell and Diaz. 2008. “Clark County School District Teacher Attrition Information.” Clark County School District (Commissioned by: Martha Tittle, Chief Human Resources Officer). Available: http://ccsd.net/resources/assessment-accountability-research-school-improvement-division/pdf/research/ccsd-teacher-attrition-final-12-5-08.pdf

48
POLICY REPORT OCTOBER 2016 14 Brune, Rauch, and Strasser Murdock. “Teacher-Shortage Crisis Hurts Students with Disabilities Most.” Las Vegas Sun. May 28, 2016. Available: http://lasvegassun.com/news/2016/may/28/teacher-shortage-crisis-hurts-students-with-disabi/ 15 U.S. Department of Education. 2015. “Nevada Plan to Ensure Equitable Access to Excellent Educators.” Available: https://www2.ed.gov/programs/titleiparta/equitable/nvequityplan060115.pdf 16 U.S. Department of Education. 2015. “Nevada Plan to Ensure Equitable Access to Excellent Educators.” Available: https://www2.ed.gov/programs/titleiparta/equitable/nvequityplan060115.pdf. 17 Hanover Research. 2014. “Review of Teacher Incentive Programs.” Available: http://www.ccresa.net/wp-content/uploads/2014/12/Review-of-Teacher-Incentive-Programs-1.pdf 18 Audrey Amrein-Beardsley. 2012. “Recruiting Expert Teachers into High-Needs Schools: Leadership, Money, and Colleagues.” Education Policy Analysis Archives. Volume 20, No. 27. Available: http://epaa.asu.edu/ojs/article/view/941/997 19 Robin Chait and Raegen Miller. 2009. “Paying Teachers for Results: A Summary of Research to Inform the Design of Pay-for-Performance Programs for High-Poverty Schools.” Center for American Progress. Available: https://www.americanprogress.org/wp-content/uploads/issues/2009/05/pdf/performance_pay.pdf 20 Karen Hawley Miles, Kaitlin Pennington, and David Bloom. 2015. “Do More, Add More, Earn More: Teacher Salary Redesign Lessons from 10 First-Mover Districts.” Center for American Progress. Available: https://cdn.americanprogress.org/wp-content/uploads/2015/02/TeacherCompensation-report2.pdf 21 Education Resource Strategies. 2013. “Misfit Structures & Lost Opportunities: The Urgent Case for Restructuring Teacher Compensation and Career Paths.” Available: https://www.erstrategies.org/cms/files/1796-misfit-structures--lost-opportunities-pdf-doc.pdf 22 Education Resource Strategies. 2013. “Misfit Structures & Lost Opportunities: The Urgent Case for Restructuring Teacher Compensation and Career Paths.” Available: https://www.erstrategies.org/cms/files/1796-misfit-structures--lost-opportunities-pdf-doc.pdf. 23 Robin Chait and Raegen Miller. 2009. “Paying Teachers for Results: A Summary of Research to Inform the Design of Pay-for-Performance Programs for High-Poverty Schools.” Center for American Progress. Available: https://www.americanprogress.org/wp-content/uploads/issues/2009/05/pdf/performance_pay.pdf 24 Stephanie Aragon. 2016. “Mitigating Teacher Shortages: Financial Incentives.” Education Commission of the States. Available: http://www.ecs.org/ec-content/uploads/Mitigating-Teacher-Shortages-Financial-incentives.pdf 25 Stephanie Aragon. 2016. “Mitigating Teacher Shortages: Financial Incentives.” Education Commission of the States. Available: http://www.ecs.org/ec-content/uploads/Mitigating-Teacher-Shortages-Financial-incentives.pdf 26 National Governors Association Center for Best Practices. 2007. “Improving Teaching Through Pay for Contribution.” Available: http://www.nga.org/files/live/sites/NGA/files/pdf/0711IMPROVINGTEACHING.PDF 27 Robin Chait and Raegen Miller. 2009. “Paying Teachers for Results: A Summary of Research to Inform the Design of Pay-for-Performance Programs for High-Poverty Schools.” Center for American Progress. Available: https://www.americanprogress.org/wp-content/uploads/issues/2009/05/pdf/performance_pay.pdf 28 Hanover Research. 2014. “Review of Teacher Incentive Programs.” Available: http://www.ccresa.net/wp-content/uploads/2014/12/Review-of-Teacher-Incentive-Programs-1.pdf 29Bryan C. Hassel and Emily Ayscue Hassel. 2009. “Re-Slicing the Teacher Compensation Pie: How to Permanently Fund Teacher Contributions to Children’s Learning.” Public Impact. Available. http://publicimpact.com/web/wp-content/uploads/2009/12/Public_ImpactRe-SlicingtheTeacherCompensationPie.pdf 30 Bryan C. Hassel and Emily Ayscue Hassel. 2009. “Re-Slicing the Teacher Compensation Pie: How to Permanently Fund Teacher Contributions to Children’s Learning.” Public Impact. Available. http://publicimpact.com/web/wp-content/uploads/2009/12/Public_ImpactRe-SlicingtheTeacherCompensationPie.pdf 31 Bryan C. Hassel and Emily Ayscue Hassel. 2009. “Re-Slicing the Teacher Compensation Pie: How to Permanently Fund Teacher Contributions to Children’s Learning.” Public Impact. Available. http://publicimpact.com/web/wp-content/uploads/2009/12/Public_ImpactRe-SlicingtheTeacherCompensationPie.pdf 32 Karen Hawley Miles, Kaitlin Pennington, and David Bloom. 2015. “Do More, Add More, Earn More: Teacher Salary Redesign Lessons from 10 First-Mover Districts.” Center for American Progress. Available: https://cdn.americanprogress.org/wp-content/uploads/2015/02/TeacherCompensation-report2.pdf

49
POLICY REPORT OCTOBER 2016 33 Douglas Lee Lauen and Karen Phelan Kozlowski. 2014. “Race to the Top Performance Incentives in North Carolina: A Summative Report.” Consortium for Educational Research and Evaluation–North Carolina. Available: https://publicpolicy.unc.edu/files/2015/07/Race-to-the-Top-Performance-Incentives-in-North-Carolina-August-2014.pdf; Matthew G. Springer, Dale Ballou, Laura Hamilton, Vi-Nhuan Le, J.R.Lockwood, Daniel F. McCaffrey, Matthew Pepper, and Brian M. Stecher. 2010. “Teacher Pay for Performance: Experimental Evidence from the Project on Incentives in Teaching.” National Center on Performance Incentives at Vanderbilt University. Available: http://www.rand.org/content/dam/rand/pubs/reprints/2010/RAND_RP1416.pdf; Roland G. Fryer. 2011. Teacher Incentives and Student Achievement: Evidence from New York City Public Schools.” NBER Working Paper No. 16850. Cambridge, Massachusetts: National Bureau of Economic Research. Available: http://www.nber.org/papers/w16850.pdf; Mark Gius. 2012. The Effects of Teacher Merit Pay on Academic Attainment: An Analysis Using District-Level Data.” Journal of Economics and Economic Education Research. Volume 13, No. 3. Available: http://www.alliedacademies.org/articles/the-effects-of-teacher-merit-pay-on-academic-attainment-an-analysis-using-districtlevel-data.pdf. 34 Kun Yuan, Vi-Nhuan Le, Daniel F. McCaffrey, Julie A. Marsh, Laura S. Hamilton, Brian M. Stecher, and Matthew G. Springer. 2013. “Incentive Pay Programs Do Not Affect Teacher Motivation or Reported Practices: Results From Three Randomized Studies.” Educational Evaluation and Policy Analysis. Volume 35, No. 1. Available: https://my.vanderbilt.edu/matthewspringer/files/2015/02/Yuan-et-al-2013.pdf 35 Kun Yuan, Vi-Nhuan Le, Daniel F. McCaffrey, Julie A. Marsh, Laura S. Hamilton, Brian M. Stecher, and Matthew G. Springer. 2013. “Incentive Pay Programs Do Not Affect Teacher Motivation or Reported Practices: Results From Three Randomized Studies.” Educational Evaluation and Policy Analysis. Volume 35, No. 1. Available: https://my.vanderbilt.edu/matthewspringer/files/2015/02/Yuan-et-al-2013.pdf 36 Douglas Lee Lauen and Karen Phelan Kozlowski. 2014. “Race to the Top Performance Incentives in North Carolina: A Summative Report.” Consortium for Educational Research and Evaluation–North Carolina. Available: https://publicpolicy.unc.edu/files/2015/07/Race-to-the-Top-Performance-Incentives-in-North-Carolina-August-2014.pdf 37 Lauryn Schroeder. August 15, 2016. Teacher ‘Chronic Absence’ Rate Exceeds Students’. San Diego Union Tribune. http://www.sandiegouniontribune.com/news/data-watch/sdut-teacher-absences-2016aug15-htmlstory.html 38 Ian Whitaker. “‘It’s Pretty Appalling’: Nevada Struggles with Teacher Absenteeism, Report Finds.” Las Vegas Sun. June 30, 2016. http://lasvegassun.com/news/2016/jun/30/nevada-struggles-with-teacher-absenteeism-report-f/; Trevon Milliard. “Nevada Teachers Post Second-Highest Absence Rate in Country.” Reno Gazette-Journal. July 1, 2016. Available: http://www.rgj.com/story/news/education/2016/06/30/nv-teachers-post-second-highest-chronically-absent-rate-country/86575008/ 39 Robin Chait and Raegen Miller. 2009. “Paying Teachers for Results: A Summary of Research to Inform the Design of Pay-for-Performance Programs for High-Poverty Schools.” Center for American Progress. Available: https://www.americanprogress.org/wp-content/uploads/issues/2009/05/pdf/performance_pay.pdf 40 Robin Chait and Raegen Miller. 2009. “Paying Teachers for Results: A Summary of Research to Inform the Design of Pay-for-Performance Programs for High-Poverty Schools.” Center for American Progress. Available: https://www.americanprogress.org/wp-content/uploads/issues/2009/05/pdf/performance_pay.pdf 41 Steven Glazerman, Ali Protik, Bing-ru Teh, Julie Bruch, and Jeffrey Max. 2013. “Transfer Incentives for High-Performing Teachers: Final Results from a Multisite Randomized Experiment—Executive Summary.” U.S. Department of Education, Institute of Education Sciences, National Center for Education Evaluation and Regional Assistance. Available: https://ies.ed.gov/ncee/pubs/20144003/pdf/20144003.pdf; Steven Glazerman, Ali Protik, Bing-ru Teh, Julie Bruch, and Jeffrey Max. 2013. “Transfer Incentives for High-Performing Teachers (Education Brief).” Mathematica Policy Research. Available: https://www.mathematica-mpr.com/-/media/publications/pdfs/education/tti_fact_sheet.pdf 42 Steven Glazerman, Ali Protik, Bing-ru Teh, Julie Bruch, and Jeffrey Max. 2013. “Transfer Incentives for High-Performing Teachers: Final Results from a Multisite Randomized Experiment—Executive Summary.” U.S. Department of Education, Institute of Education Sciences, National Center for Education Evaluation and Regional Assistance. Available: https://ies.ed.gov/ncee/pubs/20144003/pdf/20144003.pdf; Steven Glazerman, Ali Protik, Bing-ru Teh, Julie Bruch, and Jeffrey Max. 2013. “Transfer Incentives for High-Performing Teachers (Education Brief).” Mathematica Policy Research. Available: https://www.mathematica-mpr.com/-/media/publications/pdfs/education/tti_fact_sheet.pdf

50
POLICY REPORT OCTOBER 2016 43 National Governors Association Center for Best Practices. 2007. “Improving Teaching Through Pay for Contribution.” Available: http://www.nga.org/files/live/sites/NGA/files/pdf/0711IMPROVINGTEACHING.PDF; Robin Chait and Raegen Miller. 2009. “Paying Teachers for Results: A Summary of Research to Inform the Design of Pay-for-Performance Programs for High-Poverty Schools.” Center for American Progress. Available: https://www.americanprogress.org/wp-content/uploads/issues/2009/05/pdf/performance_pay.pdf 44 National Governors Association Center for Best Practices. 2007. “Improving Teaching Through Pay for Contribution.” Available: http://www.nga.org/files/live/sites/NGA/files/pdf/0711IMPROVINGTEACHING.PDF 45 Robin Chait. 2009. “Teacher Support for Compensation Reform: Surveys Show Less Experienced Teachers Are More Supportive of Differentiated Compensation.” Center for American Progress. Available: https://www.americanprogress.org/issues/education/report/2009/11/24/6864/teacher-support-for-compensation-reform/ 46 Robin Chait and Raegen Miller. 2009. “Paying Teachers for Results: A Summary of Research to Inform the Design of Pay-for-Performance Programs for High-Poverty Schools.” Center for American Progress. Available: https://www.americanprogress.org/wp-content/uploads/issues/2009/05/pdf/performance_pay.pdf 47 Robin Chait and Raegen Miller. 2009. “Paying Teachers for Results: A Summary of Research to Inform the Design of Pay-for-Performance Programs for High-Poverty Schools.” Center for American Progress. Available: https://www.americanprogress.org/wp-content/uploads/issues/2009/05/pdf/performance_pay.pdf 48 Hanover Research. 2014. “Review of Teacher Incentive Programs.” Available: http://www.ccresa.net/wp-content/uploads/2014/12/Review-of-Teacher-Incentive-Programs-1.pdf 49 Hanover Research. 2014. “Review of Teacher Incentive Programs.” Available: http://www.ccresa.net/wp-content/uploads/2014/12/Review-of-Teacher-Incentive-Programs-1.pdf; William A. Firestone and James R. Pennell. 1993. “Teacher Commitment, Working Conditions, and Differential Incentive Policies.” Review of Educational Research. Volume 63, No. 4. Available: http://s3.amazonaws.com/academia.edu.documents/33879633/Firestone_Teacher_Commitment_1993.pdf?AWSAccessKeyId=AKIAJ56TQJRTWSMTNPEA&Expires=1470516152&Signature=UEHUBGrm6EX%2FyWUJeUuVSRnbhPk%3D&response-content-disposition=inline%3B%20filename%3DTeacher_Commitment_Working_Conditions_an.pdf 50 Hanover Research. 2014. “Review of Teacher Incentive Programs.” Available: http://www.ccresa.net/wp-content/uploads/2014/12/Review-of-Teacher-Incentive-Programs-1.pdf; William A. Firestone and James R. Pennell. 1993. “Teacher Commitment, Working Conditions, and Differential Incentive Policies.” Review of Educational Research. Volume 63, No. 4. Page 511. Available: http://s3.amazonaws.com/academia.edu.documents/33879633/Firestone_Teacher_Commitment_1993.pdf?AWSAccessKeyId=AKIAJ56TQJRTWSMTNPEA&Expires=1470516152&Signature=UEHUBGrm6EX%2FyWUJeUuVSRnbhPk%3D&response-content-disposition=inline%3B%20filename%3DTeacher_Commitment_Working_Conditions_an.pdf 51 Hanover Research. 2014. “Review of Teacher Incentive Programs.” Available: http://www.ccresa.net/wp-content/uploads/2014/12/Review-of-Teacher-Incentive-Programs-1.pdf; Goodman and Turner. 2010. “Teacher Incentive Pay and Educational Outcomes: Evidence from the NYC Bonus Program.” Program on Education Policy and Governance Working Paper Series. Page 13. Available: http://files.eric.ed.gov/fulltext/ED513540.pdf 52 Robin Chait and Raegen Miller. 2009. “Paying Teachers for Results: A Summary of Research to Inform the Design of Pay-for-Performance Programs for High-Poverty Schools.” Center for American Progress. Available: https://www.americanprogress.org/wp-content/uploads/issues/2009/05/pdf/performance_pay.pdf; Opportunity Culture. 2014. “Teacher Pay and Career Paths in an Opportunity Culture: A Practical Policy Guide.” Public Impact. Available: http://opportunityculture.org/wp-content/uploads/2014/10/Teacher_Pay_and_Career_Paths_in_an_Opportunity_Culture_A_Practical_Policy_Guide-Public_Impact.pdf; Umi Jensen, Greg Yamashiro, and Katherine A. Tibbetts. 2010. “What Do We Know about Teacher Pay-for-Performance?” Kamehameha Schools Research & Evaluation Division. Available: http://www.ksbe.edu/_assets/spi/pdfs/PerformancePay.pdf 53 Christopher Magan. “If Most Teachers Get a Bonus, Does Minnesota’s Q-Comp System Work?” Pioneer Press. November 5, 2015. Available: http://www.twincities.com/2013/03/16/if-most-teachers-get-a-bonus-does-minnesotas-q-comp-system-work/ 54 Rachael B. Lawrence. 2015. “Promoting Teacher Professionalism: Lessons Learned from Portland’s Professional Learning Based Salary Schedule.” Forum of the American Journal of Education. Available:

51
POLICY REPORT OCTOBER 2016 http://www.ajeforum.com/promoting-teacher-professionalism-lessons-learned-from-portlands-professional-learning-based-salary-schedule-by-rachael-b-lawrence/ 55 Rachael B. Lawrence. 2015. “Promoting Teacher Professionalism: Lessons Learned from Portland’s Professional Learning Based Salary Schedule.” Forum of the American Journal of Education. Available: http://www.ajeforum.com/promoting-teacher-professionalism-lessons-learned-from-portlands-professional-learning-based-salary-schedule-by-rachael-b-lawrence/; Susan Moore Johnson and John P. Papay. 2009. “Redesigning Teacher Pay: A System for the Next Generation of Educators.” Economic Policy Institute. Available: http://www.epi.org/publication/book-redesigning_teacher_pay/. 56 Hanover Research. 2014. “Review of Teacher Incentive Programs.” Available: http://www.ccresa.net/wp-content/uploads/2014/12/Review-of-Teacher-Incentive-Programs-1.pdf; David M. Adamson. 2012. “No Evidence That Incentive Pay for Teacher Teams Improves Student Outcomes: Results from a Randomized Trial.” RAND Corporation. Available: http://www.rand.org/pubs/research_briefs/RB9649/index1.html 57 Dan Goldhaber and Roddy Theobald. 2012. “Do Different Value-Added Models Tell Us the Same Things?” Carnegie Knowledge Network. Available: http://www.carnegieknowledgenetwork.org/briefs/value-added/different-growth-models/ 58 Matthew G. Springer, Jessica L. Lewis, Mark W. Ehlert, Michael J. Podgursky, Gary D. Crader, Lori L. Taylor, Timothy J. Gronberg, Dennis W. Jansen, Omar S. Lopez, and David A. Stuit. 2010. “District Awards for Teacher Excellence (D.A.T.E.) Program: Final Evaluation Report.” National Center on Performance Incentives at Vanderbilt University. Available: https://my.vanderbilt.edu/performanceincentives/files/2012/10/FINAL_DATE_REPORT_FOR_NCPI_SITE4.pdf 59 National Governors Association Center for Best Practices. 2007. “Improving Teaching Through Pay for Contribution.” Available: http://www.nga.org/files/live/sites/NGA/files/pdf/0711IMPROVINGTEACHING.PDF 60 Stephanie Aragon. 2016. “Mitigating Teacher Shortages: Financial Incentives.” Education Commission of the States. Available: http://www.ecs.org/ec-content/uploads/Mitigating-Teacher-Shortages-Financial-incentives.pdf 61 Hanover Research. 2014. “Review of Teacher Incentive Programs.” Available: http://www.ccresa.net/wp-content/uploads/2014/12/Review-of-Teacher-Incentive-Programs-1.pdf 62 Umi Jensen, Greg Yamashiro, and Katherine A. Tibbetts. 2010. “What Do We Know about Teacher Pay-for-Performance?” Kamehameha Schools Research & Evaluation Division. Available: http://www.ksbe.edu/_assets/spi/pdfs/PerformancePay.pdf 63 Umi Jensen, Greg Yamashiro, and Katherine A. Tibbetts. 2010. “What Do We Know about Teacher Pay-for-Performance?” Kamehameha Schools Research & Evaluation Division. Available: http://www.ksbe.edu/_assets/spi/pdfs/PerformancePay.pdf; Allan M. Mohrman, Jr., Susan Albers Mohrman, and Allan R. Odden. 1996. “Aligning Teacher Compensation with Systemic School Reform: Skill-Based Pay and Group-Based Performance Rewards.” Educational Evaluation and Policy Analysis. Volume 18, No. 1. Pages 51-71. 64 Stephanie Aragon. 2016. “Mitigating Teacher Shortages: Financial Incentives.” Education Commission of the States. Available: http://www.ecs.org/ec-content/uploads/Mitigating-Teacher-Shortages-Financial-incentives.pdf 65 Hanover Research. 2014. “Review of Teacher Incentive Programs.” Available: http://www.ccresa.net/wp-content/uploads/2014/12/Review-of-Teacher-Incentive-Programs-1.pdf 66 Stephanie Aragon. 2016. “Mitigating Teacher Shortages: Financial Incentives.” Education Commission of the States. Available: http://www.ecs.org/ec-content/uploads/Mitigating-Teacher-Shortages-Financial-incentives.pdf 67 Hanover Research. 2014. “Review of Teacher Incentive Programs.” Available: http://www.ccresa.net/wp-content/uploads/2014/12/Review-of-Teacher-Incentive-Programs-1.pdf 68 U.S. Department of Education. 2015. “Nevada Plan to Ensure Equitable Access to Excellent Educators.” Available: https://www2.ed.gov/programs/titleiparta/equitable/nvequityplan060115.pdf 69 Nevada Legislative Counsel Bureau. 2012. “Research Brief on Teacher Pay-for-Performance Plans.” Available: https://www.leg.state.nv.us/Division/Research/Publications/ResearchBriefs/TeacherPayforPerformancePlans.pdf 70 Steven G. Rivkin, Eric A. Hanushek, and John F. Kain. 2005. “Teachers, Schools, and Academic Achievement.” Econometrica. Volume 73, No. 2. Available: http://people.terry.uga.edu/mustard/courses/e8420/Teacher quality.pdf 71 National Council on Teacher Quality. 2015. “2015 State Teacher Policy Yearbook: National Summary.” Available: http://www.nctq.org/dmsView/2015_State_Teacher_Policy_Yearbook_National_Summary_NCTQ_Report 72 Nevada Revised Statutes. § 391A.450. Available: https://leg.state.nv.us/NRS/NRS-391A.html#NRS391ASec450

52
POLICY REPORT OCTOBER 2016 73 Nevada State Legislature. 78th (2015) Session. “Assembly Bill 483: As Enrolled.” Available: https://www.leg.state.nv.us/Session/78th2015/Bills/AB/AB483_EN.pdf 74 The requirement that direct compensation is subject to collective bargaining is located in NRS 288.150, Section 2a. See: Nevada Revised Statutes. § 288.150(2)(a). Available: https://www.leg.state.nv.us/nrs/NRS-288.html#NRS288Sec150; Nevada State Legislature. 78th (2015) Session. “Assembly Bill 483: As Enrolled.” Available: https://www.leg.state.nv.us/Session/78th2015/Bills/AB/AB483_EN.pdf 75 NRS 288.150, Section 2a. See: Nevada Revised Statutes. § 288.150(2)(a). Available: https://www.leg.state.nv.us/nrs/NRS-288.html#NRS288Sec150 76 Susan Moore Johnson and John P. Papay. 2009. “Redesigning Teacher Pay: A System for the Next Generation of Educators.” Economic Policy Institute. Available: http://www.epi.org/publication/book-redesigning_teacher_pay/. 77 Nevada State Legislature. 78th (2015) Session. “Senate Bill 511: As Enrolled.” Available: https://www.leg.state.nv.us/Session/78th2015/Bills/SB/SB511_EN.pdf 78 Nevada State Legislature. 78th (2015) Session. “Senate Bill 511: As Enrolled.” Available: https://www.leg.state.nv.us/Session/78th2015/Bills/SB/SB511_EN.pdf 79 Nevada Department of Education. 2015. “Guidance Memorandum #15-08 from Dale A.R. Erquiaga to Clark County Superintendent Pat Skorkowsky: Request for Guidance Following the 2015 Legislative Session – AB 483 and SB 511.” Available: http://www.doe.nv.gov/News__Media/Guidance_Memos/2015/Guidance_Memo_15-08_AB483_SB511_doc/ 80 Nevada Senate Bill 511. https://www.leg.state.nv.us/Session/78th2015/Bills/SB/SB511_EN.pdf 81 Nevada Senate Bill 511. https://www.leg.state.nv.us/Session/78th2015/Bills/SB/SB511_EN.pdf 82NDE Guidance memo #15-08 from Dale Erquiaga to Skorkowsky . Request Request for Guidance Following the 2015 Legislative Session – AB 483 and SB 511 83 Nevada State Legislature. 78th (2015) Session. “Senate Bill 405: As Enrolled.” Available: https://www.leg.state.nv.us/Session/78th2015/Bills/SB/SB405_EN.pdf 84 Nevada State Legislature. 78th (2015) Session. “Senate Bill 432: As Enrolled.” Available: https://www.leg.state.nv.us/Session/78th2015/Bills/SB/SB432_EN.pdf 85 Neal Morton. “Teacher Salary Programs Help Some Clark County Schools, Not Others.” Las Vegas Review-Journal. June 5, 2016. Available: http://www.reviewjournal.com/news/education/teacher-salary-programs-help-some-clark-county-schools-not-others Karen Hawley Miles, Kaitlin Pennington, and David Bloom. 2015. “Do More, Add More, Earn More: Teacher Salary Redesign Lessons from 10 First-Mover Districts.” Center for American Progress. Available: https://www.americanprogress.org/issues/education/report/2015/02/17/106584/do-more-add-more-earn-more/ 87 RAND Corporation. “Evaluating the Effectiveness of Teacher Pay-for-Performance.” RAND Education. Available: http://www.rand.org/capabilities/solutions/evaluating-the-effectiveness-of-teacher-pay-for-performance.html 88 RAND Corporation. “Evaluating the Effectiveness of Teacher Pay-for-Performance.” RAND Education. Available: http://www.rand.org/capabilities/solutions/evaluating-the-effectiveness-of-teacher-pay-for-performance.html 89 RAND Corporation. “Evaluating the Effectiveness of Teacher Pay-for-Performance.” RAND Education. Available: http://www.rand.org/capabilities/solutions/evaluating-the-effectiveness-of-teacher-pay-for-performance.html 90 Adapted from Diane Hirshberg, Matthew Berman, Dayna Jean DeFeo, Alexandra Hill. November 13, 2015. Salary & Benefits Schedule and Teacher Tenure Study: Appendix (Salary Schedule Review From Other States). University of Alaska Anchorage Center or Alaska Education Policy Research. Available at: http://www.iser.uaa.alaska.edu/Publications/2015_11_16-TeacherSalaryAndTenureReport_Appendixes.pdf 91 Conversations with Washoe County School District officials.