revisiting the widget effect: teacher evaluation reforms ... · revisiting the widget effect:...
TRANSCRIPT

Revisiting The Widget Effect:
Teacher Evaluation Reforms and the Distribution of Teacher Effectiveness
Matthew A. Kraft
Brown University
Allison F. Gilmour
Vanderbilt University
Abstract
In 2009, The New Teacher Project (TNTP)’s The Widget Effect documented the failure to
recognize and act on differences in teacher effectiveness. We revisit these findings by compiling
teacher performance ratings across 24 states that adopted major reforms to their teacher
evaluation systems. In the vast majority of these states, the percentage of teachers rated
Unsatisfactory remains less than 1%. However, the full distributions of ratings vary widely
across states with 0.7% to 28.7% rated below Proficient and 6% to 62% rated above Proficient.
We present original survey data from an urban district illustrating that evaluators perceive more
than three times as many teachers in their schools to be below Proficient than they rate as such.
Interviews with principals reveal several potential explanations for these patterns.
Suggested Citation:
Kraft, M.A. & Gilmour, A.F. (2017). Revisiting the Widget Effect: Teacher evaluation reforms
and the distribution of teacher effectiveness. Educational Researcher, 46(5), 234-249.
We are grateful to Tim Drake, Heather Hill, Susan Moore Johnson, and Jal Mehta for their valuable feedback on
earlier drafts. We thank Mariela Mannion and Melissa Lovitz for their excellent research assistance. All errors and
omissions are our own.
2
Revisiting The Widget Effect:
Teacher Evaluation Reforms and the Distribution of Teacher Effectiveness
The failure of evaluation systems to provide accurate and credible information about individual
teachers’ instructional performance sustains and reinforces a phenomenon that we have come to
call the Widget Effect. The Widget Effect describes the tendency of school districts to assume
classroom effectiveness is the same from teacher to teacher. This decades-old fallacy fosters an
environment in which teachers cease to be understood as individual professionals, but rather as
interchangeable parts.
- The New Teacher Project, 2009
In 2009, The New Teacher Project (TNTP) characterized the failure of U.S. public
education to recognize and respond to differences in teacher effectiveness as the “Widget Effect”
(Weisberg et al., 2009). The study highlighted the discrepancy between formal teacher
evaluation ratings and perceptions about the actual distribution of teacher effectiveness. The
authors found that, in most districts, less than 1% of teachers were rated as Unsatisfactory, but
81% of administrators and 57% of teachers could identify a teacher in their school who was
ineffective. The Widget Effect was not the first or only study to draw attention to districts’
failure to differentiate among teachers (Donaldson, 2009; Toch & Rothman, 2008; Wechsler et
al., 2007). For example, over a decade earlier, Tucker (1997) labeled the U.S. education system’s
failure to recognize “incompetent” teaching as the “Lake Wobegon Effect” – referring to
Garrison Keillor’s fictitious town where “all the children are above average.”
Growing recognition of the broken teacher evaluation system amplified by new research
documenting the importance of teacher effectiveness (e.g. Rockoff, 2004; Rivkin, Hanushek, &
Kain, 2005) helped to generate momentum for evaluation reforms (Donaldson & Papay, 2015).
The U.S. Department of Education’s Race to the Top (RTTT) competition and state waivers for
regulations in the No Child Left Behind Act created strong incentives for states to adopt
sweeping changes to their evaluation systems. Evaluation reforms replaced binary checklists

3
with high-stakes systems comprised of multiple measures of teacher performance including
metrics based on students’ performance on standardized tests.
Today, almost every state has designed and adopted new teacher evaluation systems (see
Steinberg & Donaldson [2016] for a summary of new evaluation systems features and Donaldson
& Papay [2015] for a survey of reform efforts). Some scholars view this focus on high-stakes
evaluation systems as misplaced (Fullan, 2011; Hallinger, Heck, & Murphy, 2014; Mehta &
Fine, 2015). Even those who see evaluation reforms as promising do not agree on how these
systems should be used to improve the teacher workforce. Some argue that the primary role of
evaluation should be to dismiss underperforming teachers (e.g. Edwards, 2014; Hanushek, 2009;
Thomas, Wingert, Conant, & Register, 2010). Others see evaluation as central to supporting
teachers’ professional growth by providing teachers with individualized feedback and identifying
areas for targeted professional support (Almy, 2011; Curtis & Wiener, 2012; Papay, 2012). Both
of these theories of action require an evaluation system that differentiates among teachers and
accurately assesses the quality of their instruction.
In this paper, we revisit The Widget Effect by examining the degree to which new teacher
evaluation systems differentiate among teachers. Research on evaluation reforms has primarily
focused on the properties of performance measures (e.g. Grossman, Loeb, Cohen, & Wyckoff,
2013, Kane, McCaffrey, Miller, & Staiger, 2013, and the March 2015 special issue of
Educational Researcher), the effect evaluation systems have on teacher satisfaction (Koedel, Li,
& Springer, in press) and student achievement (Dee & Wyckoff, 2015; Steinberg & Sartain,
2015; Taylor & Tyler, 2013), and principals’ use of value-added measures (Goldring et al., 2015;
Rockoff, Staiger, Kane, & Taylor, 2012). Research suggests that principals are capable of
distinguishing between low and high performing teachers (Harris & Sass, 2014; Jacob &

4
Lefgren, 2008), but that they do not always do so on high-stakes evaluation ratings (Grissom &
Loeb, in press).
To date, there exists little systematic evidence about the degree to which teacher
evaluation reforms have fundamentally changed the distribution of teacher performance ratings.
We begin by asking, what is the distribution of teacher performance ratings in states that have
adopted reforms to their teacher evaluation systems? We answer this question using new data
from a comprehensive review of teacher evaluation ratings across states that have implemented
teacher evaluation reforms with multiple performance categories. Policymakers assumed that the
sweeping changes to evaluation system design features would result in greater differentiation,
overlooking Lipsky’s (2010) seminal observation that policies are ultimately made by the “street-
level bureaucrats” who implement them. Instead, history shows that the success of policy
initiatives depends on the will and capacity of local actors to implement reforms (Honig, 2006).
This is particularly true in the decentralized U.S. education system where local practice is often
decoupled from central policy (Spillane & Kenney, 2012).
Our findings reveal that the percentage of teachers rated as Unsatisfactory has not
changed in the majority of states that have adopted new teacher evaluation systems. At the same
time, we find considerable variation across states in the percentage of teachers rated in the
category just below Proficient as well as those above. One primary hypothesis for these findings
emerges from Lipsky’s work that “street-level” public-sector employees “cannot do the job
according to ideal conceptions of the practice because of limitations of the work structure”
(2010, p. xvii). We explore this hypothesis as well as others by asking: Does the distribution of
teacher performance ratings reflect evaluators’ perceptions about the distribution of teacher

5
effectiveness? And, if not, what are evaluators’ explanations for why teacher evaluation reforms
have not resulted in greater differentiation in performance ratings?
We examine these questions with quantitative and qualitative data collected over the
course of three years in one large urban school district. Specifically, we leverage original survey
data linked to evaluation records to compare evaluators’ perceptions of the distribution of teacher
effectiveness with both their predictions and actual ratings. We collected and analyze these data
in both the first year of district-wide implementation of the new evaluation system as well as the
third year. Together, these data allow us to assess whether evaluators’ perceptions and actual
ratings converged as they became more familiar with the new system over time. We then discuss
findings from in-depth interviews with a random sample of principals in the district that help to
explain why differences existed between evaluators’ perceptions, predictions, and actual
performance ratings. Throughout the paper we focus much of our analyses and discussion on the
percentage of performance ratings below and above Proficient given the high-stakes incentives
and consequences attached to these ratings in many districts (e.g. Dee & Wyckoff, 2015).
Together, these data provide new insights about the potential and pitfalls of improving the
quality of the teacher workforce through teacher evaluation reforms.
Data and Methods
State Teacher Evaluation Ratings
We compiled data on state distributions of teacher evaluation ratings following a
systematic search and outreach process. Our target sample included 38 states that had either
piloted or fully implemented a new teacher evaluation system by the 2014/15 school year. We
began by reviewing RTTT annual performance reports. We then searched for studies, reports,
and news articles containing information on teacher evaluation ratings using Google’s advanced
6
search features as well as academic databases such as ERIC and Academic Search Premier.
Finally, we reviewed information on state education agency websites and directly contacted
agency staff to request data. Our search produced data on the distribution of teacher effectiveness
for 24 states including 14 RTTT winners. We provide detailed information about rating systems
and source data for each state in Appendix A.
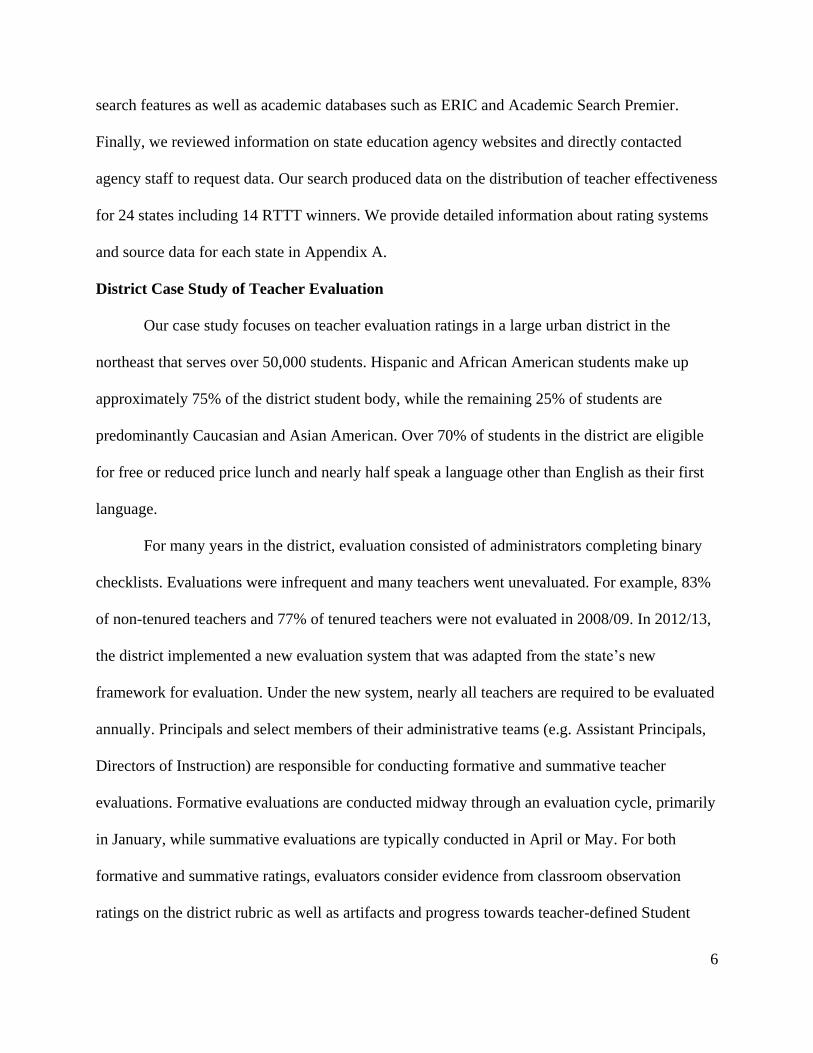
District Case Study of Teacher Evaluation
Our case study focuses on teacher evaluation ratings in a large urban district in the
northeast that serves over 50,000 students. Hispanic and African American students make up
approximately 75% of the district student body, while the remaining 25% of students are
predominantly Caucasian and Asian American. Over 70% of students in the district are eligible
for free or reduced price lunch and nearly half speak a language other than English as their first
language.
For many years in the district, evaluation consisted of administrators completing binary
checklists. Evaluations were infrequent and many teachers went unevaluated. For example, 83%
of non-tenured teachers and 77% of tenured teachers were not evaluated in 2008/09. In 2012/13,
the district implemented a new evaluation system that was adapted from the state’s new
framework for evaluation. Under the new system, nearly all teachers are required to be evaluated
annually. Principals and select members of their administrative teams (e.g. Assistant Principals,
Directors of Instruction) are responsible for conducting formative and summative teacher
evaluations. Formative evaluations are conducted midway through an evaluation cycle, primarily
in January, while summative evaluations are typically conducted in April or May. For both
formative and summative ratings, evaluators consider evidence from classroom observation
ratings on the district rubric as well as artifacts and progress towards teacher-defined Student

7
Learning Goals. They then assign teachers an overall performance rating on a four-category
rating scale based on their holistic assessment of the evidence rather than a weighted sum of
multiple measures. Performance measures based on standardized tests such as value-added
scores or student growth percentiles were not calculated or incorporated into the evaluation
system at the time of this study. Throughout the paper we focus on the overall summative (and
formative) ratings evaluators assigned to teachers rather than any specific rating component on
the district rubric.
Teachers rated as Proficient or Exemplary proceed on either a one or two-year evaluation
cycle of self-directed growth with one unannounced observation. Teachers who are rated as
Needs Improvement or Unsatisfactory are placed on 120 day or year-long structured
improvement plans requiring detailed prescriptions from evaluators along with two to four
unannounced observations. Teachers who do not improve after being placed on a more structured
plan are moved to a 30, 60 or 90 day improvement plan. Receiving a rating below Proficient
while on an improvement plan triggers the dismissal process. Compared to the previous system
which required multiple years of unsatisfactory ratings and a long sequence of confusing
administrative steps with strict deadlines and documentation requirements, the new system
provided a clear and accelerated pathway for terminating the contracts of consistently low-
performing teachers. Several principals we spoke with had used the new system to move a
teacher towards dismissal but suggested teachers often leave their school voluntarily before the
process concludes. There are no formal incentives in place for receiving an exemplary rating
similar to systems in many other states and districts (Steinberg & Donaldson, 2016; see Kraft &
Gilmour, [2016] for a more detailed description of the evaluation system). The distribution of
performance ratings in the district is broadly similar to the state’s distribution but slightly skewed
8
upward with several percentage points fewer teachers rated as Proficient and more rated as
Exemplary.
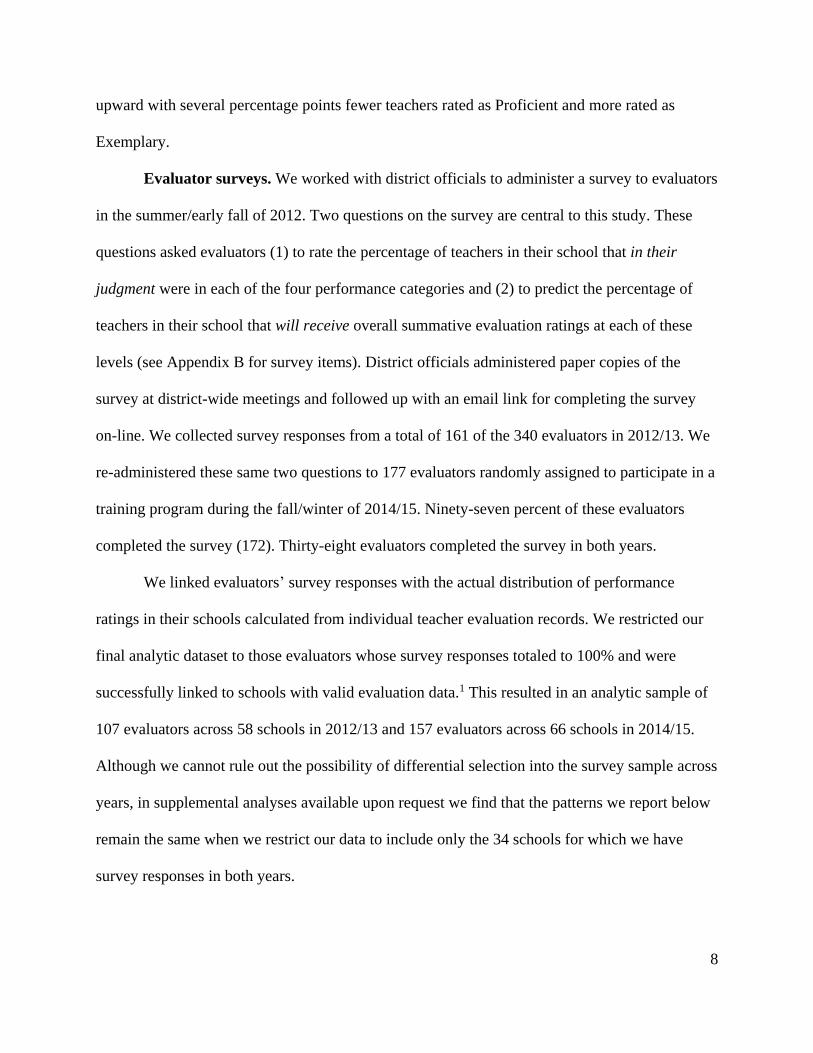
Evaluator surveys. We worked with district officials to administer a survey to evaluators
in the summer/early fall of 2012. Two questions on the survey are central to this study. These
questions asked evaluators (1) to rate the percentage of teachers in their school that in their
judgment were in each of the four performance categories and (2) to predict the percentage of
teachers in their school that will receive overall summative evaluation ratings at each of these
levels (see Appendix B for survey items). District officials administered paper copies of the
survey at district-wide meetings and followed up with an email link for completing the survey
on-line. We collected survey responses from a total of 161 of the 340 evaluators in 2012/13. We
re-administered these same two questions to 177 evaluators randomly assigned to participate in a
training program during the fall/winter of 2014/15. Ninety-seven percent of these evaluators
completed the survey (172). Thirty-eight evaluators completed the survey in both years.
We linked evaluators’ survey responses with the actual distribution of performance
ratings in their schools calculated from individual teacher evaluation records. We restricted our
final analytic dataset to those evaluators whose survey responses totaled to 100% and were
successfully linked to schools with valid evaluation data.1 This resulted in an analytic sample of
107 evaluators across 58 schools in 2012/13 and 157 evaluators across 66 schools in 2014/15.
Although we cannot rule out the possibility of differential selection into the survey sample across
years, in supplemental analyses available upon request we find that the patterns we report below
remain the same when we restrict our data to include only the 34 schools for which we have
survey responses in both years.

9
Principal interviews. In the summer of 2013, we conducted interviews with a stratified
random sample of principals in the district to understand their experiences implementing the new
teacher evaluation system. We created six strata based on school size and level. Twenty-four out
of the 46 principals we contacted agreed to be interviewed. These principals worked at a range of
small and large elementary, middle, and high schools, and were diverse in both demographic
characteristics and administrative experience. We find no statistically significant differences in
the demographic and school characteristics for those principals in the district we interviewed and
those we did not (for full details see Kraft & Gilmour, 2016).
We interviewed each principal for 45-60 minutes using a semi-structured interview
protocol. We audio-recorded and transcribed each interview and then drafted thematic
summaries to identify potential codes (Strauss & Corbin, 1998). We developed and refined our
codes using an iterative process that built on both the scholarly literature and themes that
emerged from our data (Miles & Huberman, 1994). Each author coded two transcripts, reviewed
the other author’s codes, and discussed discrepancies. After reaching coding agreement and
developing the final codebook, we coded each interview transcript and then analyzed these data
by organizing codes around broad themes.
Findings
Distribution of Teacher Evaluation Ratings
In Figure 1, we present the percentage of teachers in the ratings categories that fall below
Proficient/Effective among the 24 states in our analytic sample. The median percentage of
teachers rated below Proficient is 3.05% while the weighted average across these states is 4.13%
(5.18% unweighted) where weights are based on the number of public school teachers in each
state in 2013/14 (Glander, 2015). Figure 1 illustrates how the percentage of teachers rated as

10
below Proficient varies substantially across states. Across all states, the weighted average of
teachers rated Unsatisfactory/Ineffective is 0.48% (0.64% unweighted); only two states,
Maryland and New Mexico, rated more than 1% of teachers in the lowest category.
We present the corresponding percentage of teachers rated in the performance category
(or categories) above Proficient in Figure 2. The median percentage of teachers rated above
Proficient is 38.7% (with a weighted and unweighted average of 36.85% and 36.20%), but varies
considerably from 6% in Georgia to 62% in Tennessee. In fact, a majority of teachers are rated
above Proficient in five states, while less than 20% of teachers are rated above Proficient in five
other states.
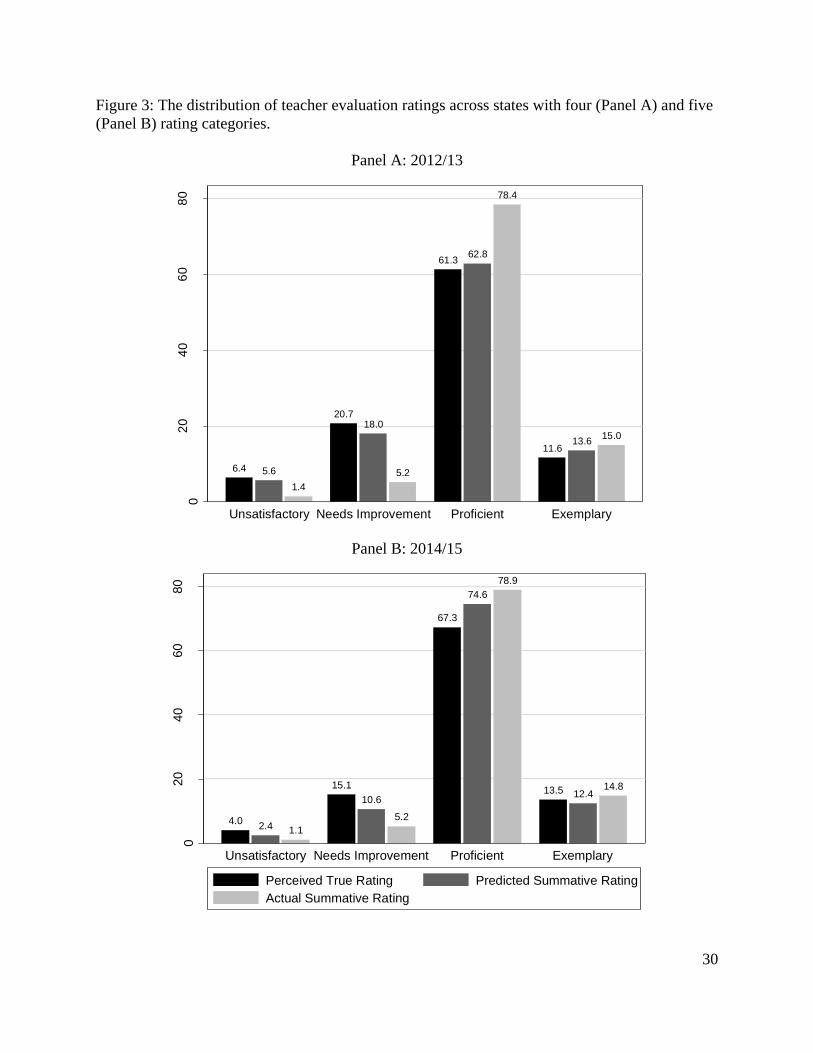
In Figures 3A and 3B, we present the full distributions of teacher evaluation ratings for
states with four and five performance categories, respectively. For states with four rating
categories, the primary differentiation among teachers is between the two highest performance
categories (i.e. Proficient vs. Exemplary). Teacher evaluation ratings in states with five rating
categories appear to differentiate slightly more by distributing teachers across the three top rating
categories. We exclude Maryland from these figures because the state has three rating categories.
Ninety-seven percent of teachers in Maryland are rated as Proficient or above Proficient.
Overall, these data show that some new teacher evaluation systems do differentiate
among teachers, but most only do so at the top of the ratings spectrum. These findings suggest
that new evaluation systems that include multiple rating categories have not necessarily resulted
in more differentiated ratings. Although states with five performance categories tend to rate more
teachers as top performers, more rating categories does not appear to translate into greater
differentiation at the lower end of the rating scale.
Evaluators’ Perceptions of the Distribution of Teacher Quality
11
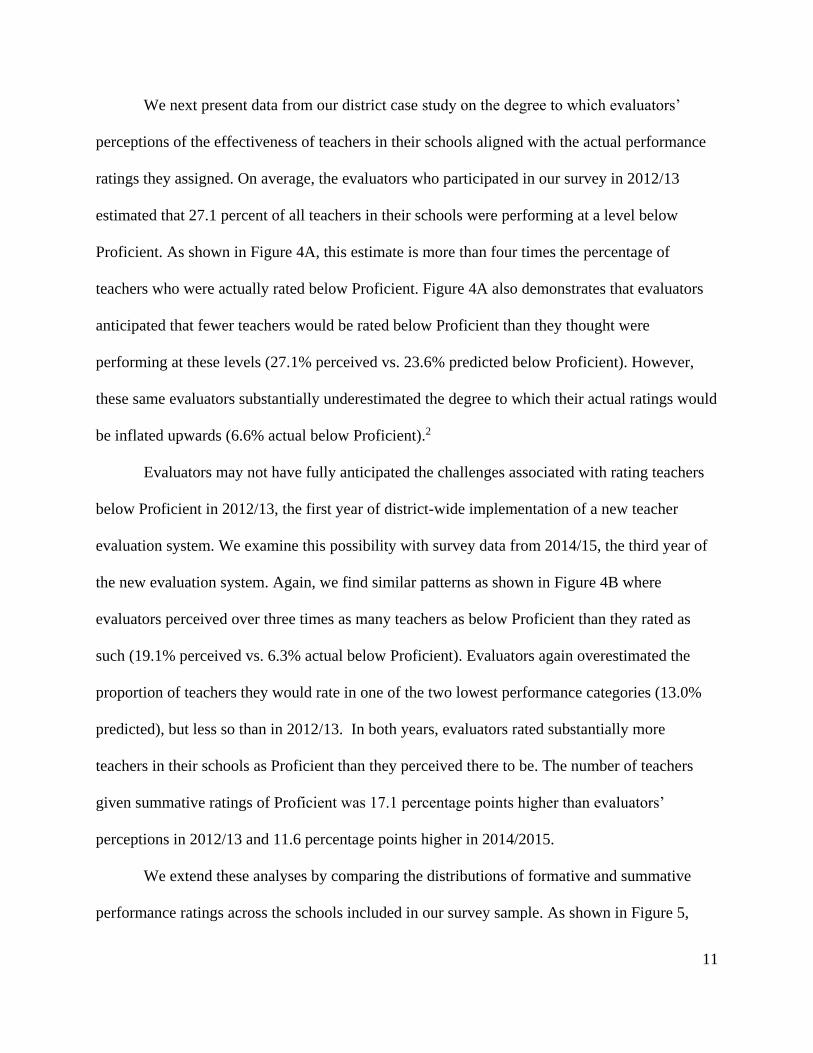
We next present data from our district case study on the degree to which evaluators’
perceptions of the effectiveness of teachers in their schools aligned with the actual performance
ratings they assigned. On average, the evaluators who participated in our survey in 2012/13
estimated that 27.1 percent of all teachers in their schools were performing at a level below
Proficient. As shown in Figure 4A, this estimate is more than four times the percentage of
teachers who were actually rated below Proficient. Figure 4A also demonstrates that evaluators
anticipated that fewer teachers would be rated below Proficient than they thought were
performing at these levels (27.1% perceived vs. 23.6% predicted below Proficient). However,
these same evaluators substantially underestimated the degree to which their actual ratings would
be inflated upwards (6.6% actual below Proficient).2
Evaluators may not have fully anticipated the challenges associated with rating teachers
below Proficient in 2012/13, the first year of district-wide implementation of a new teacher
evaluation system. We examine this possibility with survey data from 2014/15, the third year of
the new evaluation system. Again, we find similar patterns as shown in Figure 4B where
evaluators perceived over three times as many teachers as below Proficient than they rated as
such (19.1% perceived vs. 6.3% actual below Proficient). Evaluators again overestimated the
proportion of teachers they would rate in one of the two lowest performance categories (13.0%
predicted), but less so than in 2012/13. In both years, evaluators rated substantially more
teachers in their schools as Proficient than they perceived there to be. The number of teachers
given summative ratings of Proficient was 17.1 percentage points higher than evaluators’
perceptions in 2012/13 and 11.6 percentage points higher in 2014/2015.
We extend these analyses by comparing the distributions of formative and summative
performance ratings across the schools included in our survey sample. As shown in Figure 5,

12
evaluators appear more likely to assign lower formative ratings. Twice as many teachers received
formative Needs Improvement ratings compared to summative ratings. Nearly twice as many
teachers received summative Exemplary ratings compared to formative ratings. For
Unsatisfactory and Proficient ratings, principals were more consistent across formative and
summative ratings. The difference between the percentage of teachers rated Needs Improvement
and Exemplary on formative versus summative ratings could be due, in part, to improvement in
teacher practice over the course of the year. However, our interviews with principals suggest that
the large differences in the distributions of formative versus summative ratings is primarily the
result of the higher stakes attached to summative ratings.
Together, these findings suggest that evaluators are constrained by what Lipsky referred
to as “limitations of the work structure” in ways they both anticipate and do not foresee. We see
that in both years, evaluators who were responsible for assigning overall summative ratings in
their schools predicted that they would assign fewer teachers below Proficient ratings than they
perceived were warranted. Further, comparing survey results across both years suggests
evaluators became more aware that the performance ratings they would eventually assign would
not accurately reflect their perceptions of teachers’ performance. This suggests that persistent
implementation challenges and the competing tradeoffs that arise when evaluators enact
evaluation policies at the “street-level” are more likely to explain these patterns than short-term
difficulties associated with adopting a new evaluation system.
Why Few Teachers Receive Below Proficient Ratings
In-depth interviews with principals reveal the realities and complex incentives evaluators
must navigate when assessing teachers. Principals’ framing of these challenges illustrates the
coping and rationalizing behaviors that apply, and explain why so few teachers receive below

13
Proficient ratings as well as why ratings did not reflect perceptions of teachers’ actual
performance in the district we studied.
Time constraints. Fourteen principals told us that a lack of time was the most frequent
reason for not giving a teacher a low rating. Rating a teacher as below Proficient required
intensive amounts of time to document their performance and to provide support for their
professional growth. Several principals questioned whether they could collect sufficient evidence
in a few observations to justify a rating below Proficient. As a middle school principal with nine
years of experience put it, “I just feel like sometimes you have to have a lot of detail before you
can give somebody a Needs Improvement.” A high school principal explained that both
observations and support were major constraints, “When you have an unsatisfactory teacher, it
takes a lot of time to observe that teacher, to give true honest-to-goodness feedback.”
Several principals felt as if it was unfair to rate teachers as below Proficient if they did
not have the capacity to provide these teachers with support. A middle school principal described
this tension as follows:
It’s not possible for an administrator to carry through on ten Unsatisfactories
simultaneously. I mean once somebody is identified as Unsatisfactory, the amount of
work, the amount of observation, the amount of time and attention that it requires to
support them can become overwhelming. There is a threshold… otherwise I’m not
providing that person with the quality coaching and feedback that they need to improve.
The increased requirements on evaluators of writing detailed improvement plans and conducting
up to four unannounced formal observations for teachers whom they rated as Unsatisfactory led
some principals to use low ratings selectively. An elementary school principal explained:

14
There were some areas that they could have been needs improvement. Because I was
focusing on two or three other teachers who really needed needs improvement. I gave
them Proficient in those areas. I did it because I couldn’t tackle that many teachers at the
same time as far as writing prescriptions and then following through on the work that I
would need to do.
This principal took a triage approach to evaluating and supporting teachers. He reserved Needs
Improvement ratings for those teachers that needed the most help because of the increased
workloads these ratings would trigger.
Teachers’ potential and motivation. Principals reported that they sometimes factored in
teachers’ potential when assigning an evaluation rating. For example, one principal spoke about
giving new teachers more leeway:
A first year teacher, I tend to give a little more the benefit of doubt. Like, give you a little
time, the opportunity to improve, here are some suggestions…Sometimes someone who’s
fairly new teaching in the building, they are more apt to accept that feedback.
Principals felt that new teachers were still learning and that it was unfair to rate new teachers as
below Proficient if they were working to improve their practice. A principal from a large high
school said he wanted “to give people opportunities, give people chances.” Other principals used
this approach for teachers they viewed as just below Proficient. “They’re not bad teachers. They
need a little more time to develop and become better,” explained a high school principal. They
were “good enough.” Assigning a Proficient rating was seen as a way to recognize teachers’
efforts to improve.
Many of these principals felt that giving a low rating to a potentially good teacher could
be counterproductive to a teacher’s development. For example, one middle school principal said

15
he “will give [teachers] a Proficient rating to keep them on board and to keep them moving in a
direction,” rather than risk losing a potentially good teacher. An experienced elementary school
principal described how low ratings could cause teachers to become less receptive to feedback:
There's one teacher who I probably should have given an overall 'does not meets' ...
Instead, I gave her a subcategory…. I think she's somebody that I could support into
being a stronger teacher. I don’t think I can do that as well if I give an overall
'Unsatisfactory,' get the union involved, and get the teacher taking my feedback in a very
different way.
Principals sometimes shied away from using the lowest ratings for summative evaluations
because it caused teachers to shift their focus from what they could do to improve to the
consequences of the rating itself.
Personal discomfort. Six principals touched on how difficult it was to have
conversations with teachers whom they rated as below Proficient. One experienced principal
nearing retirement articulated this view clearly:
The most difficult part of the job is probably to deliver those difficult messages, and not
everyone is capable of that. That’s where administrators actually fall down is when
they’re unable to deliver those type of messages.
Principals spoke about how there was “definitely emotion” involved in assigning below
Proficient ratings. A middle school principal told us, “I was pretty communicative and still
people would be crying, or, ‘I can’t believe you think that.’” In his experience, some teachers
reacted poorly to their low ratings despite his efforts to be transparent throughout the evaluation
process.

16
Principals were keenly aware that an Unsatisfactory rating could lead to teachers losing
their jobs. Many principals saw this as an unfortunate but important responsibility, while others
were less comfortable with initiating the dismissal process. A first year high school principal
said:
The last thing I think I want do as a human being is to watch another human being
walk out with their head down; dejected, because they just lost their job because they
couldn’t do it. This is something that they wanted to do. That’s a little bit harsh, you
know?
This new principal did not want to expose teachers to the consequences of low ratings. Not
surprisingly, neither this principal nor any other said they had personally chosen to rate a teacher
as Proficient in order to avoid a challenging conversation or to shield a teacher from the threat of
dismissal. But on more than one occasion principals, such as an experience middle school
principal, stated bluntly that “People shy away from difficult conversations.” Relatedly, three
principals mentioned concerns that a disproportionate number of non-White teachers would
receive low ratings. An experienced elementary school principal told us that evaluation “became
a racial issue, and it was huge.” Some principals may have been willing to give slightly higher
ratings to those teachers on the margin to avoid the discomfort of discussing a low rating or
addressing the underlying causes of inequitable performance ratings along racial lines.
The challenges of removing and replacing teachers. Several principals mentioned that
they also sought to avoid the “long, laborious, legal, draining process” of evaluating out a
teacher. Although the evaluation reforms implemented by the district aimed to streamline the
dismissal process, it is unclear whether these principals’ perceptions were accurate or a

17
justification for not utilizing the new process. Two principals found it easier to remove teachers
outside of the evaluation process. As one principal stated frankly:
I didn't give her a negative evaluation in certain terms of then having to evaluate her out.
That would've meant that she would have to stay in my school for another year and I had
to go through the whole long process thing. She was clearly not going to work out
anyway and she was going to leave. She agreed to leave.
Here, it was more expedient for the principal to trade a Proficient evaluation for a teacher’s
voluntary departure.
Two principals expressed their hesitancy to initiate dismissals due to fear of having to
hire an even lower-quality replacement from the districts’ excess pool of tenured teachers in need
of school-site placements. A secondary school principal’s initial experience with dismissing
teachers led her to be wary of assigning low ratings:
If there’s someone who’s bad, you can evaluate them out, but you risk getting someone
who’s worse. When I first started, that happened to me twice with the same position. I
had a math teacher who was terrible, I evaluated her out, I got one actually worse.
An experienced high school principal described how she chose to rehire a low-performing
teacher:
He's a problem, but he's my problem, and he's one that I can really work with. Relative to
the problems that were ringing my doorbell, I thought, “I haven't begun to see how low it
can go.”
This principal explained that she wanted to avoid the possibility that human resources would
assign her a teacher from the excess pool at all costs. In her words, “The one you know is better
than the one you don’t.”

18
Conclusion & Policy Implications
Recent reforms to teacher evaluation systems have changed the ways in which teachers
are evaluated in U.S. public schools fundamentally. In most states, observations are more
frequent and focused on instruction, student achievement results are considered, and teachers are
rated on scales with multiple performance categories (Steinberg & Donaldson, 2016).
Importantly, these changes have increasingly focused educators’ attention on classroom
instruction. New evaluation systems, however, have not consistently resulted in greater
differentiation among teacher performance ratings. Just as TNTP found in 2009, only a “fraction
of a percentage” of teachers are rated Unsatisfactory. At the same time, significantly more
teachers are now rated in categories below Proficient than in the past.
The wide variability in teacher ratings across states suggests that system design features
as well as local norms and implementation practices play large roles in shaping ratings
distributions. Differences in underlying teacher effectiveness alone cannot account for why 1%
or fewer teachers are below Proficient in Hawaii but 28.7% are below Proficient in New Mexico,
or why only 6% of teachers in Georgia and 9% of teachers in Massachusetts are above Proficient
but 62% meet this higher standard in Tennessee. This variation across states reflects what Lipsky
(2010) characterized as the “street-level bureaucracy” of public-sector work where policies are
ultimately made by the people who implement them rather than the policymakers who design
them. Policymakers and district administrators shape the evaluation system parameters, but it is
the aggregation of individual decisions by evaluators navigating complex realities in schools that
determine the percentage of teachers rated in each performance category.
The limitations of the present study point to several areas for future research. Important
questions remain about how the design features of evaluation systems such as the performance

19
measures, choice of evaluators and training provided, weights and thresholds used to aggregate
measures and assign ratings, as well as the sanctions and rewards associated with performance
categories affect the distribution of evaluation ratings. Recent work has shown that systems that
place greater weight on normative measures such as value-added scores rather than criterion-
reference measures such as observations have fewer teachers rated proficient, all else equal
(Steinberg & Kraft, 2016). Incentives such as merit pay may limit the number of teachers who
can be rated as top performers given budget constraints.
Our data provide a snapshot in time rather than a longitudinal trend or a causal
framework for analyzing how evaluation reforms have affected the distribution of performance
ratings. While our single district case study helps to illustrate how incentives shape evaluators’
decisions at the micro level as they navigate implementation challenges, competing interests,
unintended consequences, and high-stakes decisions, it also limits the generalizability of our
findings. Evaluators’ perceptions of the true distribution of teacher performance in this district
are not necessarily reflective of state-wide distributions. Large urban districts often draw from
different labor markets and serve different student populations than non-urban districts.
Furthermore, evaluators assigned summative performance ratings based on their overall
assessment of teachers’ multiple performance measures rather than more common designs where
a weighted average of performance measures is mapped onto a summative rating category based
on pre-determined rating thresholds. Future surveys attempting to capture perceptions about the
true distribution of teacher effectiveness would benefit from examining perspectives across
multiple district contexts and, when possible, asking educators to rate individual teachers rather
than estimating the full ratings distribution.

20
There are a variety of approaches policymakers and administrators might take to address
the challenges principals described in aligning assigned ratings with their actual assessments.
With strong labor-management partnerships and sustained financial investments, districts can
reduce principals’ roles in the evaluation process by developing a new evaluator role for expert
teachers such as the Peer Assistance and Review system (Johnson et al., N.D.). When relieving
principals of responsibilities for observations is not practical or preferred, districts should focus
on reducing disincentives to assigning lower ratings. Adopting mutual consent hiring instead of
filling vacancies first through the forced placement of tenured teachers from the excess pool
would likely change principals’ calculus on whether they are likely to find a more effective
replacement for a teacher they rate as Unsatisfactory. Providing teachers rated below Proficient
with a centralized professional development support and resource center would reduce the
disincentive for principals to restrict the number of teachers they rate as low-performing because
of their limited ability to offer support. Finally, districts could invest in training for principals
focused around how to navigate difficult conversations about sub-standard performance with
individual teachers and their entire staff.
Ultimately, districts will have to grapple with their priorities for the evaluation process
and the inherent tension within a high-stakes evaluation system. Identifying teachers’
weaknesses is a key step in supporting their improvement but also brings with it the possibility of
job loss. For some teachers, a low rating may motivate them to invest in their own professional
growth or pressure them to work harder. For others, it may cause them to be less receptive to
feedback on how to improve by undercutting relational trust (Bryk & Schneider, 2002). How
districts frame the category above Unsatisfactory and below Proficient may influence the number
of teachers who receive this rating and how teachers respond to this rating. If this category

21
characterizes teachers as “Developing” and provides them with additional professional training
principals may use this category, and teachers may respond to this category, as a positive
opportunity for growth. Labeling teachers as “Needs Improvement”, a rating that may result in
additional supervision and the increased threat of dismissal, may cause teachers to respond
defensively and diminish the opportunities for development.
Moving away from the current focus on a single summative performance rating toward a
more multi-dimensional approach may also allow for principals to rate teachers who struggle in
certain areas of practice more accurately. Systems that ask, “How is a teacher effective?” rather
than “How effective is a teacher?” would recognize the full range of teachers’ strengths and
weaknesses and, in doing so, provide a more precise picture of teacher effectiveness.3

22
Endnotes
1. For principals whose responses total to within plus or minus 1 percentage point of 100 we
round up their estimates in the top ratings category to reduce data loss due to minor
computational error. Evaluation data is not available for several schools in the district that are not
required to use the district designed evaluation system.
2. The unweighted exact statistic for the average percent of teachers rated below proficient in
these schools is 6.7% in 2012/13 and 5.7% in 2014/15.
3. We thank an anonymous reviewer for the suggesting the language used in this sentence.

23
References
Almy, S. (2011). Fair to everyone: Building the balanced teacher evaluations that educators
and students deserve. Washington, DC: Education Trust.
Bryk, A., & Schneider, B. (2002). Trust in schools: A core resource for improvement. Russell
Sage Foundation.
Curtis, R., & Wiener, R. (2012). Means to an end: A guide to developing teacher evaluation
systems that support growth and development. Washington, DC: Aspen Institute.
Dee, T. S., & Wyckoff, J. (2015). Incentives, selection, and teacher performance: Evidence from
IMPACT. Journal of Policy Analysis and Management, 34, 267–297.
Donaldson, M. L. (2009). So long, Lake Wobegon?: Using teacher evaluation to raise teacher
quality. Washington, DC: Center for American Progress.
Donaldson, M. L. & Papay, J. P. (2015). Teacher evaluation for accountability and
development. In H. F. Ladd & M. E. Goertz, eds. Handbook of research in education
finance and policy. New York: Routledge.
Edwards, H. S. (2014, October 25th). The war on teacher tenure. Time Magazine.
Fullan, M. (2011). Choosing the wrong drivers for whole system reform. East
Melbourne: Centre for Strategic Education.
Glander, M. (2015). Selected statistics from the public elementary and secondary education
universe: School year 2013-14. First look. NCES 2015-151. Washington, DC: National
Center for Education Statistics.
Goldring, E., Grissom, J. A., Ruben, M., Neumerski, C. M., Cannata, M., Drake, T., &
Schuermann, P. (2015). Make room value added: Principals’ human capital decisions and
the emergence of teacher observation data. Educational Researcher, 44, 96-104.

24
Grissom, J. A., & Loeb, S. (in press). Assessing principals’ assessments: Subjective evaluations
of teacher effectiveness in low- and high-stakes environments. Education Finance and
Policy.
Grossman, P., Loeb, S., Cohen, J., & Wyckoff, J. (2013). Measure for measure: The relationship
between measures of instructional practice in middle school English language arts and
teachers’ value-added scores. American Journal of Education, 119, 445–470.
Hallinger, P., Heck, R. H., & Murphy, J. (2014). Teacher evaluation and school improvement.
An analysis of the evidence. Educational Assessment, Evaluation, and Accountability, 26,
5-28.
Hanushek, E. (2009). Teacher deselection. In D. Goldhaber & J. Hannaway (Eds.), Creating a
new teaching profession (165-180). Washington, DC: Urban Institute Press.
Harris, D. N., & Sass, T. R. (2014). Skills, productivity and the evaluation of teacher
performance. Economics of Education Review, 40, 183-204.
Honig, M. I. (2006). Street-level bureaucracy revisited: Frontline district central office
administrators as boundary spanners in education policy implementation. Educational
Evaluation and Policy Analysis, 28(4), 357-383.
Jacob, B. A., & Lefgren, L. (2008). Can principals identify effective teachers? Evidence on
subjective performance evaluation in education. Journal of Labor Economics, 26, 101–
136.
Johnson, S. M., Fiarman, S. E., Munger, M. S., Papay, J. P., Qazilbash, E. K., & Wheeler, L. (N.
D.). A user’s guide to Peer Assistance and Review. Project on the Next Generation of
Teachers. Cambridge, MA: Harvard Graduate School of Education. Retrieved from
http://www.gse.harvard.edu/~ngt/par/about/authors.html

25
Kane, T. J., McCaffrey, D. F., Miller, T., & Staiger, D. O. (2013). Have we identified effective
teachers? Validating measures of effective teaching using random assignment. MET
Project. Seattle: Bill & Melinda Gates Foundation.
Koedel, C., Li, J., & Springer, M. G. (in press). The impact of performance ratings on job
satisfaction for public school teachers. American Educational Research Journal.
Kraft, M. A., & Gilmour, A. F. (2016). Can principals promote teacher development as
evaluators? A case study of principals’ views and experiences. Educational
Administration Quarterly, 52(5), 711-753.
Lipsky, M. (2010). Street-level bureaucracy: Dilemmas of the individual in public service. 30th
Anniversary Expanded Edition. Russell Sage Foundation.
Mehta, J., & Fine, S. (2015). Bringing values back in: How purposes shape practices in coherent
school designs. Journal of Educational Change, 16(4), 483-510.
Miles, M. & Huberman, M. (1994). Qualitative data analysis: A expanded sourcebook (2nd ed.).
Thousand Oaks: Sage Publications.
Papay, J. (2012). Refocusing the debate: Assessing the purposes and tools of teacher evaluation.
Harvard Educational Review, 82(1), 123-141.
Rivkin, S. G., Hanushek, E. A., & Kain, J. F. (2005). Teachers, schools, and academic
achievement. Econometrica, 73(2), 417–458.
Rockoff, J. E. (2004). The impact of individual teachers on student achievement: Evidence from
panel data. The American Economic Review, 94(2), 247–252.
Rockoff, J. E., Staiger, D. O., Kane, T. J., & Taylor, E. S. (2012). Information and employee
evaluation: Evidence from a randomized intervention in public schools. American
Economic Review, 102, 3184-3213.

26
Spillane, J. P., & Kenney, A. W. (2012). School administration in a changing education sector:
the U.S. experience. Journal of Educational Administration, 50(5), 541-561.
Steinberg, M. P., & Donaldson, M. L. (2016). The new educational accountability:
Understanding the landscape of teacher evaluation in the post NCLB era. Education
Finance and Policy, 11(3), 340-359.
Steinberg, M. P., & Kraft, M. A. (2016). The sensitivity of teacher performance ratings to the
design of teacher evaluation systems. Working Paper.
Steinberg, M. P., & Sartain, L. (2015). Does teacher evaluation improve school
performance? Experimental evidence from Chicago’s excellence in teaching project.
Education Finance and Policy, 10(4), 535-572.
Strauss, J. & Corbin, A. (1998). Basics of qualitative research: Grounded theory procedures and
techniques. (2nd Ed.). Thousand Oaks, CA: SAGE Publications.
Taylor, E. S., & Tyler, J. H. (2013). The effect of evaluation on teacher performance.
American Economic Review, 102, 3628-3651.
Thomas, E., Wingert, P., Conant, E., & Register, S. (2010). Why we can't get rid of failing
teachers. Newsweek, 155(11), 24-27.
Toch, T., & Rothman, R. (2008). Rush to judgment: Teacher evaluation in public education.
Washington, D. C.: Education Sector.
Tucker, P. D. (1997). Lake Wobegon: Where all teachers are competent (or, have we come to
terms with the problem of incompetent teachers?). Journal of Personnel Evaluation in
Education, 11(2), 103–126.

27
U.S. Department of Education (2009). Race to The Top program executive summary.
Washington, D.C.: U.S. Department of Education. Retrieved from
http://www2.ed.gov/programs/racetothetop/executive-summary.pdf
U.S. Department of Education (2012). ESEA flexibility. Washington, D.C.: U.S. Department of
Education. Retrieved from http://www2.ed.gov/policy/elsec/guid/esea-
flexibility/index.html.
Wechsler, M., Tiffany-Morales, J., Campbell, A., Humphrey, D., Kim, D., Shields, P., & Wang,
H. (2007). The status of the teaching profession 2007. Santa Cruz, CA: The Center for
the Future of Teaching and Learning.
Weisberg, D., Sexton, S., Mulhern, J., & Keeling, D. (2009). The widget effect: Our national
failure to acknowledge and act on differences in teacher effectiveness. Washington, D.C.:
The New Teacher Project.

28
Figures
Figure 1: The percentage of teachers rated below Proficient across 24 state evaluation systems.
0.71.4 1.6 1.7 1.9 2.0 2.2 2.2 2.2 2.3 2.4 2.6
3.5 3.7 4.0 4.24.9 4.9
6.07.0
11.1 11.4 11.7
28.7
05
10
15
20
25
30
Pe
rcen
t be
low
Pro
ficie
nt
Haw
aii
Pen
nsylva
nia
New
Jer
sey
Rho
de Is
land
Del
awar
e
Geo
rgia
Indi
ana
Florid
a
Idah
o
Nor
th C
arol
ina
Michi
gan
Mar
ylan
d
Was
hing
ton
St.
Ohio
Con
necticut
Col
orad
o
Mas
sach
uset
ts
New
Yor
k
Louisian
a
Ariz
ona
Kan
sas
Tenne
ssee
Ore
gon
New
Mex
ico
Developing /Needs Improvement
Ineffective /Unsatisfactory
69
11
1519
2326
29
32 3436
3840
4244 45 46
48 4850
53
5758
62
01
02
03
04
05
06
07
0
Pe
rcen
t ab
ove
Pro
ficie
nt
Geo
rgia
Mas
sach
uset
ts
Ore
gon
Idah
o
Pen
nsylva
nia
Con
necticut
Was
hing
ton
St.
New
Mex
ico
Kan
sas
New
Jer
sey
Haw
aii
Col
orad
o
New
Yor
k
Michi
gan
Indi
ana
Mar
ylan
d
Florid
a
Ariz
ona
Louisian
a
Del
awar
e
Nor
th C
arol
ina
Rho
de Is
land
Ohio
Tenne
ssee
Highly Effective /Exemplary
Accomplished /Above Expectations

29
Figure 2: The percentage of teachers rated above Proficient across 24 state evaluation systems.
Panel A: States with four performance categories
Panel B: States with five performance categories
0 20 40 60 80 100Percent
OregonKansasArizona
LouisianaNew York
MassachusettsColorado
ConnecticutOhio
Washington St.Michigan
IndianaIdaho
FloridaGeorgia
DelawareRhode Island
New JerseyPennsylvania
Hawaii
Ineffective /Unsatisfactory
Developing /Needs Improvement
Effective /Proficient
Highly Effective /Exemplary
0 20 40 60 80 100Percent
New Mexico
Tennessee
North Carolina
Ineffective /Unsatisfactory
Developing /Needs Improvement
Effective /Proficient
Accomplished /Highly Effective
Distingished /Exemplary
30
Figure 3: The distribution of teacher evaluation ratings across states with four (Panel A) and five
(Panel B) rating categories.
Panel A: 2012/13
Panel B: 2014/15
6.4 5.6
1.4
20.718.0
5.2
61.362.8
78.4
11.613.6
15.0
02
04
06
08
0
Pe
rcen
t
Unsatisfactory Needs Improvement Proficient Exemplary
4.02.4 1.1
15.1
10.6
5.2
67.3
74.6
78.9
13.5 12.414.8
020
40
60
80
Perc
ent
Unsatisfactory Needs Improvement Proficient Exemplary
Perceived True Rating Predicted Summative Rating
Actual Summative Rating

31
Figure 4: The perceived, predicted and actual distribution of teacher evaluation ratings in
evaluators’ schools in the first (Panel A) and third (Panel B) year of a new teacher evaluation
system.
Note: Perceived true ratings are evaluators’ assessments of the actual effectiveness of all classroom teachers in their
school. Predicted ratings are evaluators’ estimates of the summative evaluation ratings teachers in their school will
receive at the end of the school year. Actual ratings are the summative evaluation ratings assigned to teachers in
their school at the end of the school year. Bars for perceived and predicted ratings represent averages across all
evaluators who had complete survey data and could be linked to school evaluation data. Bars for actual evaluation
ratings represent a weighted average of the percentage of teacher to receive a given performance evaluation rating
across the schools represented in our evaluator sample. Weights are derived based on the number of evaluators per
school that completed the survey. This approach allows for a direct comparison between evaluators’ average
perceptions and predictions to the actual performance ratings. The samples consisted of 107 evaluators in 2012/13
and 157 evaluators in 2014/15.

32
Panel A: 2012/13
Panel B: 2014/15
Figure 5: The actual distribution of formative and summative teacher evaluation ratings in
evaluators’ schools in the first (Panel A) and third (Panel B) year of a new teacher evaluation
system among all teachers who received both rating.
1.6 1.7
12.3
5.1
80.682.5
5.5
10.6
02
04
06
08
0
Pe
rcen
t
Unsatisfactory Needs Improvement Proficient Exemplary
1.0 1.9
11.9
6.8
82.1 81.5
5.0
9.7
02
04
06
08
0
Pe
rcen
t
Unsatisfactory Needs Improvement Proficient Exemplary
Actual Formative Rating Actual Summative Rating

33
Note: The distribution of summative ratings does not match in Figure 4 and Figure 5 because Figure 5 uses a
restricted sample of teachers who have both formative and summative ratings. In 2012/13 79% of teachers received
both formative and summative ratings. In 2014/15 only 58% of teachers received both ratings. See notes for Figure 4
for further details.

34
Appendix Table A1: Background Information on State Evaluation Systems
Arizona Colorado Connecticut Delaware Florida Georgia Hawaii Idaho
Year of Full Implementation 2015-2016 2015-2016 2016-2017 2012-2013 2011-2012 2014-2015 2013-2014 2013-2014
Year of Data Used 2014-2015 2014-2015 2012-2013* 2013-2014 2015-2016 2015-2016 2014-2015 2013-2014
Evaluation System Structure
district
designed w/
state criteria
statewide
/approved
alternative
statewide
/approved
alternative
statewide
district
designed w/
state criteria
statewide statewide
district
designed w/
state criteria
Race to the Top Winner Yes Yes No Yes Yes Yes Yes No
Number of Performance
Categories 4 4 4 4 4 4 4 4
% Below Proficient 7.0 4.2 5.0 1.0 2.2 2.0 0.7 2.2
% Above Proficient 48.0 95.8 23.0 48.0 97.8 6.4 35.7 15.0
% in Category 1 (bottom) 1.0 0.1 <1 0.0 0.2 0.0 0.2 0.2
% in Category 2 6.0 4.1 4.0 1.0 2.0 2.0 0.6 2.0
% in Category 3 45.0 58.1 73.0 51.0 52.0 91.5 63.5 82.8
% in Category 4 48.0 37.7 23.0 48.0 45.9 6.4 35.7 15.0
% in Category 5 (top)
Name of Category 1 (bottom) Ineffective Ineffective Below
Standard Ineffective Unsatisfactory Ineffective Unsatisfactory Unsatisfactory
Name of Category 2 Developing Partially
Effective Developing
Needs
Improvement
Developing /
Needs
Improvement
Needs
Development Marginal Basic
Name of Category 3 Effective Effective Proficient Effective Effective Proficient Effective Proficient
Name of Category 4 Highly
Effective
Highly
Effective Exemplary
Highly
Effective
Highly
Effective Exemplary
Highly
Effective Distinguished
Name of Category 5 (top)
Notes: * Represents states for which only pilot data are available. Data on evaluation system structures are from state Department of Education reports and the National
Council on Teacher Quality 2015 State Teacher Policy Yearbook. See state performance evaluation data sources below for specific sources.

35
Appendix Table A1 Continued: Background Information on State Evaluation Systems
Indiana Kansas Louisiana Maryland Massachusetts Michigan New Jersey New Mexico
Year of Full Implementation 2012-2013 2014-2015 2012-2013 2013-2014 2013-2014 2018-2019 2013-2014 2013-2014
Year of Data Used 2014-2015 2014-2015 2014-2015 2014-2015 2014-2015 2015-2016 2014-2015 2015-2016
Evaluation System Structure
district
designed w/
state criteria
statewide
/approved
alternative
statewide
/approved
alternative
statewide
/approved
alternative
statewide
/approved
alternative
district
designed w/
state criteria
district
designed w/
state criteria
district
designed w/
state criteria
Race to the Top Winner No No Yes Yes Yes No Yes No
Number of Performance Categories 4 4 4 3 4 4 4 5
% Below Proficient 2.2 11.1 7.0 2.6 4.9 2.4 1.6 28.7
% Above Proficient 44.1 32.4 48.0 44.6 8.9 41.8 33.8 28.6
% in Category 1 (bottom) 0.4 0.7 <1 2.6 0.5 0.4 0.2 5.4
% in Category 2 1.8 10.4 6.0 52.8 4.4 2.0 1.4 23.3
% in Category 3 53.7 56.5 46.0 44.6 86.2 55.8 64.6 42.7
% in Category 4 44.1 32.4 48.0 8.9 41.8 33.8 24.8
% in Category 5 (top) 3.8
Name of Category 1 (bottom) Ineffective Ineffective Ineffective Ineffective Unsatisfactory Ineffective Ineffective Ineffective
Name of Category 2 Improvement
Necessary Developing
Effective:
Emerging Effective
Needs
Improvement
Minimally
Effective
Partially
Effective
Minimally
Effective
Name of Category 3 Effective Effective Effective:
Proficient
Highly
Effective Proficient Effective Effective Effective
Name of Category 4 Highly
Effective
Highly
Effective
Highly
Effective Exemplary
Highly
Effective
Highly
Effective
Highly
Effective
Name of Category 5 (top) Exemplary
Notes: * Represents states for which only pilot data are available. Data on evaluation system structures are from state Department of Education reports and the National
Council on Teacher Quality 2015 State Teacher Policy Yearbook. See state performance evaluation data sources below for specific sources.

36
Appendix Table A1 Continued: Background Information on State Evaluation Systems
New York
North
Carolina Ohio Oregon Pennsylvania Rhode Island Tennessee Washington
Year of Full Implementation 2012-2013 2011-2012 2015-2016 2015-2016 2013-2014 2012-2013 2011-2012 2015-2016
Year of Data Used 2013-2014 2014-2015 2015-2016 2014-2015 2013-2014˜ 2013-2014 2014-2015 2014-2015*
Evaluation System Structure
district
designed w/
state criteria
statewide
/approved
alternative
statewide
/approved
alternative
district
designed w/
state criteria
statewide
/approved
alternative
statewide
/approved
alternative
statewide
/approved
alternative
statewide
Race to the Top Winner Yes Yes Yes No Yes Yes Yes No
Number of Performance Categories 4 5 4 44 4 4 5 4
% Below Proficient 5.0 2.8 3.7 11.7 1.4 1.7 11.4 3.5
% Above Proficient 39.8 52.8 58.1 10.8 18.6 56.6 62.2 26.2
% in Category 1 (bottom) 0.8 0.5 0.1 0.6 0.2 0.4 0.7 0.2
% in Category 2 4.2 2.3 3.6 11.1 1.2 1.3 10.7 3.3
% in Category 3 55.3 44.9 38.2 77.6 80.0 41.7 26.4 70.3
% in Category 4 39.8 45.0 58.1 10.8 18.6 56.6 34.0 26.2
% in Category 5 (top) 7.7 28.2
Name of Category 1 (bottom) Ineffective Not
Demonstrated Ineffective Level 1 Failing Ineffective
Sig. Below
Expectations Unsatisfactory
Name of Category 2 Developing Developing Developing Level 2 Needs
Improvement Developing
Below
Expectations Basic
Name of Category 3 Effective Proficient Skilled Level 3 Proficient Effective At
expectations Proficient
Name of Category 4 Highly
Effective Accomplished Accomplished Level 4 Distinguished
Highly
Effective
Above
Expectations Distinguished
Name of Category 5 (top) Distinguished Sig. Above
Expectations
Notes: * Represents states for which only pilot data are available. ˜ indicates data were calculated with incomplete information. Data on evaluation system structures are
from state Department of Education reports and the National Council on Teacher Quality 2015 State Teacher Policy Yearbook. See state performance evaluation data sources
below for specific sources.

Appendix A
State Performance Evaluation Data Sources
Arizona
Received information from Warren Shillingburg, Education Program Specialist, through
personal email correspondence on May 5, 2016. Information not publicly available.
Colorado
Colorado DOE. (2017). Schoolview Data Center. Staff -> Teachers -> Effectiveness. Retrieved
from
https://edx.cde.state.co.us/SchoolView/DataCenter/reports.jspx?_afrWindowMode=0&_afrLoop
=551892207474223&_adf.ctrl-state=5tgtksgm5_4
Connecticut
Connecticut DOE. (2015). 2015 SEED Handbook: Connecticut’s System for Educator
Evaluation and Development. Retrieved from http://www.connecticutseed.org/wp-
content/uploads/2015/11/2015_SEED_Handbook_11_24_15.pdf
Donaldson, M., Cobb, C., LeChausseur, K., Gabriel, R., Gonzales, R., Woulfin, S., &
Makuch, A. (2014, January 1). An Evaluation of the Pilot Implementation of Connecticut's
System of Educator Evaluation and Development. University Of Connecticut Center for
Education Policy Analysis, Neag School of Education. Retrieved from
http://www.connecticutseed.org/wp-content/uploads/2014/01/Neag_Final_SEED_Report_1-1-2014.pdf
Delaware
Received information from Lauren Schneider, Director of Educator Effectiveness, through
personal email correspondence on Dec 15, 2016. Information not publicly available.
Florida
Florida DOE. (n.d.). Personnel Evaluation. 1. Retrieved from
http://www.fldoe.org/teaching/performance-evaluation/
Georgia
Received information from Michele Purvis, Program Manager, through personal email
correspondence on Dec 16, 2016. Information not publicly available.
Hawaii
Hawaii DOE. (2015). Educator Effectiveness System Manual. Retrieved from
http://www.hawaiipublicschools.org/DOE%20Forms/Educator%20Effectivness/EESManual.pdf
Kalani, N. (2015, October 26). Teachers’ Evaluation Grade. Star Advertiser. Retrieved from
http://www.pressreader.com/usa/honolulu-star-
advertiser/20151026/282621736573997/TextView.
38
US DOE. (2015, April). Race to the Top: Hawaii Report Year 4: 2013-2014. Retrieved from
http://www2.ed.gov/programs/racetothetop/phase1-report/hirttyrrpt42015.pdf.
Idaho
Corbin, C. (2015, June 12). Teachers Got Identical Evaluations Across 32 Idaho Districts,
Complicating Career Ladder Pay Plan. Idaho Statesman. Retrieved from
http://www.idahostatesman.com/2015/06/12/3848480/teachers-got-identical-evaluations.html.
Indiana
Ritz, G. (n.d.). Staff Performance Evaluation Results 2014-2015. Indiana Department of
Education. Retrieved from http://www.doe.in.gov/sites/default/files/evaluations/2014-15-er-data-
presentation-sboe.pdf
● Note: The original data presented in the DOE report included distribution percentages that
included all teachers, not just ones who were evaluated. 8.64% of the teachers were not
evaluated. Data in our study was adjusted to only include teachers who were evaluated.
Kansas
Received information from Sarah Vanderpool, Data Compliance Officer, through personal
email correspondence and data request on July 7, 2016. Information not publicly available.
Note: Districts across Kansas use different evaluation systems with 3, 4 and 5 rating
categories. The majority of districts use the four-category rating system we report. We
combined the top 2 rating categories in systems with 5 rating categories.
Louisiana
Louisiana DOE. (2015). 2014-2015 Compass Teacher Results by LEA [Data file]. Retrieved
from https://www.louisianabelieves.com/resources/library/compass.
Note: These data are available if you download the spreadsheet called “2014-2015
Compass Teacher Results by LEA” Under headline “2014-2015 Compass Reports” from
the link above.
Maryland
Smith, J.R. (2015, October 27). Teacher and Principal Evaluation Data: Effectiveness Rating
from SY 2014-2015. Retrieved from
http://www.marylandpublicschools.org/stateboard/boardagenda/10272015/Tabs-F1-F2-
TeacherPrincipalEvaluationReportUpdate.pdf.
Note: This document is no longer available but can be access through the internet
archives (.http://web.archive.org)
Massachusetts
Massachusetts Department of Elementary of Secondary Education. (2015). 2014-15 Educator
Evaluation Performance [Data File]. Retrieved from
http://profiles.doe.mass.edu/state_report/educatorevaluationperformance.aspx.
● Note: Under “Report Type” tab, select District. Under “Year” tab, select 2014-2015.
Under “Group Type” tab, select Teachers.

39
Michigan
Michigan DOE. (2016). Educator Effectiveness Snapshot Statewide: 2015-2016/Teachers [Data
File]. Retrieved from
https://www.mischooldata.org/DistrictSchoolProfiles/StaffingInformation/NewEducatorEffectiveness/EducatorEffectiveness.aspx.
New Jersey
New Jersey DOE. (2016). 2014 - 2015 Final Educator Evaluation Implementation Report.
Retrieved from
http://www.nj.gov/education/AchieveNJ/resources/201415AchieveNJImplementationReport.pdf
New Mexico
New Mexico Public Education Department. (2016). 2016 Teacher Evaluation Release. Retrieved
from http://ped.state.nm.us/ped/NMTeachDocs/Toolbox/2015-2016_NMTEACH_Briefing.pdf .
New York
New York State Education Department. (2015). Teacher Evaluation Database (Data File).
Retrieved from http://data.nysed.gov/downloads.php.
● Note: Data accessed is titled “Teacher Evaluation Database.” The percentage distribution was
calculated using the number of teachers in each rating category over the total number of
teachers in the downloaded dataset.
North Carolina
North Carolina Department of Public Instruction. (n.d.). North Carolina Teacher Effectiveness
Data for the 2014-2015 School Year (Data File). Retrieved from http://apps.schools.nc.gov/pls/apex/f?p=155:5:1396130035911001::::P5_YEAR:2014-15%20School%20Year
● Note: Evaluation ratings are presented in five standards, data in our study is taken as an
average of percent scores for each of the five standards.
Ohio
Received information from Maxwell Hennon, Data Manager, through personal email
correspondence on December 30, 2016. Information not publicly available.
● Note: The original data presented in the DOE report included distribution percentages that
included all teachers, not just ones who were evaluated. 2.56% of the teachers were not
evaluated. Data in our study was adjusted to only include teachers who were evaluated.
Oregon
Received information from Tim Boyd, Director of District and School Effectiveness, through
personal email correspondence on May 2, 2016. Information not publicly available.
Pennsylvania

40
Chute, E. (2015, June 15). How Qualified are Pennsylvania’s Teachers? The Numbers Say
Extremely. Pittsburgh Post-Gazette. Retrieved from http://www.post-
gazette.com/news/education/2015/06/15/New-rating-system-finds-nearly-all-Pennsylvania-
teachers-are-qualified/stories/201506080003.
● Note: Data is for the 2013-2014 SY and may not be exact due to inconsistent reporting of
percentage teachers in a category versus number of teachers in a category. The data in our
spreadsheet is an estimation based on the information reported in this article.
Rhode Island
Rhode Island DOE. (2014, October). RI Educator Evaluation Systems: Improving Teaching and
Learning. Retrieved from http://www.ride.ri.gov/Portals/0/Uploads/Documents/Teachers-and-
Administrators-Excellent-Educators/Educator-Evaluation/Education-Eval-Main-
Page/FER_Year2_Report_Final.pdf.
Tennessee
Received information from Laura Booker through personal email correspondence on April 15,
2016. Information not publicly available.
Washington Weber, G. (2016, June 14). Examination of the School Employee Evaluation Survey. American
Institutes for Research. 6. Retrieved from
http://www.k12.wa.us/TPEP/pubdocs/AIR_Analysis_2014-15_SEES_Data.pdf.
Target States for Which Data Were not Available
Alaska
The state of Alaska does not collect or aggregate teacher evaluation data.
Arkansas
Arkansas is in the process of collecting data, so it is not yet publicly available.
Illinois
Illinois is in the process of collecting data, so it is not yet publicly available.
Iowa
The state of Iowa does not collect or aggregate teacher evaluation data.
Maine
The state of Maine has not yet collected teacher evaluation data.
Minnesota
The state of Minnesota does not collect or aggregate teacher evaluation data.
Missouri

41
In Missouri, teacher evaluation systems are a local decision and while the data is collected by the
state, it is not aggregated. The state has information on how many performance levels each
district has and the percentage of teachers rated in each category, but the cut off score for
proficiency is up to the district.
North Dakota
The state of North Dakota does not collect or aggregate teacher evaluation data.
South Dakota
The state of South Dakota does not collect or aggregate teacher evaluation data.
Utah
The state of Utah does not collect or aggregate teacher evaluation data.
Virginia
In Virginia, information is available at the district level for certain school years but is not
aggregated to the state level.
West Virginia
While West Virginia does collect data on teacher evaluation scores from each district, the state
has not yet consolidated the data on a statewide level. They are in the process of developing a
dashboard to collect teacher evaluation information on a statewide level that is not ready for
release.
Wisconsin
The state of Wisconsin does not collect or aggregate teacher evaluation data.

42
Appendix B
Evaluator Survey Items
1) In your opinion, what percent of teachers at your school perform at an Unsatisfactory,
Needs Improvement, Proficient, or Exemplary level as defined by the XXXX rubric?
Your total must add up to 100%.
Unsatisfactory ____%
Needs Improvement ____%
Proficient ____ %
Exemplary ____%
Total 100%
Note: The name of the evaluation system is redacted to maintain the confidentiality of the
district.
2) Based on your best guess, what percent of teachers at your school will receive
summative performance ratings of Unsatisfactory, Needs Improvement, Proficient, or
Exemplary at the end of the academic year? Your total must add up to 100%.
Unsatisfactory ____%
Needs Improvement ____%
Proficient ____ %
Exemplary ____%
Total 100%