revisiting the inflation perception conundrum · 2019-12-12 · expected levels of inflation (lein...
TRANSCRIPT

1
Revisiting the inflation perception conundrum
Kim Abildgren
DANMARKS NATIONALBANK
Andreas Kuchler
DANMARKS NATIONALBANK
The Working Papers of Danmarks Nationalbank describe research
and development, often still ongoing, as a contribution to the
professional debate.
The viewpoints and conclusions stated in this paper are the
responsibility of the individual contributors, and do not necessarily
reflect the views of Danmarks Nationalbank.
4 N O V E M B ER 20 19 — N O . 14 4
2
Abstract
Several studies have found that the levels of inflation
perceived by households persistently exceed observed
inflation levels measured by official Consumer Price
Indices. In this paper, we revisit the issue based on rich
and previously unexplored household-level data from
the Danish part of the EU-Harmonised Consumer
Expectations Survey (CES) linked to microdata from
Danish administrative registers. We find that
accounting for even several of the factors usually put
forward to explain the overestimation bias can only
reduce it slightly. Food prices seem to carry a larger
weight in perceived inflation than in the official CPI,
and we find clear seasonal effects in the inflation
perception bias. The bias is also reflected in the
households' expectations of the future inflation level.
One should therefore not use the levels of survey-
based inflation expectations from the CES in empirical
works. We find a much smaller bias in the expectations
regarding future changes in inflation rates.
Implementing some form of guidance on the current
or typical rate of inflation in the survey questions
might reduce the bias. However, the bias might also
indicate a more general need for enhanced
communication by monetary authorities and statistical
agencies regarding the rather abstract concept of
"inflation".
Resume
Flere studier har vist, at husholdningerne konsekvent
overvurderer inflationen sammenholdt med det
faktiske inflationsniveau målt ved officielle
forbrugerprisindeks. I dette arbejdspapir analyserer vi
problemstillingen på grundlag af detaljerede
mikrodata fra den danske del af den EU-
harmoniserede forbrugerforventningsundersøgelse
samkørt med oplysninger fra administrative registre.
Nogle typer af personer overvurderer inflationen mere
end andre, men der er generelt tale om et meget
udbredt fænomen. Det er ikke muligt at pege på én
husstandstype, hvor der ikke er en betydelig
gennemsnitlig forskel mellem opfattet og faktisk
inflationsniveau. Fødevarepriserne har en større vægt i
den opfattede inflation end i det officielle
forbrugerprisindeks, og der er tydelige sæsonudsving
i overvurderingen af inflationsniveauet. Tendensen til
at overvurdere inflationen genfindes i
husholdningernes inflationsforventninger. Man bør
derfor ikke anvende niveauet for
inflationsforventninger fra den EU-harmoniserede
forbrugerforventningsundersøgelse i empiriske
analyser. Vi finder en langt højere grad af præcision,
når vi ser på husholdningernes forventninger til
ændringer i inflationen. Graden af overvurdering af
inflationen kan muligvis reduceres, hvis
interviewpersonerne vejledes om det nuværende eller
typiske inflationsniveau. Den betydelige forskel mellem
opfattet og faktisk inflation kan dog også være tegn
på, at der er et behov for mere information fra
statistikbureauer og centralbanker om inflation, som
er et forholdsvis abstrakt begreb.
Revisiting the inflation perception conundrum
Acknowledgements
We gratefully acknowledge comments by
participants at conferences and seminars in Norges
Bank and Statistics Denmark, as well as colleagues
from Danmarks Nationalbank. The authors alone
are responsible for any remaining errors.
Key words
Inflation perceptions; Inflation expectations; Micro
data.
JEL classification
D12; E31.
W O R K I N G P A P E R — D A N M AR K S N A T IO N A L B A N K
4 N O V E M B ER 20 19 — N O . 14 4

3
1. Introduction
Nothing is probably more important for monetary and macroeconomic stability than well-anchored
inflation expectations. Inflation expectations are a crucial determinant of actual inflation, and
heterogeneity in inflation expectations might matter to the monetary-policy transmission
(Woodford, 2003; Falck, Hoffmann and Hürtgen, 2019). Information on consumers' inflation
perceptions and expectations is therefore of huge interest for central banks and monetary
authorities.
In the first part of 2019, the European Commission began to publish data on a regular basis on
consumers' quantitative estimates of past and expected inflation as part of the EU-Harmonised
Consumer Expectations Survey, cf. European Commission (2019). The data show that the levels of
inflation perceived by European households persistently exceed the actual observed inflation levels
measured by the official Harmonised Index of Consumer Prices (HICP), cf. Figure 1. For the Euro
area, the actual year-over-year inflation rate was 1.5 per cent in the third quarter of 2019 whereas
consumers on average perceived inflation to be 7.2 per cent.
Actual and perceived inflation, EU Figure 1
Notes: Perceived inflation is represented by the mean. Data is for
EU28.
Source: Actual inflation (HICP): Eurostat. Perceived inflation: European
Commission.
This overestimation bias raises a number of issues of relevance for central banks and other policy
makers. Do the households' overestimations of the actual inflation level reflect that they have
another price concept than the Consumer Price Index (CPI) in mind when interviewed about
inflation? Is the estimation bias a result of the phrasing of the survey questionnaire or lack of
cognitive abilities and mathematical literacy to grasp the rather abstract concepts of "inflation" and
"price increases" measured in per cent (Bruin et al., 2012; Lusardi and Mitchell, 2014; D'Acunto,
2019)? The degree of heterogeneity is also important – is overestimation bias a general
phenomenon for all types of households or is the estimation error particularly large for some types
of households?
-2
0
2
4
6
8
10
12
14
16
18
Actual inflation (HICP) Perceived inflation
Per cent, year-over-year
07 08 09 10 11 12 13 14 15 16 17 18 19
4
A deeper understanding of this "inflation perception conundrum" is important for several
reasons. To utilize survey results on household inflation expectations, it is important to understand
the price concept used by the households and/or any potential biases in the perceived and
expected levels of inflation (Lein and Maag, 2011). Furthermore, the overestimation bias might
indicate a need for an enhanced communication effort from the monetary authorities as well as
statistical agencies regarding the concept of inflation, at least vis-à-vis certain segments of the
household sector. If the price concept in focus among households mainly consists of prices of
frequent purchases such as food, there might be an extra challenge for central banks that focus on
core inflation concepts such as CPI excluding (unprocessed) food and energy in their
communication activities. Last, but not least, inflation perceptions and expectations are of key
importance for households' consumption, investment and savings decisions.
Unpublished data on quantitative inflation perception and expectations from the EU-Harmonised
Consumer Expectations Survey have been studied by Lindén (2005), Biau et al. (2010), European
Commission (2014) and Arioli et al. (2016, 2017). In this paper we use a rich and previously
unexplored Danish household-level dataset to revisit the issue of overestimation bias in inflation
perceptions and expectations. The dataset is based on the Danish part of the EU-harmonised
Consumer Expectations Survey merged with household-level information from a wide range of
Danish administrative registers. The dataset allows us to explore many of the drivers of the inflation
perception and expectation biases usually put forward in existing literature as well as new factors
and dimensions not previously analyzed due to data limitations.
Previous research has indicated that part of the overestimation bias reflects that households pay
most attention to the price development on frequent out of pocket purchases (FROOPP) such as
food, alcohol, tobacco, certain transport items, hotels and restaurants, etc. (Brachinger, 2008;
Georganas et al., 2014; Binder, 2018, D'Acunto et al., 2019). However, Arioli et al. (2016, 2017) note
that even though FROOPP inflation has tended to be higher than the general CPI inflation in Europe
during the most recent decades, it can only explain part of the gap between perceived and actual
inflation.
Earlier research also suggests that the overestimation bias in the European inflation perception
surveys might be partly related to the use of open-ended questions (no range of suggested
inflation rates offered to the survey participants as is the case in Bank of England's survey of
inflation attitudes or the Japanese Intage Survey) and a lack of probing of unusual replies (as is the
case in the University of Michigan survey of US consumer attitudes), cf. Biau et al. (2010), Arioli et
al. (2016, 2017), European Commission (2019) and Diamondy et al. (2019). The overestimation bias
might also partly reflect that households fail to properly adjust for quality changes when reporting
their inflation perception or do not adjust for quality changes in the same way as the national
statistical institutes do when compiling CPI statistics (Bosworth et al., 1997; Arioli et al., 2016, 2017).
Households could also pay more attention to price increases than price decreases, and periodic
5
sales might play a role in this context. In addition, more attention could be given to large than
small price changes and to frequent rather than rare price changes (Huber, 2011; Armantier et al.,
2013; Stanislawska, 2019).
Furthermore, existing research emphasizes the high degree of cross-household heterogeneity in
the European survey results. Arioli et al. (2016, 2017) find that inflation perceptions tend to be
lower for males, high income earners and highly educated individuals. Similar results have been
found earlier for Sweden (Jonung, 1981; Palmqvist and Strömberg, 2004) and the US (Bryan and
Venkatu, 2001a, 2001b). Moreover, the difference in inflation perception between men and women
in the US seems not to be the result of men and women having different consumption bundles
(Bryan and Venkatu, 2001b). Studies have also shown that inflation perception errors are highly
autocorrelated at a household level (Jonung and Laidler, 1988) and that households' inflation
expectations are related to news about inflation, which could also influence perceptions regarding
historical inflation (Badarinza and Buchmann, 2009; Lamla and Lein, 2015; Ehrmann et al., 2017). In
addition, the level of inflation experienced through an individual's life-time has been shown to
influence inflation expectations (Malmendier and Nagel, 2016; Goldfayn-Frank and Wohlfart, 2019).
Finally, several studies have uncovered a substantial cross-country heterogeneity regarding the
size of the overestimation gap in inflation perceptions and expectations (Arioli et al., 2016, 2017;
Lamlaz, Pfajfar and Rendell, 2019; Lyziak, Paloviita and Stanislawska, 2019). The gap is, in general,
significantly lower in the Nordic countries than in Southern and Eastern Europe.
The analysis in the paper at hand confirms the importance for the size of the overestimation bias
in inflation perceptions of a range of well-established factors such as income, age, education and
gender as well as the degree of pessimism in the respondents' answers to other survey questions.
We also confirm that part of the bias reflects that the respondents may have another price concept
in mind (food prices) rather than consumer prices in general when interviewed about the level of
inflation. This issue is especially of importance in periods where food price inflation deviates
markedly from the general CPI inflation.
Our rich dataset also allows us to explore the relation between overestimation bias in inflation
perceptions and a range of other variables usually not addressed in earlier literature. We find e.g.
that households with large overestimation biases in general are characterised by lower net wealth-
to-income ratios, higher loan-to-value ratios, higher consumption-to-income ratios, lower holdings
of stocks and mutual fund shares, higher employment shares within the public sector and lower
employment shares within private business service and finance. We also find clear seasonality in
the perception of inflation. Respondents on average perceive the level of inflation to be almost 1
percentage point higher in July than in February.
In addition, we use the time series dimension of our microdataset to explore the significance of
overpessimism for the inflation perception bias. This has not previously been examined in the
literature. We find that overpessimistic households – defined as households who are pessimistic

6
about their own future financial situation and who (in spite of their pessimism) experience an
increase in real household income over a 3-year period following the interview – have a
significantly larger perception bias than other households. This indicates that the inflation
perception bias is related to fundamental personality traits. This conclusion is further underlined by
our finding that respondents participating in the survey more than once tend to be persistent in
their degree of perception bias.
Due to our ability to link the survey responses to administrative registers on family relations, we
can also explore the link between inflation perception bias and the economic situation of the
respondent as well as the economic situation of other members of the respondent's household. We
find that households with unemployed adult members are overrepresented in the group of
households with large inflation perception biases. Other events such as change of address or family
increases by children seem of less importance.
However, accounting for even several of the above mentioned factors simultaneously is far from
sufficient to explain the inflation perception bias. This underlines the broad-based nature of the
bias.
We find a strong correlation between inflation perception and inflation expectation at a
household level. Furthermore, there seems on average to be a very small bias when comparing the
households' expectations regarding future change in inflation on a 1-year horizon with the ex post
realized change in inflation over the same period. These findings suggest that one should use the
expected change in inflation – rather than the expected level of inflation – in empirical works.
In addition, an assessment of the anchoring of inflation expectations in the household sector
based on the survey data from the Consumer Expectations Survey should not be based on inflation
expectations in levels but rather on expectations regarding future changes in inflation. We find that
if inflation has recently increased, households expect this trend to reverse in the future, and if
inflation has recently decreased, households to a larger degree than in other periods expect that
inflation will increase in the future. This mean reversion indicates that households' inflation
expectations are well-anchored. To the best of our knowledge, this issue has not previously been
explored in the literature.
However, even when expected changes in inflation are considered, there are still substantial
outliers that need to be addressed, and changes to the survey design might be a way forward in
this area. Our empirical analysis shows that households with a relatively accurate perception of the
current level of inflation do not overestimate future inflation to the same extent as households with
less accurate perceptions of current inflation. This suggests that knowledge of current inflation is
important for the accuracy of expectations regarding future inflation. Implementing some form of
guidance on the current or typical rate of inflation in survey questions might therefore reduce the
widely observed positive bias in inflation expectations.

7
2. Data
The core part of our dataset consists of microdata on inflation perception and inflation
expectations collected by Statistics Denmark as part of the monthly Danish Consumer Expectations
Survey. The survey follows guidelines laid out by the European Commission in the Harmonised EU
Programme of Business and Consumer Surveys. Each month, a sample of around 1,500
representative persons aged 16-74 are selected to participate in an interview, and the average
participation rate is around 67 per cent (Statistics Denmark, 2016a). Our dataset covers the period
2007m8-2016m12. Households are asked about e.g. their inflation perception in a two-step
procedure. First, they are asked a qualitative question: "How do you think that prices are today
compared to one year ago?". The possible answers are "Much higher", "Somewhat higher", "A little
higher", "Unchanged", and "A little lower". Second, conditional on not having answered
"Unchanged", respondents are asked a quantitative question: "By how many per cent do think that
prices have gone up/down over the past 12 months?". We assign a value of 0 per cent to
households that have answered "Unchanged" to the first question. Furthermore, for the calculation
of mean inflation perception figures we discard responses larger than 50 per cent and smaller than
-50 per cent. Similar questions are asked about inflation expectations over the coming 12 months,
and the same approach is used to obtain a quantitative measure of inflation expectations for all
respondents.
Statistics Denmark knows the identity of the individuals interviewed in the Consumer
Expectations Survey and is therefore able to link the survey results to a large range of
administrative registers, for instance the Tax Register with information on household-level income,
taxes, assets and debts, the Population and Family Registers with information on age, area of
residence and family relations, the Property Register with information on public valuation and sales
prices on real estate, the Education Register with information on education, the Labour Market
Register with information on employment status, etc. As a result, we have access to a unique and
very rich household-level dataset on inflation perception and inflation expectations, cf. Figure 2.

8
We also make use of the official CPI statistics as well as household-group-specific consumer price
indices compiled by Statistics Denmark for around 20 different groups of households, cf. Statistics
Denmark (2016b) and Larsen (2016). The price series behind the household-group-specific
consumer price indices comes from the official CPI whereas the weights are specific for each
household group and are based on the household-group-specific expenditure pattern according to
the household budget survey.
3. Explorative analysis of inflation perceptions based on household-group-level data
To get an overview of the dataset, we begin by exploring inflation perceptions at a household-
group level. We compile unweighted averages of inflation perceptions on a monthly basis for the
18 household groups shown in Table 1. These household groups are used in the household budget
survey as well as for the household-group-specific inflation rates published by Statistics Denmark.
Figure 3 (left) shows the actual inflation level in Denmark over the past decade measured by the
official CPI and the mean perceived inflation level across all households. Over most of the period,
perceived inflation has been substantially higher than actual inflation. This has been the case for all
groups of households, cf. Figure 3 (right).
The micro data set Figure 2

9
Table 1: Household groups
No. Household type No. Household type
1 Single persons under 60 years without children. 10 Employees - basic level. 2 Single persons over 60 years without children. 11 Receiving education. 3 Single persons with children. 12 Pensioners and early retirement. 4 2 adults without children, household head under 60
years. 13 Other not economically active (excl.
unemployed). 5 2 adults without children, household head over 60
years. 14 Income under 150,000 DKK.
6 2 adults with children. 15 Income 150,000-299,999 DKK. 7 Self-employed. 16 Income 300,000-499,999 DKK. 8 Employees - upper level. 17 Income 500,000-799,999 DKK. 9 Employees - medium level. 18 Income 800,000 DKK or over. Notes: The household groups are not mutually exclusive.
Actual inflation (official CPI) and perceived inflation Figure 3
Notes: All households: unweighted average. The 18 household groups are defined in Table 1.
Source: Official CPI: StatBank Denmark. Perceived inflation: Own compilations based on trimmed microdata from Statistics Denmark on the results
from the monthly interviews to the Danish Consumer Expectations Survey.
A number of empirical studies based on household-level microdata have documented significant
short-run heterogeneity in the actual price development experienced by households with different
consumption bundles (Michael, 1979; Hagemann, 1982; Hobijn and Lagakos, 2005; Cepparulo et
al., 2012). However, the differences tend to be very limited in the medium term or longer run, and
the use of household-group-specific CPIs as indicators for the actual inflation developments does
not reduce the "inflation perception conundrum" in any significant way, cf. Figures 4 and 5.
-2
0
2
4
6
8
10
12
20
07
20
08
20
09
20
10
20
11
20
12
20
13
20
14
20
15
20
16
Actual inflation (official CPI) Perceived inflation
Per cent, year-over-year
-2
0
2
4
6
8
10
1220
07
20
08
20
09
20
10
20
11
20
12
20
13
20
14
20
15
20
16
Actual (official CPI) Perceived, lower decile
Perceived, median Perceived, upper decile
Per cent, year-over-year

10
Distribution of household-group-specific inflation across household groups
Figure 4
Notes: The 18 household groups are defined in Table 1. Own
compilations based on StatBank Denmark.
Actual inflation (household-group-specific CPI) and perceived inflation by household group Figure 5
Source: Household-group-specific CPI: StatBank Denmark. Perceived inflation: Own compilations based on trimmed microdata from Statistics Denmark.
-1
0
1
2
3
4
5
20
07
20
08
20
09
20
10
20
11
20
12
20
13
20
14
20
15
20
16
Lower decile Median Upper decile
Per cent, year-over-year
-5
0
5
10
15
200
7
200
8
200
9
201
0
201
1
201
2
201
3
201
4
201
5
201
6
Actual inflation (household-group-specific)
Perceived inflation
Per cent, year-over-year
Single persons under 60 years without children
-5
0
5
10
15
200
7
200
8
200
9
201
0
201
1
201
2
201
3
201
4
201
5
201
6
Actual inflation (household-group-specific)
Perceived inflation
Per cent, year-over-year
Single persons over 60 years without children
-5
0
5
10
15
200
7
200
8
200
9
201
0
201
1
201
2
201
3
201
4
201
5
201
6
Actual inflation (household-group-specific)
Perceived inflation
Per cent, year-over-year
Single persons with children
-5
0
5
10
15
200
7
200
8
200
9
201
0
201
1
201
2
201
3
201
4
201
5
201
6
Actual inflation (household-group-specific)
Perceived inflation
Per cent, year-over-year2 adults without children, household head under 60 years
60 years
-5
0
5
10
15
200
7
200
8
200
9
201
0
201
1
201
2
201
3
201
4
201
5
201
6
Actual inflation (household-group-specific)
Perceived inflation
Per cent, year-over-year
2 adults without children, household head over 60 years
-5
0
5
10
15
200
7
200
8
200
9
201
0
201
1
201
2
201
3
201
4
201
5
201
6
Actual inflation (household-group-specific)
Perceived inflation
Per cent, year-over-year
2 adults with children
-5
0
5
10
15
200
7
200
8
200
9
201
0
201
1
201
2
201
3
201
4
201
5
201
6
Actual inflation (household-group-specific)
Perceived inflation
Per cent, year-over-year
Self-employed
-5
0
5
10
15
200
7
200
8
200
9
201
0
201
1
201
2
201
3
201
4
201
5
201
6
Actual inflation (household-group-specific)
Perceived inflation
Per cent, year-over-year
Employees - upper level
-5
0
5
10
15
200
7
200
8
200
9
201
0
201
1
201
2
201
3
201
4
201
5
201
6
Actual inflation (household-group-specific)
Perceived inflation
Per cent, year-over-year
Employees - medium level
-5
0
5
10
15
200
7
200
8
200
9
201
0
201
1
201
2
201
3
201
4
201
5
201
6
Actual inflation (household-group-specific)
Perceived inflation
Per cent, year-over-year
Employees - basic level
-5
0
5
10
15
200
7
200
8
200
9
201
0
201
1
201
2
201
3
201
4
201
5
201
6
Actual inflation (household-group-specific)
Perceived inflation
Per cent, year-over-year
Receiving education
-5
0
5
10
15
200
7
200
8
200
9
201
0
201
1
201
2
201
3
201
4
201
5
201
6Actual inflation (household-group-specific)
Perceived inflation
Per cent, year-over-year
Pensioners and early retirement
-5
0
5
10
15
200
7
200
8
200
9
201
0
201
1
201
2
201
3
201
4
201
5
201
6
Actual inflation (household-group-specific)
Perceived inflation
Per cent, year-over-year
Other not economically active (excl. unemployed)
-5
0
5
10
15
200
7
200
8
200
9
201
0
201
1
201
2
201
3
201
4
201
5
201
6
Actual inflation (household-group-specific)
Perceived inflation
Per cent, year-over-year
Income under 150,000 DKK
-5
0
5
10
15
200
7
200
8
200
9
201
0
201
1
201
2
201
3
201
4
201
5
201
6
Actual inflation (household-group-specific)
Perceived inflation
Per cent, year-over-year
Income 150,000-299,999 DKK
-5
0
5
10
15
200
7
200
8
200
9
201
0
201
1
201
2
201
3
201
4
201
5
201
6
Actual inflation (household-group-specific)
Perceived inflation
Per cent, year-over-year
Income 300,000-499,999 DKK
-5
0
5
10
15
200
7
200
8
200
9
201
0
201
1
201
2
201
3
201
4
201
5
201
6
Actual inflation (household-group-specific)
Perceived inflation
Per cent, year-over-year
Income 500,000-799,999 DKK
-5
0
5
10
15
200
7
200
8
200
9
201
0
201
1
201
2
201
3
201
4
201
5
201
6
Actual inflation (household-group-specific)
Perceived inflation
Per cent, year-over-year
Income 800,000 DKK or over

11
Figure 6 compares the perceived inflation level (total CPI) across all households with the actual
inflation level for the main subcomponents of the official CPI. It can be noticed that the perceived
inflation (total CPI) is higher than the actual price development for most subgroups of the CPI.
Furthermore, there seems to be a fairly close correlation between perceived inflation (total CPI)
and the development in food prices.
Actual inflation (sub-components of official CPI) and perceived inflation (total CPI) across all households
Figure 6
Notes: The spike in the growth of the subindex for restaurants and hotels in the official CPI in 2016 reflects mainly that an index for the rent of holiday
homes was included in the index.
Source: Official CPI: StatBank Denmark. Perceived inflation: Own compilations based on trimmed microdata from Statistics Denmark.
Food is a key component of the so-called "frequent out of pocket purchases" (FROOPP) special
aggregate of the Harmonised Index of Consumer Prices (HICP) developed by Eurostat, cf. Mile
(2009) and Eurostat (2017). The items included in FROOPP as defined by Eurostat are shown in
Table 2. In Figure 7 we have calculated a subindex of the Danish CPI that covers all non-food
FROOPP items such as alcohol, tobacco, certain transport items, hotels and restaurants, etc.
During a large part of the period since mid-2007, food as well as non-food FROOPP inflation has
been higher than the general CPI inflation.
-15
-10
-5
0
5
10
15
200
7
200
8
200
9
201
0
201
1
201
2
201
3
201
4
201
5
201
6
Actual inflation (sub-comp. of official CPI )
Perceived inflation (total CPI)
Per cent, year-over-year
01. Food and non-alcoholic beverages
-15
-10
-5
0
5
10
15
200
7
200
8
200
9
201
0
201
1
201
2
201
3
201
4
201
5
201
6
Actual inflation (sub-comp. of official CPI )
Perceived inflation (total CPI)
Per cent, year-over-year
02. Alcoholic beverages and tobacco
-15
-10
-5
0
5
10
15
200
7
200
8
200
9
201
0
201
1
201
2
201
3
201
4
201
5
201
6
Actual inflation (sub-comp. of official CPI )
Perceived inflation (total CPI)
Per cent, year-over-year
03. Clothing and footwear
-15
-10
-5
0
5
10
15
200
7
200
8
200
9
201
0
201
1
201
2
201
3
201
4
201
5
201
6
Actual inflation (sub-comp. of official CPI )
Perceived inflation (total CPI)
Per cent, year-over-year
04. Housing, water, electricity, gas andother fuels
-15
-10
-5
0
5
10
15
200
7
200
8
200
9
201
0
201
1
201
2
201
3
201
4
201
5
201
6
Actual inflation (sub-comp. of official CPI )
Perceived inflation (total CPI)
05. Furnishings, household equipment and routine household
maintenancePer cent, year-over-year
-15
-10
-5
0
5
10
15
200
7
200
8
200
9
201
0
201
1
201
2
201
3
201
4
201
5
201
6
Actual inflation (sub-comp. of official CPI )
Perceived inflation (total CPI)
Per cent, year-over-year
06. Health
-15
-10
-5
0
5
10
15
200
7
200
8
200
9
201
0
201
1
201
2
201
3
201
4
201
5
201
6
Actual inflation (sub-comp. of official CPI )
Perceived inflation (total CPI)
Per cent, year-over-year
07. Transport
-15
-10
-5
0
5
10
15
200
7
200
8
200
9
201
0
201
1
201
2
201
3
201
4
201
5
201
6
Actual inflation (sub-comp. of official CPI )
Perceived inflation (total CPI)
Per cent, year-over-year
08. Communication
-15
-10
-5
0
5
10
15
200
7
200
8
200
9
201
0
201
1
201
2
201
3
201
4
201
5
201
6
Actual inflation (sub-comp. of official CPI )
Perceived inflation (total CPI)
Per cent, year-over-year
09. Recreation and culture
-15
-10
-5
0
5
10
15
200
7
200
8
200
9
201
0
201
1
201
2
201
3
201
4
201
5
201
6
Actual inflation (sub-comp. of official CPI )
Perceived inflation (total CPI)
Per cent, year-over-year
10. Education
-15
-10
-5
0
5
10
15
200
7
200
8
200
9
201
0
201
1
201
2
201
3
201
4
201
5
201
6
Actual inflation (sub-comp. of official CPI )
Perceived inflation (total CPI)
Per cent, year-over-year
11. Restaurants and hotels
-15
-10
-5
0
5
10
15
200
7
200
8
200
9
201
0
201
1
201
2
201
3
201
4
201
5
201
6
Actual inflation (sub-comp. of official CPI )
Perceived inflation (total CPI)
Per cent, year-over-year
12. Miscellaneous goods and services

12
Table 2: Items included in the HICP aggregate on frequent out of pocket purchases (FROOPP)
COICOP Description COICOP Description
01 Food and non-alcoholic beverages 09.1.4 Recording media 02. Alcoholic beverages, tobacco and
narcotics 09.3.4-5 Pets and related products including
veterinary and other services for pets 03.1.4 Cleaning, repair and hire of clothing 09.4.1 Recreational and sporting services 05.6.1 Non-durable household goods 09.4.2 Cultural services 05.6.2 Domestic services and household services 09.5.1 Books 06.1.1 Pharmaceutical products 09.5.2 Newspapers and periodicals 07.2.2 Fuels and lubricants for personal transport
equipment 09.5.3-4 Miscellaneous printed matter
07.2.4 Other services in respect of personal transport equipment
11.1.1 Restaurants, cafés and the like
07.3.1 Passenger transport by railway 11.1.2 Canteens 07.3.2 Passenger transport by road 12.1.1 Hairdressing salons and personal
grooming establishments 07.3.5 Combined passenger transport 12.1.2-3 Electrical appliances for personal care
and other appliances, articles and products
08.1 Postal services Source: Eurostat (2017).
Food and non-FROOPP inflation Figure 7
Notes: Own compilations based on StatBank Denmark.
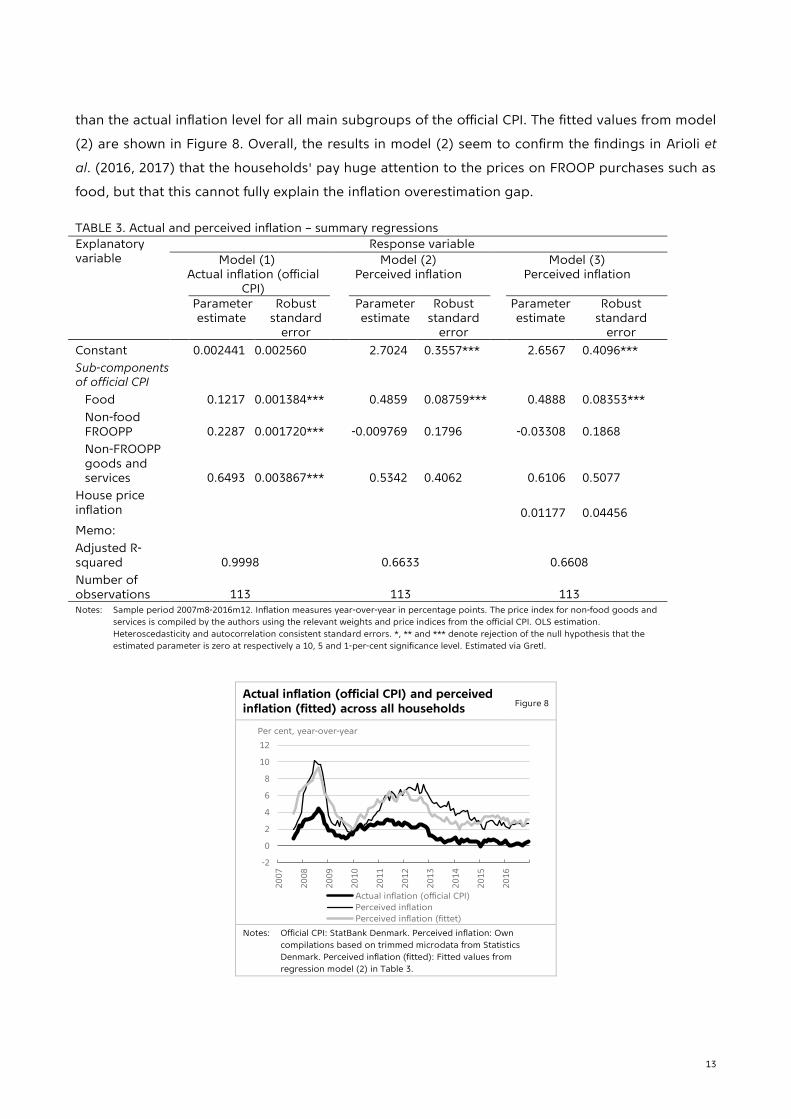
In Table 3 we explore to what extent the inflation perception bias can be attributed to the price
concept that respondents have in mind when assessing inflation. Food accounts for around 12 per
cent of the weighting basis of the official CPI whereas non-food FROOPP accounts for another 23
per cent. This is reflected in model (1) in Table 3, where we have regressed the annual inflation rate
according to the official CPI on the subindices for food, non-food FROOPP and non-FROOPP items
(also according to the official CPI). In model (2), we have replaced the official CPI with the average
perceived inflation level from the CES survey data as the response variable. The results illustrate
that households put a substantially larger weight on the development in food prices than the
official CPI whereas the price development on non-food FROOPP seems not to have any significant
impact on households' inflation perception. The relatively large and significant constant term
confirms the impression from Figure 6 that households in general perceive inflation to be higher
-4
-2
0
2
4
6
8
10
12
20
07
20
08
20
09
20
10
20
11
20
12
20
13
20
14
20
15
20
16
Total CPI Food Non-food FROOPP
Per cent, year-over-year
13
than the actual inflation level for all main subgroups of the official CPI. The fitted values from model
(2) are shown in Figure 8. Overall, the results in model (2) seem to confirm the findings in Arioli et
al. (2016, 2017) that the households' pay huge attention to the prices on FROOP purchases such as
food, but that this cannot fully explain the inflation overestimation gap.
TABLE 3. Actual and perceived inflation – summary regressions
Explanatory variable
Response variable
Model (1) Actual inflation (official
CPI)
Model (2) Perceived inflation
Model (3) Perceived inflation
Parameter estimate
Robust standard
error
Parameter estimate
Robust standard
error
Parameter estimate
Robust standard
error
Constant 0.002441 0.002560 2.7024 0.3557*** 2.6567 0.4096***
Sub-components of official CPI
Food 0.1217 0.001384*** 0.4859 0.08759*** 0.4888 0.08353***
Non-food FROOPP 0.2287 0.001720*** -0.009769 0.1796 -0.03308 0.1868
Non-FROOPP goods and services 0.6493 0.003867*** 0.5342 0.4062 0.6106 0.5077
House price inflation
0.01177
0.04456
Memo:
Adjusted R-squared 0.9998 0.6633 0.6608
Number of observations 113 113 113 Notes: Sample period 2007m8-2016m12. Inflation measures year-over-year in percentage points. The price index for non-food goods and
services is compiled by the authors using the relevant weights and price indices from the official CPI. OLS estimation.
Heteroscedasticity and autocorrelation consistent standard errors. *, ** and *** denote rejection of the null hypothesis that the
estimated parameter is zero at respectively a 10, 5 and 1-per-cent significance level. Estimated via Gretl.
Actual inflation (official CPI) and perceived inflation (fitted) across all households
Figure 8
Notes: Official CPI: StatBank Denmark. Perceived inflation: Own
compilations based on trimmed microdata from Statistics
Denmark. Perceived inflation (fitted): Fitted values from
regression model (2) in Table 3.
-2
0
2
4
6
8
10
12
20
07
20
08
20
09
20
10
20
11
20
12
20
13
20
14
20
15
20
16
Actual inflation (official CPI)
Perceived inflation
Perceived inflation (fittet)
Per cent, year-over-year

14
Translated from Danish into English, the wording of the question on inflation perception applied
in the Danish CES survey is as follows: "By how many per cent do you think that prices have gone
up/down over the past 12 months?". This phrasing might be seen as more general with respect to
the price concept than the wording in the English version of the question of the EU-Harmonised
Survey ("By how many percent do you think that consumer prices have gone up/down over the
past 12 months?"). Döhring and Mordonu (2007) suggest that house prices might contribute to the
inflation perception of households. In model (3) in Table 3, we have therefore tried to expand
model (2) with the nationwide house price index. The house price inflation coefficient is not
statistically different from zero at any conventional significance level. The high level of perceived
inflation of the households seems therefore not to be related to developments in house prices.
The findings from Table 3 are confirmed by household-group-level regressions, where we
account for household-group-specific inflation developments, cf. Table 4. House prices are not
significant for any of the 18 household groups, whereas food prices are very significant in all of the
regressions. The constant term tends to be lower for high income earners. However, the relatively
limited variation in the constant term (from 1.9 to 3.9 per cent per annum) across all household
groups is notable. This indicates that the inflation overestimation bias is very broad-based, cf. also
Figure 9.

15
TABLE 4. Perceived inflation – regressions by household groups
Household group Explanatory variable – Parameter estimate (robust standard error)
Constant Sub-components of house-hold-group-specific CPI
House price inflation
Adjusted R-squared
Food Non-food goods and services
Single persons under 60 years without children
2.7907*** (0.3643)
0.3779*** (0.1069)
0.4763 (0.3058)
-0.006086 (0.03582)
0.5984
Single persons over 60 years without children
3.3694*** (0.4314)
0.5723*** (0.07343)
0.1467 (0.1689)
-0.03504 (0.04333)
0.5922
Single persons with children 3.5215*** (0.3518)
0.4970*** (0.08929)
0.4274* (0.2562)
0.03393 (0.04100)
0.5458
2 adults without children, household head under 60 years
2.6481*** (0.3365)
0.4956*** (0.1072)
0.3173 (0.2238)
0.0001136 (0.03347)
0.6231
2 adults without children, household head over 60 years
2.8770*** (0.4052)
0.4844*** (0.09224)
0.3312 (0.2463)
-0.05111 (0.03962)
0.6413
2 adults with children
2.4594*** (0.3652)
0.4797*** (0.09486)
0.5436* (0.3059)
0.01516 (0.03859)
0.6666
Self-employed 2.0019*** (0.3701)
0.5958*** (0.1217)
0.2075 (0.3118)
0.03624 (0.04038)
0.5413
Employees - upper level 1.9232*** (0.4036)
0.4309*** 0.09141
0.4927* (0.2670)
0.004548 (0.03772)
0.6323
Employees - medium level 2.6741*** (0.3785)
0.4697*** (0.1021)
0.3937 (0.2881)
-0.005294 (0.04070)
0.6072
Employees - basic level 3.1569*** (0.3356)
0.4743*** (0.1045)
0.4307 (0.2620)
-0.01338 (0.03821)
0.6360
Receiving education 2.9689*** (0.3498)
0.3720*** (0.08775)
0.3540 (0.2886)
-0.01606 (0.03447)
0.4938
Pensioners and early retirement 3.3487*** (0.4589)
0.5373*** (0.07524)
0.2392 (0.2260)
-0.05437 (0.04283)
0.6332
Other not economically active (excl. unemployed)
3.9469*** (0.3240)
0.3389*** (0.1244)
0.7707** (0.3114)
-0.001229 (0.03428)
0.4526
Income under 150,000 DKK 3.5414*** (0.4235)
0.4804*** (0.1064)
0.0002266 (0.2451)
-0.005633 (0.033490)
0.4759
Income 150,000-299,999 DKK 3.3898*** (0.4256)
0.4847*** (0.07662)
0.3259 (0.2421)
-0.03052 (0.04397)
0.5928
Income 300,000-499,999 DKK 3.2291*** (0.3931)
0.4908*** (0.09722)
0.3228 (0.2558)
-0.02372 (0.03891)
0.6314
Income 500,000-799,999 DKK 2.7991*** (0.3471)
0.4901*** (0.1020)
0.4065 (0.2600)
-0.001694 (0.03633)
0.6484
Income 800,000 DKK or over 1.9700*** (0.3719)
0.4843*** (0.09717)
0.4073 (0.2850)
0.02928 (0.03899)
0.6472
Notes: OLS estimation. Heteroscedasticity and autocorrelation consistent standard errors. *, ** and *** denote rejection of the null hypothesis
that the estimated parameter is zero at respectively a 10, 5 and 1-per-cent significance level. 113 observations in all regressions.
Estimated via Gretl.

16
Perceived and actual inflation across income groups
Figure 9
Notes: Average perceived and actual household-group-specific
inflation, August 2007 – December 2016.
Source: Household-group-specific CPI: StatBank Denmark. Perceived
inflation: Own compilations based on trimmed microdata from
Statistics Denmark.
Earlier research has suggested that households pay more attention to price increases than price
decreases, which might partly explain the inflation perception bias, cf. also Figure 10. There might
be a psychological difference between facing price increases and price decreases, which is
consistent with the line of reasoning behind loss aversion within behavioural economics
(Kahneman and Tversky, 1984).
Actual inflation, perceived inflation and inflation based on goods and services with price increases
Figure 10
Notes: Inflation based on goods and services with price increases is a
simple (unweighted) average of prince increases at a 5-digit
COICOP level (214 price index series). On average, 134 of these
indices showed a positive rate of inflation year-over-year each
month whereas 75 showed a negative rate of inflation.
Source: Own compilations based on StatBank Denmark.
0
1
2
3
4
5
< 150 150-299 300-499 500-799 ≥ 800
Perceived inflation Actual inflation
Pct.
Household income, 1000 DKK
-2
0
2
4
6
8
20
10
20
11
20
12
20
13
20
14
20
15
20
16
Official CPI inflation
Perceived inflation
Inflation based on goods and services with price increases
Per cent, year-over-year

17
4. Inflation perception and household characteristics – a closer look at the microdata
The results in Section 3 indicate that overestimation of inflation is a very broad-based characteristic
across household groups. To assess whether important heterogeneities exist, e.g. within
household groups, we take a closer look at the microdata from the CES survey. Statistics Denmark
is, as mentioned in Section 2, able to merge survey results with administrative registers. We can
therefore obtain precise measures of e.g. income and balance sheet variables at the household
level for all participants in the survey.
As a starting point, we consider the distribution of responses to the question on perceived
inflation. We note that most households answer in round numbers when asked to assess the
current level of inflation, and also that many households seem to vastly overestimate actual
inflation (which on average has been 1.6 per cent over the sample period), cf. Figure 11.
Perceived inflation, distribution of responses
Figure 11
Note: Responses in intervals of length 0.5 from the mid-point shown
in the figure. For example, the category 5 refers to all
respondents that have answered between 4.75 and 5.25.
Responses outside [-10 ; 20] are disregarded in the figure.
Source: Own calculations based on survey and register data from
Statistics Denmark.
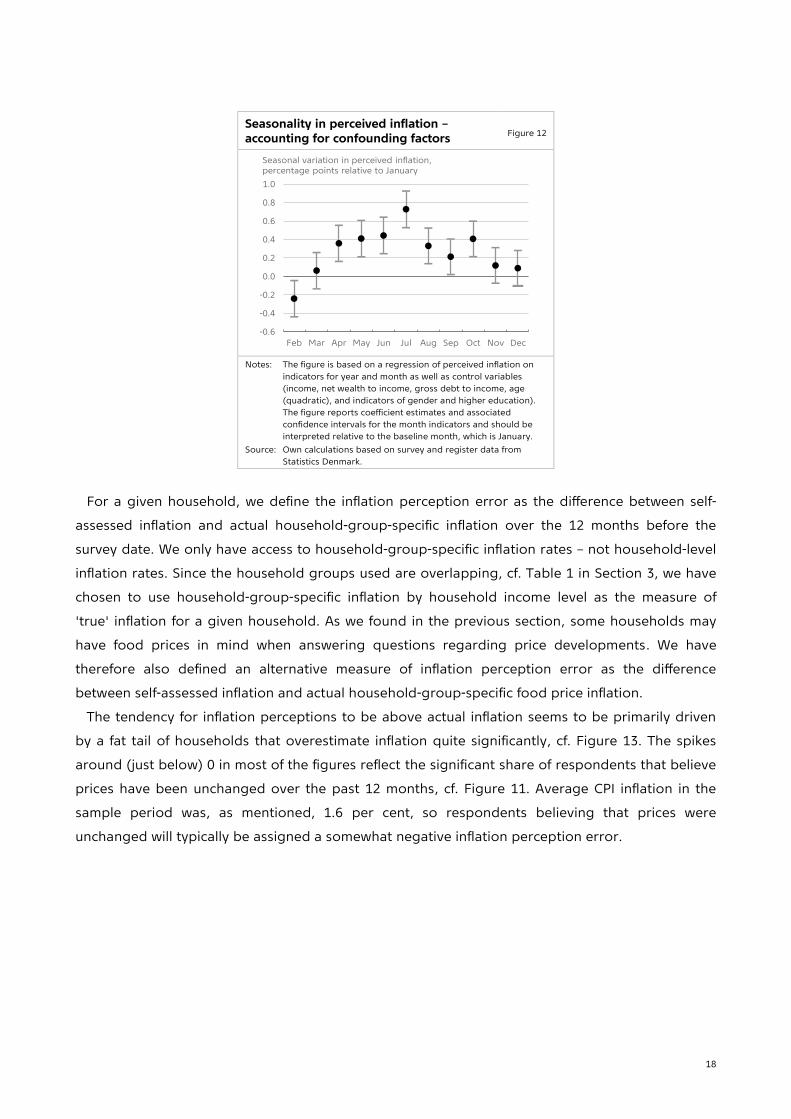
There is also a clear seasonal variation in inflation perception, cf. Figure 12. Respondents on
average perceive the level of inflation to be almost 1 percentage point higher in July than in
February. This might reflect a tradition for major sales early in the year (January/February) and an
impression of high prices during holiday periods (July and October). It could also simply reflect that
people spend more money during holidays and therefore think that goods and services have
become more expensive.
0
5
10
15
20
25
30
35
40
-10 -5 0 5 10 15 20
Share of respondents, per cent
Perceived inflation, per cent
18
Seasonality in perceived inflation – accounting for confounding factors
Figure 12
Notes: The figure is based on a regression of perceived inflation on
indicators for year and month as well as control variables
(income, net wealth to income, gross debt to income, age
(quadratic), and indicators of gender and higher education).
The figure reports coefficient estimates and associated
confidence intervals for the month indicators and should be
interpreted relative to the baseline month, which is January.
Source: Own calculations based on survey and register data from
Statistics Denmark.
For a given household, we define the inflation perception error as the difference between self-
assessed inflation and actual household-group-specific inflation over the 12 months before the
survey date. We only have access to household-group-specific inflation rates – not household-level
inflation rates. Since the household groups used are overlapping, cf. Table 1 in Section 3, we have
chosen to use household-group-specific inflation by household income level as the measure of
'true' inflation for a given household. As we found in the previous section, some households may
have food prices in mind when answering questions regarding price developments. We have
therefore also defined an alternative measure of inflation perception error as the difference
between self-assessed inflation and actual household-group-specific food price inflation.
The tendency for inflation perceptions to be above actual inflation seems to be primarily driven
by a fat tail of households that overestimate inflation quite significantly, cf. Figure 13. The spikes
around (just below) 0 in most of the figures reflect the significant share of respondents that believe
prices have been unchanged over the past 12 months, cf. Figure 11. Average CPI inflation in the
sample period was, as mentioned, 1.6 per cent, so respondents believing that prices were
unchanged will typically be assigned a somewhat negative inflation perception error.
-0.6
-0.4
-0.2
0.0
0.2
0.4
0.6
0.8
1.0
Feb Mar Apr May Jun Jul Aug Sep Oct Nov Dec
Seasonal variation in perceived inflation, percentage points relative to January

19
Distribution of inflation perception errors Figure 13
Notes: The inflation perception error is the difference between self-assessed inflation and actual household-group-specific CPI or food price inflation,
respectively. Kernel density estimates.
Source: Official household-group-specific CPI: StatBank Denmark. Perceived inflation: Own compilations based on micro data from Statistics Denmark.
Following up on our previous hypothesis that households pay more attention to certain
consumption items, in particular food, we see that perception errors calculated on the basis of
household-group-specific food CPI inflation are generally more symmetrically distributed around 0
than perception errors based on overall group-specific CPI inflation in times when there are large
differences between the two types of inflation (e.g. the period 2008-10, cf. Figure 7). In 2008, where
differences between food CPI and overall CPI inflation were the largest, the average perception
error based on food price inflation was 0.1, whereas it was 3.9 based on overall CPI. In periods with
smaller differences between food price inflation and overall inflation (e.g. the years 2015-16), the
two measures are nearly identical. In line with our previous findings, this suggests that households
place a larger than proportional weight on food price inflation when asked about price changes.
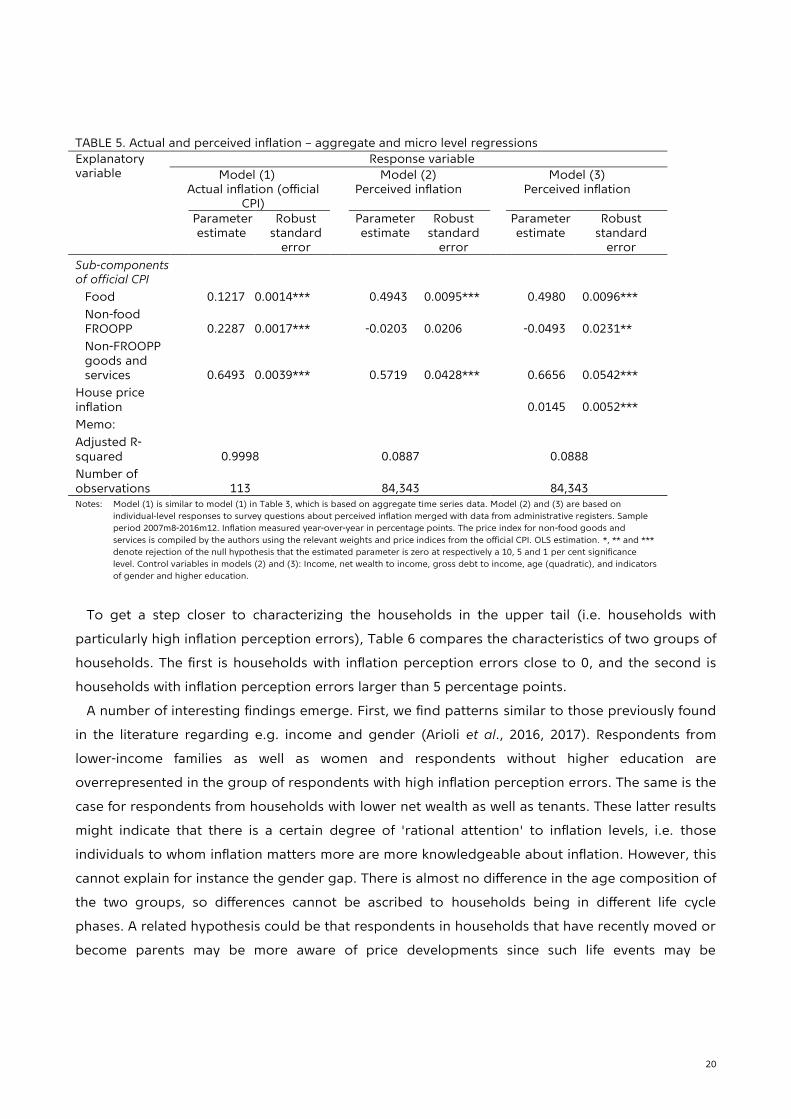
This conclusion is further underlined by the results presented in Table 5. Here, we use our micro-
level dataset to replicate the results from Table 3, which were based on aggregate time series data.
In line with the macro-based results, the micro-based results in Table 5 indicate that households
put a substantially larger weight on the development in food prices than the official CPI, and that
house price inflation can explain the level of perceived inflation only to a very limited extent.
0.00
0.05
0.10
0.15
-10 -5 0 5 10 15 20
Perception error Perception error (food)
Density
Percentage points
2008
0.00
0.05
0.10
0.15
0.20
0.25
-10 -5 0 5 10 15 20
Perception error Perception error (food)
Density
Percentage points
2009
0.00
0.05
0.10
0.15
0.20
0.25
0.30
0.35
-10 -5 0 5 10 15 20
Perception error Perception error (food)
Density
Percentage points
2010
0.00
0.05
0.10
0.15
-10 -5 0 5 10 15 20
Perception error Perception error (food)
Density
Percentage points
2011
0.00
0.05
0.10
0.15
-10 -5 0 5 10 15 20
Perception error Perception error (food)
Density
Percentage points
2012
0.00
0.05
0.10
0.15
0.20
-10 -5 0 5 10 15 20
Perception error Perception error (food)
Density
Percentage points
2013
0.00
0.05
0.10
0.15
0.20
0.25
0.30
-10 -5 0 5 10 15 20
Perception error Perception error (food)
Density
Percentage points
2014
0.00
0.05
0.10
0.15
0.20
0.25
0.30
0.35
-10 -5 0 5 10 15 20
Perception error Perception error (food)
Density
Percentage points
2015
0.00
0.05
0.10
0.15
0.20
0.25
0.30
0.35
0.40
-10 -5 0 5 10 15 20
Perception error Perception error (food)
Density
Percentage points
2016
20
TABLE 5. Actual and perceived inflation – aggregate and micro level regressions
Explanatory variable
Response variable
Model (1) Actual inflation (official
CPI)
Model (2) Perceived inflation
Model (3) Perceived inflation
Parameter estimate
Robust standard
error
Parameter estimate
Robust standard
error
Parameter estimate
Robust standard
error
Sub-components of official CPI
Food 0.1217 0.0014*** 0.4943 0.0095*** 0.4980 0.0096***
Non-food FROOPP 0.2287 0.0017*** -0.0203 0.0206 -0.0493 0.0231**
Non-FROOPP goods and services 0.6493 0.0039*** 0.5719 0.0428*** 0.6656 0.0542***
House price inflation
0.0145 0.0052***
Memo:
Adjusted R-squared 0.9998 0.0887 0.0888
Number of observations 113 84,343 84,343 Notes: Model (1) is similar to model (1) in Table 3, which is based on aggregate time series data. Model (2) and (3) are based on
individual-level responses to survey questions about perceived inflation merged with data from administrative registers. Sample
period 2007m8-2016m12. Inflation measured year-over-year in percentage points. The price index for non-food goods and
services is compiled by the authors using the relevant weights and price indices from the official CPI. OLS estimation. *, ** and ***
denote rejection of the null hypothesis that the estimated parameter is zero at respectively a 10, 5 and 1 per cent significance
level. Control variables in models (2) and (3): Income, net wealth to income, gross debt to income, age (quadratic), and indicators
of gender and higher education.
To get a step closer to characterizing the households in the upper tail (i.e. households with
particularly high inflation perception errors), Table 6 compares the characteristics of two groups of
households. The first is households with inflation perception errors close to 0, and the second is
households with inflation perception errors larger than 5 percentage points.
A number of interesting findings emerge. First, we find patterns similar to those previously found
in the literature regarding e.g. income and gender (Arioli et al., 2016, 2017). Respondents from
lower-income families as well as women and respondents without higher education are
overrepresented in the group of respondents with high inflation perception errors. The same is the
case for respondents from households with lower net wealth as well as tenants. These latter results
might indicate that there is a certain degree of 'rational attention' to inflation levels, i.e. those
individuals to whom inflation matters more are more knowledgeable about inflation. However, this
cannot explain for instance the gender gap. There is almost no difference in the age composition of
the two groups, so differences cannot be ascribed to households being in different life cycle
phases. A related hypothesis could be that respondents in households that have recently moved or
become parents may be more aware of price developments since such life events may be

21
associated with large out of pocket expenses. This effect seems relevant although differences
between the two groups in Table 6 are not large.
One could also expect that individuals buying larger consumption items (e.g. durables) or
investing in e.g. real estate are more informed about actual inflation levels and the broader
macroeconomic situation than other individuals. This hypothesis is partly confirmed since a smaller
fraction of households with high inflation perception errors purchased real estate in the survey
year. However, there is no difference in the share of households that bought a car. Relatedly, we
investigate whether there is a difference in the inflation perception errors of more versus less
impatient households. We find that the median consumption-to-income ratio is only slightly higher
for households with high inflation perception errors.

22
TABLE 6: Characteristics of households with low and high inflation perception errors
Inflation perception error
Between -2 and +2 pct. points
> 5 pct. points
After-tax income (DKK, median) 430,169 375,418
Gross debt to income (%, median) 206.1% 194.7%
Net wealth to income (%, median) 143.0% 104.0%
Household has negative net wealth (share) 23.5% 27.9%
Loan-to-value ratio (only homeowners, median) 65.7% 68.0%
Consumption to income (%, median) 93.8% 95.8%
Age (years, median) 48 49
Higher education (share) 35.0% 25.9%
Women (share) 47.5% 56.0%
Tenants (share) 29.3% 34.0%
Self-employed (share) 7.9% 6.9%
Household has unemployed adult members (share) 6.5% 8.1%
Household has moved during past 3 years 17.8% 16.7%
Household got children during past 3 years 9.2% 8.2%
Bought or sold real estate (share) 5.6% 4.1%
Bought a car (share) 22.3% 22.0%
Household has interest only mortgage loan (share) 44.6% 46.6%
Household has variable rate mortgage loan (share) 60.5% 60.4%
Household owns stocks and mutual fund shares > 50,000 DKK (share) 22.0% 15.2%
Respondent employed within finance (share) 4.4% 2.8%
Respondent employed within business services (share) 10.5% 8.3%
Respondent employed within information and communication (share) 4.1% 2.7%
Respondent employed within retail trade (share) 6.3% 7.5%
Respondent employed in public sector (share) 35.8% 40.9%
North Jutland Region 10.7% 10.9%
Middle Jutland Region 24.4% 22.4%
Southern Region 22.4% 22.4%
Capital Region 28.4% 28.4%
Region Zealand 14.1% 15.9%
Optimists (own future financial situation) (share) 28.7% 26.0%
Pessimists (own future financial situation) (share) 9.7% 18.0%
Positive assessment of own current financial situation (share) 24.5% 19.6%
Negative assessment of own current financial situation (share) 15.0% 27.5%
Optimists (macroeconomic situation) (share) 40.4% 31.8%
Pessimists (macroeconomic situation) (share) 18.0% 30.4%
Optimists (aggregate unemployment) (share) 34.4% 22.2%
Pessimists (aggregate unemployment) (share) 29.1% 43.6%
Thinks now is a good time to purchase durables (share) 18.9% 17.6%
Thinks it is better to postpone purchasing durables (share) 22.4% 33.5%
Inflation expectation error (percentage points, trimmed mean) 1.57 6.99
Has inflation expectation error between -2 and +2 pct. points (share) 64.9% 17.3%
Has inflation expectation error > 5 pct. points (share) 2.9% 51.8%
Number of observations 37,895 22,599 Notes: Inflation perception error is defined as the difference between self-assessed inflation and actual household-group-specific inflation over 12
months before the survey date. The household-group-specific inflation rates used are those based on household income. Income, net wealth,
gross debt, loan-to-value ratio, consumption, self-employed, loan characteristics as well as car and house purchase are measured at the
household level, while remaining characteristics and responses are those of the respondent. Consumption is imputed as in Abildgren et al.
(2018).

23
A clearer result is that stock-market participants are more likely to have low inflation perception
errors. Respondents employed within finance and business services might be expected to be more
knowledgeable about inflation to the extent that it is directly relevant for their work. Also,
employees in the retail trade sector could be expected to be more knowledgeable about prices
because they may be exposed to price developments on a daily basis. Furthermore, employees in
the retail distribution sector might get a discount on purchases, which could give them an extra
incentive to follow the price development. Respondents working within information and
communication may also have a more accurate assessment of inflation since they may be more
informed in general about societal matters and notice news to a larger extent than people working
in other industries. With the exception of retail trade employees, these hypotheses are confirmed.
Employees within retail trade are overrepresented in the group of households with high perception
errors. This finding could, in principle, be the result of employees within retail trade placing a
larger weight on food prices when assessing inflation, but supplementary results (not reported for
brevity) indicate that this is not the case, since these individuals also tend to be overrepresented in
the group of households that overestimate inflation when food prices are used as the benchmark.
Next, we consider respondents' answers to other survey questions. Interestingly, a distinctive
feature of the households with high inflation perception errors is that they are much more
pessimistic than households with lower perception errors. A larger share of households with high
inflation perception errors thinks that it is better to postpone purchases of durable goods. Also,
both when assessing households' own financial situation currently and in the future as well as the
general macroeconomic situation and the expectations for the unemployment rate, a larger share
of the households that overestimate inflation are pessimistic compared to the group of households
with smaller perception errors. And conversely, fewer of these households are optimistic. These
results confirm the findings by Ehrmann et al. (2017).
A number of hypotheses may be relevant in this context. For example, pessimism might represent
a fundamental personality trait, implying that pessimistic households have a general negative
response bias in all questions in which an assessment is demanded, irrespective of whether their
pessimism is 'justified'. Alternatively, pessimism might reflect unobserved factors at the household
level, for example uncertainty, that also impact the assessment of price changes or expectations.
To test whether personality traits are important, we split pessimistic households into two groups,
namely overpessimists and 'justified' pessimists. Following an approach similar to Abildgren,
Hansen and Kuchler (2018), we utilize the time series dimension of our data to define
overpessimists as households who are pessimistic about their own future financial situation and
who (in spite of their pessimism) experience an increase in real household income over a 3-year
period following the interview. 'Justified pessimists' are defined as pessimistic households whose
real incomes decline over a 3-year period following the interview. Pessimists do indeed have a
tendency to overestimate inflation relative to other respondents, cf. Figure 14. This is particularly

24
so for overpessimistic households, indicating that fundamental personality traits may play a role in
the accuracy of inflation perceptions.
Distribution of inflation perception errors for pessimistic and other households
Figure 14
Notes: The inflation perception error is the difference between self-
assessed inflation and actual household-group-specific CPI over
12 months before the survey date. Kernel density estimates.
Overpessimistic households are households who are pessimistic
about their own future financial situation and who (in spite of
their pessimism) experience an increase in real household
income over a 3-year period following the interview. 'Justified
pessimists' are defined as pessimistic households whose real
incomes decline over a 3-year period following the interview.
Source: Own calculations based on survey and register data from
Statistics Denmark.
Many of the characteristics included in Table 6 may be correlated. To complement these bivariate
analyses, Table 7 reports the results from regressing inflation perception error on a range of
background variables. In general, the results confirm the bivariate relations suggested by Table 6.
In line with our previously discussed results, we also note that the differences are not very large in
magnitudes. For example, the difference between expected inflation perception errors for an
average 30-year-old and an average 50-year-old is only around 0.2 percentage points, and a one
standard deviation increase in household income decreases the inflation perception error by
around half a percentage point. The regression results in Table 7 also confirm that pessimistic
households indeed have larger forecast errors than other households, and that overpessimistic
households have significantly larger forecast errors compared to 'justified pessimists'.
0.00
0.05
0.10
0.15
0.20
-10 -5 0 5 10 15 20
Overpessimistic households"Justified pessimistic" householdsOther households
Density
Inflation perception error, percentage points

25
TABLE 7: Determinants of inflation perception error (regression results)
(1) (2) (3) (4) (5) (6)
Income -0.0017*** -0.0017*** -0.0019*** -0.0015*** -0.0018*** -0.0021***
(0.0001) (0.0001) (0.0001) (0.0001) (0.0001) (0.0002)
Net wealth to income -0.0844*** -0.0802*** -0.0757*** -0.0762*** -0.0833*** -0.0948***
(0.0064) (0.0063) (0.0068) (0.0063) (0.0067) (0.0082)
Gross debt to income -0.0703*** -0.0680*** -0.0758*** -0.0597*** -0.0656*** -0.0614***
(0.0092) (0.0090) (0.0102) (0.0090) (0.0102) (0.0119)
Age -0.0425*** -0.0392*** -0.0449*** -0.0392*** -0.0382*** -0.0584***
(0.0085) (0.0084) (0.0086) (0.0083) (0.0087) (0.0112)
Age squared 0.0006*** 0.0005*** 0.0006*** 0.0005*** 0.0005*** 0.0007***
(0.0001) (0.0001) (0.0001) (0.0001) (0.0001) (0.0001)
Higher education -0.7811*** -0.7868*** -0.7546*** -0.7768*** -0.7871*** -0.8124***
(0.0501) (0.0489) (0.0500) (0.0487) (0.0508) (0.0653)
Woman 1.2895*** 1.2997*** 1.3074*** 1.2674*** 1.3040*** 1.4437***
(0.0448) (0.0437) (0.0448) (0.0436) (0.0453) (0.0582)
Borrower
0.1666**
(0.0692)
Purchased real estate
-0.3961***
(0.1219)
Purchased a car
0.0364
(0.0529)
Consumption to income
-0.0432
(0.0360)
Optimistic
0.0329
(0.0516)
Pessimistic
1.7540*** 1.4064***
(0.0694) (0.1257)
Increase in real income
-0.0295
(0.0645)
Overpessimistic
0.7203***
(Pessimistic * Increase in real income) (0.1525)
Year fixed effects No Yes Yes Yes Yes Yes
No of obs. 84,343 84,343 79,709 79,729 83,758 52,957
R sq 0.0205 0.0677 0.0692 0.0662 0.0747 0.0863
Notes: OLS estimation. *, ** and *** denote rejection of the null hypothesis that the estimated parameter is zero at respectively a
10, 5 and 1 per cent significance level. The dependent variable is inflation perception error, defined as the difference
between self-assessed inflation and actual household-group-specific inflation over 12 months before the survey date. Top
and bottom 1 per cent in terms of income, net wealth to income and gross debt to income, as well as households with an
absolute inflation perception error of more than 50 percentage points have been excluded from the estimation sample. The
household-group-specific inflation rates used are those based on household income. Income, net wealth, gross debt,
borrower, car and house purchase and consumption are measured at the family level, while age, gender education and
sentiment are those of the respondent. Borrower refers to a household whose liabilities exceed its liquid financial assets.
Consumption is imputed as in Abildgren et al. (2018). Due to properties of the imputation procedure, model (4) only includes
households that are not involved in a real estate transaction in the given year, and top and bottom 1 per cent of households
in terms of consumption to income are excluded from the estimation sample.
The results in Tables 6 and 7 indicate a correlation between the size of the inflation perception
error and numerous household characteristics. However, these differences in socioeconomic
characteristics across households are not enough to explain the general perception gap. Even in
the group of households (based on sentiment, gender, homeownership, stockownership and

26
income) in which the lowest inflation perception errors are to be expected according to Tables 6
and 7, households vastly overestimate actual inflation levels in most years of our sample period, cf.
Figure 15.
Actual and perceived inflation for selected household groups
Figure 15
Notes: The gray line represents the average inflation perceptions in the
group of households which, according to Table 5, based on
sentiment, gender, homeownership, stockownership and
income should be expected to have the lowest inflation
perception error.
Source: Own calculations based on survey and register data from
Statistics Denmark.
Based on 2,317 individuals that participated in the survey more than once, we also find individual
overestimation bias to be persistent, cf. Figure 16. Respondents that reported a relatively high level
of perceived inflation in an interview are also more likely to report a relatively high level of
perceived inflation in subsequent interview rounds.1 This is a further indication that inflation
perception is closely related to fundamental personality traits.
1 Similar results are found regarding the probability to report non-0 values for perceived inflation. 51 per cent of respondents that perceived inflation to
be 0 per cent in their first interview also perceived inflation to be 0 per cent in the subsequent round(s), whereas that was the case for only 38 per
cent of respondents that reported a non-0 value in their first interview.
-2
0
2
4
6
8
10
12
Perceived inflation (average)
Actual inflation (CPI)
Perceived inflation (identified group of households withlowest inflation perception errors)
Per cent, y-o-y
2007 2008 2009 2010 2011 2012 2013 2014 2015 2016

27
Perceived inflation, respondents that participated in the survey more than once
Figure 16
Notes: The figure is based on 2,317 respondents, who participated in
the survey more than once during the period 2007-16. Only
respondents that perceived inflation to be higher than 0 per
cent in both interviews are included.
Source: Own calculations based on survey and register data from
Statistics Denmark.
5. Inflation expectations and inflation perception
As summarized in Section 1, earlier research has found that inflation expectations are subject to
biases similar to those at play for inflation perceptions. This is confirmed in our dataset. Except for
two years, inflation expectations overshoot actual inflation throughout our sample horizon, cf.
Figure 17. Furthermore, the level of average inflation expectations for the coming 12 months is
generally quite comparable to the level of average perceived inflation over the past 12 months,
although somewhat lower in most periods (note that the time stamp for expected inflation in
Figure 17 is 12 months after the survey month to make it comparable to actual inflation
developments). Hence, it seems that households on average expect the perceived level of current
inflation to continue or decline slightly over the forecast horizon. In the remainder of this section,
we will first show that this relationship between perceived and expected inflation is strongly
present at the household level, cf. also Duffy and Lunn (2009) and Axelrod, Lebow and Peneva
(2018). We will thereafter utilize this fact to evaluate whether households' assessment of changes in
inflation (i.e. expectations conditional on the perceived level of inflation) is more accurate than the
assessment of actual or expected inflation measured in levels. As a side point it might be noted that
the inflation expectations in Figure 17 – taken at face value – do not seem to indicate that fear of
deflation has been widespread among the households during the downturn that followed the
global financial crisis.
20
30
40
50
60
70
0 20 40 60 80 100
Percentile of perceived inflation, first interview
Average percentile of perceived inflation, subsequent interview(s)

28
Inflation expectations, perceptions and actual inflation
Figure 17
Notes: Unweighted average.
Source: Official CPI: StatBank Denmark. Perceived and expected
inflation: Own compilations based on trimmed microdata from
Statistics Denmark.
First, we note that perceived and expected inflation are highly correlated at the household level,
cf. Figure 18. To further assess the properties and implications of this correlation, we define the
inflation expectation error as the difference between survey reported expected inflation and actual
household-group-specific CPI inflation over a forward-looking 12-month horizon (not overall CPI as
used in Figure 17). We refer to this measure as the inflation expectation error, even though it might
not be thought of as an error in the same way as the inflation perception error. Even a household
that may have used all available information at the time of the survey to make the best possible
forecast may find itself ending up with a non-zero inflation expectation error ex post due to random
variation or e.g. new information emerging over the forecast horizon.
Correlation between expected and perceived inflation
Figure 18
Notes: Binned scatterplot (expected value of inflation expectation for
different values of inflation perception).
Source: Own calculations based on survey data from Statistics Denmark.
-2
0
2
4
6
8
10
12
20
07
20
08
20
09
20
10
20
11
20
12
20
13
20
14
20
15
20
16
Expected inflation (t-12 months)Perceived inflationActual inflation (official CPI)
Per cent, year-over-year
0
2
4
6
8
10
12
14
-5 0 5 10 15 20 25
Perceived inflation, past 12 months, per cent
Expected inflation, coming 12 months, per cent

29
We regress the inflation expectation error on the inflation perception error, controlling for a
number of background characteristics such as income, age, balance sheet position, education and
gender. Even after accounting for the influence of these socioeconomic background characteristics
on inflation expectations, the inflation perception error is a very strong predictor of the inflation
expectation error, cf. Figure 19.
Correlation between inflation perception error and inflation expectation error
Figure 19
Notes: Binned scatterplot (expected value of inflation expectation
error for different values of inflation perception errors). Control
variables: Income, net wealth to income, gross debt to income,
age (quadratic), and indicators of gender, higher education,
and year. The inflation perception error is the difference
between self-assessed inflation and actual household-group-
specific CPI over 12 months before the survey date. The
inflation expectation error is the difference between expected
inflation and actual household-group-specific CPI over 12
months after the survey date.
Source: Own calculations based on survey data from Statistics Denmark.
The strong correlation between inflation perception and inflation expectations may suggest that
households base their inflation expectations on perceived inflation, or at least that respondents
most likely have the same price concept in mind when assessing actual and future inflation. This
implies that it might be informative to interpret the level of households' inflation expectations
relative to the perceived level of inflation. In other words, the difference between households'
inflation expectations and perception may be more informative than the level of inflation
expectations per se.
Let us define the expected change in inflation as the difference between expected inflation for the
coming 12 months and perceived inflation over the past 12 months:
∆πt+1e = πt+1
e − πtp. (1)
The observed (actual) change in the inflation rate is given by:
∆πt+1o = πt+1
o − πto. (2)
The expectation error in terms of the change in inflation rate is then:
∆πt+1e − ∆πt+1
o . (3)
-4
-2
0
2
4
6
8
10
12
14
-10 0 10 20 30
Inflation perception error, percentage points
Inflation expectation error, percentage points

30
The average expected change in inflation rates (Figure 20 – left) is more comparable to the actual
change in inflation than was the case when we compared the expected (and perceived) level of
inflation to the actual level. In all but one year, interpreting inflation expectations in terms of
changes yields more accurate predictions of actual inflation over the following year than
interpreting expectations in terms of the level of inflation, cf. Table 8. Correspondingly, the
distribution of expectation errors in terms of the change in the inflation rate (Figure 20 – right) is
more symmetric and closer to having mean 0 than was the case for the distribution of inflation
perception errors measured in levels. However, even if inflation expectations are more
meaningfully interpreted when measured in changes than in levels, they are still not necessarily
very accurate. The distribution of expectation errors for a naïve forecast of no change in the
inflation rate would have a smaller standard deviation (1.2) than the distribution of actual forecast
errors (3.2).
Expected and actual changes in inflation rates, and distribution of expectation errors Figure 20
Notes: Expected and actual changes are measured as the change in percentage points over the coming 12 months. Trimmed (top and bottom 5 per
cent) means.
Source: Own calculations based on survey data from Statistics Denmark.
-6
-5
-4
-3
-2
-1
0
1
2
3
4
20
07
20
08
20
09
20
10
20
11
20
12
20
13
20
14
20
15
20
16
Expected change in infl. rate
Actual change in infl. rate
Percentage points, year-over-year
0.00
0.05
0.10
0.15
0.20
0.25
0.30
-10 -5 0 5 10
Density
Expectation error, percentage points
Expectation error, change in inflation rateDensity

31
TABLE 8: RMSE for expected inflation levels and changes
CPI
Food inflation
Level Change Level Change
2008 7.07 4.48
7.88 7.32
2009 4.43 5.60
4.98 6.48
2010 4.81 4.56
5.18 5.25
2011 6.58 4.36
6.23 4.52
2012 6.97 4.04
7.21 4.77
2013 6.25 3.97
7.13 4.23
2014 5.63 3.77
5.35 3.88
2015 4.93 3.54
5.07 3.84
2016 4.71 3.32
4.40 3.97 Notes: The table shows Root Mean Squared Errors (RMSE) for inflation
expectations interpreted in levels and changes, respectively. The
expectation error for the level of inflation is the difference between
expected inflation and actual household-group-specific inflation over
12 months after the survey date. The expectation error for the
change in inflation is the difference between expected change in
inflation and actual household-group-specific change in inflation
over 12 months after the survey date, as defined in equation (3). Top
and bottom 5 per cent of expectation errors have been excluded
from the calculations.
The mean expectation error with regard to changes in inflation is -0.7 percentage points.
Restricting the focus to the years after 2011 in which the volatility of changes in inflation rates has
been smaller reduces the mean expectation error to -0.3. We can also compare expected changes
in inflation rates with changes in food price inflation. Changes in food price inflation have been
larger than changes in the CPI – in particular in the beginning of our sample period. The magnitude
of inflation changes is not picked up by expected changes in inflation, but developments are picked
up to a large extent, cf. Figure 21. When comparing expected changes in inflation with changes in
food price inflation, the mean expectation error is smaller than the mean expectation error based
on the CPI, namely -0.5 (-0.3 in the period after 2011). But the variability of expectation errors is
larger when comparing with food price inflation than when comparing with the CPI, cf. Table 8 and
Figure 22.

32
Expected change in inflation and actual change in food price inflation
Figure 21
Source: Own calculations based on trimmed survey data from Statistics
Denmark.
Distribution of expectation errors for change in inflation Figure 22
Notes: Kernel density estimates.
Source: Official household-group-specific CPI: StatBank Denmark. Perceived inflation: Own compilations based on micro data from Statistics Denmark.
The distribution of forecast errors with regard to changes in CPI is somewhat right skewed
because of more households expecting a decline in the inflation rate than the opposite. The mean
expectation in Figure 20 is based on trimmed data, where we have removed top and bottom 5 per
-15
-10
-5
0
5
10
20
07
20
08
20
09
20
10
20
11
20
12
20
13
20
14
20
15
20
16
Expected change in inflation rate
Actual change in food inflation rate
Percentage points, year-over-year
0.00
0.05
0.10
0.15
0.20
-10 -5 0 5 10
Expectation error Expectation error (food)
Density
Percentage points
2008
0.00
0.05
0.10
0.15
0.20
-10 -5 0 5 10
Expectation error Expectation error (food)
Density
Percentage points
2009
0.00
0.05
0.10
0.15
0.20
0.25
0.30
0.35
0.40
-10 -5 0 5 10
Expectation error Expectation error (food)
Density
Percentage points
2010
0.00
0.05
0.10
0.15
0.20
0.25
0.30
0.35
-10 -5 0 5 10
Expectation error Expectation error (food)
Density
Percentage points
2011
0.00
0.05
0.10
0.15
0.20
0.25
0.30
0.35
-10 -5 0 5 10
Expectation error Expectation error (food)
Density
Percentage points
2012
0.00
0.05
0.10
0.15
0.20
0.25
0.30
0.35
0.40
0.45
0.50
0.55
-10 -5 0 5 10
Expectation error Expectation error (food)
Density
Percentage points
2013
0.000.050.100.150.200.250.300.350.400.450.500.550.600.650.700.75
-10 -5 0 5 10
Expectation error Expectation error (food)
Density
Percentage points
2014
0.00
0.05
0.10
0.15
0.20
0.25
0.30
0.35
0.40
0.45
0.50
0.55
0.60
-10 -5 0 5 10
Expectation error Expectation error (food)
Density
Percentage points
2015
0.00
0.05
0.10
0.15
0.20
0.25
0.30
0.35
0.40
0.45
-10 -5 0 5 10
Expectation error Expectation error (food)
Density
Percentage points
2016

33
cent of expected changes in each month. This symmetric trimming procedure seems to be the most
reasonable since no assumptions about 'reasonable' maximum or minimum values for inflation
changes are needed. Using an alternative trimming approach that drops households expecting a
change in the inflation rate outside the range between -10 and +10 percentage points makes
expected and realized changes in inflation rates coincide somewhat more, cf. Figure 23.
Expected change in inflation – different trimming procedures
Figure 23
Source: Own calculations based on trimmed survey data from Statistics
Denmark.
The results above indicate that survey results regarding expected inflation are more meaningfully
interpreted relative to perceived inflation rather than in levels. A corollary to this finding is that one
should be very careful in using the levels of expected inflation from the EU-Harmonised Consumer
Expectations Survey in empirical works.
To assess whether, and how, households adjust their inflation expectations in response to recent
inflation developments, we estimate the following relation:
∆πt+1e = α + δ(πt
o − πt−1o ) + 𝛽𝑥 + 𝜀 (4)
where πto is the inflation rate over the 12 months before the survey date and πt−1
o is the inflation
rate over the 12 months before that. We expect α to be negative, since we know from the previous
results that households in general expect inflation to become lower in the next period than their
perceived inflation level in the current period. A positive value of δ can be interpreted as an
indication that households adjust their expectations in the same direction as recent developments
in inflation, whereas a negative value of δ indicates mean reversion in inflation expectations. Results
using respectively overall CPI inflation and food CPI inflation as independent variables are
presented in Table 9. We do indeed find α to be negative, and we also see that δ is negative and
significant. If inflation has recently increased, households expect this trend to reverse in the future,
and if inflation has recently decreased, households to a larger extent than in other periods expect
that inflation will increase in the future. This mean reversion is an indication that households'
inflation expectations are well-anchored.
-6
-4
-2
0
2
4
Expected change in infl. rate (trim: top and bottom 5%)Expected change in infl. rate (trim: max error +/- 10 pp)Actual change in infl. rate
Percentage points, year-over-year
2007 2008 2009 2010 2011 2012 2013 2014 2015 2016

34
TABLE 9: Adjustment of inflation expectations in response to recent inflation developments (regression results)
(1) (2)
Change in inflation -0.1528***
(0.0158)
Change in food price inflation
-0.0227***
(0.0050)
Constant -1.2418*** -0.7660***
(0.1569) (0.1570)
No of obs. 77,375 77,375
R sq 0.0069 0.0171 Notes: OLS estimation of equation (4). *, ** and *** denotes rejection of the null
hypothesis that the estimated parameter is zero at respectively a 10, 5
and 1-per-cent significance level. The dependent variable is the expected
change in inflation, ∆πt+1e . Top and bottom 1% in terms of income, net
wealth to income and gross debt to income, as well as households with
an absolute inflation perception error of more than 50 percentage points
have been excluded from the estimation sample. Actual change in
inflation and food price inflation are household-group-specific, based on
household income. Control variables: Income, net wealth to income,
gross debt to income, age (quadratic), and indicators of gender, higher
education, and year.
As a final exercise, we will consider the extent to which forecast errors for changes in inflation
vary with household characteristics. Generally, forecast errors for changes in inflation seem to vary
less with household characteristics than inflation perceptions, cf. Table 10. However, some
dimensions, such as education and gender, are still important determinants of forecast errors for
changes in inflation. Regression results in Table 11 broadly confirm this picture; the accuracy of
forecasted changes in inflation is higher among males and increases with household income and
education, as also found by previous studies (e.g. Souleles, 2004). We also find that the accuracy
increases with wealth, but there is no significant correlation between the forecast error for the
change in inflation and consumption-to-income ratios.

35
TABLE 10: Characteristics of households with low and high forecast errors for change in inflation
Forecast error, change in inflation
< -2 pct. points
Between -2 and +2 pct.
points > 2 pct. points
After-tax income (DKK, median) 371,983 421,446 415,234
Gross debt to income (%, median) 191.2% 204.7% 207.4%
Net wealth to income (%, median) 119.7% 134.8% 129.3%
Household has negative net wealth (share) 26.2% 24.1% 25.1%
Loan-to-value ratio (only homeowners, median) 65.5% 66.7% 66.8%
Consumption to income (%, median) 95.9% 94.1% 95.1%
Age (years, median) 49 49 48
Higher education (share) 25.9% 34.3% 31.3%
Women (share) 56.8% 48.5% 45.5%
Tenants (share) 33.3% 30.1% 29.6%
Self-employed (share) 7.3% 7.4% 8.2%
Household has unemployed adult members (share) 7.4% 7.1% 6.9%
Household has moved during past 3 years 16.7% 17.4% 17.8%
Household got children during past 3 years 8.3% 8.9% 9.3%
Bought or sold real estate (share) 4.4% 5.3% 5.2%
Bought a car (share) 21.9% 22.0% 23.1%
Household has interest only mortgage loan (share) 45.6% 44.8% 45.4%
Household has variable rate mortgage loan (share) 59.2% 61.0% 60.4%
Household owns stocks and mutual fund shares > 50,000 DKK (share) 16.2% 21.0% 18.6%
Respondent employed within finance (share) 2.8% 4.3% 3.8%
Respondent employed within business services (share) 8.8% 10.1% 9.3%
Respondent employed within information and communication (share) 2.8% 4.0% 3.9%
Respondent employed within retail trade (share) 7.5% 6.4% 6.9%
Respondent employed in public sector (share) 39.4% 36.5% 34.8%
North Jutland Region 11.2% 10.6% 11.1%
Middle Jutland Region 23.3% 23.9% 23.5%
Southern Region 22.8% 22.1% 23.2%
Capital Region 27.4% 29.2% 27.5%
Region Zealand 15.3% 14.2% 14.7%
Optimists (own future financial situation) (share) 27.1% 26.9% 29.2%
Pessimists (own future financial situation) (share) 12.9% 12.3% 12.8%
Positive assessment of own current financial situation (share) 20.9% 22.8% 25.2%
Negative assessment of own current financial situation (share) 21.9% 18.4% 17.7%
Optimists (macroeconomic situation) (share) 35.4% 39.0% 37.1%
Pessimists (macroeconomic situation) (share) 24.1% 19.9% 26.1%
Optimists (aggregate unemployment) (share) 26.1% 31.8% 28.9%
Pessimists (aggregate unemployment) (share) 39.7% 31.5% 37.7%
Thinks now is a good time to purchase durables (share) 18.7% 18.5% 23.1%
Thinks it is better to postpone purchasing durables (share) 32.2% 22.6% 27.1%
Number of observations 34,456 52,210 15,552
Notes: Income, net wealth, gross debt, loan-to-value ratio, consumption, self-employed, loan characteristics as well as car and house purchase are
measured at the household level, while remaining characteristics and responses are those of the respondent. Consumption is imputed as in
Abildgren et al. (2018).

36
TABLE 11: Determinants of absolute forecast error for change in inflation (regression results)
(1) (2) (3) (4) (5) (6)
Income -0.0014*** -0.0009*** -0.0009*** -0.0009*** -0.0010*** -0.0010***
(0.0001) (0.0001) (0.0001) (0.0001) (0.0001) (0.0001)
Net wealth to income -0.0227*** -0.0402*** -0.0376*** -0.0381*** -0.0419*** -0.0422***
(0.0047) (0.0046) (0.0050) (0.0047) (0.0049) (0.0061)
Gross debt to income 0.0171** 0.0126* 0.0069 0.0102 0.0145* 0.0162*
(0.0068) (0.0066) (0.0075) (0.0066) (0.0075) (0.0089)
Age -0.0272*** -0.0534*** -0.0548*** -0.0550*** -0.0545*** -0.0597***
(0.0064) (0.0062) (0.0064) (0.0062) (0.0064) (0.0084)
Age squared 0.0001* 0.0005*** 0.0005*** 0.0005*** 0.0005*** 0.0005***
(0.0001) (0.0001) (0.0001) (0.0001) (0.0001) (0.0001)
Higher education -0.5856*** -0.5397*** -0.5188*** -0.5466*** -0.5308*** -0.5359***
(0.0370) (0.0361) (0.0368) (0.0361) (0.0375) (0.0488)
Woman 0.3752*** 0.3868*** 0.4096*** 0.3930*** 0.3941*** 0.4427***
(0.0332) (0.0324) (0.0331) (0.0325) (0.0335) (0.0436)
Borrower
0.1050**
(0.0512)
Purchased real estate
-0.0927
(0.0894)
Purchased a car
0.0644*
(0.0391)
Consumption to income
-0.0083
(0.0267)
Optimistic
0.2766***
(0.0383)
Pessimistic
0.1463*** -0.0757
(0.0516) (0.0943)
Increase in real income
0.0240
(0.0483)
Overpessimistic
0.1752
(Pessimistic * Increase in real income) (0.1332)
Year fixed effects No Yes Yes Yes Yes Yes
No of obs. 81,195 81,195 76,732 76,708 80,728 51,128
R sq 0.0133 0.0612 0.0624 0.0602 0.0620 0.0459 Notes: OLS estimation. *, ** and *** denote rejection of the null hypothesis that the estimated parameter is zero at respectively a 10, 5
and 1 per cent significance level. The dependent variable is the absolute value of forecast error for changes in inflation. Top
and bottom 1 per cent in terms of income, net wealth to income and gross debt to income, as well as households with an
absolute inflation perception error of more than 50 percentage points have been excluded from the estimation sample. The
household-group-specific inflation rates used are those based on household income. Income, net wealth, gross debt, borrower,
car and house purchase and consumption are measured at the family level, while age, gender, education and sentiment are
those of the respondent. Borrower refers to a household whose liabilities exceed its liquid financial assets. Consumption is
imputed as in Abildgren et al. (2018b). Due to properties of the imputation procedure, model (4) only includes households that
are not involved in a real estate transaction in the given year, and top and bottom 1 per cent of households in terms of
consumption to income are excluded from the estimation sample.
6. Survey design
Earlier research has suggested that the overestimation bias in the EU-Harmonised Consumer
Expectations Surveys might be partly related to the use of open-ended questions (no guidance on
the current or typical rate of inflation offered to the survey participants) and a lack of probing of
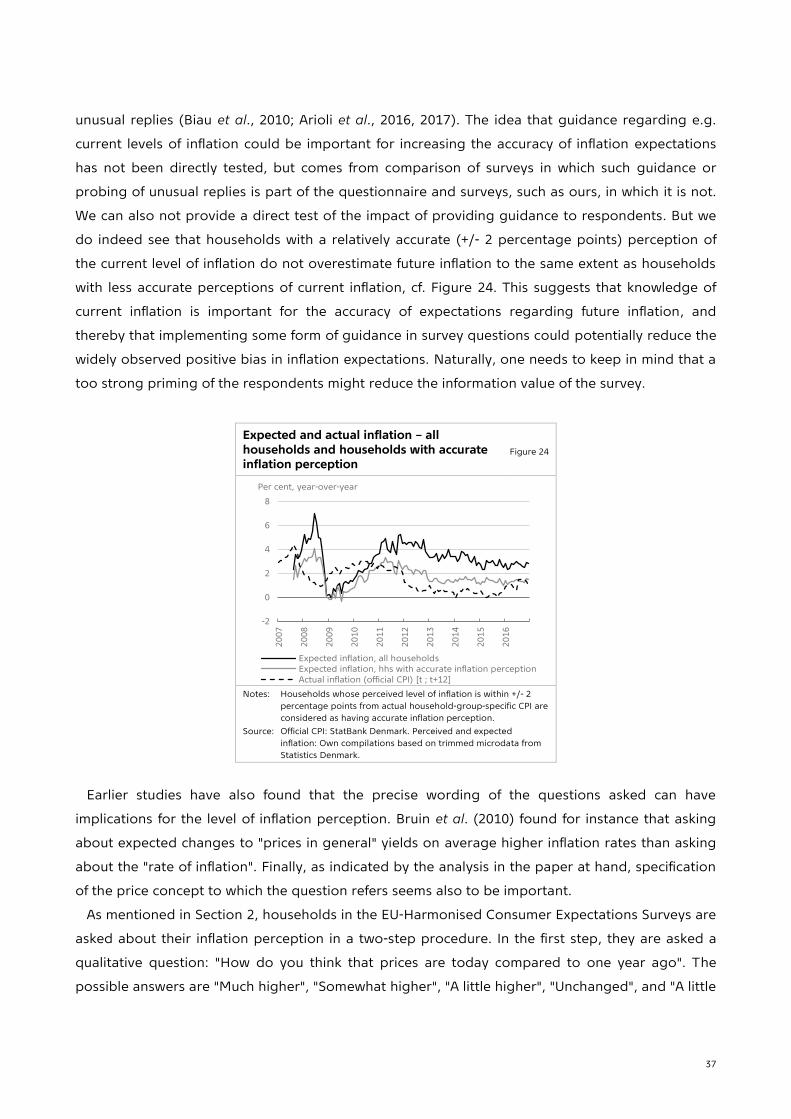
37
unusual replies (Biau et al., 2010; Arioli et al., 2016, 2017). The idea that guidance regarding e.g.
current levels of inflation could be important for increasing the accuracy of inflation expectations
has not been directly tested, but comes from comparison of surveys in which such guidance or
probing of unusual replies is part of the questionnaire and surveys, such as ours, in which it is not.
We can also not provide a direct test of the impact of providing guidance to respondents. But we
do indeed see that households with a relatively accurate (+/- 2 percentage points) perception of
the current level of inflation do not overestimate future inflation to the same extent as households
with less accurate perceptions of current inflation, cf. Figure 24. This suggests that knowledge of
current inflation is important for the accuracy of expectations regarding future inflation, and
thereby that implementing some form of guidance in survey questions could potentially reduce the
widely observed positive bias in inflation expectations. Naturally, one needs to keep in mind that a
too strong priming of the respondents might reduce the information value of the survey.
Expected and actual inflation – all households and households with accurate inflation perception
Figure 24
Notes: Households whose perceived level of inflation is within +/- 2
percentage points from actual household-group-specific CPI are
considered as having accurate inflation perception.
Source: Official CPI: StatBank Denmark. Perceived and expected
inflation: Own compilations based on trimmed microdata from
Statistics Denmark.
Earlier studies have also found that the precise wording of the questions asked can have
implications for the level of inflation perception. Bruin et al. (2010) found for instance that asking
about expected changes to "prices in general" yields on average higher inflation rates than asking
about the "rate of inflation". Finally, as indicated by the analysis in the paper at hand, specification
of the price concept to which the question refers seems also to be important.
As mentioned in Section 2, households in the EU-Harmonised Consumer Expectations Surveys are
asked about their inflation perception in a two-step procedure. In the first step, they are asked a
qualitative question: "How do you think that prices are today compared to one year ago". The
possible answers are "Much higher", "Somewhat higher", "A little higher", "Unchanged", and "A little
-2
0
2
4
6
8
20
07
20
08
20
09
20
10
20
11
20
12
20
13
20
14
20
15
20
16
Expected inflation, all householdsExpected inflation, hhs with accurate inflation perceptionActual inflation (official CPI) [t ; t+12]
Per cent, year-over-year

38
lower". In the second step, conditional on not having answered "Unchanged", respondents are
asked a quantitative question: "By how many per cent do think that prices have gone up/down
over the past 12 months?". It is notable that "Unchanged" is not in the center of the five-point scale
in step one but only number four. It could be an interesting subject for field research to explore
whether this scale implies an upward bias in inflation perceptions relative to a using a five-point
scale where "Unchanged" is located in the middle of the possible answers.
7. Final remarks
Two main conclusions emerge from the study based on the Danish part of the EU-Harmonised
Consumer Expectations Survey (CES) linked to rich microdata from Danish administrative registers.
First, the inflation perception bias is a very broad-based characteristic across household types,
and accounting for even several of the factors traditionally believed to contribute to the bias is not
sufficient to reduce it much. Earlier research has indicated that households pay more attention to
price increases than price decreases, which might partly explain the inflation perception bias.
Second, one should be very careful in using the levels of expected inflation from the EU-
Harmonised CES in empirical works. Expected changes in inflation rates from the survey seem much
more meaningful and easier to interpret than the expected future levels of inflation.
However, there are still substantial outliers that need to be addressed, and changes to the survey
design might be a way forward for the inflation part of the EU-Harmonised CES rather than
focusing on various metrically trimmed measures. For example, respondents may need more
guidance on the current or typical rate of inflation, and additional probing of unusual replies may
be needed. Furthermore, specification of the price concept to which the question refers seems also
to be important. The widespread bias in households' inflation perceptions and expectations might
also indicate a more general need for enhanced communication by monetary authorities and
statistical agencies regarding the rather abstract concept of "inflation".
References
Abildgren, Kim, Niels Lynggård Hansen and Andreas Kuchler (2018), Overoptimism and house price bubbles, Journal of Macroeconomics, Vol. 56, pp. 1-14.
Abildgren, Kim, Andreas Kuchler, America Solange Lohmann Rasmussen and Henrik Sejerbo Sørensen (2018), Consistency between household-level consumption data from registers and surveys, Danmarks Nationalbank Working Paper, no. 131.
Arioli, Rodolfo, Colm Bates, Heinz Dieden, Ioana Duca, Roberta Friz, Christian Gayer, Geoff Kenny, Aidan Meyler and Iskra Pavlova (2016), EU consumers' quantitative inflation perceptions and expectations: an evaluation, European Commission European Economy Discussion Papers, No. 38, November.
Arioli, Rodolfo, Colm Bates, Heinz Dieden, Ioana Duca, Roberta Friz, Christian Gayer, Geoff Kenny, Aidan Meyler and Iskra Pavlova (2017), EU consumers' quantitative inflation perceptions and expectations: an evaluation, ECB Occasional Paper Series, No. 186, April.
Armantier, Olivier, Wändi Bruine de Bruin, Simon Potter, Giorgio Topa, Wilbert van der Klaauw and Basit Zafar (2013), Measuring Inflation Expectations, Annual Review of Economics, Vol. 5, pp. 273-301.

39
Axelrod, Sandor, David Lebow and Ekaterina Peneva (2018), Perceptions and Expectations of Inflation by U.S. Households, Federal Reserve Board Finance and Economics Discussion Series, No. 73, October.
Badarinza, Cristian and Marco Buchmann (2009), Inflation perceptions and expectations in the Euro Area: The role of news, European Central Bank Working Paper, No. 1088, September.
Biau, Olivier, Heinz Dieden, Gianluigi Ferrucci, Roberta Friz and Staffan Lindén (2010), Consumers' quantitative inflation perceptions and expectations in the euro area: an evaluation, paper presented at the Federal Reserve Bank of New York Conference on Consumer Inflation Expectations, November 18-19.
Bosworth, Barry P., Robert J. Gordon, Karin E. Moses and Brent R. Moulton (1997), Addressing the Quality Change Issue in the Consumer Price Index, Brookings Papers on Economic Activity, Vol. 1997(1), pp. 305-366.
Binder, Carola Conces (2018), Inflation expectations and the price at the pump, Journal of Macroeconomics, Vol. 58, pp. 1-18.
Bruin, Wändi Bruine de, Wilbert van der Klaauw, Simon Potter, Robert Rich and Giorgio Topa (2010), Improving Survey Measures of Household Inflation Expectations, FRBNY Current Issues in Economics And Finance, Vol. 16(7), pp. 1-7.
Bruin, Wändi Bruine de, Wilbert van der Klaauw, Giorgio Topa, Julie S. Downs, Baruch Fischhoff and Olivier Armantier (2012), The effect of question wording on consumers' reported inflation expectations, Journal of Economic Psychology, Volume 33, Issue 4, pp. 749-757.
Brachinger, Hans Wolfgang (2008), A new index of perceived inflation: Assumptions, method, and application to Germany, Journal of Economic Psychology, Vol. 29(4), pp. 433–457.
Bryan, Michael F. and Guhan Venkatu (2001a), The Demographics of Inflation Opinion Surveys, Federal Reserve Bank of Cleveland Economic Commentary, October.
Bryan, Michael F. and Guhan Venkatu (2001b), The Curiously Different Inflation Perspectives of Men and Women, Federal Reserve Bank of Cleveland Economic Commentary, November.
Cepparulo, Alessandra, Francesca Gastaldi, Paolo Liberati and Elena Pisano (2012), Relative price changes and households' welfare in Italy, Review of Income and Wealth, Vol. 58(4), pp. 675–714.
D'Acunto, Francesco, Ulrike Malmendier, Juan Ospina and Michael Weber (2019), Exposure to Daily Price Changes and Inflation Expectations, NBER Working Paper, No. 26237, September.
Döhring, Björn and Aurora Mordonu (2007), What drives inflation perceptions? A dynamic panel data analysis, European Economy Economic Papers, No. 284, July.
Diamondy, Jess, Kota Watanabez and Tsutomu Watanabe (2019), The Formation of Consumer Inflation Expectations: New Evidence From Japan's Deflation Experience, Bank of Japan Working Paper Series, No. E-13, August.
D'Acunto, Francesco, Daniel Hoang, Maritta Paloviita and Michael Weber (2019), Cognitive abilities and inflation expectations, American Economic Review Papers and Proceedings, forthcoming.
Duffy, David and Peter D. Lunn (2009), The Misperception of Inflation by Irish Consumers, Economic and Social Review, Vol. 40(2), pp. 139–163.
Ehrmann, Michael, Damjan Pfajfar and Emiliano Santoro (2017), Consumers' Attitudes and Their Inflation Expectations, International Journal of Central Banking, Vol. 13(1), pp. 225-259.
European Commission (2014), Highlight I: Inflation perceptions and expectation dynamics in the EU: evidence from BCS survey data, European Business Cycle Indicators, 3rd quarter, pp. 7-12.
European Commission (2019), New data set on consumers' quantitative estimates of past and expected inflation in the euro area and the EU, European Business Cycle Indicators, 1st quarter, pp. 17-22.
Eurostat (2017), Glossary: Frequent out-of-pocket purchases (FROOPP), Statistics Explained, 1 June. Falck, E., M. Hoffmann and P. Hürtgen (2019), Disagreement about Inflation Expectations and
Monetary Policy Transmission, Journal of Monetary Economics, forthcoming (doi: https://doi.org/10.1016/j.jmoneco.2019.08.018).
Georganas, Sotiris, Paul J. Healy and Nan Li (2014), Frequency bias in consumers' perceptions of inflation: An experimental study, European Economic Review, Vol. 68, pp. 144-158.
Goldfayn-Frank, Olga and Johannes Wohlfart (2019), Expectation formation in a new environment: Evidence from the German reunification, Journal of Monetary Economics, forthcoming.

40
Hagemann, Robert P. (1982), The Variability of Inflation Rates across Household Types, Journal of Money, Credit and Banking, Vol. 14(4,1), pp. 494–510.
Hobijn, Bart and David Lagakos (2005), Inflation inequality in the United States, Review of Income and Wealth, Vol. 51(4), pp. 581–606.
Huber, Odilo W. (2011), Frequency of price increases and perceived inflation. An experimental investigation, Journal of Economic Psychology, Vol. 32, pp. 651–661.
Jonung, Lars (1981), Perceived and Expected Rates of Inflation in Sweden, American Economic Review, Vol. 71(5), pp. 961-968.
Jonung, Lars and David Laidler (1988), Are Perceptions of Inflation Rational? Some Evidence for Sweden, American Economic Review, Vol. 78(5), pp. 1080-1087.
Kahneman, Daniel and Amos Tversky (1984), Choices, Values, and Frames, American Psychologist, Vol. 39(4), 341-350.
Lamla, Michael J. and Sarah M. Lein (2015), Information rigidities, inflation perceptions, and the media: lessons from the euro cash changeover, Economic Inquiry, Vol. 53(1), pp. 9-22.
Lamlaz, Michael J., Damjan Pfajfar and Lea Rendell (2019), Inflation and deflationary biases in inflation expectations, BIS Working Papers, No 789, June.
Larsen, Martin Birger (2016), Seniorer har haft de højeste prisstigninger, DST Analyse, No. 26, December.
Lein, Sarah M. and Thomas Maag (2011), The formation of inflation perceptions: Some empirical facts for European countries, Scottish Journal of Political Economy, Vol. 58(2), pp. 155-188.
Lindén, Staffen (2005), Quantified Perceived and Expected Inflation in the Euro Area – How Incentives Improve Consumers Inflation Forecasts, paper presented at the joint European Commission – OECD workshop on international development of business and consumer tendency surveys, Brussels, 14 – 15 November.
Lusardi, Annamaria and Olivia S. Mitchell (2014), The Economic Importance of Financial Literacy: Theory and Evidence, Journal of Economic Literature, Vol. 52(1), pp. 5–44.
Łyziak, Tomasz, Maritta Paloviita and Ewa Stanisławska (2019), Assessing reliability of aggregated inflation views in the European Commission consumer survey, Bank of Finland Research Discussion Papers, No. 10, July.
Malmendier, Ulrike and Stefan Nagel (2016), Learning from Inflation Experiences, Quarterly Journal of Economics, Vol. 131(1), pp. 53-87.
Michael, Robert T. (1979), Variation Across Households in the Rate of Inflation, Journal of Money, Credit, and Banking, Vol. 11(1), pp. 32–46.
Mile, Ibolya (2009), HICP — Frequent out-of-pocket purchases. A new special aggregate, Eurostat Statistics in Focus, Vol. 15, pp. 1-7.
Palmqvist, Stefan and Lena Strömberg (2004), Households' inflation opinions – a tale of two surveys, Sveriges Riksbank Economic Review, Vol. 2004(4), pp. 23-42.
Souleles, Nicholas S. (2004), Expectations, heterogeneous forecast errors and consumption: Micro evidence from the Michigan Consumer Sentiment Surveys, Journal of Money, Credit, and Banking, Vol. 36(1), pp. 39-72.
Statistics Denmark (2016a), Documentation of statistics for Consumer Expectations Survey 2016 Month 10, Copenhagen: Statistics Denmark.
Statistics Denmark (2016b), Documentation of statistics for Consumer Price Index 2016 Month 12, Copenhagen: Statistics Denmark.
Stanislawska, Ewa (2019), Consumers' Perception of Inflation in Inflationary and Deflationary Environment, Journal of Business Cycle Research, Vol. 15(1), pp 41–71.
Woodford, Michael (2003), Interest and Prices. Princeton, NJ: Princeton University Press.

41
W O R K I N G P A P E R — D A N M AR K S N A T IO N A L B A N K
4 N O V E M B ER 20 19 — N O . 14 4