revisiting incentive effects in workers’ compensation: do
TRANSCRIPT

Revisiting Incentive Effects in Workers’ Compensation: Do Higher
Benefits Really Induce More Claims?∗
Erin Todd Bronchetti and Melissa P. McInerney†
April 2011
Abstract
This paper provides new evidence on incentive effects in state workers’ compensa-
tion (WC) programs. We show that conclusions about the importance of labor supply
disincentives in WC differ dramatically depending on how we control for the confound-
ing influence of an individual’s past earnings. Within an empirical framework that
follows previous work, we estimate benefit elasticities consistent with previously pub-
lished results (0.4-0.5). However, expanded specifications that include flexible earnings
controls yield an elasticity smaller than 0.1, a result corroborated by estimates of the
responsiveness of WC claims to legislated WC benefit parameters. Moreover, our evi-
dence reveals important differences in the relationship between WC benefits and WC
receipt across quartiles of the earnings distribution. Finally, we find that WC receipt
was less responsive to benefit variation during the 1990s.
∗Forthcoming in Industrial Labor and Relations Review. We are very grateful to Dan Hamermeshand two anonymous referees for helpful comments and guidance. We also thank Bruce Meyer, ChrisTaber, Judy Hellerstein, Mark Duggan, Bill Evans, Jonah Gelbach, Dennis Sullivan, Tom Dee,Philip Jefferson, and Bill Even for helpful conversations and suggestions. We thank Dan Feenbergat the NBER for the use of his TAXSIM model to simulate state and federal marginal tax rates forindividuals in our sample (www.nber.org/˜taxsim). All errors are, of course, our own.
†Bronchetti: Department of Economics, Swarthmore College, 500 College Avenue, Swarthmore,Pennsylvania, 19081, [email protected]. McInerney: Department of Economics, Collegeof William and Mary, P.O. Box 8795, Williamsburg, Virginia, 23187, [email protected].

Social insurance programs that provide income support during periods of non-work generate
concern among economists because of the labor supply disincentives inherent in their design.
State workers’ compensation (WC) programs, which provide cash benefits and cover medical
costs for workers who are injured or become ill on the job, are no exception. A substantial
literature exists examining the effects of variation in WC cash benefits on injury rates, claims
numbers, and the duration of claims.1
This study revisits the question of incentive effects in WC, using 25 years of matched March
Current Population Survey (CPS) data to estimate the relationship between WC cash benefit
generosity and the frequency of WC receipt. Krueger (1990) used data from two years in the
1980s to document a large elasticity of WC receipt with respect to benefits (0.74), a widely cited
parameter. In general, the prevailing understanding is that worker participation in the program
is quite responsive to changes in benefit generosity. Yet, closer inspection of this literature
suggests no real consensus on the magnitude or economic significance of this response.2
We contribute to the literature in several ways. First, we use matched March CPS data
spanning from 1977/78 to 2003/04 to provide an estimate of the elasticity of WC receipt with
respect to benefits based on the longest nationally-representative set of micro data ever used to
study WC. Existing research proffers a wide range of estimates of the effect of variation in WC
benefits on injury/claim rates, but most of this research relies on the use of aggregated state-
level (or state-by-industry-level) data. The few studies that employ nationally-representative,
individual-level data focus primarily on data from the 1980s. An updated estimate of this
relationship is warranted given dramatic changes in WC trends since 1990.
1 Fortin and Lanoie (1998) and Krueger and Meyer (2002) provide thorough reviews.2 The existing literature on the relationship between WC receipt and benefit levels provides evidenceof a positive relationship, with 0.18 (Hirsch et al., 1997) being the lowest estimated benefit elasticity.The extant work on the responsiveness of injury rates to variation in WC benefits provides estimatedelasticities ranging from zero (Guo and Burton, 2010) to over 1.0 (Butler and Worrall, 1983).
1

A key contribution of this study is to improve upon the methodology used in previous
research to better control for differences in propensities to claim WC among individuals with
different pre-injury earnings. Because weekly WC benefits are a function of a worker’s average
weekly earnings in the year before injury, carefully controlling for the influence of prior earnings
on WC participation is crucial for unbiased estimation of the benefit elasticity. We show that
typical methods of accounting for pre-injury earnings are not sufficient and that including more
flexible controls for the influence of past earnings on the probability of WC receipt dramatically
reduces the estimated relationship between benefit levels and program participation. In fact,
when we control for differences in propensities to claim WC among individuals with different
earnings using either a simple linear spline in pre-injury earnings or a series of indicator variables
for different points on the earnings distribution, variation in benefit generosity appears to have
little to no impact on the likelihood of WC receipt. These results are clearly in contrast to the
prevailing wisdom that workers are highly responsive to changes in WC generosity and suggest
that labor supply disincentives (or ‘moral hazard’) in WC may not warrant as much concern as
previously thought. Our findings could also have important implications for empirical analyses
of other social insurance programs in which benefits are a direct function of previous earnings.
We also contribute to the literature by examining the effects of changes in legislated program
parameters, which policymakers can directly influence and which may be more salient to workers.
We find no evidence of increased claiming when key WC parameters (i.e., the minimum benefit,
the maximum benefit, and the replacement rate) become more generous. Consistent with our
other findings, this suggests that perhaps policymakers can increase program generosity at a
lower cost than suggested by previous estimates.
Finally, between 1990 and 2003, the share of workers beginning to receive WC cash benefits
2
dropped in half. The literature provides suggestive evidence that workers were less responsive
to changing benefit levels after 1990. Yet it is unclear whether the relationship between WC
participation and cash benefit levels changed over time or whether the disparate results are a
product of different methodologies.3
Incorporating individual-level data from the 1990s and early 2000s, we help answer this
question. This complements the research of Guo and Burton (2010), who estimate the relation-
ship between WC benefits and state-level injury rates for the pre-1990 and post-1990 periods.
Some of our findings are similar; we both estimate a benefit elasticity that is closer to zero than
in previous research. However, once we flexibly control for an individual’s prior earnings, we
document a substantial decline in responsiveness to benefits in the post-1990 period.
Background on Workers’ Compensation
State WC programs comprise the oldest and one of the largest forms of social insurance in the
United States. WC laws require that firms obtain insurance (or self-insure) to provide a state-
mandated amount of cash benefits, medical care, and rehabilitation services, when necessary,
to workers who become injured or ill on the job. Coverage extends to almost 94 percent of the
American wage and salaried workforce, and a worker becomes eligible to receive WC as soon as
he enters covered employment.
While in recent years researchers have paid somewhat less attention to WC than other social
insurance programs, the importance of WC for workers and employers cannot be denied. In
2008, $57.6 billion were paid in WC benefits (including medical costs), and employer costs for
3 Ruser et al. (2004) and Neuhauser and Raphael (2004) estimate a smaller relationship between cashbenefit levels and WC participation. However, their outcome of interest is WC take-up, conditional onan injury, not the overall responsiveness of WC participation to changes in benefits.
3

WC amounted to $78.9 billion (Sengupta et al., 2010).4 As a source of support for disabled
workers, WC is surpassed only by Social Security disability insurance and Medicare. Throughout
the 1990s and early 2000s, WC was larger than unemployment insurance (UI), Supplemental
Security Income, cash welfare, or food stamps in terms of expenditures (Green Book, 2004).
Workers’ Compensation Benefits and Incentives for Workers
There is substantial variation across states in the legislated parameters that determine WC
benefits. However, ‘temporary total disability’ (TTD) benefits, the focus of this study, are
calculated similarly across all states. An injured worker’s weekly TTD benefit will equal a
fraction (the replacement rate, typically two thirds) of the worker’s pre-injury gross weekly
earnings, subject to minimum and maximum benefit amounts that vary significantly across
states. Most states’ TTD benefit schedules are similar to California’s, awarding workers with
earnings less than the state minimum ($126 in California) their full weekly earnings. Those
earning between $126 and $189 per week receive the minimum benefit of $126. Most injured
workers receive two thirds of their pre-tax weekly earnings, while workers with weekly earnings
above $903 receive the maximum, $602. A smaller number of states set a “true minimum”
benefit. For example, in Ohio, workers earning less than the minimum benefit of $214 receive a
weekly benefit equal to $214, regardless of how low their pre-injury earnings were.5
State-determined waiting periods range from 3 to 7 days and act as a ‘deductible’ that
workers must pay before receiving indemnity benefits. Workers are later compensated for this
time if their injury persists beyond the retroactive period, usually a few weeks.
4 Of the $57.6 billion in total benefits paid out to workers, about half went to indemnity benefits, whilethe remainder went to medical costs.
5 A few states, like Colorado, have a $0 minimum, so that all workers are paid two thirds of their averagepre-injury wage up to the maximum benefit level. Even less common are TTD schedules like Hawaii’s,in which there are two effective minimum benefit levels.
4

Table 1 displays, for a representative set of states, variation in legislated benefit parameters,
waiting and retroactive periods, and measures of state WC generosity for the CPS sample used
in our analysis. In most states, the rate of wage replacement provided by WC benefits is
two thirds; however, in some states (e.g., Connecticut and Iowa), replacement rates are higher
because benefits are calculated as a percentage of ”spendable” (after-tax) earnings.
The most important source of cross-state variation in benefit generosity is the maximum
benefit level. For instance, while Illinois has a maximum weekly benefit of $1004, in the same
year, injured workers in New York received a maximum of $400 per week. Whereas only 12
percent of Illinois workers in our sample have earnings high enough to be subject to their state’s
maximum benefit, 55.5 percent of New York workers would be subject to its $400 maximum.
Nominal replacement rates can be significantly lower than two thirds in states with low maximum
benefit levels (e.g., Mississippi) and higher than two thirds in states with high minimum benefit
levels (e.g., Pennsylvania).
Unlike UI benefits, WC cash benefits are exempt from income or payroll taxation, which can
imply a much more generous after-tax replacement rate. In fact, after-tax replacement rates
near or above one are not uncommon (Meyer, 2002), and average after-tax replacement rates
are above 90 percent in some states (e.g., Ohio and Pennsylvania).
The primary policy levers available to states to alter WC benefits include changes in the
level of the maximum, the minimum, and the replacement rate. The most common changes in
legislated benefit generosity are increases and decreases in the maximum and minimum. States
can also change the replacement rate, which corresponds to the sloped portion of the benefit
schedule. These types of changes are much less common but impact a large share of workers.6
6 Between 1978 and 2004, we document only 8 instances of increases in the replacement rate (generallyfrom 66.67 to 70 percent, or 60 to 66.7 percent) and 5 instances of decreases in the replacement rate.
5

As seen in Figure 1, aggregate generosity increased between 1977 and 2003, with the average
nominal replacement rate rising from 0.56 in 1977 to 0.61 in 2003. This increase reflects changes
in the maximum, minimum, replacement rate, and earnings distribution.
Changes in WC benefits can impact the frequency of WC receipt by altering the incentives of
both workers and employers. At the employee level, increased benefit generosity reduces the cost
of an injury and may cause workers to devote less effort to on-the-job safety or illness prevention.
Several earlier studies provide evidence of a positive relationship between WC benefits and the
frequency of non-fatal workplace injuries and illnesses.7 However, in recent work, Guo and
Burton (2010) find an estimated benefit elasticity that is much closer to zero using aggregate
state-level data on injury rates from the Bureau of Labor Statistics (BLS). Increases in WC
benefits may also lead to more frequent fraudulent reporting of injuries or illnesses that do not
exist or occurred outside of work.8
Even if benefit generosity does not impact workplace safety or increase fraudulent reporting
of injuries and illnesses, more generous benefits can cause more WC claims by increasing take-up
among injured workers. When benefits are higher, the benefits of filing for WC are more likely
to outweigh the costs, which include forgone labor income, transaction costs to filing a claim,
and any stigma or costly reputation effect of receiving WC.9
Regardless of the dimension along which benefit variation affects worker behavior, the pre-
diction of a positive relationship between benefits and WC receipt is unambiguous.
7 See, e.g., Chelius (1982), Ruser (1985, 1991), Moore and Viscusi (1989), Worrall and Butler (1988).8 The evidence on the extent of fraudulent reporting in WC is mixed (see Smith (1990), Butler and Worrall(1991), Card and McCall (1996), and Ruser (1998)).
9 See Biddle and Roberts (2003), Neuhauser and Raphael (2004), Ruser et al. (2004), and Lakdawalla etal. (2005) for studies that address the responsiveness of take-up to variation in benefits.
6

Workers’ Compensation Costs and Incentives for Firms
The premiums paid by firms who purchase WC insurance are an increasing function of the risk
involved in the employer’s business (base premium) and the employer’s loss history (experience
rate). The smallest employers pay the base premium, and WC premiums are experience rated for
larger or riskier employers. In the largest firms, premiums are almost perfectly experience-rated,
essentially reflecting only firms’ past losses (Krueger, 1991).
With experience-rated WC premiums, higher benefit levels increase the costs associated with
a firm’s accident experience. Taking the safety effort of employees as given, a firm has more
incentive to increase spending on safety (or to discourage claims) when benefits rise.10 Thus,
if only firm behavior was affected by increases in WC benefits, we would expect a negative
relationship between benefits and WC claims. However, the existing evidence suggests that the
effects of higher benefits on worker behavior outweigh those for firms.11,12
Finally, note that if benefit variation has no (or perfectly offsetting) incentive effects on
the behavior of workers and firms, insurance costs should rise in direct proportion to benefits.
Krueger and Burton (1990) find the cost-benefit elasticity to be greater than unity but smaller
than previous estimates of the claims-benefit elasticity would suggest. This implies that increases
in WC benefits induce claims for less costly impairments and/or that existing estimates of the
benefit elasticity overstate the true relationship between benefit generosity and WC receipt.
The empirical relationship between WC benefits and the rate of participation in WC incor-
porates all of the incentive effects for workers and firms just described. Several studies have
documented a positive elasticity between benefits and the overall frequency of claims. Like
10Indeed, Chelius and Smith (1983), and Ruser (1985, 1991) provide evidence of a smaller relationshipbetween benefits and nonfatal injury rates for larger, more highly experience-rated firms.
11See Chelius (1982), Worrall and Butler(1988), and Ruser (1985, 1991).12Of course, insurers also face incentives. In this context, insurer and employer incentives are quite similar.
7

these studies, we make no attempt to separately identify the effects of benefit variation on the
behavior of workers and firms. Rather, the underlying argument is that the policy parameter
of interest is the impact of changes in legislated WC benefits on the overall rate of WC receipt,
since policymakers can affect statutory benefits but cannot directly influence decisions about
safety or take-up.
Trends in Workers’ Compensation
Figure 2 displays the frequency of WC receipt by year for the CPS sample used in this study.
For 1977 through 1989, recipiency rates ranged from 1.4 to 2.0 percent of the population, but
after 1990, a clear pattern of declining WC receipt emerges, with the participation rate dropping
as low as 0.7 percent. Some of this decline may reflect that workplaces became safer: The injury
rate fell in every industry, and there was a shift in employment toward safer industries.
During this same time period, both the average maximum WC benefit and the average
nominal replacement rate rose substantially, as shown in Figure 1. At a cursory glance, this
observation is in stark contrast to the conventional wisdom that WC receipt increases with
program generosity.
Data
Our data come from the March Annual Demographic Supplement to the CPS, which contains
extensive information on sources of income, demographic characteristics, and employment. The
two-year panel nature of the March CPS is especially useful for our study, which analyzes
transitions into WC, where the dependent variable is the probability of receiving WC in year t
8

conditional on not having received benefits in year t − 1.13 Moreover, detailed information on
earnings and employment in the year prior to WC receipt permits the estimation of participation
elasticities with respect to both benefits and pre-injury wages.14
Our sample pools together data on individuals from twenty-five years of matched March CPS
files for the survey years 1977/78-1984/85, 1986/87-1994/95, and 1996/97-2003/04.15 To match
observations across years, we adapt the methodology in Madrian and Lefgren (1999).16 The
resulting data set observes each individual in two consecutive years.
The final sample contains individuals ages 18 - 64 (in year t−1) who report having worked at
least one week in year t−1 but did not receive WC benefits in that year. We restrict the sample
to heads of household and spouses because the relationship between WC benefit generosity and
WC receipt may be fundamentally different for a teenager or an elderly parent.17 We limit the
sample to civilians working in non-public, non-self-employed jobs in year t − 1. We exclude
workers in the agriculture or domestic services industries, sectors which are not likely to be
covered by WC, and railroad workers, longshoremen, harbor workers, and seamen because they
are likely to be covered under federal programs. We also exclude individuals in states in which
benefits are based on “spendable earnings” instead of pre-tax labor earnings. The pooled sample
13CPS respondents are interviewed for four months, excluded for eight months, and then interviewed forfour more months. Ignoring attrition and migration, up to half of the observations in a March CPSshould be able to be matched to their previous year’s record. The CPS does not follow households thatmove.
14An important predictor of injury is having suffered a prior injury. If a worker’s earnings– and correspond-ing expected benefit– fall after a work-related injury, we might expect our estimated benefit elasticityto be biased downward to the extent that our sample contains some workers who have been injuredpreviously. Unfortunately, we cannot observe whether workers in the CPS have suffered prior injuries,but we restrict our sample to those who were not receiving WC in year t− 1.
15From 1980 on, the CPS used improved methods to identify WC receipt. Our main results are verysimilar when looking at the post-1980 years only.
16The survey years correspond to calendar years 1976/77-1983/84, 1985/86-1993/94, and 1995/96-2002/2003. Matching from 1985 to 1986 is not possible because of changes to geographic indicators.Matching from 1995 to 1996 is not possible due to revisions in the census household numbering scheme.
17Our main qualitative results are robust to the inclusion of all workers.
9

contains 269,514 individuals.
Next, the sample is matched to a database we have constructed that contains information on
all state WC laws and benefit parameters for the years from 1977 to 2003.18 For each individual
in the sample, we calculate a potential weekly WC benefit for year t, based on his average
gross weekly earnings in year t − 1, the replacement rate, and the maximum and minimum
benefit amounts in his state during year t. The potential benefit is also adjusted for number of
dependents and marital status for individuals in states with such allowances. We use state TTD
benefit schedules to calculate benefits because all WC claims are initially filed as TTD cases.
We construct an individual’s weekly earnings in the previous year by dividing his or her
annual wage and salary income (before deductions) in t− 1 by the number of weeks worked in
that year. We use the previous year’s weekly earnings to calculate the potential benefit because
states use the average pre-tax weekly earnings over some subset of the 52-week pre-injury period
to calculate benefits, and because weeks worked and earnings in year t− 1 would not have been
affected by an injury that occurred in year t. Note that it is possible that an individual’s weekly
earnings in year t− 1 are correlated with whether he receives WC in year t if workers in riskier
jobs receive compensating wage differentials. We include nine 1-digit occupation dummies and
41 2-digit industry dummies to control for such compensating differentials.
Because WC cash benefits are not subject to income or payroll taxation, the real benefit of
receiving WC is also a function of the tax rate. We employ TAXSIM to simulate tax rates (i.e.,
the sum of federal, state, and FICA rates) for individuals in our sample. Using TAXSIM to
derive more accurate tax rates for individuals should improve upon the estimation in previous
research, where tax rates are computed based on a classification of individuals into a small
18This information is compiled from consecutive issues of the U.S. Chamber of Commerce’s Analysis ofWorkers’ Compensation Laws (1977-2003).
10

number of tax brackets or are not explicitly considered. TAXSIM permits the calculation of a
tax rate for every individual in the sample based on information about income, dependents, and
filing status.19
Table 2 presents descriptive statistics for recipients versus non-recipients in our sample, where
means are calculated by pooling the years of data. Approximately 1.3 percent (or 3,608) of the
individuals in the sample take up WC during the year. WC recipients earn less per week in the
year before receiving WC than non-recipients but have a slightly higher average weekly benefit
entitlement. WC claimants are more likely to be male, slightly older, and less educated than
non-recipients, and are more likely to work in blue-collar jobs and in industries with a higher
risk of injury, like manufacturing, transportation, or construction.
Determinants of Workers’ Compensation Recipiency
We estimate probit models in which the dependent variable equals 1 if an individual begins
receiving WC in year t. The model takes the form:
P (wcist = 1) = Φ(β1 ln(BENist) + β2 ln(wagei,t−1) + β3 ln(1− taxist) +
β4waitst + β5retrost + δXi,t,t−1 + γs + τt + εist) (1)
where P (wcist = 1) is the probability that individual i receives WC in year t (conditional on not
having received WC in year t − 1), Φ is the normal cumulative distribution function, BENist
is the potential weekly WC benefit for which individual i is eligible, wagei,t−1 is the worker’s
average gross weekly earnings in year t−1, and taxist is the total marginal tax rate an individual
19Importantly, the input variables used to compute marginal tax rates are values for year t − 1, so thesimulated marginal tax rates for recipients should not be confounded by WC receipt or by reducedearnings due to injury. However, we calculate tax rates according to the laws for year t so that thesimulated tax rate represents the rate an individual would face on wage income in year t. Finally, weexclude sources of income for which the CPS definition changed over the period from 1977-2003 (e.g.,property income, dividend income, property taxes, capital gains, and UI benefits.).
11

would pay in year t based on his t − 1 income and filing characteristics. The variables waitist
and retroist are the lengths (in days) of the waiting and retroactive periods, respectively, in
individual i’s state and year. The vector Xi,t,t−1 contains characteristics of the worker in year
t, including his age, education, race, and marital status, as well as dummies for his occupation
and industry in t− 1. Finally, γs is a set of state fixed effects, and τt is a set of year effects.20
We begin by replicating the results in Krueger (1990) and then apply the same approach
to our much larger data set. These results are displayed in Table 3. Here, the parsimonious
model (model 1) controls only for WC parameters and the individual’s weekly earnings, marginal
tax rate and gender, as well as a full set of year dummies. The next model adds demographic
controls and occupation and industry dummies. The third model adds a set of 43 state dummies;
identification here depends on within-state changes in WC laws, nonlinearities in the benefit
formulas, and individual benefit variation within states (e.g., due to dependent allowances).
The probit results in the first three columns can be directly compared to those in Krueger
(1990), as can the corresponding benefit and wage elasticities displayed in the bottom panel
of the table.21 The reported coefficients and the corresponding benefit elasticities in the top
row of this panel are from probit models in which the potential WC benefit is calculated to
allow for more complex treatment of minimum benefits in states that do not have a binding
minimum (i.e., states like California). Benefit elasticities in the second row are from estimation
of identical models in which the benefit variable is calculated ignoring these complexities. That
20One might be concerned that the inclusion of state fixed effects does not leave enough variation in thebenefit variable to identify benefit effects. One way to test for sufficient identifying variation is to assessthe amount of within-state variation in benefits. Following Chernew et al. (2008), we regress the benefitvariable on a full state of state and year dummies and compute the variation inflation factor (VIF), equalto the reciprocal of one minus the R-squared of the regression. The VIF is about 1.1, well below theconventional threshold of 10. This indicates sufficient within-state variation in benefits.
21Despite our attempt to use the same sample selection criteria, we end up with a slightly larger sample for1983/84-1984/85, perhaps because of improved techniques for matching individuals across years of theMarch supplements.
12
is, we assign the legislated minimum to those earning less than the minimum in all states (i.e.,
treat all states like Ohio). The latter method is, as best we can discern, the method used in
most previous research. However, because the complexities in benefit formulas are an important
source of variation in WC benefits, hereafter we emphasize our results from the more rigorous
method for calculating WC benefits. In short, it appears that these two years of data yield
relatively large estimates of the benefit elasticity, in the range of 0.6 to 1.0, according to our
probit results.
Expanding to our larger data set, which contains observations from 1977/78 - 2003/04,
leads us to conclude that 1983/84-1984/85 were somewhat peculiar years with respect to the
benefit elasticity and other covariates. That is, the results for the larger data set imply benefit
elasticities approximately half the size of our corresponding estimates for 1983/84-1984/85. We
also estimate a negative and statistically significant impact of lagged weekly earnings on WC
receipt. We find an unexpected positive effect of the net-of-tax rate on WC receipt, which we
address in expanded versions of the model. Finally, unlike previous studies, our results do not
indicate a significant effect of the waiting period once standard errors are adjusted for clustering
at the state level.
Next, we address the possibility that the benefit, wage, and tax coefficients are biased
due to omitted variables. In model 4, we interact marital status (i.e., never married, di-
vorced/widowed/separated, or married) with gender for a more full set of controls. The co-
efficients on these variables indicate that divorced/widowed/separated workers are significantly
more likely than others to receive WC. Although including these controls does not change the
benefit or wage elasticities remarkably, the coefficient on the tax variable drops to 0.07 and is
no longer statistically different from zero. When we estimate the model separately for men and
13
women, the resulting benefit elasticities do not differ significantly.
Model 5 includes a control for the (log) average number of hours worked per week in year
t− 1. If workers have both higher weekly earnings and a higher risk of workplace injury simply
because they are at work more hours each week, then failing to control for hours may bias
the estimated effect of weekly earnings (and benefits, which depend on these earnings) upward.
Controlling for work hours reduces the benefit and wage elasticities somewhat, and we estimate
a positive relationship between hours worked and WC receipt.22,23
Finally, our estimates of the benefit, wage, and tax coefficients may be biased if they are
correlated with omitted variables like other family income or assets. Other things equal, a worker
with greater income or assets outside his labor earnings will be less likely to file a claim for WC
if there are positive costs (like transaction costs and/or stigma), since he can depend on these
forms of self-insurance to smooth consumption. In model 6, we include (log) earnings of other
family members, (log) income from interest, dividends, and net rentals, and (log) estimated
home equity in t− 1. The key results do not change.
In short, the initial results tell a fairly consistent story. Benefit generosity appears to have a
positive effect on WC receipt, with benefit elasticities in the range of 0.4 to 0.5. These estimates
22In results not shown, we include a part-time dummy variable instead of (log) hours worked per week. Weestimate a negative effect of part-time status on WC receipt, but the resulting estimates of key coefficientsare very similar to those presented. We also consider the possibility that there is a “threshold” effectof working more than 50 hours per week, since overtime work has been shown to be associated with agreater risk of injury. We do not find evidence of such an effect.
23We also consider union membership and firm size, two additional job characteristics that may be correlatedwith the probability of WC receipt as well as the level of WC benefits. Hirsch et al. (1997) provideevidence that the elasticity of WC receipt with respect to benefits is larger for union members than non-unionized workers. Data on union membership is available in the March CPS for individuals in outgoingrotation groups beginning in 1982. We estimate model 5 for this sample, with and without an indicatorfor union membership. We find a positive coefficient on union membership but only a slight reduction inthe benefit elasticity (from 0.300 to 0.254). Firm size may also be correlated with benefits and impactthe probability of WC receipt, since larger firms are more tightly experience rated and more likely toself-insure. Measures of firm size are available in the March CPS beginning in 1988. We estimate model5 for 1988-2003 with and without controls for firm size, but the estimated benefit elasticity changes onlynegligibly (from 0.611 to 0.609). Full results available upon request.
14

are appreciably smaller than the analogous results derived in Krueger (1990) but are consistent
with the majority of estimates provided elsewhere in the literature.24
Disentangling the Effects of Wages and Benefits
An important concern that has been overlooked by previous research is that the key indepen-
dent variable of interest, an individual’s weekly WC benefit entitlement, is a direct function of
his earnings history (i.e., of his average weekly earnings over a subset of the 52-week pre-injury
period). Without controlling carefully for this history, one is unable to disentangle the effects
of WC generosity on participation rates from the influence of past earnings.25
We expect these earnings to influence the decision of WC take-up directly, as a worker
compares his weekly earnings and marginal disutility from work to the benefits he would receive
under WC. However, past weekly earnings may also affect the decision to receive WC indirectly,
in that they may capture commitment to the labor force or represent the resources outside of
WC that are available to a worker.
We take several approaches to control more flexibly for the influence of an individual’s
prior earnings on the likelihood he receives WC. Intuitively, the flexible earnings controls are
intended to remove differences in WC participation propensities across people with different
earnings. Identification comes from differences across state(-years) in their relative treatment of
individuals with different earnings, not from the overall generosity of states.
24We also examined responsiveness to benefit levels among a subset of blue collar workers – a group withhigher mean participation than the full sample (0.025 versus 0.013). We find the estimated benefitelasticity for this group is 0.399, which is on the low end of our estimates for the pooled sample. Allsubsequent results for blue collar workers were qualitatively similar to those for the full sample.
25Anderson and Meyer (1997) recognize this problem in the context of UI and control for the influence ofan individual’s earnings history using a flexible spline in past earnings.
15

Controlling for the Influence of Earnings on both WC Benefits and WC Receipt
To control for the influence of earnings on WC claiming, two approaches are common within
the existing research on WC. The first is to use the effective (pre- or post-tax) replacement rate
as the key independent variable; however, this does not allow us to separately identify the effects
of benefit generosity and lagged earnings on WC receipt. The second is to enter the components
of the (log) replacement rate separately, including only a linear control for (log) weekly earnings
in t− 1 and forcing the relationship between earnings and WC participation to be the same at
all points along the earnings distribution.
Throughout, we have chosen the latter approach in order to allow for benefits and past
earnings (as well as perceived taxes) to have different impacts on the likelihood of WC receipt.
However, because we have no reason to know the particular form of the relationship between
earnings and the WC participation decision, we more closely examine the relationship between
past earnings and WC receipt.
Figure 3 examines the mean residuals from model 6 across earnings categories.26 That is,
for each of fourteen $100 earnings categories, we plot the difference between the observed rate
of WC receipt and the rate of WC receipt predicted by the estimates from model 6 (in Table 3).
We also use locally weighted scatterplot smoothing (“lowess”) to trace a curve between these
points. We observe an inverse u-shaped relationship between prior earnings and the residuals
from model 6 in Table 3. This suggests that a linear control in earnings, as in the models in
Table 3, fails to pick up the relationship between prior earnings and WC receipt.
Therefore, in Table 4 we more flexibly control for the influence of past earnings on WC
claiming. We begin by including a simple quadratic in an individual’s prior earnings in column
26Cameron and Trivedi (2005) refer to these as the “raw” residuals of the probit model.
16

2. (The “naıve” results from our preferred specification, model 6, are included in the first column
for comparison.) The results indicate concavity in the relationship between earnings and WC
receipt: WC receipt increases with earnings, but at a decreasing rate. When we control for
earnings in this way, the coefficient on benefits and the estimated benefit elasticity both drop
by more than half.
Because the inverse u-shaped pattern of the relationship between earnings and the rate of WC
receipt may not be captured by the quadratic, we next include a 4-piece linear spline in earnings.
The results are presented in column 3.27 We choose quartiles of the earnings distribution as
knot points. The effect of a worker’s (log) wage in t− 1 on the probability he receives WC in t
is assumed to be piecewise linear on 4 segments, and each coefficient represents the slope on a
particular segment.28 Adding the four-piece spline in lagged (log) weekly earnings reduces the
estimated responsiveness of claims to variation in WC benefits dramatically. Now, a 10 percent
increase in the level of WC benefits is associated with an increase in claims frequency of less
than 1 percent. While our models are similar to those used in previous research, one might
be concerned that adding the earnings spline leaves the model without sufficient variation to
identify the benefit elasticity. At a glance, this does not seem to be the case; the standard error
on the benefit coefficient increases only negligibly from column 2 to column 3. Furthermore,
the 95 percent confidence interval on our benefit coefficient in the spline specification suggests
an upper bound on the benefit elasticity that is substantially smaller than the benefit elasticity
estimated by the naive model.
Examining the coefficients on the segments of the spline reveals a relationship between earn-
27Generally speaking, let the L−1 selected quantiles of ln(wagei,t−1) equal KW2, ...KWL. Then the linearspline is formed by entering as regressors the variables W1, ...WL, where W1 = min(ln(wagei,t−1),KW2),and Wj = max(min(ln(wagei,t−1) − KWj), KWj+1 − KWj), 0) for j = 2, ...L − 1, and WL =max(ln(wagei,t−1)−KWL=1), 0).
28Expanding the spline to 5, 8, and 10 pieces had no discernable effect on the benefit coefficient.
17

ings and WC receipt that is not captured by the linear control for wages and is consistent with
the patterns displayed in Figure 3. The earnings effect is positive (and significant) for the bot-
tom quartile, statistically no different from zero for the second and third quartiles, and strongly
negative for the top 25 percent of the wage distribution. We would expect a positive coefficient
on earnings for the lowest quartile (0.112) if the very lowest earners are largely uninformed about
the WC system and their eligibility, while workers near the top of that bottom earnings quartile
are more likely to be unionized or have worked long enough to have become informed about WC
and their rights.
The large negative effect of earnings on WC receipt for the top quartile may result from
substantial decreases in the risk of on-the-job injury as earnings get very high, especially if our
occupation dummies are not perfectly capturing differences in the degree of risk associated with
the jobs of high earners. Also, other forms of self-insurance (e.g., private disability insurance,
paid sick leave) which would decrease the probability of a WC claim are increasingly available
to workers with the very highest earnings.29
In column 4, we impose even fewer constraints on the relationship between prior earnings and
WC receipt. We include categorical earnings variables that equal 1 for workers with earnings
in each of the corresponding $100 bins of the earnings distribution. (The omitted category is
earnings between $500 and $600.) As with the previous specification, the coefficient on the
benefits variable is close to zero and not statistically significant.30
The pattern on the earnings coefficients is largely consistent with the spline coefficients and
29Including two-digit controls for occupation or industry-specific time trends did not change the results.30As mentioned in the text, the standard errors on the benefit coefficient remain stable across the columnsof Table 4. However, one might be concerned that the inclusion of state fixed effects and the flexibleearnings controls does not leave enough variation in the benefit variable to identify benefit effects. Thevariance inflation factor for model 4 is 9.0, which is below the conventional threshold of 10. This suggeststhere is sufficient within-state variation in benefit levels, even after controlling for categories of earnings.
18

the inverse u-shaped pattern observed in Figure 3. Workers earning less than $100 are the
least likely to claim WC benefits, even after controlling for hours worked per week. Then,
the coefficients increase (i.e., become less negative) over the first 5 earnings categories, remain
roughly the same over the next 4 intervals, and decrease over the last few earnings categories
(i.e., for earnings greater than $1100).31
In conclusion, irrespective of our method for more flexibly controlling for prior earnings, we
find that the estimated benefit elasticity drops dramatically. By controlling more flexibly for the
influence of earnings on WC participation and allowing the earnings-WC relationship to vary for
workers at different points along the earnings distribution, we aim to ensure that our estimate
of the benefit elasticity is not attributing some of the impact of earnings (which policymakers
clearly cannot control) to benefits.
This estimate of the average relationship between benefits and WC claims is directly com-
parable to the much larger estimates of the benefit elasticity documented in previous research.
Therefore, at this point we do not include flexible controls for benefits as well. And these findings
may have important implications for the literature: Clearly, they suggest that researchers must
think carefully about controlling for the influence of past earnings on program participation
when studying programs in which benefits are a function of these earnings. This may be true
even for many ‘natural experiments’ in WC (e.g., changes in the maximum benefit), wherein the
treatment and control groups differ according to earnings.32
More broadly, the resulting benefit elasticity (smaller than 0.1) suggests that the effect of
increased WC generosity on the number of WC claims (or “moral hazard”) may warrant less
concern than it is typically given by economists and policymakers. At a minimum, once we
31The same qualitative conclusions hold when we include $100 bins up to $1,700, or when we includedummy variables for deciles of the earnings distribution.
32See, for example, Meyer et al (1995) and Neuhauser and Raphael (2004).
19

control for differences in WC claim propensities across the earnings distribution, we cannot
reject the null hypothesis that the impact of variation in WC benefits on the frequency of
receipt is zero.
Effects of WC Benefits Across the Earnings Distribution
The estimates in the previous section suggest important differences in the relationship be-
tween earnings and WC claiming at different points in the earnings distribution. However, these
results are from models that hold the relationship between benefits and WC receipt constant
across the earnings distribution. In this section, we examine how the relationship between earn-
ings, benefits, and WC receipt varies across quartiles of the earnings distribution, using three
different parameterizations of WC benefit generosity.
The Expected WC Benefit
In Table 5, we begin by estimating model 6 separately for workers in the different quartiles of
the earnings distribution. Note first that the pattern of coefficients on (log) earnings across the
earnings quartiles is consistent with the pattern of coefficients on the earnings spline variables.
Interestingly, we estimate a significant, negative relationship between WC benefits and WC
receipt for workers in the lowest quartile, shown in the top panel of Table 5. Recalling that
these estimates incorporate both the incentive effects of increased benefits for workers and those
for firms, the evidence in Card and McCall (2009) provides a reasonable explanation for this
seemingly anomalous result. The authors find that employers are more likely to deny claims
for low-income workers because these workers are less likely to fight back. With experience-
rated premiums, firms’ denials or discouragement of low earners’ claims for WC will increase as
20

benefits increase, since paying these claims will raise insurance costs for employers. Bernhardt
et al. (2009) also provide evidence that low-wage earners are far less likely to file a successful
claim for WC than higher earners. Additionally, 50 percent of low-wage earners in their sample
experienced an illegal employer reaction (including firing the worker, or instructing the worker
not to file for WC) when reporting an injury. Our findings consistently indicate a fundamentally
different relationship between earnings, benefits, and WC claiming for low earners. We suggest
that future research focus on better understanding this relationship and the experience of low
earners within the WC system. Interestingly, estimating the model separately for men and
women reveals that females seem to be driving this result for low earners. That is, the coefficient
on benefits for women is strongly negative, while for men it is small and positive but not
statistically different from zero. Thus, it may also be important for future studies to consider
possible gender differences in WC claiming behavior, perhaps especially among low earners.
The estimated coefficient on the benefit variable is small and positive (but not statistically
significant) for the next two quartiles and is approximately zero for the top earnings quartile.
The bulk of workers in the second and third earnings quartiles face the same replacement rate
of two thirds. Since wages and benefits are so highly correlated for these workers, we are not
surprised that the coefficients on wages and earnings are not statistically significant.
Legislated WC Program Parameters
The estimates to this point – and the bulk of the estimates in the literature – have examined
how responsive workers are to a change in the generosity of a worker’s expected WC benefit, given
his or her earnings. However, the elasticity of WC receipt with respect to expected benefits may
not be the policy parameter of most interest, since policymakers do not simply raise expected
benefits by ten percent.
21

Rather, policymakers have three levers at their disposal – the maximum benefit, the minimum
benefit, and the replacement rate. In the second panel of Table 5 we explore the responsiveness
of WC participation to variation in these WC program parameters. We include the (log) max
weekly benefit and separately include the (log) min weekly benefit for the two different ways
states treat the minimum. We distinguish between states that have minimum benefits that are
binding, where workers with earnings below that minimum value receive the minimum benefit
(i.e., more than 100% of their pre-injury earnings), and those states that effectively have no
minimum benefit, or award workers their full weekly earnings if below a certain level. Finally,
we include an indicator for states with replacement rates below two thirds.
For the pooled sample, whether we employ a linear control for earnings or the 4-piece spline,
the coefficients are close to zero and not statistically significant. Note also that the coefficients on
the earnings spline variables in column 2 are very similar to those from the model that uses the
expected WC benefit as the key independent variable. In columns 3 through 6 we examine these
relationships across quartiles of the earnings distribution. We would expect that the minimum
benefit is more likely to be binding for those in the bottom quartile, but we find no statistically
significant relationship between the minimum benefit and WC receipt. This is likely because
only 19.8% of workers in the bottom quartile receive the minimum benefit. In quartiles 2 and
3, where we would expect the replacement rate to matter the most, we find no evidence of a
relationship between the replacement rate and WC receipt. Of course, with state fixed effects
included to capture important time-invariant state characteristics that affect the probability of
WC receipt, little within-state variation remains in legislated replacement rates. Among the
highest earners, we expect the maximum to be most meaningful but find no relationship.
22

The Effective Replacement Rate
Legislated changes in maximum and minimum benefit levels essentially amount to changes
in the effective replacement rate over identifiable parts of the earnings distribution. In the third
panel of Table 5, we estimate the relationship between WC receipt and the pre-tax replacement
rate (i.e., the expected weekly WC benefit divided by the worker’s pre-injury weekly earnings).
For the pooled sample, the estimated effect of a worker’s replacement rate on the likelihood
of claiming WC is positive: A ten percent increase in the replacement rate is associated with a
3 percent increase in WC receipt. However, like our earlier results, the average elasticity for the
pooled sample conceals important differences across the earnings distribution.
Over the first three earnings quartiles, the results are qualitatively very similar to those in
the top panel of the table, where the expected WC benefit is the key independent variable. In the
first earnings quartile, a higher replacement rate is associated with a lower probability of a WC
claim. This is consistent with the result in the top panel, when we include the components of the
replacement rate separately. While we have offered some suggestive evidence from the literature
to explain this finding, we feel strongly that WC receipt among low earners is a topic that
warrants further research. Over the next two quartiles, the relationship between the effective
replacement rate and WC receipt is small and positive but not statistically significant.
Lastly, while the strong positive coefficient on the (log) replacement rate in the top earnings
quartile initially appears to contradict our earlier findings for high earners, recall that replace-
ment rates are higher at higher levels of benefits and lower levels of earnings. As we show in the
top panel, higher earners are not responsive to higher benefits. But throughout, we find that
for the top earnings quartile, the likelihood of WC is negatively related to earnings and would
thus be positively related to the replacement rate. Our main qualitative conclusions are upheld.
23
WC Benefit Levels and Claim Incidence Since 1990
Though the majority of research on incentive effects in WC focuses on pre-1990s data, dra-
matic changes to WC have occurred since 1990. Prior to 1990, WC recipients had higher
potential benefits and higher weekly earnings, on average, than non-recipients. But after 1990,
WC recipients faced lower potential benefits and had lower weekly earnings, compared with
non-recipients. Moreover, legislated benefit generosity increased during the post-1990 period,
whether measured by the real maximum benefit or the average nominal replacement rate, but
the frequency of WC claims dropped in half (see Figures 1 and 2). These trends might indicate
a shift in worker responsiveness to benefit levels, or they might reflect other changes that would
be expected to decrease WC claims – namely, improvements to workplace safety and changes to
the WC system that made it harder for injured workers to receive benefits.
In addition to improvements in workplace safety, two thirds of all states enacted some type
of reform to their WC system in the 1990s. Many states enacted stiff penalties for fraudulent
claiming, granted employers the privilege of selecting which doctor would treat a workplace
injury, required objective medical evidence of a workplace injury, limited compensability of
injuries that merely aggravated pre-existing conditions, or introduced workplace safety and
health programs (see, e.g., Conway and Svenson, 1998). Each of these reforms is expected to
decrease the number of WC claims, either by discouraging workers from filing claims or making
it harder for claims to be accepted.33 Guo and Burton (2010) find that these types of reforms
led to a decline in the dollar amount of benefits paid after 1990.34 However, studies by Boden
33Furthermore, these policy changes and employer efforts to get injured workers back to work may haveled to a reduced benefit elasticity, if these changes diverted workers suffering soft tissue injuries (whichare hard to verify and are more responsive to changes in benefit generosity) away from claiming WC.
34This study also provides evidence that the responsiveness of BLS injury rates to variation in WC benefitswas close to zero, both in the 1990s and the earlier period. Our work differs from theirs in severalsubstantive ways. Their study uses aggregate state-level data, and injury rates as the dependent variable.As expected, studies that use the injury rate as the dependent variable tend to find smaller effects of
24

and Ruser (2003) and Ruser et al. (2004) do not reveal an effect of these reforms on WC receipt.
In Table 6, we examine the relationship between WC receipt and benefits in the pre-1990
and post-1990 periods. We display estimates from the model with the earnings quadratic and
the earnings spline specification for the pooled sample and for both periods separately. These
results confirm our suspicions that the years since 1990 were importantly different for WC than
previous decades and indicate how crucial it is to consider the influence of earnings on both
WC participation and WC benefits. When we include a quadratic in earnings, the estimated
benefit elasticity is similar in both periods. However, estimates from the inclusion of the 4-piece
earnings spline tell a different story. In the pre-1990 period, including the earnings spline reduces
the estimated benefit elasticity to 0.310; the benefit coefficient remains positive and statistically
significant. In contrast, controlling flexibly for past earnings reduces the benefit elasticity for
the post-1990 period to approximately zero, and the probit coefficient on benefits is no longer
statistically significant.35
This decline in responsiveness could reflect actions by employers reacting to rising WC costs
in the 1980s: BLS data on injuries involving restricted workdays but no lost workdays indicate
an increase in workplace accommodation of injured workers during this time period (Ruser,
1999). Finally, we also suspect that some of the decline in WC receipt may be explained by
changes in the relationship between earnings and decisions regarding WC, especially near the
top of the earnings distribution.
benefits than studies that examine the frequency of WC claims/receipt. Finally, they do not include ameasure of the weekly wage or earnings in the state. In this study, we show the importance of controllingcarefully for prior earnings when estimating the benefit elasticity.
35This result may also arise because of important changes to workplace safety and the WC system. Tobetter control for improved workplace safety, we incorporate 2-digit occupation dummies. Our mainfindings are robust to this change. Next, we consider the legislated policy reforms examined in Bodenand Ruser (2003) and Ruser et al. (2004). Information on these policy changes is only available from 1990through 1997. Within this subset of years, expanding the specification to include an indicator for whethera state has enacted any of these policy changes has little impact on the estimated benefit elasticity.
25

Conclusions
This study offers new evidence on the magnitude of incentive effects in state WC programs.
Our findings suggest a positive effect of benefit levels on WC claims, but the magnitude of this
relationship depends crucially on how we control for the confounding influence of past earnings
on both benefits and the probability of a WC claim.
Following an approach similar to that used in previous research yields estimates of the
elasticity of WC receipt with respect to benefits of approximately 0.4 or 0.5, depending on
the specification. However, expanding upon previous work to include flexible controls for the
influence of past earnings on WC claiming propensities results in a very different conclusion
about the relationship between WC benefits and the frequency of WC receipt. Whether we
include a simple linear spline in past earnings or indicators for several categories of earnings, we
estimate a benefit elasticity that is smaller than 0.1, suggesting a 10 percent increase in benefits
would cause less than a 1 percent increase in the number of WC recipients.
This finding is corroborated by our evidence on the responsiveness of WC claims to legislated
WC program parameters. We find no relationship between the frequency of WC receipt and key
WC parameters, like the maximum, minimum, and replacement rate, even within quartiles of
the earnings distribution for which these parameters are most relevant.
Finally, our initial results conceal important differences between the pre-1990 and post-1990
periods. We find that WC participation was significantly less responsive to changes in benefits in
the post-1990 period than in earlier years. We also suspect that changes in the wage distribution
may help explain this finding; we leave this as an avenue for future research.
The implications of our findings are three-fold: First, researchers must think carefully about
controlling for the influence of past earnings on WC claims propensities in order to precisely
26

identify the effect of variation in WC benefits on program participation. This caveat also applies
to research on other programs in which benefits are a direct function of previous earnings and for
some ‘natural experiment’ approaches that are based on comparing workers with high and low
earnings. Second, while estimates of the average benefit elasticity are common in the literature,
we show that the average effect can conceal important differences in claiming behavior across
the earnings distribution. Our results consistently show that low earners are less likely to receive
WC when benefits are more generous, a finding that should be the focus of further study. Third,
the rather limited responsiveness of WC participation to changes in benefits indicated by our
estimates suggests that the distortionary labor supply effects of WC (at least at this margin)
may not warrant as much concern as is typically given them by economists and policymakers.
According to our findings, states may increase program generosity at a lower cost than implied
by previous estimates. Likewise, cost savings from legislated decreases in benefits are likely to
be less substantial than previously thought.
27

References
[1] Analysis of Workers’ Compensation Laws (1977 - 2004). Washington, D.C.: U.S. Chamberof Commerce.
[2] Anderson, Patricia M., and Bruce D. Meyer. 1997. “Unemployment Insurance Takeup Ratesand the After-Tax Value of Benefits.” The Quarterly Journal of Economics, Vol. 112, No.3, pp. 913-37.
[3] Bernhardt, Annette, Ruth Milkman, Nik Theodore, Douglas Heckathorn, Mirabai Auer,James DeFilippis, Ana Luz Gonzalez, Victor Narro, Jason Perelshteyn, Diana Polson,Michael Spiller. 2009. “Broken Laws, Unprotected Workers: Violations of Employment andLabor Laws in America’s Cities.” UCLA Institute for Research on Labor and EmploymentReport.
[4] Biddle, Jeff, and Karen Roberts. 2003. “Claiming Behavior in Workers’ Compensation.”Journal of Risk and Insurance, Vol. 70, No. 4, pp. 759-80.
[5] Boden, Leslie I. and John W. Ruser. 2003. “Workers’ Compensation ‘Reforms’, Choice ofMedical Care Provider, and Reported Workplace Injuries.” The Review of Economics andStatistics, Vol. 85, No. 4, pp. 923-29.
[6] Butler, Richard F. and John D. Worrall. 1983. “Workers’ Compensation: Benefit and InjuryClaims Rates in the Seventies.” The Review of Economics and Statistics, Vol. 65, No. 4,pp. 580-89.
[7] Butler, Richard F. and John D. Worrall. 1991. “Claims Reporting and Risk Bearing MoralHazard in Workers’ Compensation.” Journal of Risk and Insurance, Vol. 58, No. 2, pp.191-204.
[8] Cameron, A. Colin, and Pravin K. Trivedi. 2005. Microeconometrics: Methods and Appli-cations. New York: Cambridge University Press.
[9] Card, David, and Brian P. McCall. 1996. “Is Workers’ Compensation Covering UninsuredMedical Costs? Evidence from the ‘Monday Effect’.” Industrial and Labor Relations Re-view, Vol. 49, pp. 690-706.
[10] Card, David, and Brian P. McCall. 2009. “When to Start a Fight and When to Fight Back:Liability Disputes in the Workers’ Compensation System.” Journal of Labor Economics,Vol. 27, No. 2, pp. 149-78.
[11] Chelius, James R. 1982. “The Influence of Workers’ Compensation on Safety Incentives.”Industrial and Labor Relations Review, Vol. 35, No. 2, pp. 235-42.
[12] Chelius, James R., and Robert S. Smith. 1983. “Experience-Rating and Injury Prevention.”In John D. Worrall, ed., Safety and the Work Force, pp. 128-37. Ithaca: ILR Press.
[13] Chernew, Michael, Philip DeCicca, and Robert Town. 2008. “Managed Care and MedicalExpenditures of Medicare Beneficiaries.” Journal of Health Economics, Vol. 27, pp. 1451-61.
28

[14] Conway, Hugh, and Jens Svenson. 1998. “Occupational Injury and Illness Rates, 1992-1996:Why They Fell.” Monthly Labor Review, Vol. 121, No. 11, pp. 36-58.
[15] Fortin, Bernard, and Paul Lanoie. 1998. “Effects of Workers’ Compensation: A Survey,”CIRANO Working Papers, 98s-04.
[16] Guo, Xuguang (Steve) and John F. Burton, Jr. 2010. “Workers’ Compensation: RecentDevelopments in Moral Hazard and Benefit Payments.” Industrial and Labor RelationsReview, Vol. 63, No. 2, pp 340-55.
[17] Hirsch, Barry T., David A. Macpherson, and J. Michael Dumond. 1997. “Workers’ Com-pensation Recipiency in Union and Nonunion Workplaces.” Industrial and Labor RelationsReview, Vol. 50, No. 2, pp. 213-36.
[18] Krueger, Alan B. 1990. “The Incentive Effects of Workers’ Compensation.” Journal ofPublic Economics, Vol. 41, pp. 73-99.
[19] Krueger, Alan B. 1991. “Workers’ Compensation and the Duration of Workplace Injuries.”Unpublished paper, Princeton University.
[20] Krueger, Alan B. and John Burton. 1990. “The Employers’ Cost of Workers’ CompensationInsurance: Magnitudes, Determinants, and Public Policy.” NBER Working Paper 3029.
[21] Krueger, Alan B., and Bruce D. Meyer. 2002. “Labor Supply Effects of Social Insurance.”NBER Working Paper 9014.
[22] Lakdawalla, Darius, Robert Reville, and Seth Seabury. 2007. “How Does Health InsuranceAffect Workers’ Compensation Filing?” Economic Inquiry, Vol. 45, No. 2, pp. 286-303.
[23] Madrian, Brigitte C. and Lars John Lefgren. 1999. “A Note on Longitudinally MatchingCurrent Population Surveys (CPS).” NBER Working Paper T0247.
[24] Meyer, Bruce D. 2002. “Unemployment and Workers’ Compensation Programmes: Ratio-nale, Design, Labour Supply and Income Support.” Fiscal Studies, Vol. 23, No. 1, pp.1-49.
[25] Meyer, Bruce, W. Kip Viscusi, and David Durbin. 1995. “Workers’ Compensation andInjury Duration: Evidence from a Natural Experiment.” American Economic Review, Vol.85, pp. 322-40.
[26] Moore, Michael J., and W. Kip Viscusi. 1989. “Promoting Safety through Workers’ Com-pensation: The Efficacy and Net Wage Costs of Injury Insurance.” RAND Journal of Eco-nomics, Vol. 20, No. 4, pp. 499-515.
[27] Neuhauser, Frank, and Steven Raphael. 2004. “The Effect of an Increase in Workers’ Com-pensation Benefits on the Duration and Frequency of Benefit Receipt.” The Review ofEconomics and Statistics, Vol. 86, No. 1, pp. 288-302.
[28] Ruser, John W. 1985. “Workers’ Compensation Insurance, Experience-Rating, and Occu-pational Injuries.” RAND Journal of Economics, Vol. 16, No. 4, pp. 487-503.
29
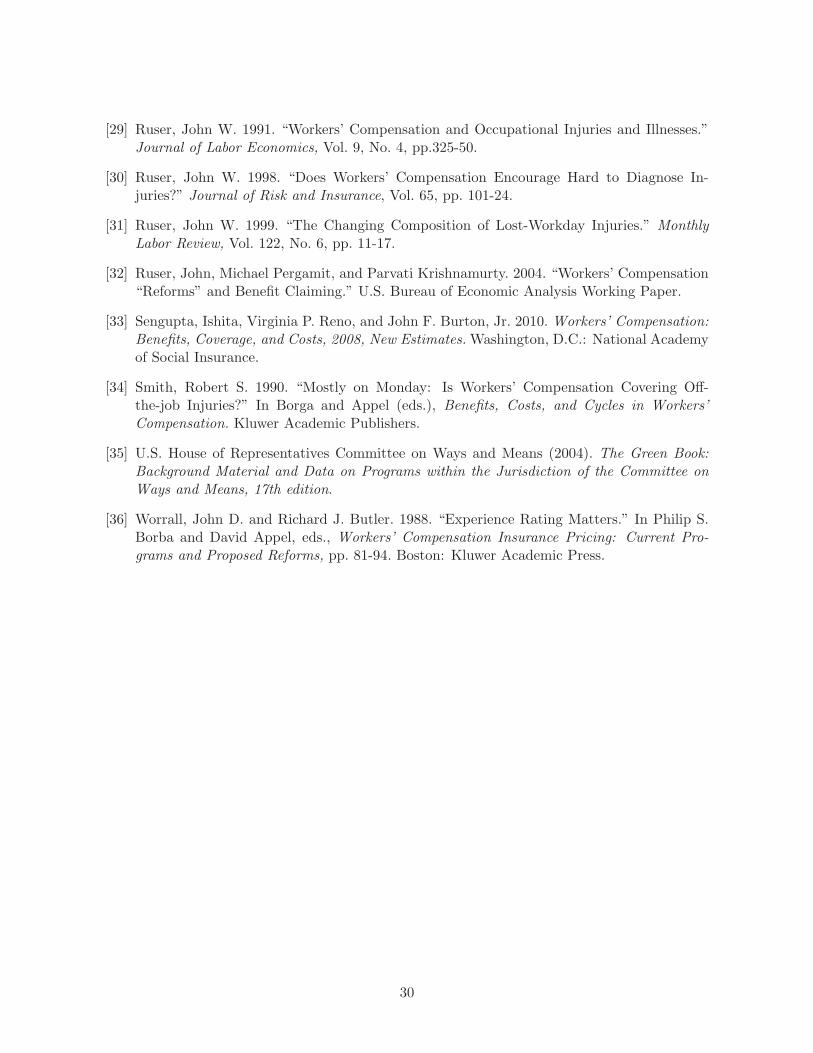
[29] Ruser, John W. 1991. “Workers’ Compensation and Occupational Injuries and Illnesses.”Journal of Labor Economics, Vol. 9, No. 4, pp.325-50.
[30] Ruser, John W. 1998. “Does Workers’ Compensation Encourage Hard to Diagnose In-juries?” Journal of Risk and Insurance, Vol. 65, pp. 101-24.
[31] Ruser, John W. 1999. “The Changing Composition of Lost-Workday Injuries.” MonthlyLabor Review, Vol. 122, No. 6, pp. 11-17.
[32] Ruser, John, Michael Pergamit, and Parvati Krishnamurty. 2004. “Workers’ Compensation“Reforms” and Benefit Claiming.” U.S. Bureau of Economic Analysis Working Paper.
[33] Sengupta, Ishita, Virginia P. Reno, and John F. Burton, Jr. 2010. Workers’ Compensation:Benefits, Coverage, and Costs, 2008, New Estimates.Washington, D.C.: National Academyof Social Insurance.
[34] Smith, Robert S. 1990. “Mostly on Monday: Is Workers’ Compensation Covering Off-the-job Injuries?” In Borga and Appel (eds.), Benefits, Costs, and Cycles in Workers’Compensation. Kluwer Academic Publishers.
[35] U.S. House of Representatives Committee on Ways and Means (2004). The Green Book:Background Material and Data on Programs within the Jurisdiction of the Committee onWays and Means, 17th edition.
[36] Worrall, John D. and Richard J. Butler. 1988. “Experience Rating Matters.” In Philip S.Borba and David Appel, eds., Workers’ Compensation Insurance Pricing: Current Pro-grams and Proposed Reforms, pp. 81-94. Boston: Kluwer Academic Press.
30

Figure 1: Average Maximum Weekly Benefit and Nominal Replacement Rate, 1977-2003
Figure 2: The Frequency of WC Receipt, 1977-2003
31
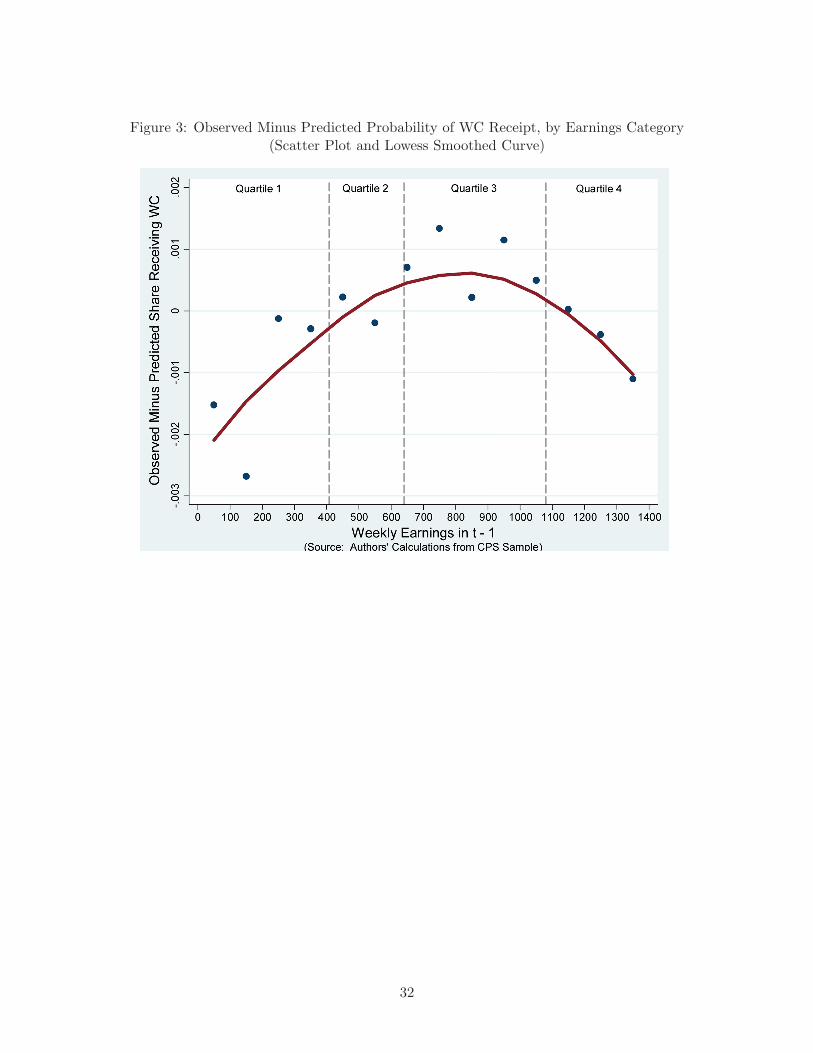
Figure 3: Observed Minus Predicted Probability of WC Receipt, by Earnings Category(Scatter Plot and Lowess Smoothed Curve)
32

Sta
teR
epla
cem
ent
Rat
e (%
)M
axim
um
B
enef
it
($
)
Min
imu
m
Ben
efit
($
)
Wai
tin
g
Per
iod
(d
ays)
Ret
ro.
Per
iod
(d
ays)
No
min
al
Rep
lace
men
t R
ate
Aft
er-t
ax
Rep
lace
men
t R
ate
Fra
ctio
n
Rec
eiv
ing
M
in.
Fra
ctio
n
Rec
eiv
ing
Max
.
Ari
zon
a6
6.6
73
74
.01
--7
14
0.5
28
0.7
00
--0
.57
1
Cal
ifo
rnia
66
.67
60
2.0
01
26
.00
31
40
.60
00
.79
30
.02
30
.36
3
Co
lora
do
66
.67
65
9.1
2--
31
40
.31
00
.80
3--
0.2
83
Co
nn
ecti
cut
75
90
9.0
01
81
.80
37
Flo
rid
a6
6.6
76
08
.00
20
.00
72
10
.61
50
.80
20
0.2
64
Haw
aii
66
.67
58
0.0
01
41
.00
3n
on
e0
.59
30
.83
40
.02
10
.32
2
Illi
no
is6
6.6
71
00
4.0
01
24
.30
31
40
.65
30
.89
40
.03
80
.11
9
Ind
ian
a6
6.6
75
88
.00
50
.00
72
10
.61
50
.82
80
.00
60
.27
3
Iow
a8
011
03
.00
--3
14
Mas
sach
use
tts
60
88
2.5
71
76
.51
52
10
.62
90
.89
40
.12
20
.18
2
Min
nes
ota
66
.67
75
0.0
01
30
.00
31
00
.62
60
.88
90
.02
50
.27
9
Mis
siss
ipp
i6
6.6
73
31
.06
25
.00
51
40
.54
00
.69
90
0.5
03
New
Jer
sey
70
63
8.0
01
70
.00
77
0.6
17
0.8
15
0.0
80
0.4
43
New
Mex
ico
66
.67
54
0.0
73
6.0
07
28
0.5
94
0.7
92
00
.30
8
New
Yo
rk6
6.6
74
00
.00
40
.00
71
40
.511
0.6
94
00
.55
5
Oh
io7
26
44
.00
21
4.0
07
14
0.6
62
0.9
12
0.1
21
0.3
60
Pen
nsy
lvan
ia6
6.6
76
75
.00
33
7.0
07
14
0.6
87
0.9
31
0.3
29
0.2
62
Tex
as7
05
37
.00
80
.00
72
80
.61
00
.77
30
.01
70
.44
4
Wis
con
sin
66
.67
66
9.0
02
0.0
03
70
.63
50
.87
50
.00
30
.19
2
Tab
le 1
: C
har
acte
rist
ics
of
Sta
te W
C P
rog
ram
s, 2
00
3
Leg
isla
ted
WC
Ben
efit
Par
amet
ers,
20
03
Mea
sure
s o
f W
C G
ener
osi
ty f
rom
CP
S S
amp
le,
20
02
/03
No
tes:
InC
on
nec
ticu
tan
dIo
wa,
ben
efit
sar
eca
lcu
late
das
a%
of
spen
dab
le,
or
afte
r-ta
xea
rnin
gs.
Su
chst
ates
are
excl
ud
edfr
om
ou
ran
aly
sis.
InO
hio
,th
ere
pla
cem
ent
rate
is7
2%
for
the
firs
t1
2w
eek
saf
ter
inju
ryan
d6
6.6
7%
ther
eaft
er.
Th
en
om
inal
rep
lace
men
tra
teis
the
rati
oo
fp
ote
nti
alw
eek
lyW
Cb
enef
its
toth
ein
div
idu
al's
aver
age
gro
ssw
eek
lyw
age
int-
1.
Th
eaf
ter-
tax
rep
lace
men
tra
teis
the
rati
oo
fp
ote
nti
alw
eek
lyW
Cb
enef
its
to t
he
ind
ivid
ual
's a
ver
age
wee
kly
wag
e in
t-1
mu
ltip
lied
by
his
ex
pec
ted
tax
rat
e in
yea
r t.
33

34
WC=1 0.0134 (0.11)
Weekly WC benefit, simple min. 392.49 (155.87) 392.78 (142.04) 392.49 (156.05)
Weekly WC benefit 391.02 (157.64) 392.09 (142.86) 391.01 (157.84)
Average weekly earnings (t-1) 759.06 (497.68) 705.14 (371.63) 759.79 (499.14)
Marginal tax rate (incl. FICA) 39.99 (9.63) 39.26 (9.87) 40.00 (9.63)
Male 0.55 (0.50) 0.66 (0.47) 0.55 (0.50)
Age 41.43 (11.09) 40.93 (11.22) 41.44 (11.09)
Education (years) 13.05 (2.53) 12.05 (2.27) 13.06 (2.53)
White 0.88 (0.32) 0.89 (0.31) 0.88 (0.32)
Black 0.07 (0.26) 0.07 (0.26) 0.07 (0.26)
Hispanic and other 0.02 (0.15) 0.02 (0.15) 0.02 (0.15)
Never married 0.09 (0.28) 0.08 (0.27) 0.09 (0.28)
Divorced, widowed, or separated 0.12 (0.32) 0.13 (0.34) 0.12 (0.32)
Married 0.80 (0.40) 0.79 (0.41) 0.80 (0.40)
Average weekly hours worked (t-1) 40.53 (9.88) 41.16 (8.25) 40.52 (9.90)
Earnings of other family members (t-1) 24,928 (32655) 19,466 (24789) 25,002 (32742)
Interest, dividend, rental income (t-1) 1,167 (5177) 711 (3651) 1,173 (5194)
Estimated home equity (t-1) 3,933 (4600) 3,638 (4460) 3,936 (4601)
"Blue-collar" occupation 0.34 (0.47) 0.63 (0.48) 0.33 (0.47)
Industry: Construction, manufacturing 0.41 (0.49) 0.59 (0.49) 0.44 (0.49)
mining, or transportation
N
Notes: Figures are unweighted sample means with standard deviations in parentheses. Recipients are workers who
report receiving WC income in year t, conditional on not having received WC in the previous year. All dollar
amounts are in 2002 dollars. Blue-collar occupations are craft, transport operative, laborer, or operative.
Table 2: CPS Sample Characteristics by WC Recipiency
All Recipients Non-Recipients
269,514 3,608 265,906

35
(1) (2) (3) (1) (2) (3) (4) (5) (6)
VARIABLES Model 1 Model 2 Model 3 Model 1 Model 2 Model 3 Model 4 Model 5 Model 6
Log(Weekly WC Benefit) 0.312*** 0.232** 0.402*** 0.267*** 0.160*** 0.222*** 0.218*** 0.201*** 0.199***
(0.096) (0.100) (0.143) (0.038) (0.035) (0.041) (0.041) (0.041) (0.041)
Log(Weekly Earnings in t-1) -0.106 0.038 -0.055 -0.233*** -0.072*** -0.117*** -0.120*** -0.140*** -0.124***
(0.083) (0.094) (0.113) (0.026) (0.027) (0.034) (0.033) (0.036) (0.038)
Log(1-tax) 0.266 0.001 0.046 0.180*** 0.034 0.091* 0.073 0.067 0.076
(0.198) (0.185) (0.179) (0.064) (0.064) (0.055) (0.053) (0.054) (0.062)
Waiting period (days) -0.024 -0.025 -0.021 -0.021
(0.023) (0.024) (0.016) (0.016)
Retroactive period (days) -0.000 -0.002 -0.001 -0.002
(0.005) (0.005) (0.003) (0.003)
Male 0.111 -0.077 -0.085 0.198*** -0.004 -0.003
(0.070) (0.065) (0.066) (0.036) (0.032) (0.033)
Single 0.068 0.051 0.058*** 0.049**
(0.054) (0.060) (0.021) (0.022)
Male: Married 0.030 0.032 0.017
(0.037) (0.037) (0.043)
Male: Divorced, widowed, or 0.098** 0.099** 0.093**
separated (0.044) (0.044) (0.044)
Female: Married 0.012 0.019 0.004
(0.046) (0.047) (0.052)
Female: Divorced, widowed, or 0.123*** 0.123*** 0.116***
separated (0.038) (0.038) (0.038)
Female: Never married 0.042 0.044 0.041
(0.038) (0.038) (0.039)
Age -0.004* -0.004* -0.001 -0.001 -0.002*** -0.002** -0.001
(0.002) (0.002) (0.001) (0.001) (0.001) (0.001) (0.001)
Education (years) -0.029** -0.028** -0.023*** -0.022*** -0.022*** -0.021*** -0.019***
(0.012) (0.012) (0.004) (0.004) (0.004) (0.004) (0.004)
Black -0.017 0.006 -0.058* -0.034 -0.041 -0.042 -0.054*
(0.080) (0.078) (0.031) (0.032) (0.032) (0.032) (0.032)
Hispanic or other race 0.093 -0.078 -0.010 -0.089* -0.092* -0.095** -0.099**
(0.084) (0.109) (0.048) (0.046) (0.048) (0.047) (0.047)
Log(Weekly hours worked)t-1 0.107*** 0.097***
(0.026) (0.027)
Log(Other family earnings)t-1 0.002
(0.002)
Log(Income from interest, -0.005**
dividends, rentals)t-1 (0.002)
Log(Estimated home equity)t-1 -0.002
(0.001)
Benefit elasticity 0.782 0.581 1.008 0.686 0.412 0.568 0.560 0.516 0.511
Benefit elasticity, simple min. 0.616 0.475 0.877 0.488 0.310 0.435 0.427 0.421 0.421
Benefit elasticity, Krueger 1990 0.665 0.454 0.741
Wage elasticity -0.265 0.095 -0.137 -0.598 -0.184 -0.301 -0.308 -0.359 -0.317
Wage elasticity, simple min. -0.143 0.174 -0.032 -0.450 -0.105 -0.197 -0.205 -0.294 -0.254
Wage elastiticy, Krueger 1990 -0.171 0.169 0.018
Number of Observations 21,983 21,840 21,621 269,514 269,514 269,514 269,514 269,514 269,514
Table 3: Determinants of Workers' Compensation Recipiency
Notes: Results of probit estimation of eqn. (1) in the text; standard errors in parentheses are corrected for clustering by state. Large sample comprised of
matched March CPS files from 1977/78-2003/04, excluding 1985/86 and 1995/96. Each model contains year dummies and an intercept. Benefit is for
Temporary Total Disability (TTD). All elasticities are calculated at the mean WC participation rate for the sample (0.0157 for the small sample and 0.0134
for the large sample.)
1983/84 - 1984/85 1977/78 - 2003/04

36
(1) (2) (3) (4)
Basic Model
VARIABLES
Log (Weekly WC benefit) 0.199*** 0.102** 0.035 -0.007(0.041) (0.050) (0.058) (0.055)
Log (Weekly Earnings)t-1 -0.124*** 0.876***(0.038) (0.311)
Log (Weekly Earnings)t-1 Squared -0.073***(0.023)
Earnings Spline: W1 0.112*(0.062)
W2 0.040(0.083)
W3 0.008(0.080)
W4 -0.307***(0.070)
Weekly Earnings < $100 -0.277*(0.142)
Weekly Earnings $100 - $200 -0.252***(0.082)
Weekly Earnings $200 - $300 -0.063(0.048)
Weekly Earnings $300 - $400 -0.035(0.033)
Weekly Earnings $400 - $500 -0.003(0.030)
Weekly Earnings $500 - $600 -------
Weekly Earnings $600 - $700 0.034(0.025)
Weekly Earnings $700 - $800 0.056(0.036)
Weekly Earnings $800 - $900 0.025(0.038)
Weekly Earnings $900 - $1000 0.038(0.042)
Weekly Earnings $1000 - $1100 0.013(0.029)
Weekly Earnings $1100 - $1200 -0.010(0.053)
Weekly Earnings $1200 - $1300 -0.033(0.046)
Weekly Earnings > $1300 -0.108**(0.047)
Log(1-tax) 0.076 0.087 0.114* 0.118*(0.062) (0.062) (0.065) (0.065)
Benefit elasticity 0.511 0.262 0.089 -0.017
Number of Observations 269,514 269,514 269,514 269,514
Table 4: Disentangling the Effects of Wages and Benefits on WC Receipt
Notes: All models include the full set of controls included in model (6) of Table 3. That is, they include controls for gender
by marital status interactions, age, years of schooling, race, weekly hours worked in t-1, lagged earnings of other family
members, lagged interest income, estimated home equity, occupation/industry dummies, and state and year fixed effects.
Standard errors are clustered by state in all models. The knot points (in 2002 $) are $408, $640, and $971.
$100 Earnings
Categories
Earnings
Spline
Quadratic in
Earnings

37
Naïve Earnings Bottom 2nd 3rd Top
Model Spline Quartile Quartile Quartile Quartile
Effects of Potential WC Benefit on WC Recipiency
Log(Weekly WC Benefit) 0.199*** 0.035 -0.242* 0.107 0.117 -0.017(0.041) (0.058) (0.127) (0.192) (0.120) (0.124)
Log(Weekly Earnings in t-1) -0.124*** 0.265** -0.100 0.040 -0.236***(0.038) (0.127) (0.190) (0.149) (0.089)
Earnings Spline: W1 0.112*(0.062)
W2 0.040(0.083)
W3 0.008(0.080)
W4 -0.307***(0.070)
Benefit Elasticity 0.511 0.089 -0.620 0.275 0.299 -0.044
Effects of State-Year WC Parameters on WC Recipiency
Log(MAX Weekly WC Benefit) -0.042 -0.040 -0.015 -0.098 0.006 -0.068(0.059) (0.059) (0.127) (0.112) (0.111) (0.134)
Log(MIN Weekly WC Benefit) 0.008 0.008 0.026 -0.020 0.005 0.021 X (State Min is Binding) (0.017) (0.017) (0.039) (0.036) (0.031) (0.038)Log(MIN Weekly WC Benefit) 0.002 0.003 -0.018 -0.019 0.006 0.033 X (Low Earners Awarded a % of Pre-Injury Earnings) (0.017) (0.017) (0.039) (0.035) (0.031) (0.038)Replacement Rate Lower than 2/3 -0.033 -0.033 -0.038 -0.003 0.019 -0.134
(0.048) (0.048) (0.109) (0.092) (0.088) (0.114)Log(Weekly Earnings in t-1) -0.005 0.063 -0.002 0.097 -0.236***
(0.018) (0.062) (0.105) (0.113) (0.072)Earnings Spline: W1 0.141***
(0.045) W2 0.073
(0.058)W3 0.025
(0.065)W4 -0.305***
(0.056)
Max Elasticity -0.107 -0.102 -0.038 -0.252 0.014 -0.175
Min Elasticity (State Min is Binding) 0.020 0.022 0.067 -0.050 0.013 0.054
Min Elasticity (Low Earners Awarded % of Earnings) 0.005 0.007 -0.045 -0.048 0.016 0.086
Effects of Effective Replacement Rate on WC Recipiency
Log(Nominal Effective Replacement Rate) 0.119*** -0.259* 0.104 0.049 0.181***
(0.029) (0.136) (0.227) (0.104) (0.064)
Replacement Rate Elasticity 0.305 -0.665 0.266 0.125 0.463
Mean WC Receipt 0.0135 0.0118 0.0150 0.0160 0.0108Mean Replacement Rate 0.603 0.739 0.663 0.604 0.406Share Receiving Min. Benefit 0.053 0.198 0.013 0.000 0.000Share Receiving Max. Benefit 0.391 0.005 0.104 0.515 0.938
Number of Observations 269,514 269,514 67,231 67,286 67,283 65,456
All Earners By Earnings Quartile
Table 5: Effects of WC Benefits and Program Parameters on WC Recipiency Across the Earnings Distribution
Notes: Models include the full set of controls included in model (6) of Table 3. That is, they include controls for gender by marital status interactions,
age, years of schooling, race, weekly hours worked in t-1, lagged earnings of other family members, lagged interest income, estimated home equity,
occupation/industry dummies, and state and year fixed effects. Standard errors are clustered by state in all models. The knot points (in 2002 $) are
$408, $640, and $971.

(1)
(2)
(3)
(2)
(3)
(2)
(3)
Bas
ic M
od
el
Log (
Wee
kly
WC
ben
efit)
0.1
99***
0.1
02**
0.0
35
0.1
42**
0.1
21
0.1
53
*0
.00
2(0
.041)
(0.0
50)
(0.0
58)
(0.0
65)
(0.0
80
)(0
.08
4)
(0.0
86
)L
og (
Wee
kly
Ear
nin
gs)
t-1
-0.1
24***
0.8
76***
0.7
58*
0.7
76
(0.0
38)
(0.3
11)
(0.3
96)
(0.4
92
)L
og (
Wee
kly
Ear
nin
gs)
t-1 S
quar
ed-0
.073***
-0.0
63**
-0.0
71
**
(0.0
23)
(0.0
29)
(0.0
36
)E
arn
ings
Spli
ne:
W
10.1
12*
0.1
08
0.0
94
(0.0
62)
(0.0
95
)(0
.09
1)
W2
0.0
40
-0.0
38
0.0
56
(0.0
83)
(0.1
11)
(0.1
24
)W
30.0
08
-0.0
75
0.0
52
(0.0
80)
(0.0
84
)(0
.13
1)
W4
-0.3
07***
-0.1
75
*-0
.44
6*
**
(0.0
70)
(0.0
94
)(0
.08
8)
Log(1
-tax
)0.0
76
0.0
87
0.1
14*
0.0
04
0.0
09
0.1
28
*0
.16
1*
*(0
.062)
(0.0
62)
(0.0
65)
(0.0
81)
(0.0
85
)(0
.06
8)
(0.0
67
)
Ben
efit
elast
icit
y0.5
110.2
62
0.0
89
0.3
63
0.3
10
0.3
92
0.0
05
Num
ber
of
Obse
rvat
ions
269,5
14
Mea
n W
C R
ecei
pt
0.0
13
38
No
tes:
All
mo
del
sin
clu
de
the
full
set
of
con
tro
lsin
clu
ded
inm
od
el(6
)o
fT
able
3.
Th
atis
,th
eyin
clu
de
con
tro
lsfo
rg
end
erb
ym
arit
alst
atu
sin
tera
ctio
ns,
age,
yea
rso
f
sch
oo
lin
g,
race
,w
eek
lyh
ou
rsw
ork
edin
t-1
,la
gg
edea
rnin
gs
of
oth
erfa
mil
ym
emb
ers,
lag
ged
inte
rest
inco
me,
esti
mat
edh
om
eeq
uit
y,o
ccu
pat
ion
/in
du
stry
du
mm
ies,
and
stat
e
and
yea
r fi
xed
eff
ects
.
Sta
nd
ard
err
ors
are
clu
ster
ed b
y s
tate
in
all
mo
del
s. T
he
kn
ot
po
ints
(in
20
02
$)
are
$4
08
, $
64
0,
and $
97
1.
Tab
le 6
: E
stim
ated
Ben
efit
Ela
stic
itie
s fo
r th
e P
re-1
990 a
nd P
ost
-19
90
Per
iod
s
Qu
adra
tic
in
Ear
nin
gs
Ear
nin
gs
Sp
lin
e
Qu
adra
tic
in
Ear
nin
gs
Ear
nin
gs
Sp
lin
e
Qu
adra
tic
in
Ear
nin
gs
Ear
nin
gs
Sp
lin
e
15
1,3
04
0.0
1111
8,2
10
0.0
17
Po
ole
d S
am
ple
(1
97
7-2
00
3)
Pre
-19
90
Po
st-1
99
0