revisiting economic geography - world bankpubdocs.worldbank.org/en/189651482251695762/prt... ·...
TRANSCRIPT
Revisiting Economic Geography
DEC Policy Research TalkDecember 19, 2016
Uwe Deichmann
Outline
The WDR 2009 provided an intuitive framework for understanding the role of
economic geography for development
Focus on cities, but urbanization is actually quite difficult to measure
(urbanization and growth in Africa)
Why do urbanization and income usually rise together?
Critical role of infrastructure, specifically transport:
For agglomeration economies: higher productivity/wages in cities
For the geography of production: benefits of large-scale transport investments
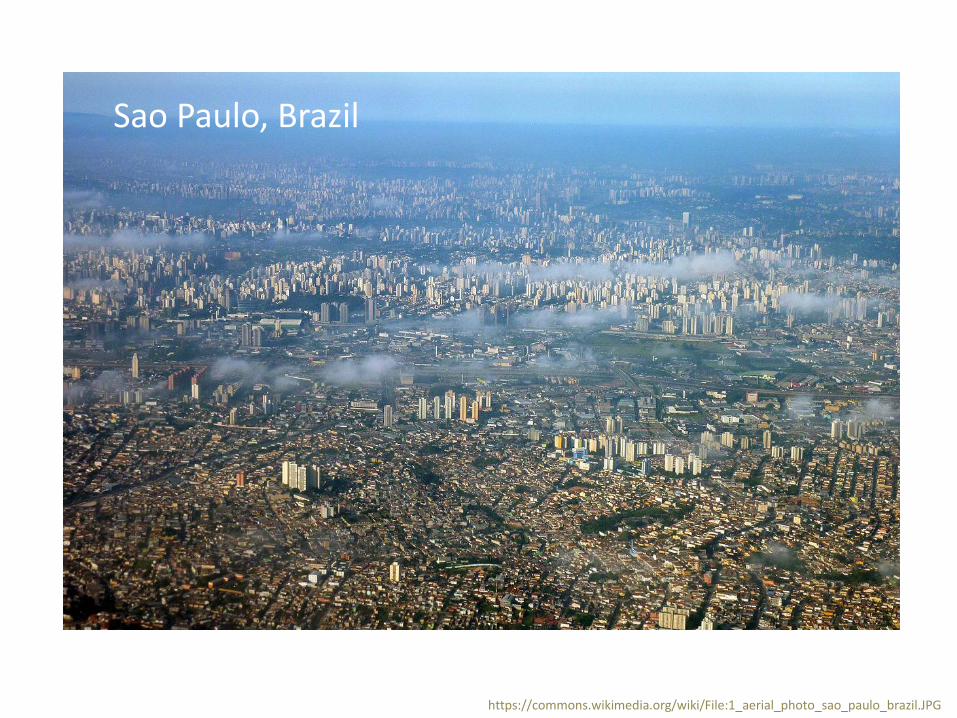
https://commons.wikimedia.org/wiki/File:1_aerial_photo_sao_paulo_brazil.JPG
Sao Paulo, Brazil

Thimphu, Bhutan

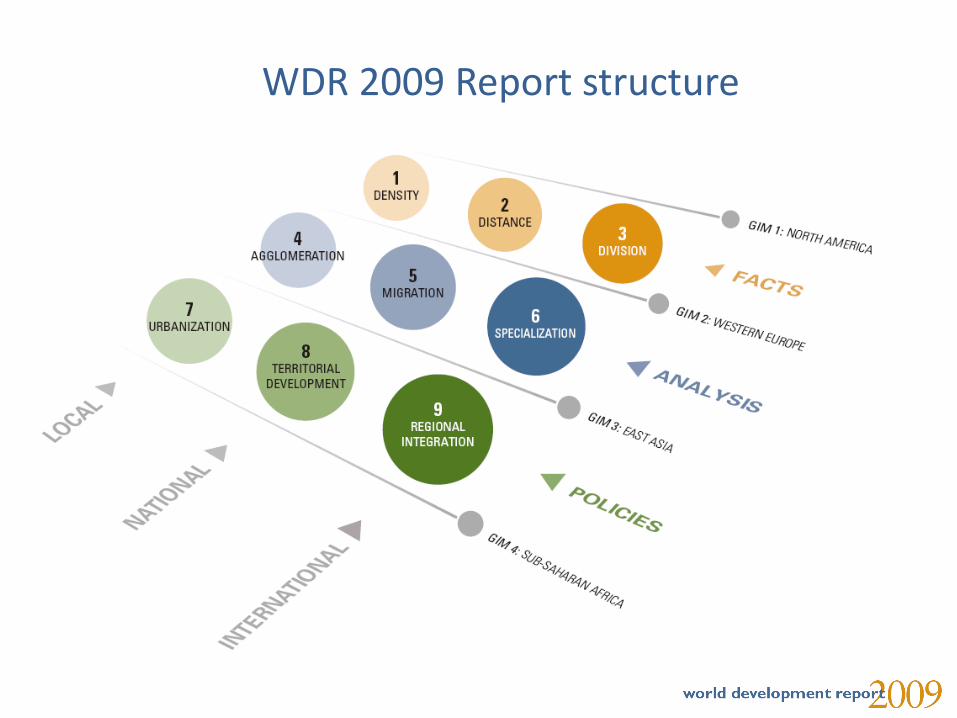
WDR 2009 Report structure
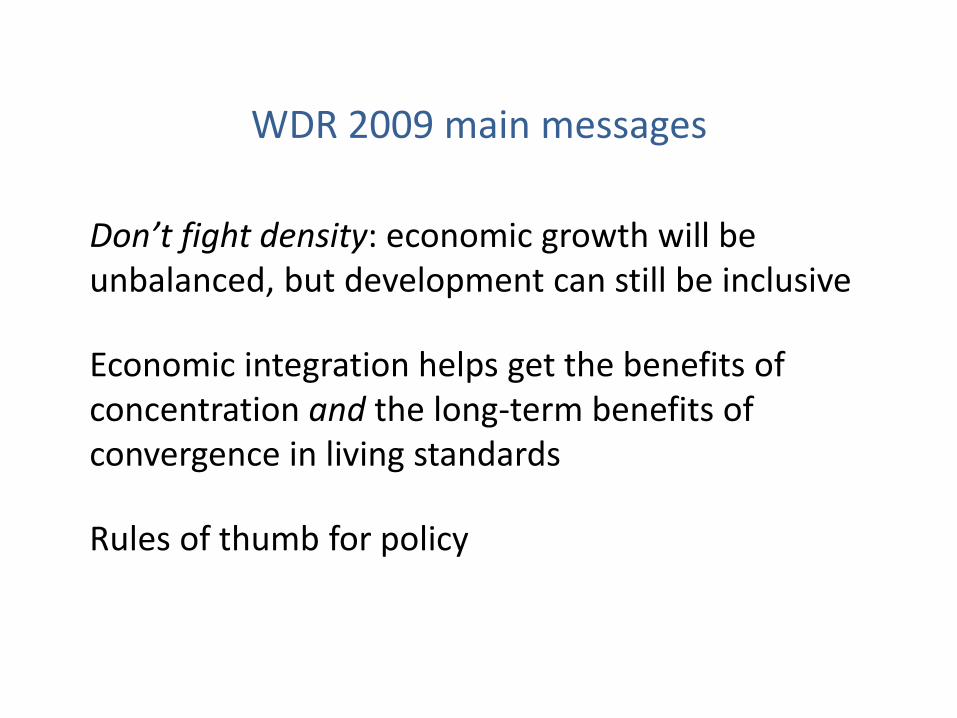
WDR 2009 main messages
Don’t fight density: economic growth will be unbalanced, but development can still be inclusive
Economic integration helps get the benefits of concentration and the long-term benefits of convergence in living standards
Rules of thumb for policy
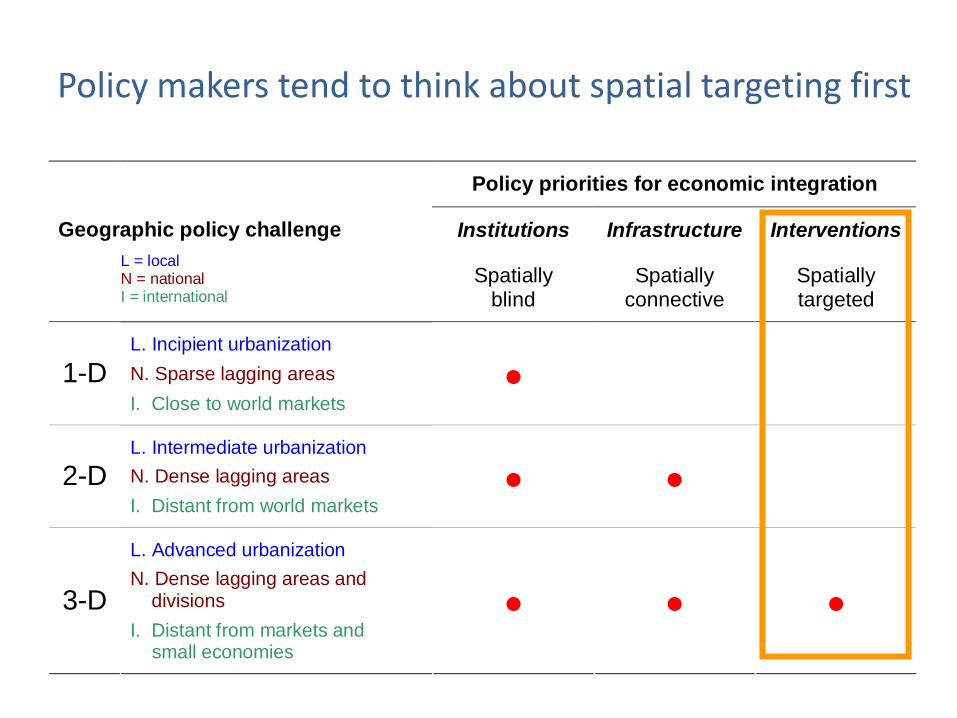
Policy priorities for economic integration
Institutions Infrastructure Interventions Geographic policy challenge
L = local N = national I = international
Spatially blind
Spatially connective
Spatially targeted
L. Incipient urbanization
N. Sparse lagging areas 1-D I. Close to world markets
L. Intermediate urbanization
N. Dense lagging areas 2-D I. Distant from world markets
L. Advanced urbanization
N. Dense lagging areas and divisions 3-D I. Distant from markets and small economies
Policy makers tend to think about spatial targeting first
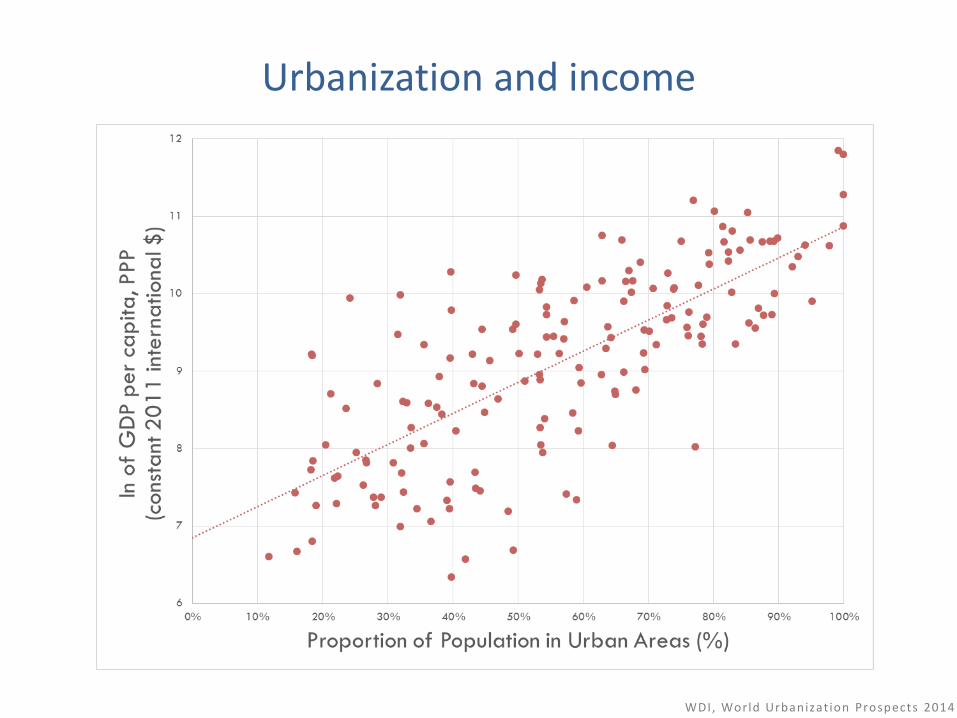
Urbanization and income
WDI, World Urbanizat ion Prospects 2014
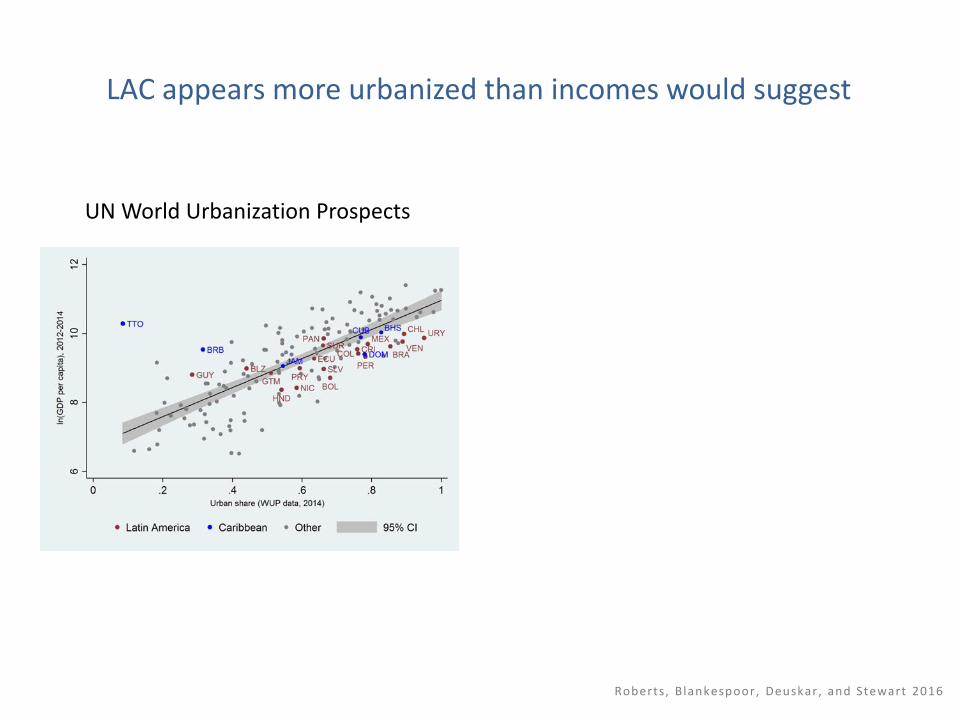
LAC appears more urbanized than incomes would suggest
Roberts, Blankespoor , Deuskar , and Stewart 2016
UN World Urbanization Prospects
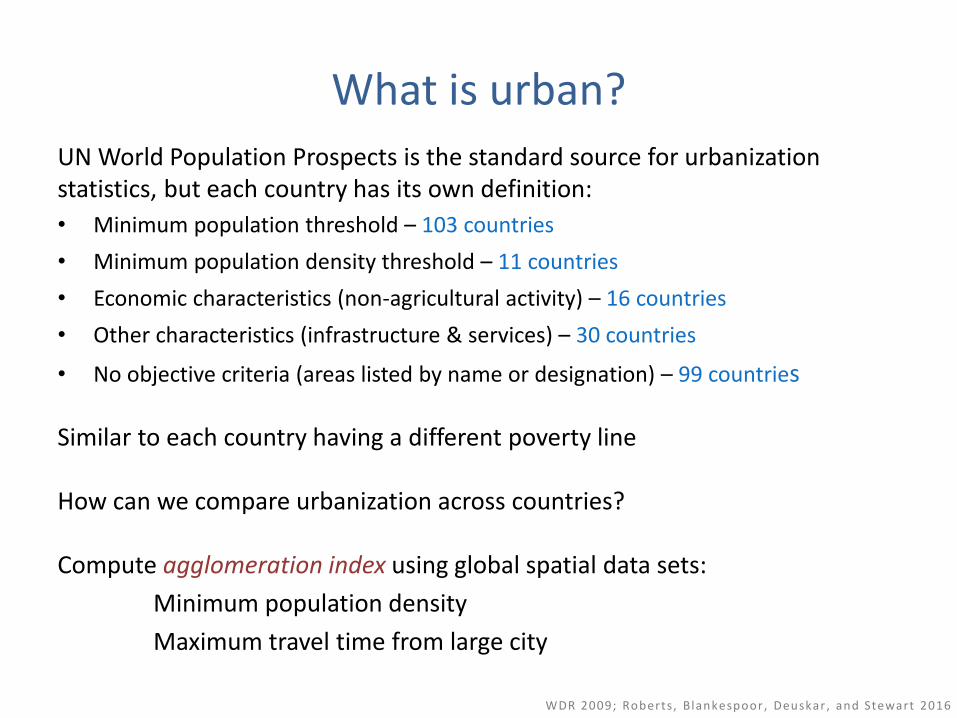
What is urban?
UN World Population Prospects is the standard source for urbanization statistics, but each country has its own definition:
• Minimum population threshold – 103 countries
• Minimum population density threshold – 11 countries
• Economic characteristics (non-agricultural activity) – 16 countries
• Other characteristics (infrastructure & services) – 30 countries
• No objective criteria (areas listed by name or designation) – 99 countries
Similar to each country having a different poverty line
How can we compare urbanization across countries?
Compute agglomeration index using global spatial data sets:
Minimum population density
Maximum travel time from large city
WDR 2009; Roberts, Blankespoor , Deuskar , and Stewart 2016
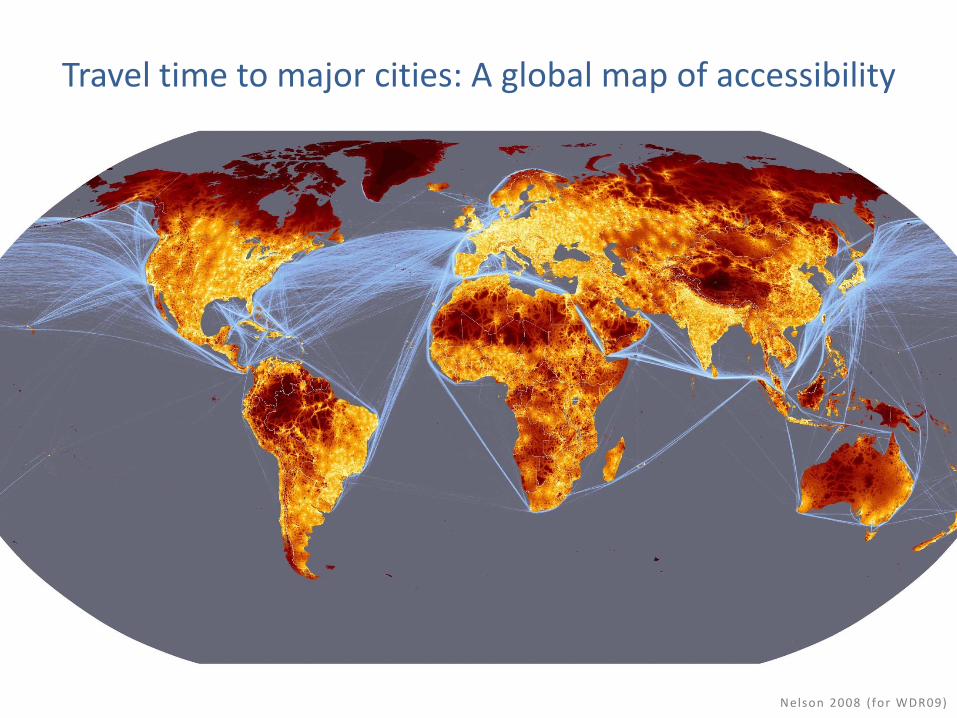
Nelson 2008 (for WDR09)
Travel time to major cities: A global map of accessibility
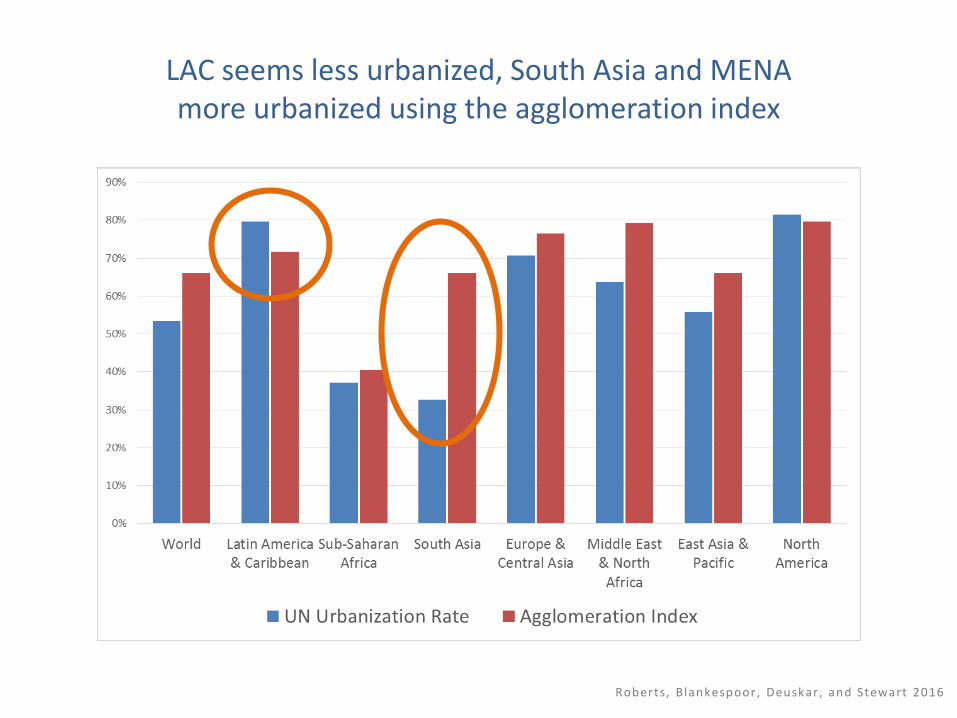
Roberts, Blankespoor , Deuskar , and Stewart 2016
LAC seems less urbanized, South Asia and MENA more urbanized using the agglomeration index
Roberts, Blankespoor , Deuskar , and Stewart 2016
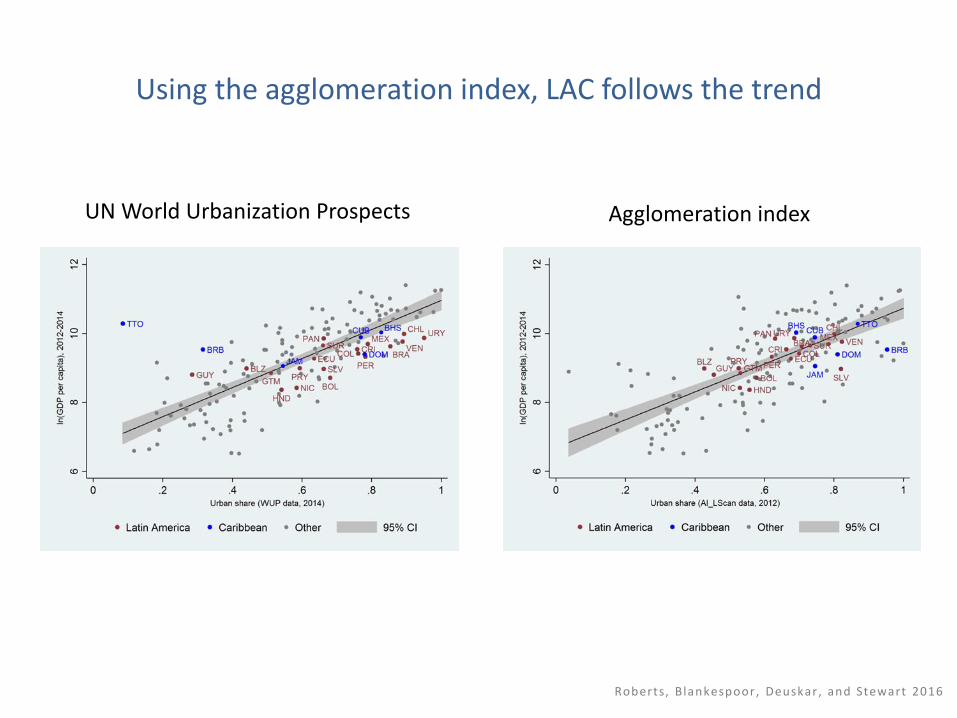
UN World Urbanization Prospects Agglomeration index
Using the agglomeration index, LAC follows the trend
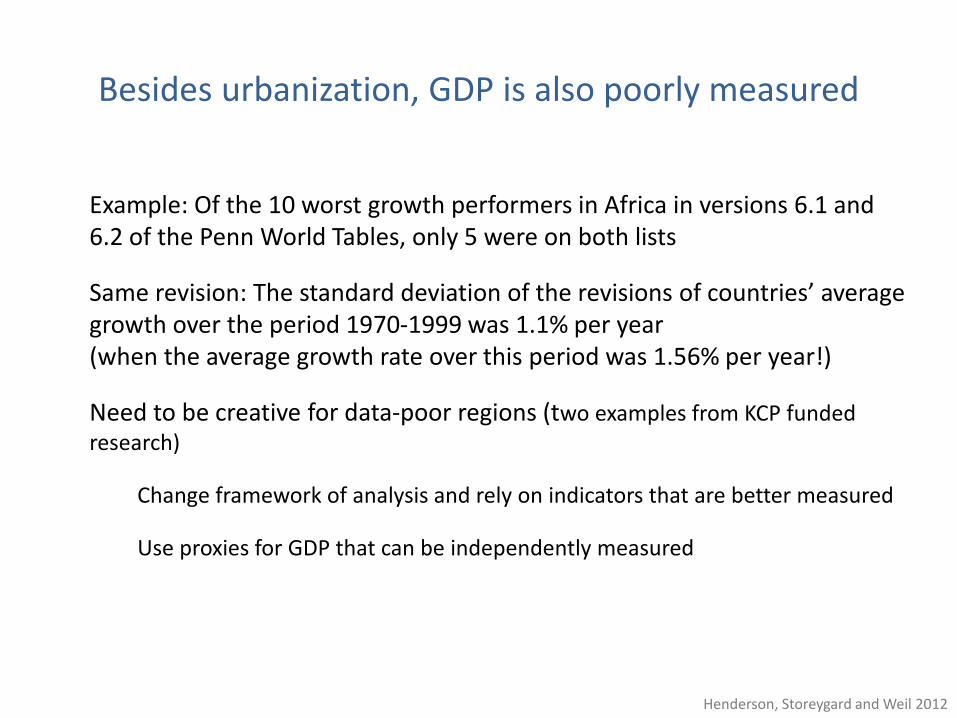
Besides urbanization, GDP is also poorly measured
Example: Of the 10 worst growth performers in Africa in versions 6.1 and 6.2 of the Penn World Tables, only 5 were on both lists
Same revision: The standard deviation of the revisions of countries’ average growth over the period 1970-1999 was 1.1% per year (when the average growth rate over this period was 1.56% per year!)
Need to be creative for data-poor regions (two examples from KCP funded research)
Change framework of analysis and rely on indicators that are better measured
Use proxies for GDP that can be independently measured
Henderson, Storeygard and Weil 2012
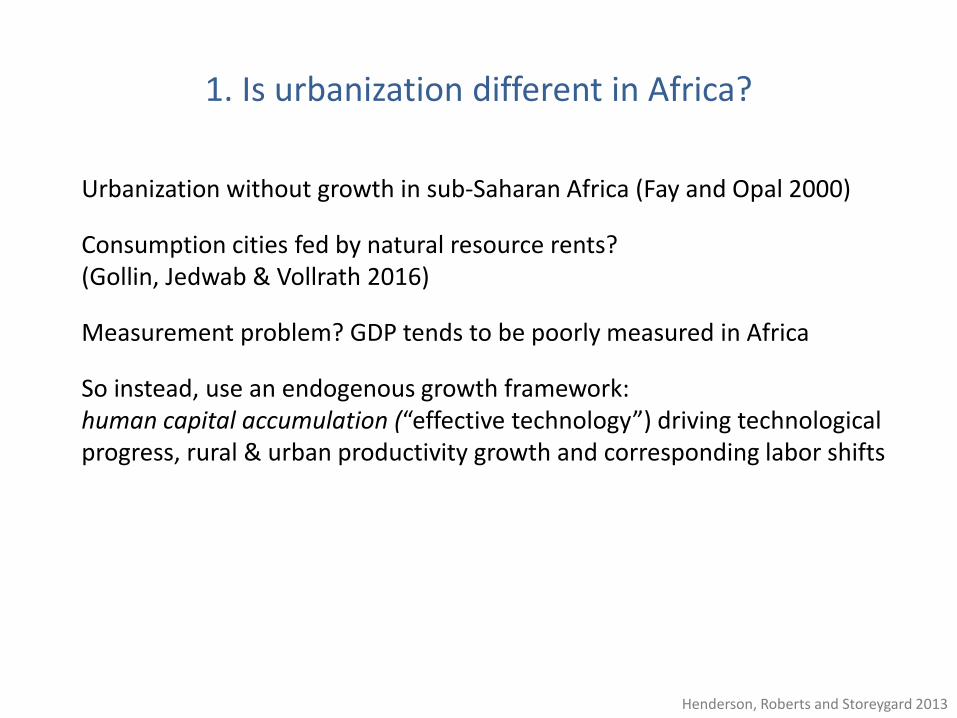
1. Is urbanization different in Africa?
Urbanization without growth in sub-Saharan Africa (Fay and Opal 2000)
Consumption cities fed by natural resource rents? (Gollin, Jedwab & Vollrath 2016)
Measurement problem? GDP tends to be poorly measured in Africa
So instead, use an endogenous growth framework: human capital accumulation (“effective technology”) driving technological progress, rural & urban productivity growth and corresponding labor shifts
Henderson, Roberts and Storeygard 2013
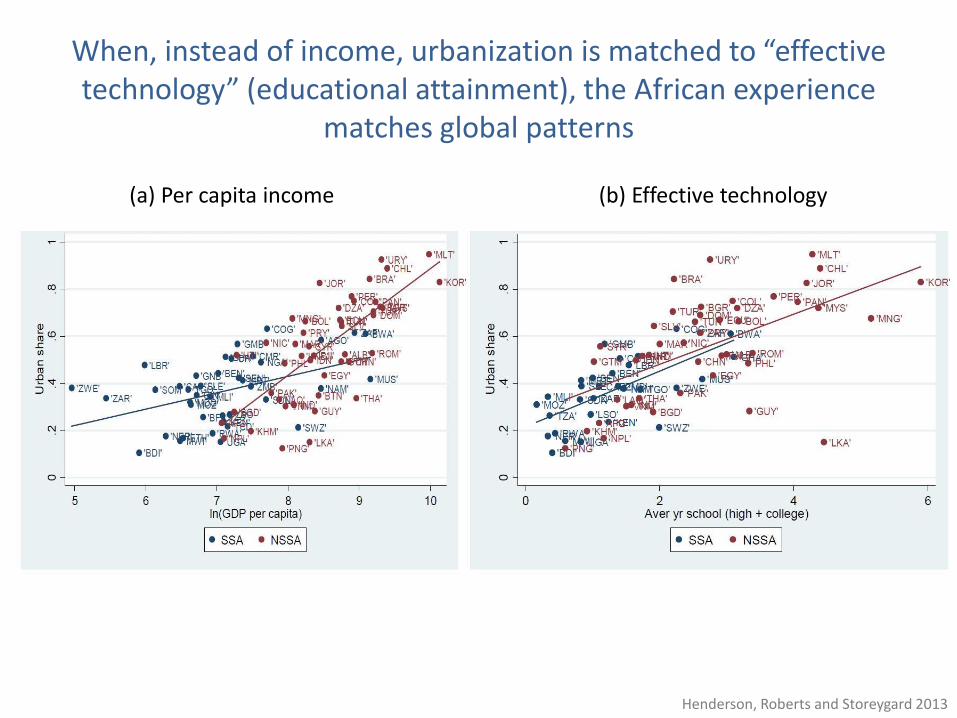
When, instead of income, urbanization is matched to “effective technology” (educational attainment), the African experience
matches global patterns
(a) Per capita income (b) Effective technology
Henderson, Roberts and Storeygard 2013

2. Has climate change driven urbanization in Africa?
Importance of push factors (also conflict,poor services)
Climate variability and change: Moisture availabilityis declining, especially in already drier areas
Henderson, Storeygard and Deichmann 2017
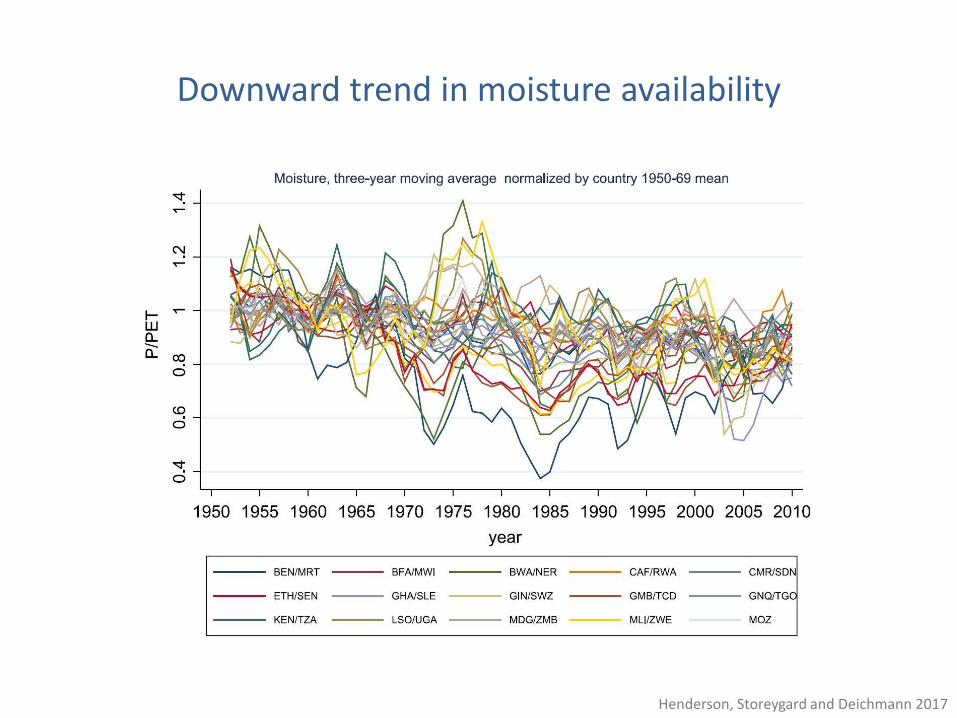
Downward trend in moisture availability
Henderson, Storeygard and Deichmann 2017
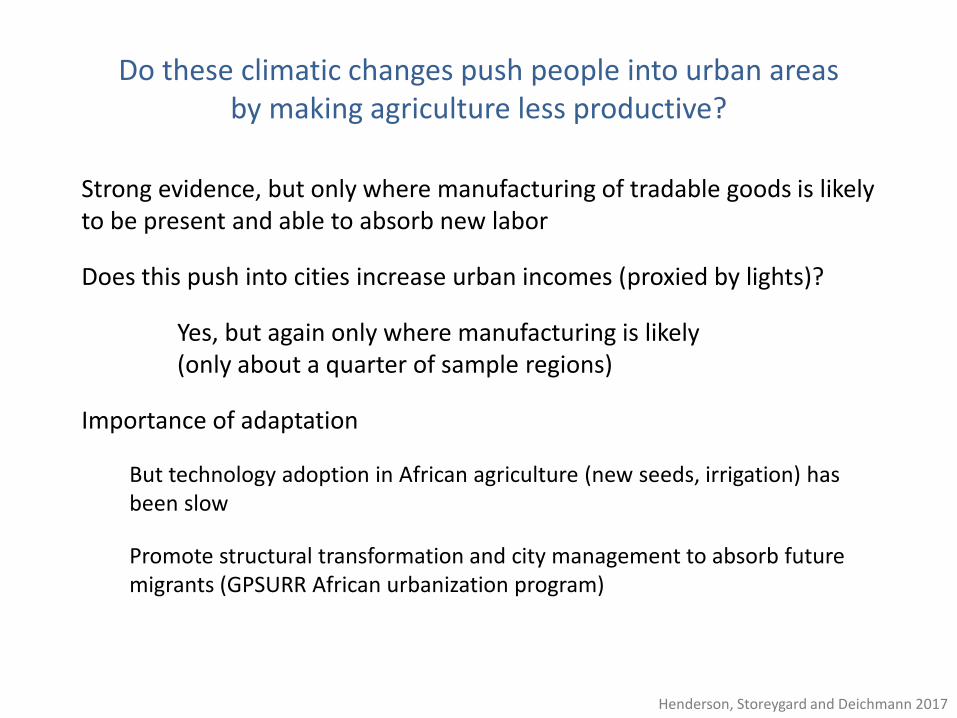
Do these climatic changes push people into urban areas by making agriculture less productive?
Strong evidence, but only where manufacturing of tradable goods is likely to be present and able to absorb new labor
Does this push into cities increase urban incomes (proxied by lights)?
Yes, but again only where manufacturing is likely (only about a quarter of sample regions)
Importance of adaptation
But technology adoption in African agriculture (new seeds, irrigation) has been slow
Promote structural transformation and city management to absorb future migrants (GPSURR African urbanization program)
Henderson, Storeygard and Deichmann 2017
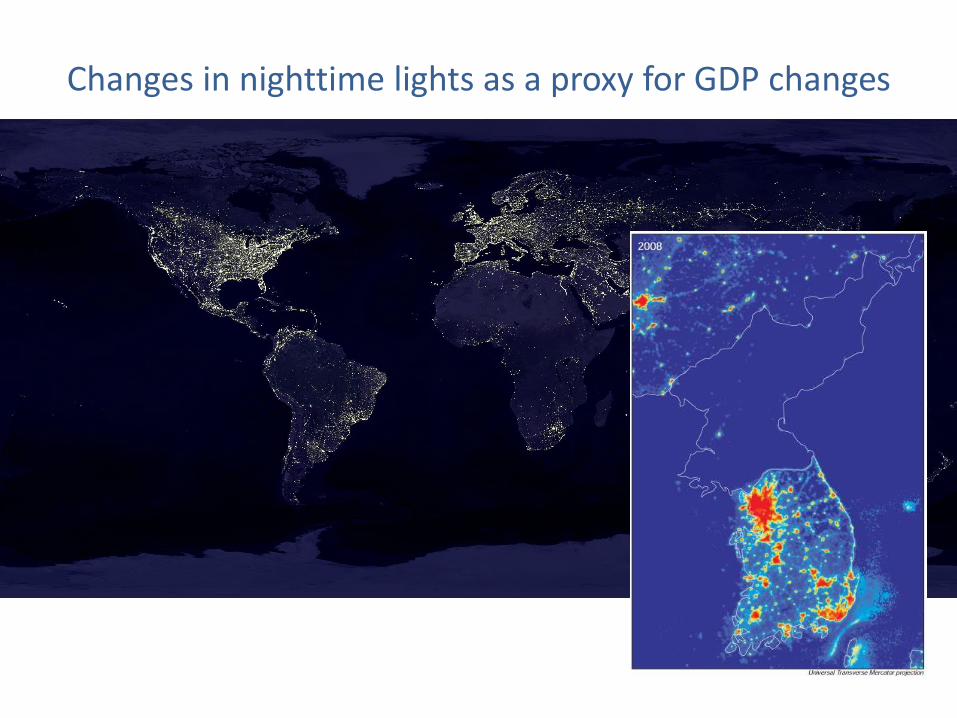
Changes in nighttime lights as a proxy for GDP changes
Policy research priorities: Urbanization measurement
Develop a new, consistent database for urbanization
Leverage high resolution, high frequency satellite data
Urban agglomeration economies

What explains the strong association between urbanization and income?
Limitations of cross-country studies, so we look at effects of cities on worker or firm productivity to ask:
Does agglomeration cause higher wages, productivity, and other outcomes?
Understanding is key for informing big urbanization debates
Are cities too large or not large enough?
What are the market failures that inhibit agglomeration economies?
But difficult to establish causality: more qualified workers will be attracted to more productive cities
Control for individual characteristics: 30-50% of observed effects
Agglomeration effects
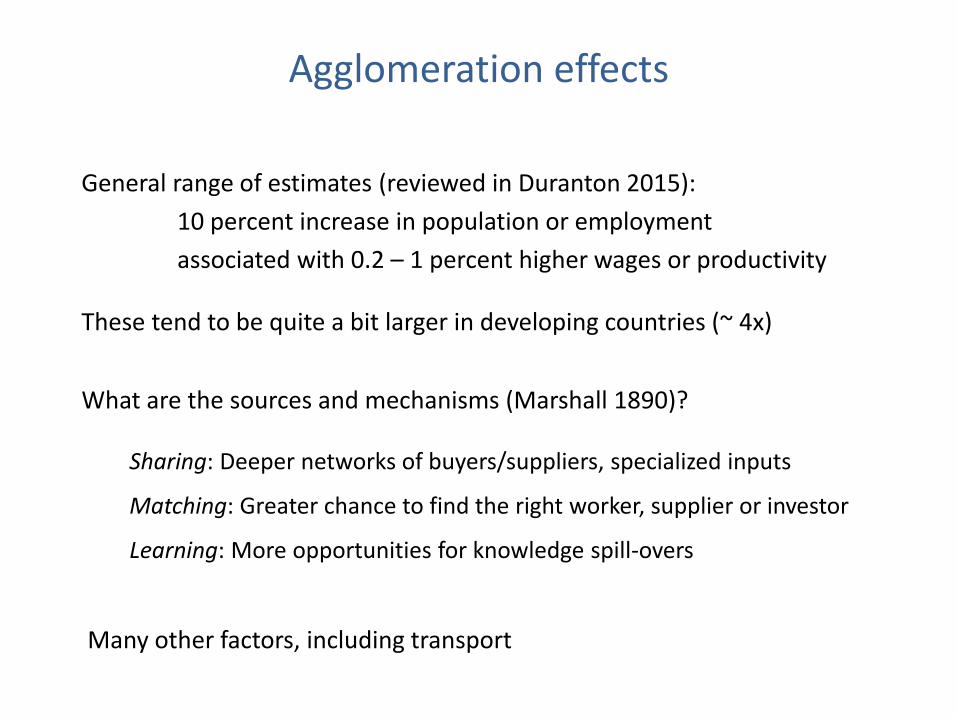
General range of estimates (reviewed in Duranton 2015):
10 percent increase in population or employment
associated with 0.2 – 1 percent higher wages or productivity
These tend to be quite a bit larger in developing countries (~ 4x)
What are the sources and mechanisms (Marshall 1890)?
Sharing: Deeper networks of buyers/suppliers, specialized inputs
Matching: Greater chance to find the right worker, supplier or investor
Learning: More opportunities for knowledge spill-overs
Many other factors, including transport
Role of transportation
Take an urban systems perspective
Concept of market access / market potential (MP): distance-discounted sum of incomes or population at all potential destinations or sources
“Social physics” school of geography (1950s)
Krugman model: MP in a model of increasing returns (various types of scale economies) and monopolistic competition (differentiated products, love of variety)
Some examples
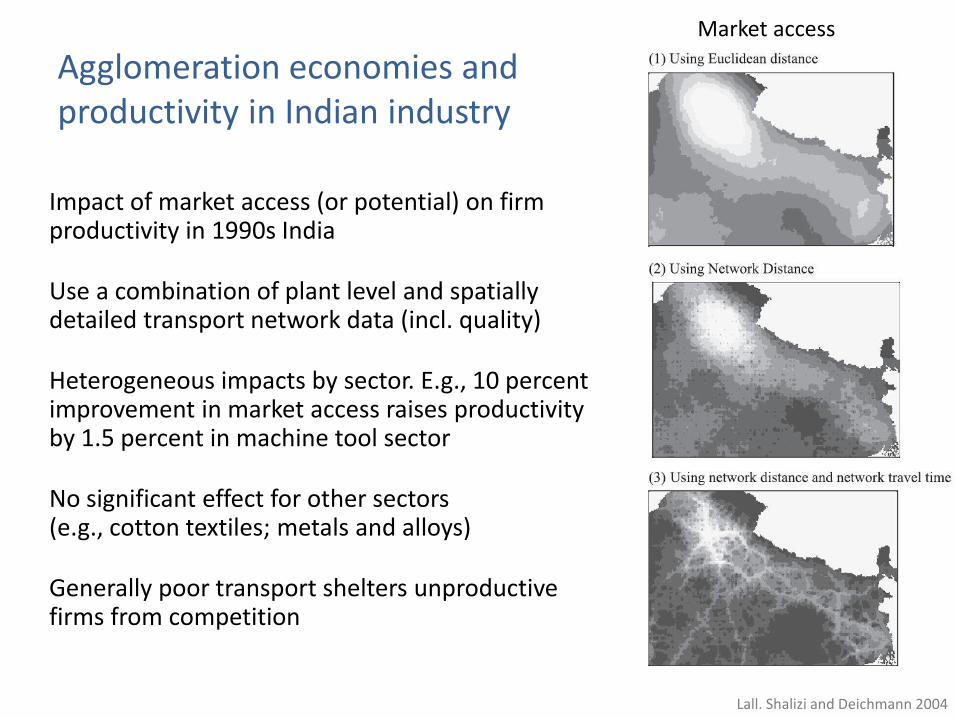
Agglomeration economies and productivity in Indian industry
Impact of market access (or potential) on firm productivity in 1990s India
Use a combination of plant level and spatially detailed transport network data (incl. quality)
Heterogeneous impacts by sector. E.g., 10 percent improvement in market access raises productivity by 1.5 percent in machine tool sector
No significant effect for other sectors (e.g., cotton textiles; metals and alloys)
Generally poor transport shelters unproductive firms from competition
Lall. Shalizi and Deichmann 2004
Market access

Agglomeration economies and city growth in Brazil
Why are some cities more successful than their peers?
Domestic market access has “enormous and dominating” impact on differential city growth rates
1 percent increase in market potential increases city size by 2 percent
Expect small benefits from transport policies that favor secondary cities (0.1 – 0.5 % increase in aggregate income)
Da Mata, Deichmann, Henderson, Lall, and Wang 2007
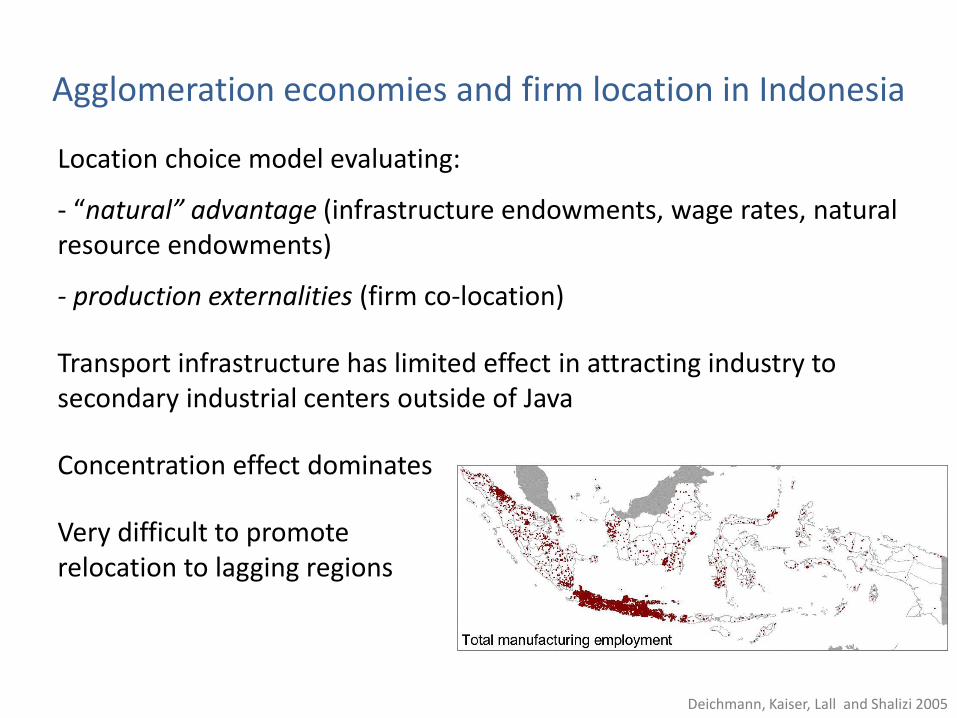
Agglomeration economies and firm location in Indonesia
Location choice model evaluating:
- “natural” advantage (infrastructure endowments, wage rates, natural resource endowments)
- production externalities (firm co-location)
Transport infrastructure has limited effect in attracting industry to secondary industrial centers outside of Java
Concentration effect dominates
Very difficult to promote relocation to lagging regions
Deichmann, Kaiser, Lall and Shalizi 2005
Policy research priorities: Urbanization and growth
Replication of key new studies in developing countries
Better understanding of the specific sources and mechanisms leading to agglomeration economies (and how to encourage them)
Better measurement of congestion costs that offset some (all?) of the agglomeration economies

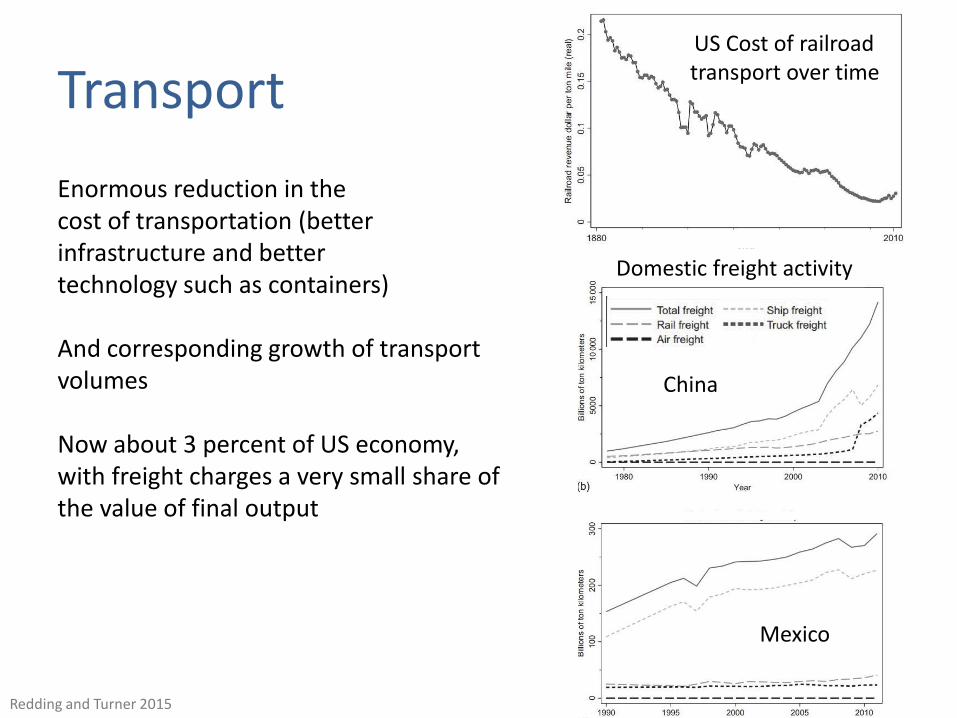
Transport
Transport
Enormous reduction in the cost of transportation (better infrastructure and better technology such as containers)
And corresponding growth of transport volumes
Now about 3 percent of US economy, with freight charges a very small share of the value of final output
US Cost of railroad transport over time
Redding and Turner 2015
China
Mexico
Domestic freight activity
Transport affects many aspects of the economy
Impacts on geography of production are not always intuitive
A large drop in transport costs in the 1900s caused Britain to trade more with neighbors than with distant countries
Intra-industry trade and specialization
Trade in parts/components and love of variety
Most trade is still over short distances and not always by cheapest mode
Importance of agglomeration economies
Time costs > freight costs
Reports about the ‘death of distance’ have been greatly exaggerated
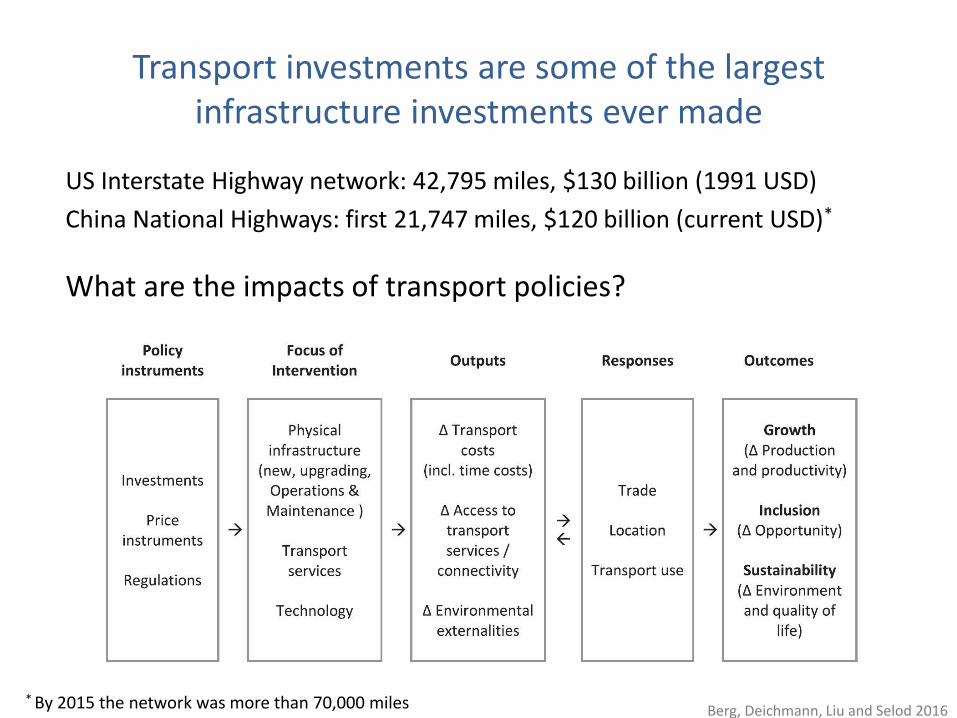
Transport investments are some of the largest infrastructure investments ever made
US Interstate Highway network: 42,795 miles, $130 billion (1991 USD)
China National Highways: first 21,747 miles, $120 billion (current USD)*
What are the impacts of transport policies?
Berg, Deichmann, Liu and Selod 2016* By 2015 the network was more than 70,000 miles
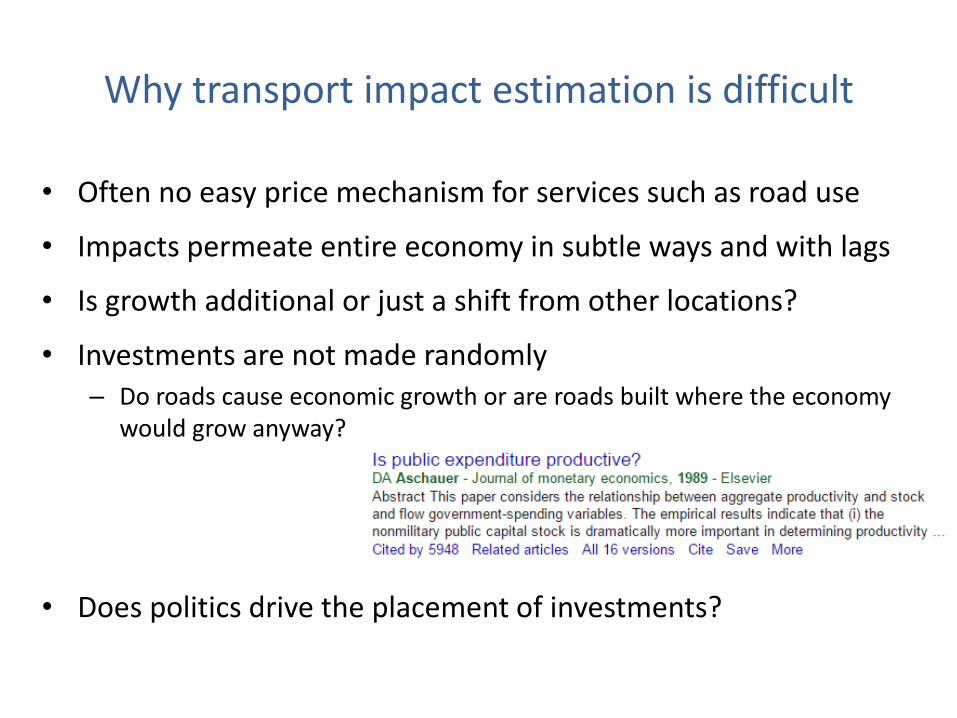
Why transport impact estimation is difficult
• Often no easy price mechanism for services such as road use
• Impacts permeate entire economy in subtle ways and with lags
• Is growth additional or just a shift from other locations?
• Investments are not made randomly– Do roads cause economic growth or are roads built where the economy
would grow anyway?
• Does politics drive the placement of investments?

“Your people will remember you for the money you saved by not building a pyramid.”
New Yorker cartoon
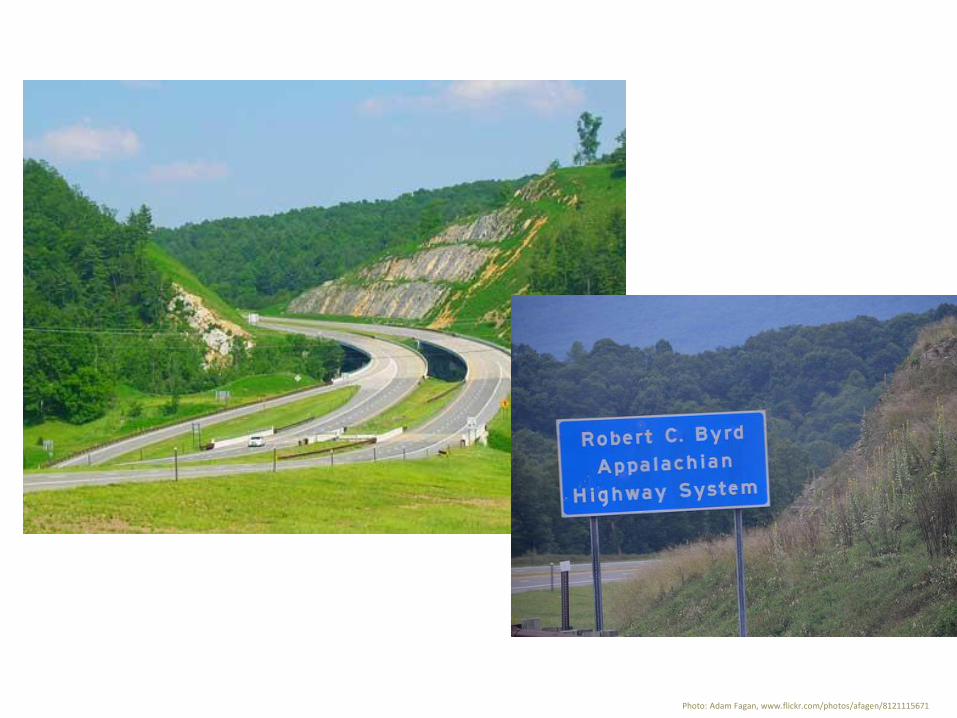
Photo: Adam Fagan, www.flickr.com/photos/afagen/8121115671
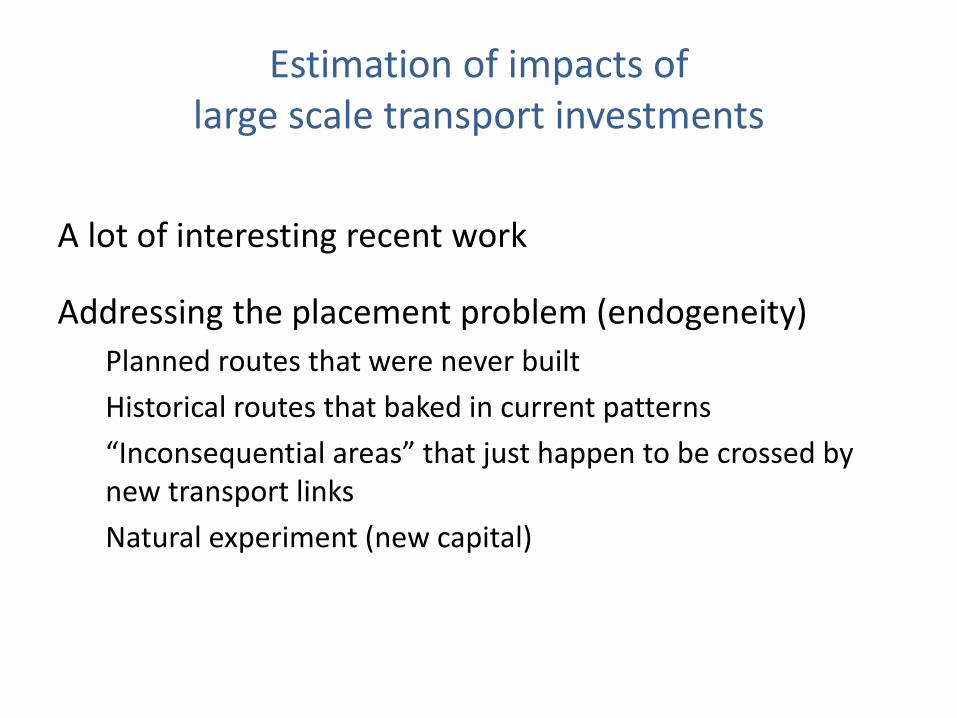
Estimation of impacts of large scale transport investments
A lot of interesting recent work
Addressing the placement problem (endogeneity)
Planned routes that were never built
Historical routes that baked in current patterns
“Inconsequential areas” that just happen to be crossed by new transport links
Natural experiment (new capital)

Generally consistent and robust positive economic impacts of intercity infrastructure
6 - 8% higher long-term earnings in US rural counties with highway access in a number of service sectors (Chandra & Thompson 2000, Michaels 2008)
3% increase in farm wages in counties served by railroad in 19th Century US(Haines and Margo 2008)
17% higher real agricultural income in colonial Indian districts with rail access (Donaldson 2015)
Increases in plant productivity in districts near the Indian Golden Quadrilateral highway system (Ghani et al. 2013)
6% decrease in per capita income in China with doubling of distance to road or rail (Banerjee et al. 2012)
Lower GDP growth among non-targeted connected peripheral counties in Chinaafter highway construction, instead of spillovers from metro areas (Faber 2014)
Half of per capita GDP growth due to improved road access in Brazil (Bird and Straub 2014)
6% decrease in light intensity (as proxy for economic activity) with doubling travel cost to primate city in Africa (Storeygard 2016)
Redding and Turner 2015
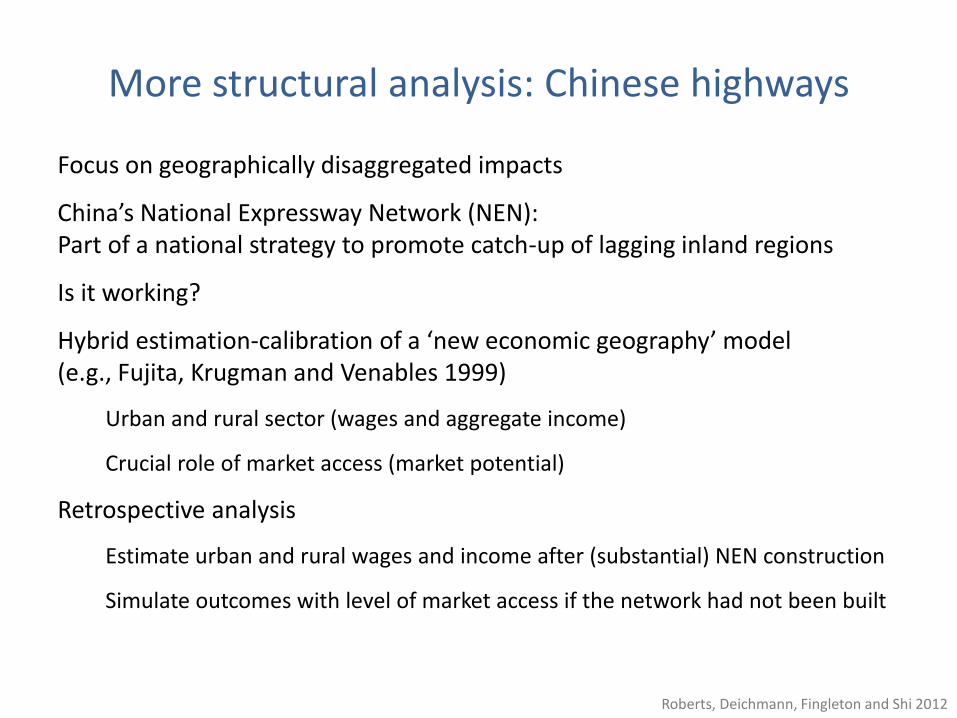
More structural analysis: Chinese highways
Focus on geographically disaggregated impacts
China’s National Expressway Network (NEN): Part of a national strategy to promote catch-up of lagging inland regions
Is it working?
Hybrid estimation-calibration of a ‘new economic geography’ model (e.g., Fujita, Krugman and Venables 1999)
Urban and rural sector (wages and aggregate income)
Crucial role of market access (market potential)
Retrospective analysis
Estimate urban and rural wages and income after (substantial) NEN construction
Simulate outcomes with level of market access if the network had not been built
Roberts, Deichmann, Fingleton and Shi 2012
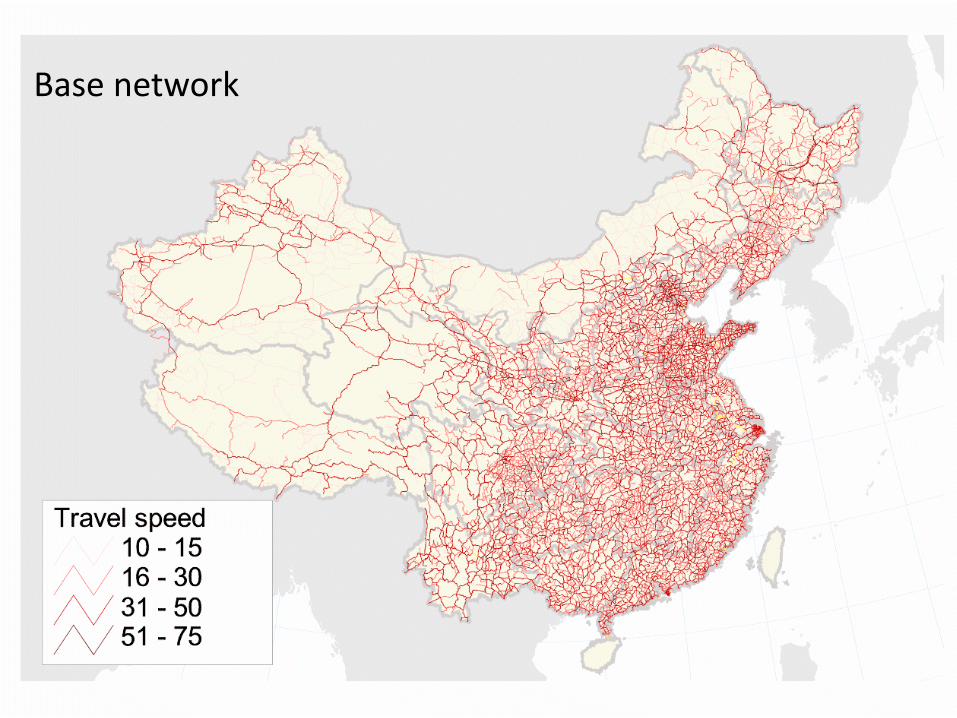
Base network
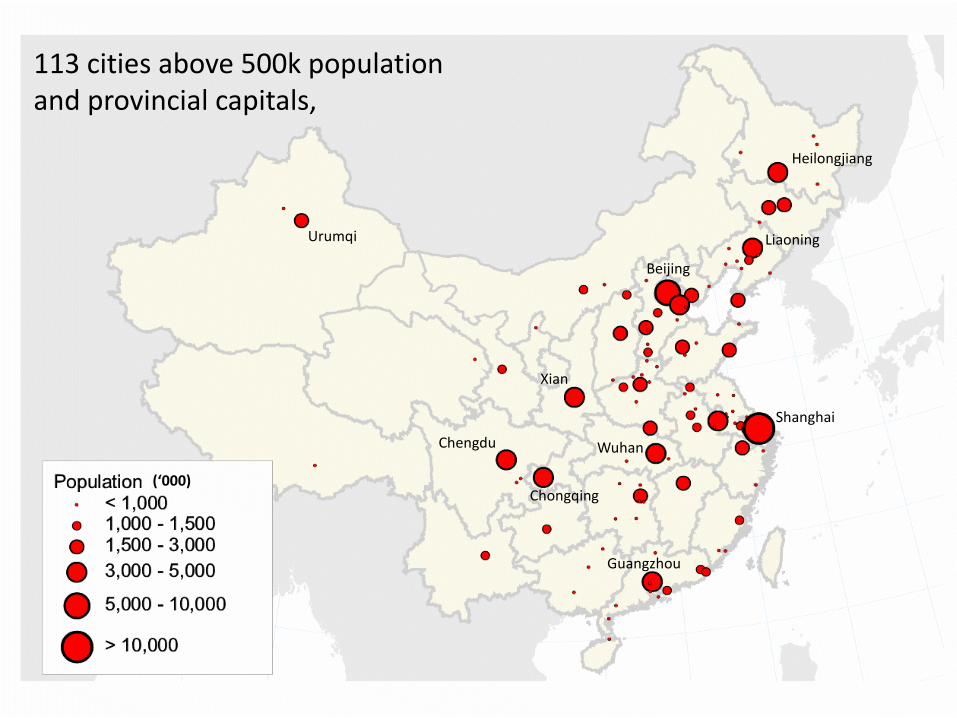
113 cities above 500k populationand provincial capitals,
Beijing
Shanghai
Guangzhou
Chengdu
Heilongjiang
Xian
Urumqi
Wuhan
Chongqing
Liaoning
(‘000)

Complete networkwith expressways highlighted
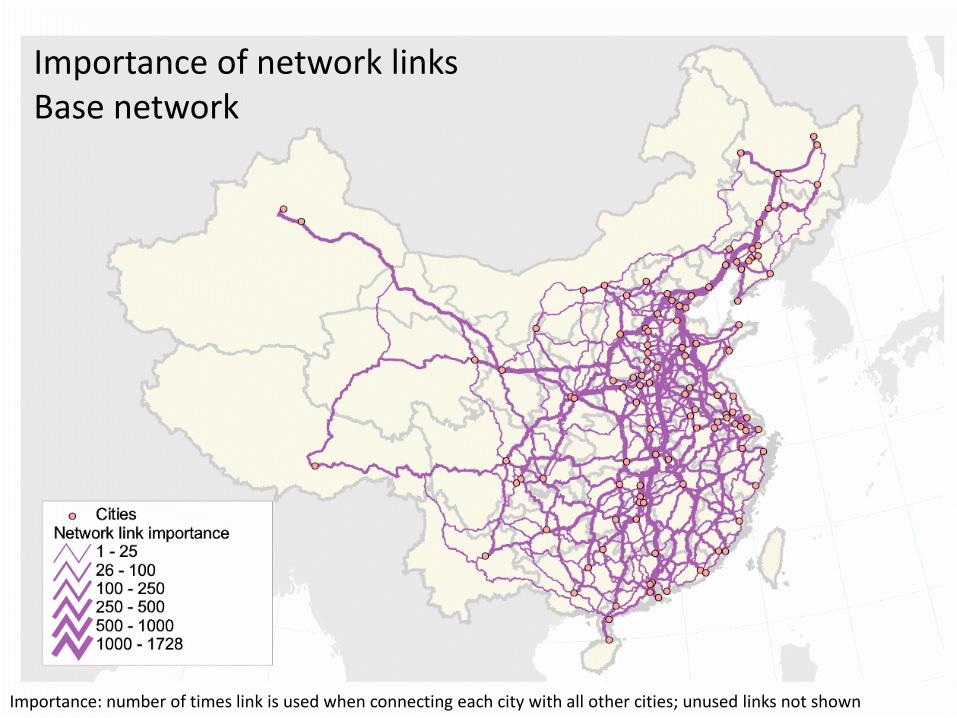
Importance of network linksBase network
Importance: number of times link is used when connecting each city with all other cities; unused links not shown
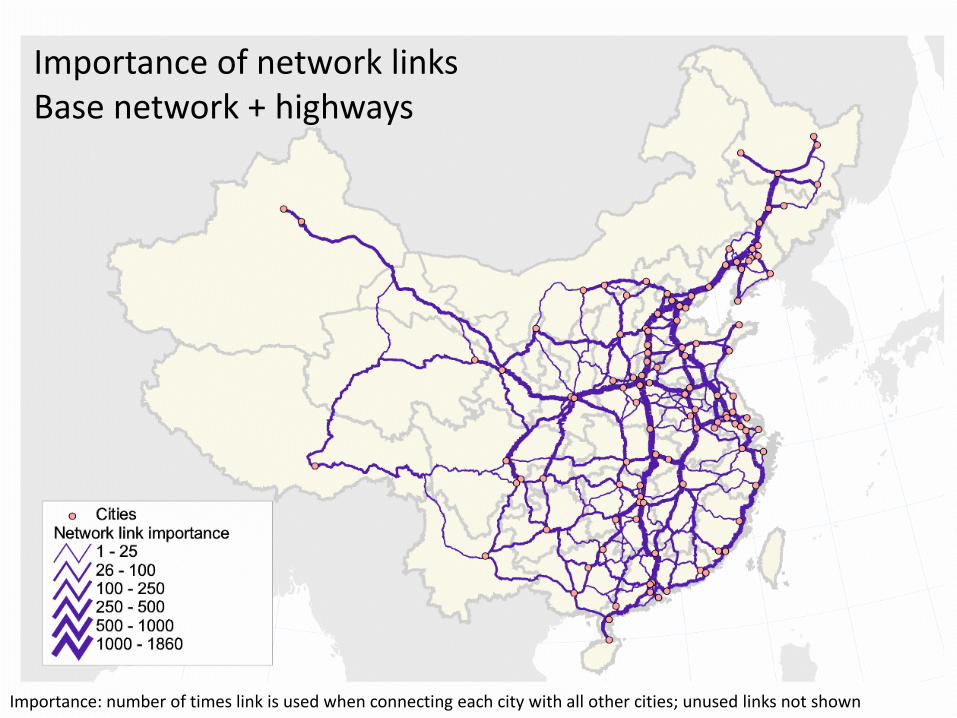
Importance of network linksBase network + highways
Importance: number of times link is used when connecting each city with all other cities; unused links not shown
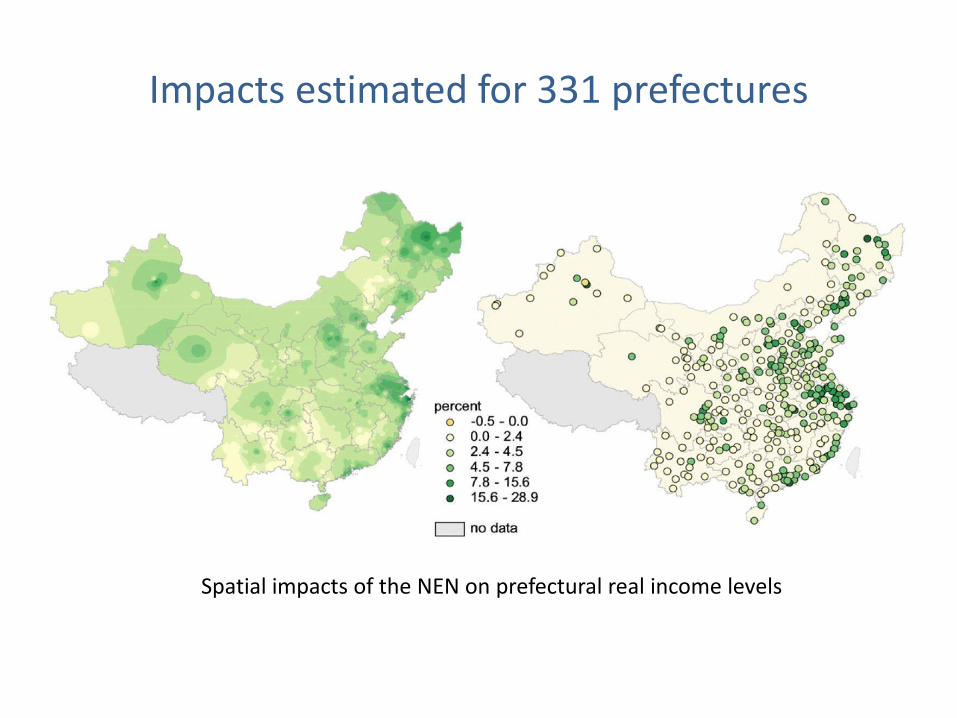
Impacts estimated for 331 prefectures
Spatial impacts of the NEN on prefectural real income levels
Chinese real income with new highways was approximately 6 percent higher than it would have been with no investment
One-off level effect
Real incomes increased in almost all prefectures
Largest increases occurred in Eastern China, so investments have so far not reduced spatial disparities
Mixed effects on wages (declines in either urban or rural wages in about 1/3 of prefectures)
This approach—like others such as Faber 2014—assumes no labor mobility (at most semi-realistic even for China)
Roberts, Deichmann, Fingleton and Shi 2012
Two major Chinese spatial policies
Large scale infrastructure investments (Highways – NEN)
Restrictions on labor mobility (Hukou system)
Loss of public service entitlements when moving
Recently (partly) relaxed
Estimate effects of both policies on real incomes, population, urbanization, rural-urban income gap
Considering changes in market access and differences in amenities across prefectures (combines Roberts et al 2012 & Tabuchi and Thisse 2002)
Scenarios: NEN vs. non-NEN, Hukou vs. no-Hukou
Bosker, Deichmann and Roberts (2015)
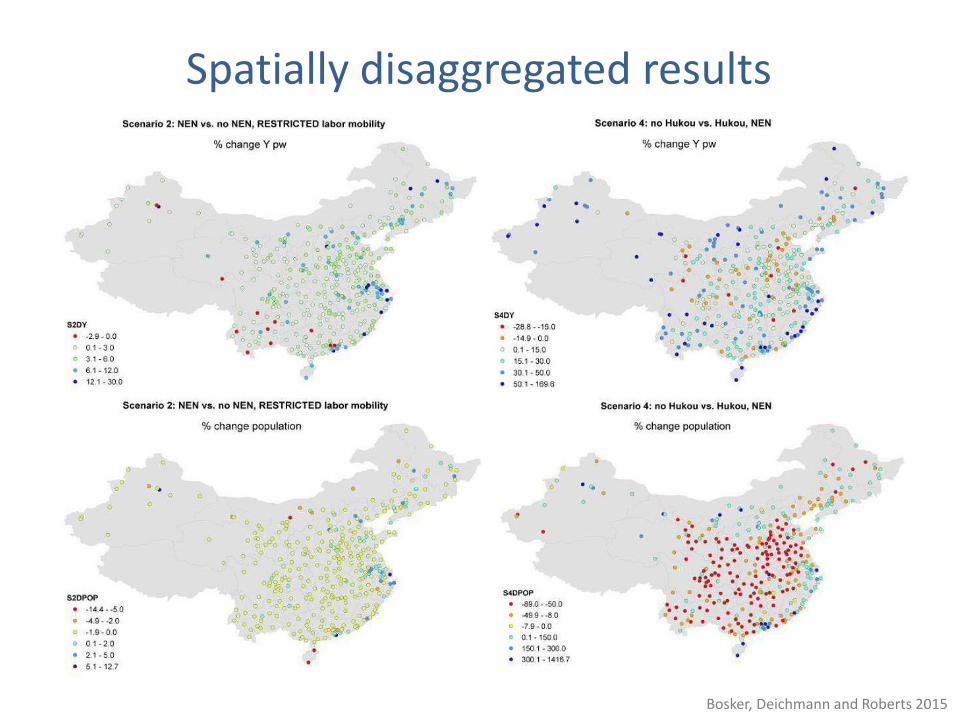
Spatially disaggregated results
Bosker, Deichmann and Roberts 2015
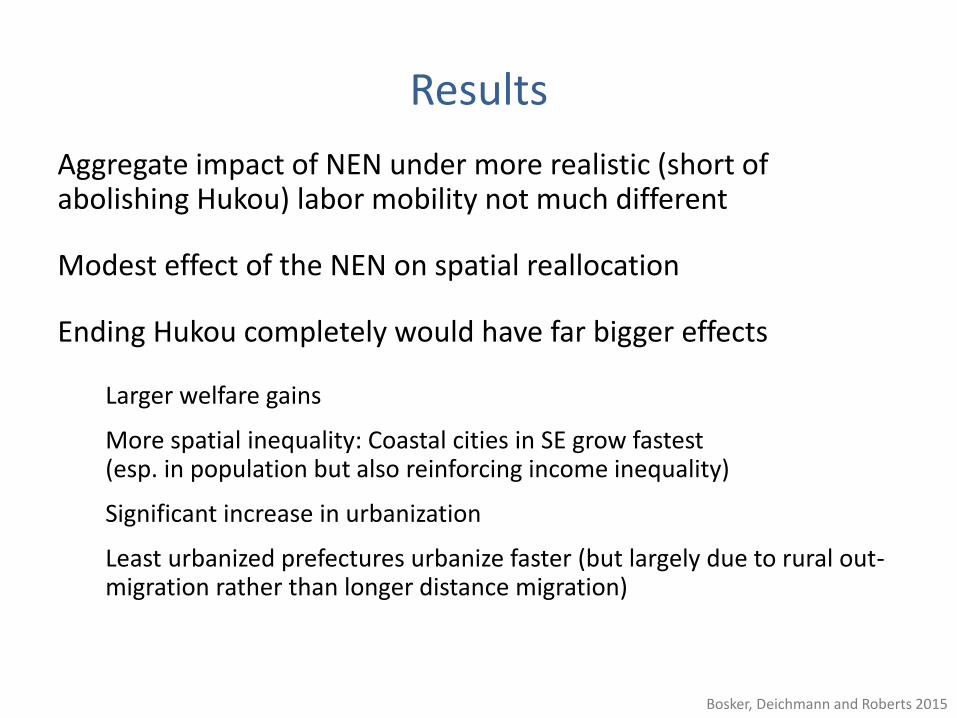
Results
Aggregate impact of NEN under more realistic (short of abolishing Hukou) labor mobility not much different
Modest effect of the NEN on spatial reallocation
Ending Hukou completely would have far bigger effects
Larger welfare gains
More spatial inequality: Coastal cities in SE grow fastest(esp. in population but also reinforcing income inequality)
Significant increase in urbanization
Least urbanized prefectures urbanize faster (but largely due to rural out-migration rather than longer distance migration)
Bosker, Deichmann and Roberts 2015

Policy research priorities: Transport impacts
Interaction between transport policies with other policies (e.g., corridor development)
Rigid land and labor markets could prevent reorganization of the geography of production
When are transport investments in lagging regions: - spatially blind “institutions” – mobility as a basic service that should be available to all (e.g., rural access)
- spatially connective “infrastructure” that integrate poor areas and let markets identify opportunities
- spatially targeted “incentives” (place-based policies) that might lead to inefficient reshuffling of economic activities?
Conclusion: Battles won
Economic geography now a thriving sub-field of economics
Policy focus has shifted from preventing or managing the urbanization process to managing cities
Greater skepticism of place based policies
Conclusion: Battles still to be won
“Institutions” (WDR09): how to provide basic services in (increasingly) sparsely populated lagging areas
Urban management: reducing congestion, promoting inclusion and making room for population growth
And doing so sustainably as both causes and consequences of pollution and climate change are increasingly concentrated in urban areas

Thank you