revised text for txdot manual procedures for establishing
TRANSCRIPT

TTI: 5-5439-01
Revised Text for TxDOT ManualProcedures for Establishing Speed Zones
Chapter 5, Section 2
Product 5-5439-01-P2Cooperative Research Program
in cooperation with theFederal Highway Administration and the
Texas Department of Transportationhttp://tti.tamu.edu/documents/5-5439-01-P2.pdf
TEXAS TRANSPORTATION INSTITUTE THE TEXAS A&M UNIVERSITY SYSTEM
COLLEGE STATION, TEXAS
TEXAS DEPARTMENT OF TRANSPORTATION

REVISED TEXT FOR TXDOT MANUAL PROCEDURES FOR ESTABLISHING SPEED ZONES,
CHAPTER 5, SECTION 2
by
James A. Bonneson, P.E., Ph.D Senior Research Engineer
Texas Transportation Institute
and
Michael P. Pratt, P.E. Assistant Research Engineer
Texas Transportation Institute
Product 5-5439-01-P2 Project 5-5439-01
Project Title: Workshops on Identifying and Testing Advisory Speed Setting Procedures
Performed in Cooperation with the Texas Department of Transportation
and the Federal Highway Administration
June 2009 Published: February 2010
TEXAS TRANSPORTATION INSTITUTE The Texas A&M University System College Station, Texas 77843-3135


Procedures for Establishing Speed Zones 5-1 TxDOT (revision) 06/2009
Chapter 5 Application of Advisory Speeds
Contents: Section 1 — Overview.......................................................................................................... 5-3
Introduction ......................................................................................................................................5-3 Advisory Speed Sign Posting ...........................................................................................................5-3
Section 2 — Curves and Turns ............................................................................................. 5-5 Introduction ......................................................................................................................................5-5 Direct Method...................................................................................................................................5-6 GPS Method .....................................................................................................................................5-8 Design Method ...............................................................................................................................5-14 Compliance Period .........................................................................................................................5-15
Section 3 — Intersections ................................................................................................... 5-16 Introduction ....................................................................................................................................5-16 View Obstructions ..........................................................................................................................5-16
Section 4 — Narrow and One-Lane Bridges ...................................................................... 5-17 Introduction ....................................................................................................................................5-17 Placement of Signs .........................................................................................................................5-17
Section 5 — Descending Grades of Six Percent or Greater ............................................... 5-18 Introduction ....................................................................................................................................5-18 Determining Minimum Sight Distances .........................................................................................5-18 Calculation......................................................................................................................................5-18 If a Curve Is Involved.....................................................................................................................5-18
Section 6 — Dips, Bumps, and Exit Ramps....................................................................... 5-19 Dips and Bumps .............................................................................................................................5-19 Exit Ramps .....................................................................................................................................5-19


Chapter 5 — Application of Advisory Speeds Section 1 — Overview
Procedures for Establishing Speed Zones TxDOT (revision) 06/2009 5-3
Section 1 Overview
Introduction
A discussion of the following types of advisory speeds is included in this section:
♦ curves and turns,
♦ intersections,
♦ narrow and one-lane bridges,
♦ descending grades of six percent or greater,
♦ dips, and
♦ exit ramps.
Advisory Speed Sign Posting
The W13-1 ADVISORY SPEED sign may be used in conjunction with any warning sign to indicate the maximum safe speed for passenger cars around a curve or through a hazardous location. It must not be used in conjunction with any sign other than a warning sign, nor shall it be used alone.
The W13-1 sign shall always be mounted on the same post with and immediately below the warning sign to which it applies.
Figure 5-1 shows typical warning and advisory speed signing applications.
(continued...)

Chapter 5 — Application of Advisory Speeds Section 1 — Overview
Procedures for Establishing Speed Zones TxDOT (revision) 06/2009 5-4
Advisory Speed Sign Posting (continued)
Figure 5-1. Typical height and location of warning and advisory speed signs.

Chapter 5 — Application of Advisory Speeds Section 2 — Curves and Turns
Procedures for Establishing Speed Zones TxDOT (revision) 06/2009 5-5
Section 2 Curves and Turns
Introduction
Warning signs are intended to improve curve safety by alerting the driver to a change in geometry that may not be apparent or expected. These signs notify drivers of the change through the use of one or more of the curve warning signs identified in the TMUTCD. These drivers may also be notified of the need to reduce their speed through the use of a W13-1 ADVISORY SPEED plaque. When one or more warning signs are used at a horizontal curve, the curve advisory speed and other curve-related traffic control devices should be checked periodically to ensure that they are appropriate for the prevailing conditions. Changes in the regulatory speed limit, curve geometry, or crash history may justify the conduct of an engineering study to re-evaluate the appropriateness of the existing signs and posted advisory speed. Objective. An important objective in horizontal curve signing is having a uniform and consistent display of advisory speed on curves of similar geometry, character (e.g., sight distance, intersection presence, etc.), and road surface condition. As stated in the TMUTCD, “uniformity of the meaning of traffic control devices is vital to their effectiveness” (Section 1A.02). It further describes the benefits of uniformity in the following statement. “Uniformity of devices simplifies the task of the road user because it aids in recognition and understanding, thereby reducing perception/reaction time. Uniformity means treating similar situations in a similar way” (Section 1A.06). The uniform application of a traffic control device allows drivers to develop an expectation that leads to the correct interpretation of device message. In this manner, a uniformly applied advisory speed will be more likely to be understood and respected by drivers. Research indicates that the historically inconsistent use of curve warning signs, especially those with an advisory speed plaque, may have lessened the average motorist’s respect for the message these signs convey. On familiar highways, drivers have come to learn that they can comfortably exceed the advisory speed for most curves. The concern is that these drivers may occasionally travel on roadways that are less familiar to them and where the advisory speed is posted at the maximum safe speed. These drivers may find themselves traveling too fast for conditions and experience uncomfortable side forces. In extreme cases, they may lose control of the vehicle and slide off the roadway. Three Methods. Three methods for establishing curve warning advisory speeds are described in this section. The methods are based on the same criteria and will provide a uniform and consistent display of advisory speed among curves, regardless of which method is used. For all methods, the advisory speed is defined as the average speed of free-flowing trucks.

Chapter 5 — Application of Advisory Speeds Section 2 — Curves and Turns
Procedures for Establishing Speed Zones TxDOT (revision) 06/2009 5-6
Any one of the following three methods can be used to determine the curve advisory speed: • Direct Method, • Global Positioning System (GPS) Method, and • Design Method. Steps for implementing each method are described in the next section. The Direct Method is based on the field measurement of curve speed. The GPS Method is based on a single-pass survey using a GPS receiver and software to compute the curve radius and deflection angle. The Design Method is useful when the radius and deflection angle are available from as-built plans. Issues with Ball-Bank Indicator. Historically, the ball-bank indicator has been used to establish the curve advisory speed. However, this device is susceptible to forces that are not a result of road curvature (e.g., bounce due to rough pavement, jerk due to steering corrections, slip due to variation in pavement friction supply, etc.). These forces come and go while traveling along the curve and cause the ball-bank indicator to produce readings that can vary randomly by several degrees. All too often, one of these random peak readings is mistakenly used as the basis for determining the advisory speed. This characteristic of the ball-bank indicator is one reason that advisory speed is not uniform among curves of similar geometry. For this reason, the three methods described in this section are not based on a specified threshold ball-bank reading (e.g., 10 degrees).
Direct Method
The Direct Method is based on the field measurement of vehicle speeds on the subject curve. The procedure for implementing the Direct Method consists of three steps. During the first step, speed measurements are taken in the field. During the second step, the measurements are used to compute the advisory speed. During the last step, the recommended advisory speed is confirmed through a field trial run. Each of these steps is described in the remainder of this section. Step 1: Field Measurements. Measure the speed of 125 or more free-flowing passenger cars at about the middle of the curve in one direction of travel. Normal speed checks should be discontinued after two hours if radar is used, or after four hours if a traffic counter that classifies vehicles by type is used―even if 125 cars have not been timed. A free-flowing vehicle will be at least 3 seconds behind the previous vehicle. Repeat the measurements for the opposing direction of travel if the road is divided or if conditions suggest the need for separate consideration of each curve travel direction. When two or more curves are separated by a tangent of 600 ft or less, one sign should apply for all curves. However, each curve should be surveyed separately in this step. Compute the arithmetic average of the measured speeds for each direction of travel at each curve studied. Also, compute the 85th percentile speed for each direction and curve.

Chapter 5 — Application of Advisory Speeds Section 2 — Curves and Turns
Procedures for Establishing Speed Zones TxDOT (revision) 06/2009 5-7
Step 2: Determine Advisory Speed. Multiply each of the average speeds from Step 1 by 0.97 to obtain an estimate of the average truck speed for each direction of travel. The advisory speed for each direction of travel is then computed by first adding 1.0 mph to the corresponding average and then rounding the sum down to the nearest 5 mph increment. This technique yields a conservative estimate of the advisory speed by effectively rounding curve speeds that end in 4 or 9 up to the next higher 5 mph increment, while rounding all other speeds down. For example, applying this rounding technique to a curve speed of 54, 55, 56, 57, or 58 mph yields an advisory speed of 55 mph. When two or more curves are separated by a tangent of 600 ft or less, one sign should apply for all curves. However, each curve should be evaluated separately in this step. The advisory speed plaque should show the value for the curve having the lowest advisory speed in the series. Step 3: Confirm Speed for Conditions. During this step, the appropriateness of the advisory speed determined in Step 2 is evaluated. As an initial task, the need for an advisory speed plaque is checked. A representative 85th percentile speed on tangent sections of the roadway is needed for this check. It can be measured using the procedure described in Step 1 or estimated from the regulatory speed limit. If it is measured, the point of measurement should be at least 8 seconds travel time from any curve in either direction. The 85th percentile tangent speed and the 85th percentile curve speed (from Step 1) are used with Figure 5-2 to determine the need for an advisory speed plaque. Figure 5-2. Guidelines for determining the need for an advisory speed plaque.
15
20
25
30
35
40
45
50
55
60
65
70
20 25 30 35 40 45 50 55 60 65 70 75
85th % Tangent Speed, mph
85th
% C
urve
Spe
ed, m
ph
Advisory speed plaque not recommended.
Advisory speed plaque recommended.

Chapter 5 — Application of Advisory Speeds Section 2 — Curves and Turns
Procedures for Establishing Speed Zones TxDOT (revision) 06/2009 5-8
A second task involves a field evaluation of curve conditions. The evaluation includes consideration of the following factors: • driver approach sight distance to the beginning of the curve, • visibility around the curve, • unexpected geometric features within the curve, and • position of the most critical curve in a sequence of closely-spaced curves. The unexpected geometric features noted in the third bullet may include: • presence of an intersection, • presence of a sharp crest curve in the middle of the horizontal curve, • sharp curves with changing radius (including curves with spiral transitions), • sharp curves after a long tangent section, and • broken-back curves. A final task involves a test run through the curve while traveling at the advisory speed determined in Step 2. The engineer may choose to adjust the advisory speed or modify the warning sign layout based on consideration of the aforementioned factors. The advisory speed for one direction of travel through the curve may differ from that for the other direction.
GPS Method
The GPS Method is based on the field measurement of curve geometry. The geometric data are then used with a speed-prediction model to compute the average speed of trucks. This speed then becomes the basis for establishing the advisory speed. The procedure for implementing the GPS Method consists of three steps. During the first step, measurements are taken in the field while traveling along the curve. During the second step, the measurements are used to compute the advisory speed. During the last step, the recommended advisory speed is confirmed through a field trial run. Each of these steps is described in the remainder of this section. To ensure reasonable accuracy in the model estimates using this method, the curve deflection angle should be 6 degrees or more. A curve with a smaller deflection angle will rarely justify curve warning signs or an advisory speed plaque. Equipment. The equipment used includes the following: • GPS receiver, • electronic ball-bank indicator (optional), and • laptop computer. The GPS receiver is used to estimate curve radius and deflection angle. The electronic ball-bank indicator is optional and is used to estimate superelevation rate. If an electronic ball-

Chapter 5 — Application of Advisory Speeds Section 2 — Curves and Turns
Procedures for Establishing Speed Zones TxDOT (revision) 06/2009 5-9
bank indicator is not used, then the superelevation rate will need to be estimated using other means. The computer is used to run the Texas Roadway Analysis and Measurement Software (TRAMS) program. This program is designed to monitor the GPS receiver and the electronic ball-bank indicator while the test vehicle is driven along the curve. After the curve is traversed, TRAMS calculates curve radius and superelevation rate from the data streams. Advisory speed and traffic control device selection guidelines can be determined using the radius and superelevation rate estimates with the Texas Curve Advisory Speed (TCAS) spreadsheet. The TRAMS software, TCAS spreadsheet, and a TRAMS Installation Manual are available from the Traffic Operations Division. Installation. The following activities must be completed the first time TRAMS is installed on the computer. More details are provided in the TRAMS Installation Manual. • Install the driver for the GPS receiver. • If the electronic ball-bank indicator is used, an adapter may be needed to convert its
RS-232 connection into a USB connection. Install the driver for this adapter. • Install TRAMS (a copy of TCAS will also be installed in the TRAMS file directory). Equipment Setup. The following activities must be completed prior to using the equipment to establish the advisory speed for one or more curves. • Mount the GPS receiver and electronic ball-bank indicator (if used) on the dashboard in a
fixed position. These devices should not be able to move during the test runs. Figure 5-3 shows the devices mounted on the dashboard and secured using an adhesive tape.
a. Equipment setup. b. Measurement devices. Figure 5-3. Equipment setup in test vehicle.
• If an electronic ball-bank indicator is used, activate its auto leveling feature with the test
vehicle parked on level pavement. Do this under the same vehicle loading and tire inflation conditions that will be present during the test runs.
• With the laptop on, click on the TRAMS icon to launch TRAMS. TRAMS will initially connect with the two devices. It will then present the main panel, as shown in Figure 5-4.

Chapter 5 — Application of Advisory Speeds Section 2 — Curves and Turns
Procedures for Establishing Speed Zones TxDOT (revision) 06/2009 5-10
• Verify that TRAMS is receiving valid data from the GPS receiver. Information about the status of this device is located in the upper right corner of the main panel, as shown in Figure 5-4. A red circle indicates invalid (bad) data. A green circle indicates valid (good) data.
Figure 5-4. TRAMS main panel.
• If the electronic ball-bank indicator (BBI) is used, verify that TRAMS is receiving valid
data from it. A red square indicates invalid (bad) data. A green square indicates valid (good) data.
• If valid data are not being received by one or both of the devices, check the following conditions: o Are the devices turned on and properly connected to the laptop computer? o Is the GPS receiver blocked from obtaining good satellite reception? Structures
(bridges, garage roofs, buildings, etc.) or dense tree coverage may make it difficult to maintain GPS reception.
Chapter 5 — Application of Advisory Speeds Section 2 — Curves and Turns
Procedures for Establishing Speed Zones TxDOT (revision) 06/2009 5-11
o Has TRAMS been configured with the proper port numbers for the devices? This can usually be accomplished by selecting the “Automatic” mode in the Configure Devices panel (from the main panel, select File, Configuration Settings, Configure Devices). If used, the electronic ball-bank indicator (“Rieker Device”) must also be enabled in this panel (i.e., select Enabled in the Rieker box).
o If any settings are changed in the Configure Devices panel, the Save Configuration File option should be selected to save all settings to file (in which case they will be loaded and used each time TRAMS is launched).
Step 1: Field Measurements. Before beginning a test run, enter the curve number and highway name in their respective fields provided on the main panel (see Figure 5-4). Repeat the measurements for the opposing direction of travel if the road is divided or if conditions suggest the need for separate consideration of each curve travel direction. When two or more curves are separated by a tangent of 600 ft or less, one sign should apply for all curves. However, each curve should be surveyed separately in this step. Speed Limit. If the 85th percentile tangent speed is not known, note the regulatory speed limit on the roadway where the curve is located. The speed limit can subsequently be used in TCAS to estimate the 85th percentile tangent speed. Test Run Speed. The following rules-of-thumb should be considered when selecting the test run speed: • The test run speed should be at least 10 mph below the existing curve advisory speed
provided that the resulting test run speed is not less than 15 mph. • If superelevation rate is being measured, test runs should be conducted at 45 mph or less,
with slower speeds considered desirable in terms of yielding more accurate estimates of superelevation.
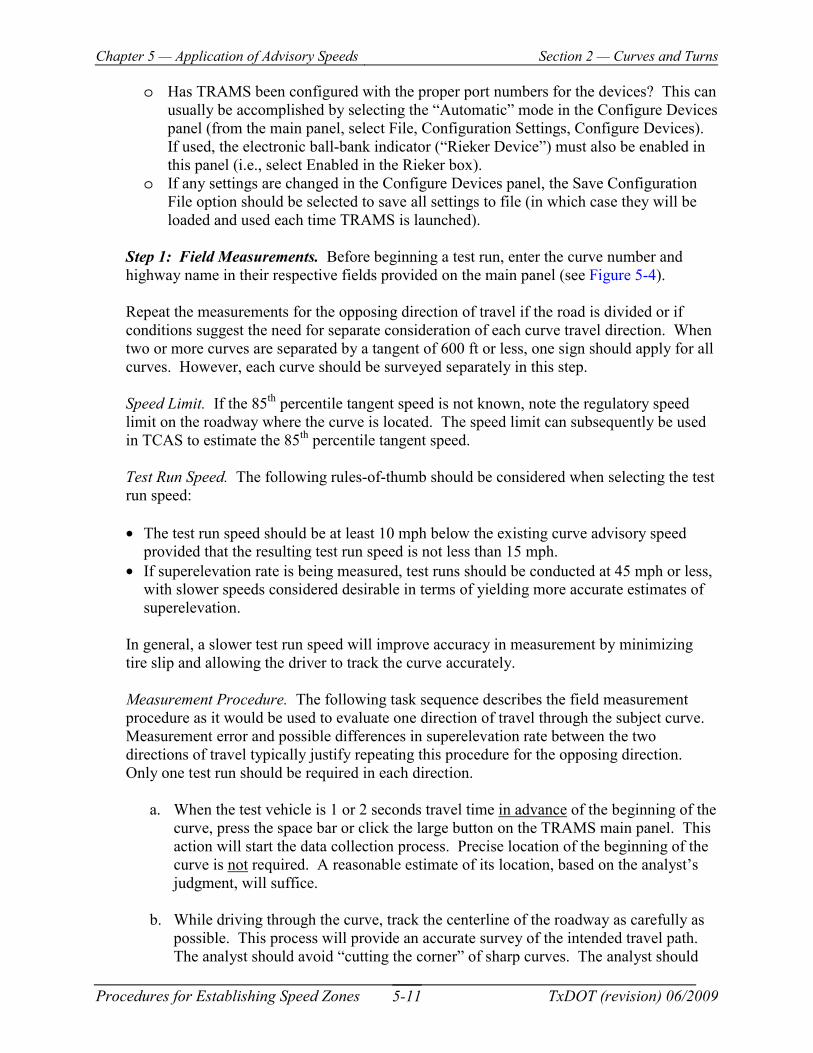
In general, a slower test run speed will improve accuracy in measurement by minimizing tire slip and allowing the driver to track the curve accurately. Measurement Procedure. The following task sequence describes the field measurement procedure as it would be used to evaluate one direction of travel through the subject curve. Measurement error and possible differences in superelevation rate between the two directions of travel typically justify repeating this procedure for the opposing direction. Only one test run should be required in each direction.
a. When the test vehicle is 1 or 2 seconds travel time in advance of the beginning of the curve, press the space bar or click the large button on the TRAMS main panel. This action will start the data collection process. Precise location of the beginning of the curve is not required. A reasonable estimate of its location, based on the analyst’s judgment, will suffice.
b. While driving through the curve, track the centerline of the roadway as carefully as
possible. This process will provide an accurate survey of the intended travel path. The analyst should avoid “cutting the corner” of sharp curves. The analyst should

Chapter 5 — Application of Advisory Speeds Section 2 — Curves and Turns
Procedures for Establishing Speed Zones TxDOT (revision) 06/2009 5-12
also avoid letting the vehicle drift to the outside of the lane while traveling along the curve.
c. When the test vehicle is 1 or 2 seconds travel time beyond the end of the curve, press
the space bar or click the large button a second time to stop recording curve data. Precise location of the end of the curve is not required. A reasonable estimate of its location, based on the analyst’s judgment, will suffice.
Save the File. When asked whether a curve report file should be saved, indicate “Yes” by pressing Enter (or clicking on the Yes button). Alternatively, indicate “No” if it is believed that the curve was not accurately measured during the test run (e.g., the driver did not accurately track the curve, or the data recording was not started and stopped at the appropriate times). CAUTION: If the curve has the same number as a curve that was previously evaluated, the new file will overwrite the file from the previous curve. Optional Check When Superelevation Rate is Measured. At the conclusion of the test run, the 95th percentile error range for superelevation rate is provided in the curve report file. It can be checked to confirm that the estimated value is reasonably precise. If this range exceeds 3 percent, repeat the test run at a lower speed. If the aforementioned test-run-speed rules-of-thumb were followed, then this check should not be needed. The curve report file can be accessed from the main panel by selecting File, Open Curve Report and then selecting the appropriate “log” file. The file will be named “Curve-XX-Rpt.Log,” where XX will be replaced by the curve number entered on the main panel before the start of the test run. Once the file is selected, select Open and the file will be opened in Notepad, a text editor provided with Windows®.
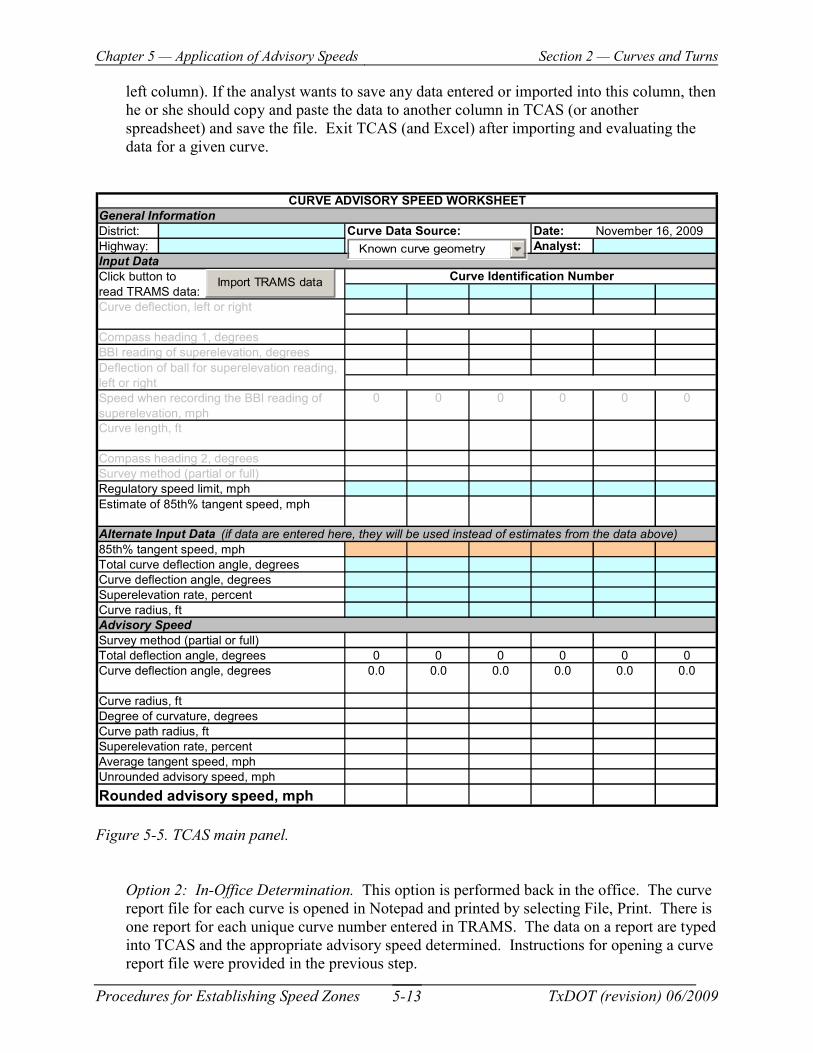
Step 2: Determine Advisory Speed. Two options are available for determining the advisory speed. One option is based on a review of the survey data in the field. The second option is based on a review of the survey data in the office, following the survey of all curves of interest. When two or more curves are separated by a tangent of 600 ft or less, one sign should apply for all curves. However, each curve should be evaluated separately in this step. The advisory speed plaque should show the value for the curve having the lowest advisory speed in the series. Option 1: In-Field Determination. This option is performed in the field. The data from the most recent test run is exported directly to TCAS. This action is accomplished from the main panel by selecting File, Export to TCAS. At this point, TCAS will load. The analyst will need to click on the “Import TRAMS Data” button in TCAS to import the test run data into TCAS. This button is shown in the upper left corner of Figure 5-5. The analyst will also need to enter the 85th percentile speed in TCAS in the second to last row of the Input Data section. Alternatively, the analyst can enter the speed limit in the Alternate Input Data section and let TCAS compute an estimate of the 85th percentile speed. As shown in Figure 5-5, TCAS allows the entry of data for up to six test runs, one column for each test run. The imported data are always placed in the same TCAS column (i.e., the
Chapter 5 — Application of Advisory Speeds Section 2 — Curves and Turns
Procedures for Establishing Speed Zones TxDOT (revision) 06/2009 5-13
left column). If the analyst wants to save any data entered or imported into this column, then he or she should copy and paste the data to another column in TCAS (or another spreadsheet) and save the file. Exit TCAS (and Excel) after importing and evaluating the data for a given curve.
Figure 5-5. TCAS main panel.
Option 2: In-Office Determination. This option is performed back in the office. The curve report file for each curve is opened in Notepad and printed by selecting File, Print. There is one report for each unique curve number entered in TRAMS. The data on a report are typed into TCAS and the appropriate advisory speed determined. Instructions for opening a curve report file were provided in the previous step.
General InformationDistrict: Curve Data Source: Date:Highway: Analyst:Input DataClick button toread TRAMS data:Curve deflection, left or right
Compass heading 1, degreesBBI reading of superelevation, degrees
0 0 0 0 0 0
Curve length, ft
Compass heading 2, degreesSurvey method (partial or full)Regulatory speed limit, mphEstimate of 85th% tangent speed, mph
Alternate Input Data (if data are entered here, they will be used instead of estimates from the data above)85th% tangent speed, mphTotal curve deflection angle, degreesCurve deflection angle, degreesSuperelevation rate, percentCurve radius, ftAdvisory Speed Survey method (partial or full)Total deflection angle, degrees 0 0 0 0 0 0Curve deflection angle, degrees 0.0 0.0 0.0 0.0 0.0 0.0
Curve radius, ftDegree of curvature, degreesCurve path radius, ftSuperelevation rate, percentAverage tangent speed, mphUnrounded advisory speed, mphRounded advisory speed, mph
CURVE ADVISORY SPEED WORKSHEET
Curve Identification Number
November 16, 2009
Speed when recording the BBI reading of superelevation, mph
Deflection of ball for superelevation reading, left or right
Known curve geometry
Import TRAMS data

Chapter 5 — Application of Advisory Speeds Section 2 — Curves and Turns
Procedures for Establishing Speed Zones TxDOT (revision) 06/2009 5-14
Step 3: Confirm Speed for Conditions. During this step, the appropriateness of the advisory speed determined in Step 2 is evaluated. The activities conducted during this step are the same as those discussed in Step 3 of the Direct Method, except that the need for an advisory speed plaque is checked using the information in the Traffic Control Device Guidance section of TCAS.
Design Method The Design Method is based on the use of curve geometry data obtained from files or as-built plans. This method is suitable for evaluating newly constructed or reconstructed curves because the data are available from construction plans. The procedure for implementing the Design Method consists of three steps. During the first step, curve geometry data are obtained from files or plans. During the second step, the measurements are used to compute the advisory speed. During the last step, the recommended advisory speed is confirmed through a field trial run, if or when the curve exists. Each of these steps is described in the remainder of this section. Step 1: Obtain Curve Geometry. Consult the appropriate files to obtain the radius, deflection angle, and superelevation rate for the curve. If the curve is circular, the “total curve deflection angle” is equivalent to the “curve deflection angle,” as used in TCAS. The total curve deflection angle equals the deflection angle in the two intersecting tangents. If spiral transition curves are included in the design, obtain the radius and superelevation rate data for the central circular curve. The total curve deflection angle is the same as defined in the previous paragraph. The curve deflection angle represents the deflection angle of the central circular curve. If compound curvature is used in the design, obtain the radius and superelevation rate data for the sharpest component curve. The total curve deflection angle is the same as defined in the first paragraph. The curve deflection angle represents the deflection angle of the sharpest component curve. Obtain the aforementioned data for both directions of travel if the road is divided or if conditions suggest the need for separate consideration of each curve travel direction. When two or more curves are separated by a tangent of 600 ft or less, one sign should apply for all curves. However, data for each curve should be obtained in this step. Step 2: Determine Advisory Speed. The data obtained in Step 1 are entered in TCAS in the section titled Alternate Input Data. If a reasonable estimate of the 85th percentile tangent speed is not available, the speed limit can be used in TCAS to estimate the 85th percentile tangent speed. Note: the drop-down list at the top of the spreadsheet should be set to “Known curve geometry.” When two or more curves are separated by a tangent of 600 ft or less, one sign should apply for all curves. However, each curve should be evaluated separately in this step. The

Chapter 5 — Application of Advisory Speeds Section 2 — Curves and Turns
Procedures for Establishing Speed Zones TxDOT (revision) 06/2009 5-15
advisory speed plaque should show the value for the curve having the lowest advisory speed in the series. Step 3: Confirm Speed for Conditions. During this step, the appropriateness of the advisory speed determined in Step 2 is evaluated. The activities conducted during this step are the same as those discussed in Step 3 of the Direct Method, except that the need for an advisory speed plaque is checked using the information in the Traffic Control Device Guidance section of TCAS.
Compliance Period In order to allow the districts ample time to acquire the necessary equipment to perform one of the three methods described in this section, the ball-bank method may be used to determine the advisory speed of curves until January 1, 2013. After that date, curve advisory speed signs installed on the state highway system shall be established by one of the three methods described in this section. All existing curve advisory speed signs shall be verified to be in compliance with any one of the three methods described in this section (and changed if necessary) by a target compliance date of January 1, 2015.

Chapter 5 — Application of Advisory Speeds Section 3 — Intersections
Procedures for Establishing Speed Zones TxDOT (revision) 06/2009 5-16
Section 3 Intersections
Introduction
Advisory zones may be posted at intersections such as roundabouts designed for an operating speed less than the speed of the approaches and intersections with restricted sight distances that require a reduction in speed for safe operation.
View Obstructions
For intersections having view obstructions, trial runs should be conducted to determine the safe and reasonable speed for the area. This speed may be posted as an advisory speed below a warning sign to warn motorists of the limited sight distance.

Chapter 5 — Application of Advisory Speeds Section 4 — Narrow and One-Lane Bridges
Procedures for Establishing Speed Zones TxDOT (revision) 06/2009 5-17
Section 4 Narrow and One-Lane Bridges
Introduction
Narrow bridges with clear width between curbs less than 18 feet but more than 16 feet, and one lane bridges with clear width between curbs of 16 feet or less may require advisory speeds. As a rule, advisory speed zones should be applied for such structures when horizontal or vertical sight distance restrictions on the approaches require a reduction of approach speeds for safe operation. Advisory speeds of this type are intended to eliminate the element of surprise.
Placement of Signs
The normal location of the W5-2 or W5-2a NARROW BRIDGE or W5-3 ONE LANE BRIDGE signs, under which a W13-1 ADVISORY SPEED sign would be mounted, is specified in the latest edition of the Texas Manual on Uniform Traffic Control Devices (Table 2C-4). The signs may be located at a greater distance in advance of the bridge if necessary to allow sufficient time and distance for deceleration and may be repeated at the point where the structure first comes into view.

Chapter 5 — Application of Advisory Speeds Section 5 — Descending Grades of Six Percent or Greater
Procedures for Establishing Speed Zones TxDOT (revision) 06/2009 5-18
Section 5 Descending Grades of Six Percent or Greater
Introduction
Where vehicles may attain a speed in excess of that required for a safe stopping distance or in excess of that required for safe travel around curves at the bottom or within the limits of the grade, the posting of an advisory speed may be prudent.
Determining Minimum Sight Distances
The minimum horizontal and vertical sight distances on descending grades of 6 percent or greater should be determined either by field measurements or by calculations from the plans.
Calculation
Using the minimum sight distance as the safe stopping distance, the critical speed should be calculated from the formula
Vg
Vd 93.2)4.0(30
2
+±
=
where: d = sight distance for safe stopping distance in feet; V = the velocity in miles per hour; and g = percent of grade (in decimal form) divided by 100.
If a Curve Is Involved
If a curve is within the limits of or at the bottom of such a grade, the advisory speed for the curve should be determined by the procedure found in Section 2 of this chapter, “Curves and Turns.”
The speed to be posted should be the lower of the two speeds found for providing a safe stopping distance and that for safe travel around the curve.

Chapter 5 — Application of Advisory Speeds Section 6 — Dips, Bumps, and Exit Ramps
Procedures for Establishing Speed Zones TxDOT (revision) 06/2009 5-19
Section 6 Dips, Bumps, and Exit Ramps
Dips and Bumps
An advisory speed may be desirable where a depression or bump in the road profile is sufficiently abrupt to create a hazardous condition, cause discomfort to passengers, cause a shifting in cargo, or deflect a vehicle from its true course when crossed at speeds prevailing on the approaches.
The speed to be posted for dips or bumps should be determined by trial runs. It should be the highest speed that will enable a vehicle to travel over the dip or bump without considerable discomfort to passengers, without causing a shifting of cargo, or without causing a deflection of a vehicle from its true course.
Exit Ramps
The Exit Speed or Ramp Speed signs (W13-2 and W13-3) are intended for use where engineering investigations of roadway, geometric, or operating conditions show the necessity of advising drivers of the maximum recommended speed on a ramp.
