reviewer 1: no responses - transportation research …docs.trb.org/prp/16-4339.pdf · 16-4339: b44...
TRANSCRIPT

16-4339: B44 Select Bus Service on Nostrand Avenue: Bus Rapid Transit-Induced Mode Shift and
Route Shift in Transit-Dense Brooklyn
Authors’ Responses to Reviewer Comments/Questions (indicated in blue)
Reviewer 1:
No responses
Reviewer 2:
It would be helpful to have baseline data for changes in employment in the area
Some demographic data is discussed in the Project Background section, though no
comparison between before and after demographics is made. The authors didn’t include data
on employment changes because it is unlikely to shed light on the relevant piece of the
ridership puzzle. The B44 gained ridership at the expense of other buses that run along the
very same corridors. If employment was a factor, it would likely have affected all of the
nearby bus routes.
The text should also describe any advertising or promotional efforts and indicate whether there were
any changes to fares, parking rates, etc. Even if these things show no correlation with the changes in
ridership it will help to isolate the factors that account for the observed results.
Public-focused efforts can be better described as community outreach, rather than promotion.
The authors consider these efforts to be part of the general process of notifying bus
customers, store owners, and citizens about changes relevant to their community and their
commutes. Language was added to the end of the Transit Operations subsection of the
Implementation section to reflect this. There were no changes to transit fares or parking rates,
though parking regulations were changed, as explained in first paragraph of the Curb
Management and Signal Changes subsection in the Street Design and Traffic Operations
section.
Was there a change in the number of peak period standees?
MTA does not officially record this data, and because any calculations based on number of
seats and ridership would be at best estimations, the authors chose not to include these
statistics. However, the authors hypothesize that the switch to larger buses with more seats
has probably decreased crowding and the proportion of standees. Some language was added
to the last paragraph of the Transit Operations subsection to reflect this.
There is an extensive literature dealing with elasticity of demand for transit service. This paper would
be improved by referring to that work. Is there reason to think the value of the travel time savings are
sufficiently large to explain the increase in ridership for B44 SBS relative to other routes in the area?
The authors added a Literature Review subsection in the Introduction section, just before the
Project Background subsection to briefly discuss the elasticity of demand literature. The
authors believe the travel time savings is one of the primary reasons for the recent increases
in ridership, though increased comfort and information likely also play significant roles in
attracting riders. However, the statistical examination of the relative importance of these
factors in generating new ridership is considered outside the scope of this paper.

The paper describes impressive improvements in bus speed but there is no discussion of whether
similar improvements were achieved for on-time performance/schedule adherence. It would also be
helpful to know if headways were improved as part of this effort.
The B44 Limited/SBS schedule was not altered as part of the immediate conversion to Select
Bus Service. Although the buses serving the route got larger, buses have not been added to
the route, so headways have remained unaltered. Before and after on-time performance
comparisons are difficult because GPS-based methods that are currently used were not
available before construction began on the project corridors.
Though it goes a little beyond the scope of the paper it would be interesting to include a few of the
standard transit performance metrics such as boardings per service hour and operating cost per
boarding.
The authors agree that reporting these metrics is beyond the scope of the paper, and would be
difficult to fit in.
Reviewer 3:
A literature review needs to be included in the paper covering findings by others in relation to SBS or
similar implementations and/or research on this mode.
The authors added a Literature Review subsection in the Introduction section, just before the
Project Background subsection to briefly discuss the effects of similar Select Bus Service
implementations.
Figures need to be mentioned in the text in advance of their presentation.
The authors have tried to balance data presentation and the discussion of that data, often
opting to place the visuals first within a given section.
Some of the streets mentioned in the text are not shown in Figure 1 and this makes it difficult for
readers to interpret the figure.
Relevant labels have been added and street name mentions removed where applicable.
Page 7 line 14 - should Figure 4 read Figure 3?
Fixed
Although the authors say they will compare before and after data, the actual measurement data seems
very limited e.g. the actual ridership levels in 2011 are not shown - only those after implementation
are mentioned with some general statements in percentage terms as to how they compare with the
pre- situation. Such general statements are not satisfactory in terms of presentation of research
output.
Additional raw-number statistics have been added to the ridership data section to address this.
Figure 6 gives average values for travel times but no detail is given about how many times travel
time was measured and over what period, and the relevant statistics behind those measurements e.g.
what the range was.
The travel time results were obtained using cell-phone probe data. This is mentioned in the
Assessment Methodology section. Though fine-grained data is provided, it is aggregated for
the protection of the privacy of individuals. For this reason, the exact number and timing of

trips is not known. Data on the range and distribution of these data points has been added to
the General Traffic Travel Time subsection of the Results Section.
Some additional validation of the statements on page 11 e.g. 'are likely attributable' need to be
provided.
The phrase has been removed and data on the factors contributing to travel time savings has
been added. The paper’s purpose is to present travel time, volume, and ridership changes
more generally, and to discuss their implications for route and mode shift, not to establish the
root causes for travel time changes.
The paragraph on Page 12 is not at all clear. Explain more fully what this statement means ' in the
absence of borough wide traffic volume data, the volume reductions on Nostrand Avenue are
compared with the volume changes on neighboring parallel streets'.
Traffic volumes were collected before and after implementation on Nostrand Avenue and
parallel alternative southbound streets in order to assess whether vehicles shifted from
Nostrand onto those streets.
Further into the paragraph, the statement ‘A good case can therefore be made for diversion from
Nostrand southbound in the PM’ again is not clear.
The fact that volumes decreased on Nostrand Avenue and increased on parallel southbound
streets provides evidence for route shift from Nostrand onto those streets after project
implementation.
Detail on the measurement program used to measure the travel times presented in Figure 9 and the
accompanying statistics need to be included.
The nature and source of this data is briefly discussed in the Assessment Methodology
section, and additional statistics are provided in the General Traffic Travel Time subsection
of the Results Section.
Safran, Beaton, Thompson, Wan, Chiarmonte, and Joseph 1
B44 Select Bus Service on Nostrand Avenue: Bus Rapid Transit-Induced Mode Shift and 1
Route Shift in Transit-Dense Brooklyn 2
3 Original Submission Date: 7/31/2015 4 5 Corresponding Author: 6 Jeremy S. Safran 7 New York City Department of Transportation 8 55 Water Street, 6th Floor 9 New York, NY 10041 10 Phone: 212-839-7727 11 Email: [email protected] 12 13 Co-Authors (alphabetical): 14 15 Eric B. Beaton 16 New York City Department of Transportation 17 55 Water Street, 6th Floor 18 New York, NY 10041 19 Phone: 212-839-6697 20 Email: [email protected] 21 22 Robert Thompson 23 MTA New York City Transit 24 2 Broadway, 17
th Floor 25
New York, NY 10004 26 Phone: 646-252-5623 27 Email: [email protected] 28 29 Dan Wan 30 Department of Civil Engineering, City College of New York 31 160 Convent Avenue, Marshak Building, Suite MR-910 32 New York, NY 10031 33 Phone: 212-650-8071 34 Email: [email protected] 35 36 Jonathan Joseph 37 MTA New York City Transit 38 2 Broadway, 17
th Floor 39
New York, NY 10004 40 Phone: 646-252-5526 41 Email: [email protected] 42 43 Joseph Chiarmonte 44 MTA New York City Transit 45 2 Broadway, 17
th Floor 46
New York, NY 10004 47 Phone: 646-252-5639 48 Email: [email protected] 49 50 51 52
Word Count: 5,244 53 Tables & Figures: 2,250 (9x250 words) 54
Total Count: 7,494 55
Safran, Beaton, Thompson, Wan, Chiarmonte, and Joseph 2
ABSTRACT 1
2 Transportation investments have the potential to affect both mode choice and route choice for 3
trip-making. The dense urban environment in Brooklyn, New York allows its residents to have 4
choices both between modes and within modes, to eventually select a route. This paper tracks the 5
changes to the transportation network and the decisions of its users that resulted from the 6
implementation of the B44 Select Bus Service (SBS) in Brooklyn, and explores the connection 7
between mode shift and route shift on the project corridors. The SBS implementation process 8
involved a re-routing of the northbound bus, the removal of stops, a reconfiguring of street 9
geometry, signal changes to intersections along the route, and the installation of bus bulbs with 10
new bus shelters and off-board fare payment kiosks to make the bus faster and more reliable. The 11
post-implementation data shows that the project realized its goals of making the B44 faster and 12
gaining new ridership, while not having large detrimental effects on car travel in the area. The 13
B44 SBS project demonstrates that a BRT project can change mode share along a corridor, 14
whether by route shift or mode shift, to a more transit-friendly equilibrium, in a dense urban 15
street environment. 16
17
18
19
20
21
22
23
24
25
26
27
28
29
30
31
32
33
34
35
36
37
38
39
40
41
42
43
44
45
46
Safran, Beaton, Thompson, Wan, Chiarmonte, and Joseph 3
INTRODUCTION 1
2 Mode shift is most commonly discussed by the travel demand management community as an 3
induced switch from one mode of transportation to another for a given trip (1). In streets grids, 4
however, people also have the choice within a single mode to take different corridors, so 5
discussions of shifting should include both changing mode and route choice behavior in response 6
to transportation investments. This paper tracks the changes to the transportation network and the 7
decisions of its users that resulted from the implementation of the B44 Select Bus Service in 8
Brooklyn, New York. 9
Select Bus Service (SBS) is a joint program between MTA New York City Transit 10
(NYCT) and the New York City Department of Transportation (NYCDOT), which aims to 11
improve transit service through the application of Bus Rapid Transit (BRT) principles to New 12
York City’s busiest bus routes. Therefore, this paper serves as a case study of the shifts that 13
result when a bus route is improved, and associated changes are made to the on-street 14
transportation infrastructure. 15
As the 3rd
highest ridership bus route in Brooklyn, and the 6th
highest in all of New York 16
City, the B44 bus (Local and Limited/SBS) has historically carried about 40,000 people on an 17
average weekday and 13.6 million annual riders (2). While the B44 parallels a subway line for a 18
portion of its route, the majority of the route provides critical north-south connectivity, with 19
transfers available to numerous east-west subway lines into Downtown Brooklyn & Manhattan. 20
For these reasons, New York City Transit and the New York City Department of Transportation 21
selected the B44 for upgrade to Select Bus Service. 22
Using the B44 Select Bus Service project area as a case study for the development of a 23
working definition of mode shift potentially requires a departure from traditional definitions. In 24
this area of Brooklyn, transit is too pervasive and diverse to be thought of as a one mode, with 25
multiple bus routes and subway lines providing a grid network. Brooklyn’s street grid also offers 26
many parallel alternative routes for car travel. Additionally, the B44 SBS route itself does not 27
serve a traditional CBD, so there are many potential start and end points along the route. 28
Shifts in travel behaviors are not limited to mode choice, but also to route choice on both 29
the transit and roadway networks. Even if mode share on the project corridors changes only 30
because car trips shifted to another corridor and transit passengers were attracted to Nostrand 31
Avenue, this shift is measurable and potentially correlated to the service changes, installation of 32
amenities, and reallocation of roadway space that occurred as part of the B44 SBS 33
implementation. 34
35
Literature Review 36 37
Select Bus Service conversions have led to increased speed and ridership on other corridors 38
including 1st Avenue in Manhattan, Fordham Road and Webster Avenue in the Bronx, and Hylan 39
Boulevard in Staten Island (3, 4, 5, 6). A less well understood feature of SBS is where these new 40
riders are coming from because these prior studies did not attempt to match up ridership data 41
with survey data or ridership on parallel alternative bus routes. 42
The literature on mode shift and demand elasticity for transit more generally is extensive, 43
though much of it is focused on fares, which do not change as part of Select Bus Service 44
conversions. A 2012 case study of the Atlanta regional transit system performed by the Mineta 45
Transportation Institute found in-vehicle travel time to be among the most important factors in 46
Safran, Beaton, Thompson, Wan, Chiarmonte, and Joseph 4
determining demand for a transit mode (either rail or bus) (7). On the contrary, a 2014 study of 1
transit mode switching in regional Toronto found that travel time attributes were less important 2
in mode switching than comfort attributes such as level of crowding and number of transfers (8). 3
In exploring travel demand elasticity and mode share on a corridor level, this study attempts to 4
clarify the more nuanced notions of route shift and mode mix in the context of a transit 5
implementation project, rather than as part of a regional modeling effort or travel demand 6
management initiative. 7
8
Project Background 9
10
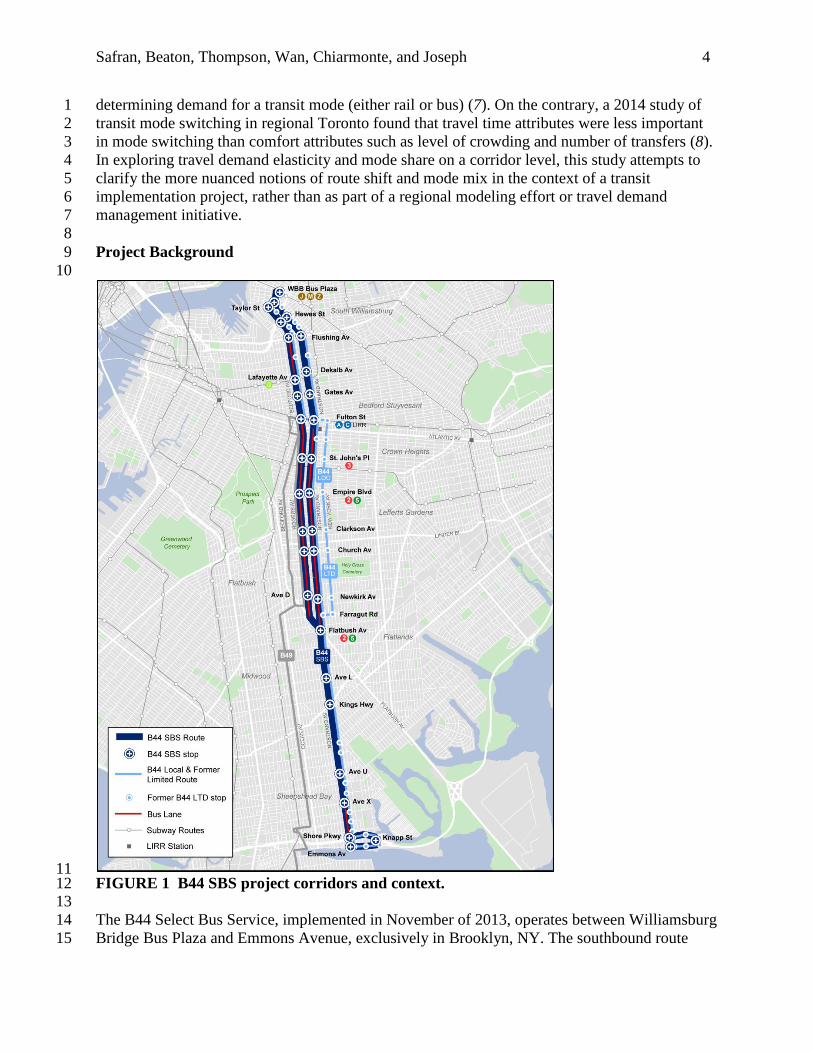
11 FIGURE 1 B44 SBS project corridors and context. 12 13
The B44 Select Bus Service, implemented in November of 2013, operates between Williamsburg 14
Bridge Bus Plaza and Emmons Avenue, exclusively in Brooklyn, NY. The southbound route 15
Safran, Beaton, Thompson, Wan, Chiarmonte, and Joseph 5
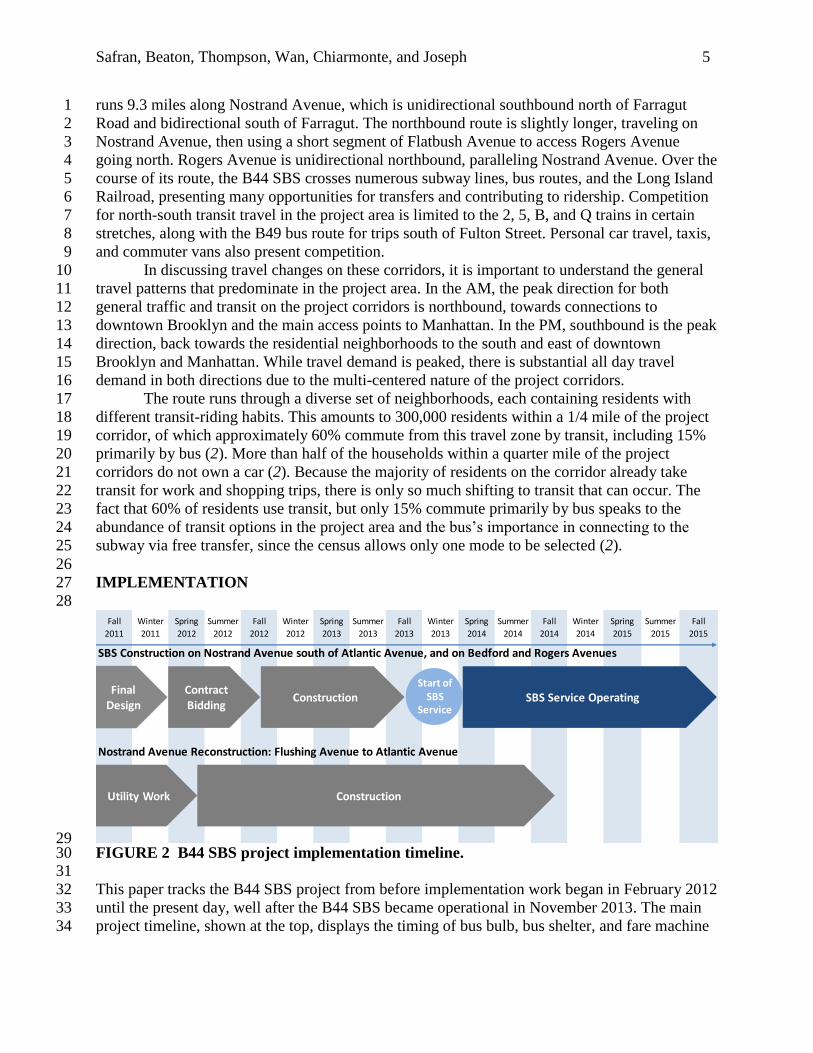
runs 9.3 miles along Nostrand Avenue, which is unidirectional southbound north of Farragut 1
Road and bidirectional south of Farragut. The northbound route is slightly longer, traveling on 2
Nostrand Avenue, then using a short segment of Flatbush Avenue to access Rogers Avenue 3
going north. Rogers Avenue is unidirectional northbound, paralleling Nostrand Avenue. Over the 4
course of its route, the B44 SBS crosses numerous subway lines, bus routes, and the Long Island 5
Railroad, presenting many opportunities for transfers and contributing to ridership. Competition 6
for north-south transit travel in the project area is limited to the 2, 5, B, and Q trains in certain 7
stretches, along with the B49 bus route for trips south of Fulton Street. Personal car travel, taxis, 8
and commuter vans also present competition. 9
In discussing travel changes on these corridors, it is important to understand the general 10
travel patterns that predominate in the project area. In the AM, the peak direction for both 11
general traffic and transit on the project corridors is northbound, towards connections to 12
downtown Brooklyn and the main access points to Manhattan. In the PM, southbound is the peak 13
direction, back towards the residential neighborhoods to the south and east of downtown 14
Brooklyn and Manhattan. While travel demand is peaked, there is substantial all day travel 15
demand in both directions due to the multi-centered nature of the project corridors. 16
The route runs through a diverse set of neighborhoods, each containing residents with 17
different transit-riding habits. This amounts to 300,000 residents within a 1/4 mile of the project 18
corridor, of which approximately 60% commute from this travel zone by transit, including 15% 19
primarily by bus (2). More than half of the households within a quarter mile of the project 20
corridors do not own a car (2). Because the majority of residents on the corridor already take 21
transit for work and shopping trips, there is only so much shifting to transit that can occur. The 22
fact that 60% of residents use transit, but only 15% commute primarily by bus speaks to the 23
abundance of transit options in the project area and the bus’s importance in connecting to the 24
subway via free transfer, since the census allows only one mode to be selected (2). 25
26
IMPLEMENTATION 27
28
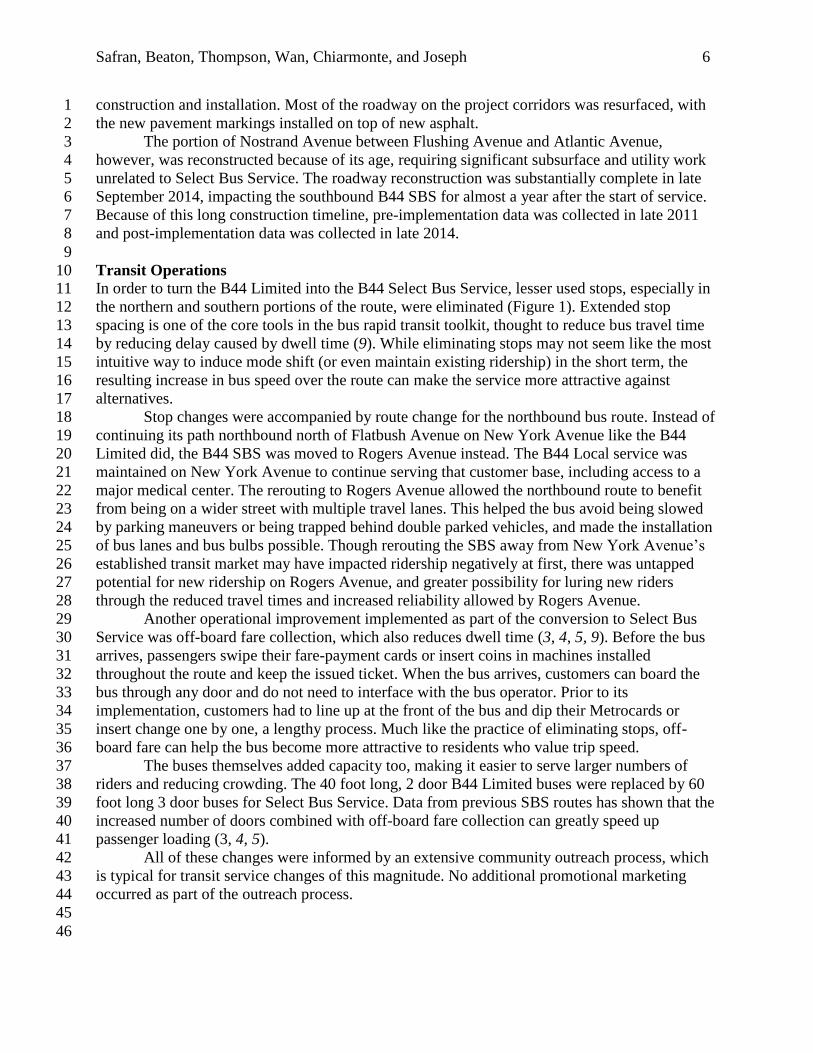
29 FIGURE 2 B44 SBS project implementation timeline. 30 31
This paper tracks the B44 SBS project from before implementation work began in February 2012 32
until the present day, well after the B44 SBS became operational in November 2013. The main 33
project timeline, shown at the top, displays the timing of bus bulb, bus shelter, and fare machine 34
SBS Construction on Nostrand Avenue south of Atlantic Avenue, and on Bedford and Rogers Avenues
Nostrand Avenue Reconstruction: Flushing Avenue to Atlantic Avenue
Fall
2014
Winter
2014
Spring
2015
Summer
2015
Fall
2015
Summer
2014
Fall
2011
Winter
2011
Spring
2012
Summer
2012
Fall
2012
Winter
2012
Spring
2013
Summer
2013
Fall
2013
Winter
2013
Spring
2014
Construction
FinalDesign
Contract Bidding
Construction SBS Service Operating
Utility Work
Start ofSBS
Service
Safran, Beaton, Thompson, Wan, Chiarmonte, and Joseph 6
construction and installation. Most of the roadway on the project corridors was resurfaced, with 1
the new pavement markings installed on top of new asphalt. 2
The portion of Nostrand Avenue between Flushing Avenue and Atlantic Avenue, 3
however, was reconstructed because of its age, requiring significant subsurface and utility work 4
unrelated to Select Bus Service. The roadway reconstruction was substantially complete in late 5
September 2014, impacting the southbound B44 SBS for almost a year after the start of service. 6
Because of this long construction timeline, pre-implementation data was collected in late 2011 7
and post-implementation data was collected in late 2014. 8
9
Transit Operations 10 In order to turn the B44 Limited into the B44 Select Bus Service, lesser used stops, especially in 11
the northern and southern portions of the route, were eliminated (Figure 1). Extended stop 12
spacing is one of the core tools in the bus rapid transit toolkit, thought to reduce bus travel time 13
by reducing delay caused by dwell time (9). While eliminating stops may not seem like the most 14
intuitive way to induce mode shift (or even maintain existing ridership) in the short term, the 15
resulting increase in bus speed over the route can make the service more attractive against 16
alternatives. 17
Stop changes were accompanied by route change for the northbound bus route. Instead of 18
continuing its path northbound north of Flatbush Avenue on New York Avenue like the B44 19
Limited did, the B44 SBS was moved to Rogers Avenue instead. The B44 Local service was 20
maintained on New York Avenue to continue serving that customer base, including access to a 21
major medical center. The rerouting to Rogers Avenue allowed the northbound route to benefit 22
from being on a wider street with multiple travel lanes. This helped the bus avoid being slowed 23
by parking maneuvers or being trapped behind double parked vehicles, and made the installation 24
of bus lanes and bus bulbs possible. Though rerouting the SBS away from New York Avenue’s 25
established transit market may have impacted ridership negatively at first, there was untapped 26
potential for new ridership on Rogers Avenue, and greater possibility for luring new riders 27
through the reduced travel times and increased reliability allowed by Rogers Avenue. 28
Another operational improvement implemented as part of the conversion to Select Bus 29
Service was off-board fare collection, which also reduces dwell time (3, 4, 5, 9). Before the bus 30
arrives, passengers swipe their fare-payment cards or insert coins in machines installed 31
throughout the route and keep the issued ticket. When the bus arrives, customers can board the 32
bus through any door and do not need to interface with the bus operator. Prior to its 33
implementation, customers had to line up at the front of the bus and dip their Metrocards or 34
insert change one by one, a lengthy process. Much like the practice of eliminating stops, off-35
board fare can help the bus become more attractive to residents who value trip speed. 36
The buses themselves added capacity too, making it easier to serve larger numbers of 37
riders and reducing crowding. The 40 foot long, 2 door B44 Limited buses were replaced by 60 38
foot long 3 door buses for Select Bus Service. Data from previous SBS routes has shown that the 39
increased number of doors combined with off-board fare collection can greatly speed up 40
passenger loading (3, 4, 5). 41
All of these changes were informed by an extensive community outreach process, which 42
is typical for transit service changes of this magnitude. No additional promotional marketing 43
occurred as part of the outreach process. 44
45
46

Safran, Beaton, Thompson, Wan, Chiarmonte, and Joseph 7
Street Design and Traffic Operations 1
2
3 (a) (b) 4
FIGURE 3 Cross-section of Nostrand Avenue (a) Pre-implementation and (b) Post-5
implementation. 6
7 Bus Lanes 8
Some of the tools in the Select Bus Service toolkit are not simply improvements to bus service or 9
the amenities provided to bus customers, but can also be seen as having effects on general traffic 10
speed. The implementation of bus lanes on Nostrand and Rogers Avenues (mostly between 11
Fulton Street and Flatbush Avenue) were reallocations of roadway space in an attempt to better 12
match infrastructure provision to mode share and to the needs of all street users. 13
Figure 3 shows the alignment of Nostrand Avenue before and after Select Bus Service 14
implementation. The main difference is the addition of an offset bus lane, which uses the travel 15
lane adjacent to the curbside lane for near-exclusive bus travel. The offset configuration was 16
selected because of its increased effectiveness in remaining blockage-free and generating higher 17
rates of usage than curbside bus lanes (10). This change has a complex effect on roadway 18
capacity that varies by time of day. While removing a general traffic lane and replacing it with a 19
bus lane would seem to directly reduce capacity, the bus lane accommodates the high volume of 20
buses, as well as any vehicles turning right at the next intersection (11). The bus lane, therefore, 21
serves a large portion of general traffic. 22
23
Curb Management and Signal Changes 24
The capacity of regular travel lanes can be limited by double parking, regular parking 25
maneuvers, right and left turning vehicles, and buses pulling into and out of stops. Though 26
Nostrand Avenue reserved its two middle lanes for general traffic before SBS implementation, 27
double parking and buses pulling into and out of stops prevented full utilization and resulted in 28
only one effective lane for large portions of the day. As part of the SBS implementation, curb 29
regulations were changed to better accommodate deliveries and truck loading, resulting in more 30
effective curb management and reduced double parking. Though parking rates were not changed 31
as part of this process, metered parking and paid commercial loading were added in places where 32
unregulated parking had previously existed. The issue of buses pulling into and out of traffic was 33
alleviated by using offset bus lanes and bus bulbs. As Figure 4a shows, the bus can access the 34
Safran, Beaton, Thompson, Wan, Chiarmonte, and Joseph 8
stop at a bus bulb without leaving the offset bus lane. With double-parked vehicles, buses, and 1
right-turning vehicles out of the way, the one remaining middle travel lane becomes highly 2
reliable for through vehicles. 3
Another aspect of curb management utilized and adapted during SBS implementation 4
was peak period curbside travel lanes. The peak and reverse peak period (southbound in the AM 5
& northbound in the PM) parking restriction and curbside travel lane on Nostrand was moved 6
from the west side to the east side of the street as part of the SBS implementation process. 7
Moving the parking restriction cleared the curb for left turners rather than right turners (right 8
turners were already accommodated by the bus lane), and eliminated the condition where buses 9
were stopping in the curbside travel lane during peak periods. These changes created a 10 AM – 10
4PM window of time for deliveries, truck loading, or customer parking to occur on the eastern 11
curb in the middle of the day. 12
In addition to street design changes, signal timing changes were instituted along the 13
project corridors to alleviate bus delay and to better match geometric capacity with signal 14
capacity. Where network considerations allowed, signal timing changes were made at 15
intersections with particularly high bus delay. For instance, northbound-southbound green time 16
was added at Linden Boulevard, and the coordination of the offsets and green progressions 17
approaching Eastern Parkway was improved. 18
The overall capacity puzzle is therefore complicated by curb management, time of day 19
regulations, bus lanes, and signal timing changes. Considering all factors, capacity was likely 20
added in the reverse peak directions, with only two travel lanes before implementation, and two 21
travel lanes plus a bus/right turn lane after implementation. For peak direction travel, capacity 22
was slightly reduced, with one fewer travel lane in each direction. 23
24
25
26
27
28
29
30
31
32
33
34
35
36
37
38
39
40
41
42
43
44
45
46
Safran, Beaton, Thompson, Wan, Chiarmonte, and Joseph 9
Rider-focused Amenities 1
2
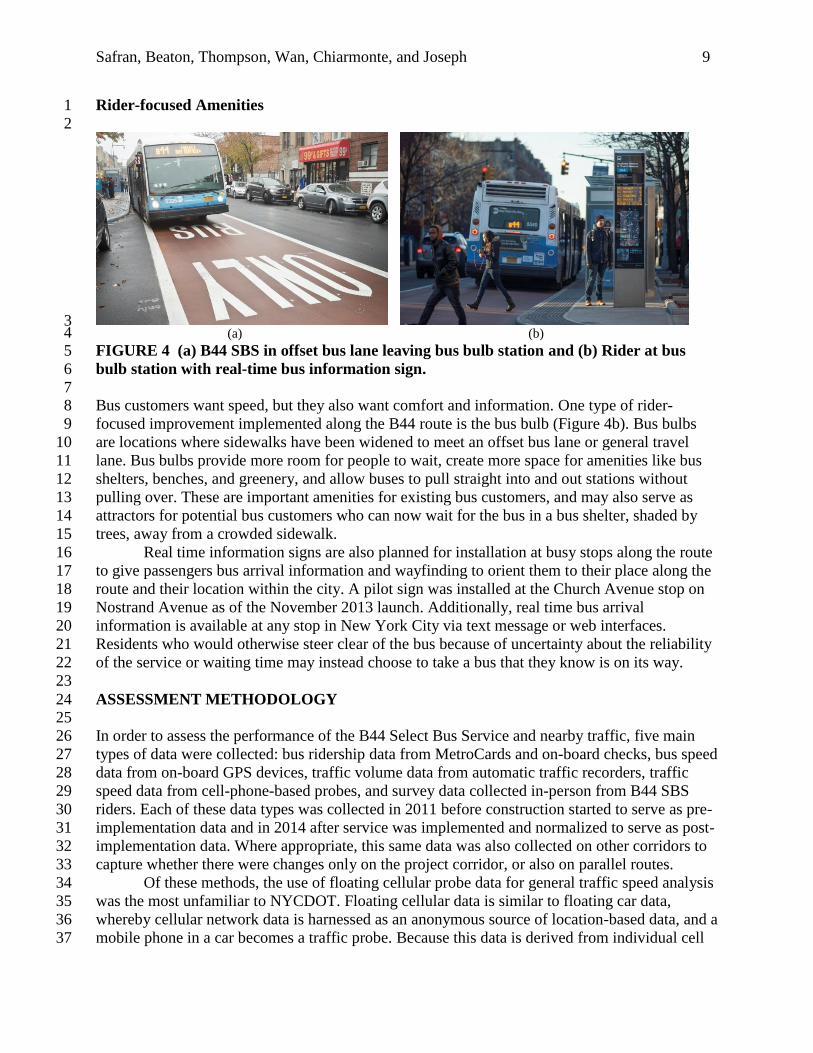
3 (a) (b) 4 FIGURE 4 (a) B44 SBS in offset bus lane leaving bus bulb station and (b) Rider at bus 5
bulb station with real-time bus information sign. 6
7 Bus customers want speed, but they also want comfort and information. One type of rider-8
focused improvement implemented along the B44 route is the bus bulb (Figure 4b). Bus bulbs 9
are locations where sidewalks have been widened to meet an offset bus lane or general travel 10
lane. Bus bulbs provide more room for people to wait, create more space for amenities like bus 11
shelters, benches, and greenery, and allow buses to pull straight into and out stations without 12
pulling over. These are important amenities for existing bus customers, and may also serve as 13
attractors for potential bus customers who can now wait for the bus in a bus shelter, shaded by 14
trees, away from a crowded sidewalk. 15
Real time information signs are also planned for installation at busy stops along the route 16
to give passengers bus arrival information and wayfinding to orient them to their place along the 17
route and their location within the city. A pilot sign was installed at the Church Avenue stop on 18
Nostrand Avenue as of the November 2013 launch. Additionally, real time bus arrival 19
information is available at any stop in New York City via text message or web interfaces. 20
Residents who would otherwise steer clear of the bus because of uncertainty about the reliability 21
of the service or waiting time may instead choose to take a bus that they know is on its way. 22
23
ASSESSMENT METHODOLOGY 24 25
In order to assess the performance of the B44 Select Bus Service and nearby traffic, five main 26
types of data were collected: bus ridership data from MetroCards and on-board checks, bus speed 27
data from on-board GPS devices, traffic volume data from automatic traffic recorders, traffic 28
speed data from cell-phone-based probes, and survey data collected in-person from B44 SBS 29
riders. Each of these data types was collected in 2011 before construction started to serve as pre-30
implementation data and in 2014 after service was implemented and normalized to serve as post-31
implementation data. Where appropriate, this same data was also collected on other corridors to 32
capture whether there were changes only on the project corridor, or also on parallel routes. 33
Of these methods, the use of floating cellular probe data for general traffic speed analysis 34
was the most unfamiliar to NYCDOT. Floating cellular data is similar to floating car data, 35
whereby cellular network data is harnessed as an anonymous source of location-based data, and a 36
mobile phone in a car becomes a traffic probe. Because this data is derived from individual cell 37
Safran, Beaton, Thompson, Wan, Chiarmonte, and Joseph 10
phone users, the exact nature of individual trips is kept private. NYCDOT received an 1
aggregated form of this data which was compiled into 15 minute speed averages over small 2
geographic segments. NYCDOT selected this methodology because of the large sample size and 3
relatively low cost compared to traditional floating car methods. 4
5
RESULTS 6
7
Bus Ridership 8
9
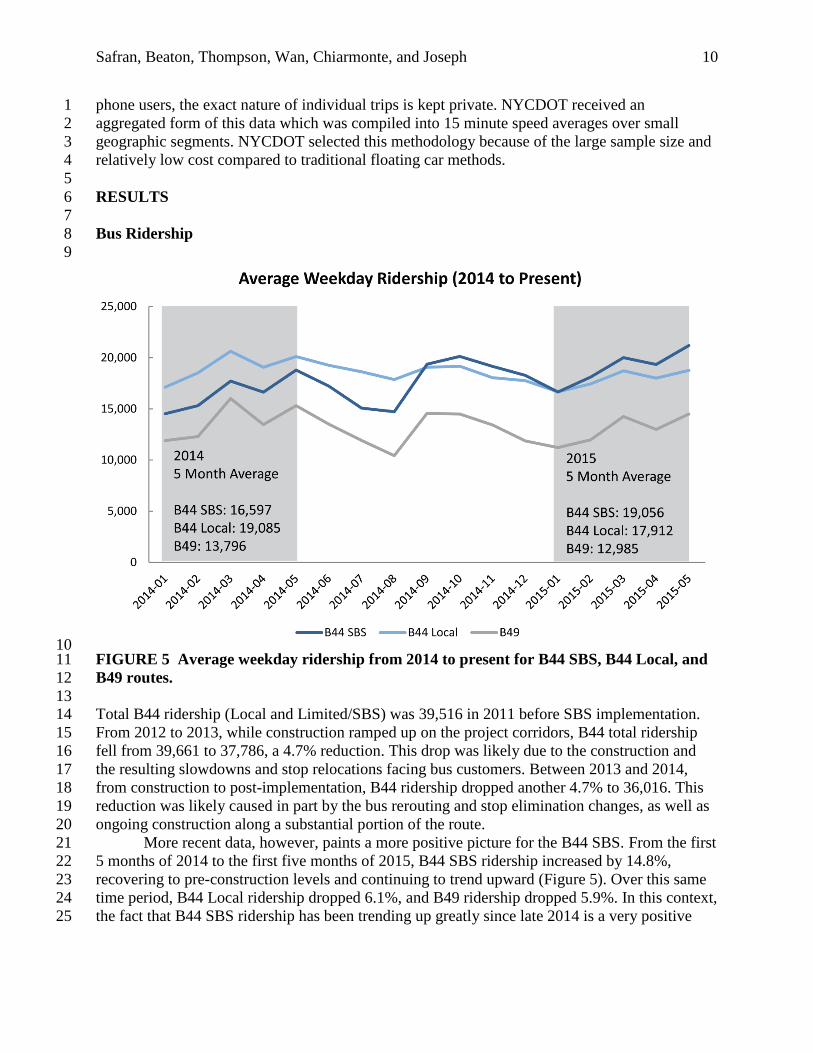
10 FIGURE 5 Average weekday ridership from 2014 to present for B44 SBS, B44 Local, and 11
B49 routes. 12
13 Total B44 ridership (Local and Limited/SBS) was 39,516 in 2011 before SBS implementation. 14
From 2012 to 2013, while construction ramped up on the project corridors, B44 total ridership 15
fell from 39,661 to 37,786, a 4.7% reduction. This drop was likely due to the construction and 16
the resulting slowdowns and stop relocations facing bus customers. Between 2013 and 2014, 17
from construction to post-implementation, B44 ridership dropped another 4.7% to 36,016. This 18
reduction was likely caused in part by the bus rerouting and stop elimination changes, as well as 19
ongoing construction along a substantial portion of the route. 20
More recent data, however, paints a more positive picture for the B44 SBS. From the first 21
5 months of 2014 to the first five months of 2015, B44 SBS ridership increased by 14.8%, 22
recovering to pre-construction levels and continuing to trend upward (Figure 5). Over this same 23
time period, B44 Local ridership dropped 6.1%, and B49 ridership dropped 5.9%. In this context, 24
the fact that B44 SBS ridership has been trending up greatly since late 2014 is a very positive 25

Safran, Beaton, Thompson, Wan, Chiarmonte, and Joseph 11
sign, likely attributable to the stabilization of infrastructural and operational change on the 1
project corridors, and possibly even ridership gains at the expense of the B49 and the B44 Local. 2
3
Bus Travel Time 4
5 FIGURE 6 B44 travel time change. 6 7
Based on the findings displayed in Figure 6, the operational and infrastructural improvements 8
made as part of the conversion to SBS resulted in significantly faster travel times for the B44. 9
This was true in both directions for the AM & PM peak time periods, but especially for 10
northbound trips in the AM. This reduction in overall travel time is attributable to a 40% 11
reduction in overall dwell time, a 45% reduction in time spent at red lights, and a 12% increase 12
in the proportion of time spent in motion . The large northbound travel time reductions can also 13
be attributed to the rerouting from New York Avenue to the wider, more bus-friendly Rogers 14
Avenue. Taken together, these percentage reductions in travel time amount to 18-29 minutes 15
saved for commuters traveling the majority of the route in either direction. 16
17
18
19
20
21
22
23
24
25
26
27
28
29
89
77.7 83.1 82.9
60.2 59.3 64.6 64.8
Northbound Southbound Northbound Southbound
AM Peak (6AM-10 AM) PM Peak (3PM-7PM)
B44 Travel Time (in minutes)- Entire Route
Pre SBS Post SBS
24% 32% 22% 22%

Safran, Beaton, Thompson, Wan, Chiarmonte, and Joseph 12
Traffic Volume 1 2
3 (a) (b) 4
5 (c) (d) 6 7
FIGURE 7 Southbound volume change on Nostrand and parallel streets in the (a) AM 8
Peak and (b) PM Peak, and Northbound volume change on Rogers and parallel streets in 9
the (a) AM Peak and (b) PM Peak at Empire Boulevard 10 11
In Figure 7 (a & b), the volume reductions on Nostrand Avenue are compared to the volume 12
changes on neighboring, parallel streets. Because Nostrand Avenue is southbound-only at 13
Safran, Beaton, Thompson, Wan, Chiarmonte, and Joseph 13
Empire Boulevard, the peak volume time period is the PM peak. From 5:15 to 6:15 PM, the 13% 1
average volume reductions on Nostrand coincide with 18% average volume additions on all 2
parallel southbound streets. A good case can therefore be made for diversion from Nostrand 3
southbound in the PM. In the AM, the 11% average volume reduction on Nostrand did not 4
coincide with volume additions on parallel corridors. Without immediately invoking mode shift, 5
it is not clear where these vehicles rerouted or if they dispersed within the larger Brooklyn street 6
grid. 7
8
Figure 7 (c & d) show similar volume reductions on Rogers Avenue, with evidence of route 9
shifting observed on parallel northbound streets in the AM peak direction. Between 7:45 and 10
8:45 AM, three out of the four northbound parallel streets saw added volume coinciding with 9% 11
average volume reductions on Rogers. Kingston Avenue likely did not show added volume 12
because it is a poor northbound alternative. In the PM, reduced volume on Rogers Avenue did 13
not coincide systematically with added volume on neighboring streets. In fact, three out of four 14
of the northbound alternatives actually lost volume at Empire Boulevard indicating that the 15
volume lost from Rogers did not divert to local parallel routes. 16
17
General Traffic Travel Time 18 19
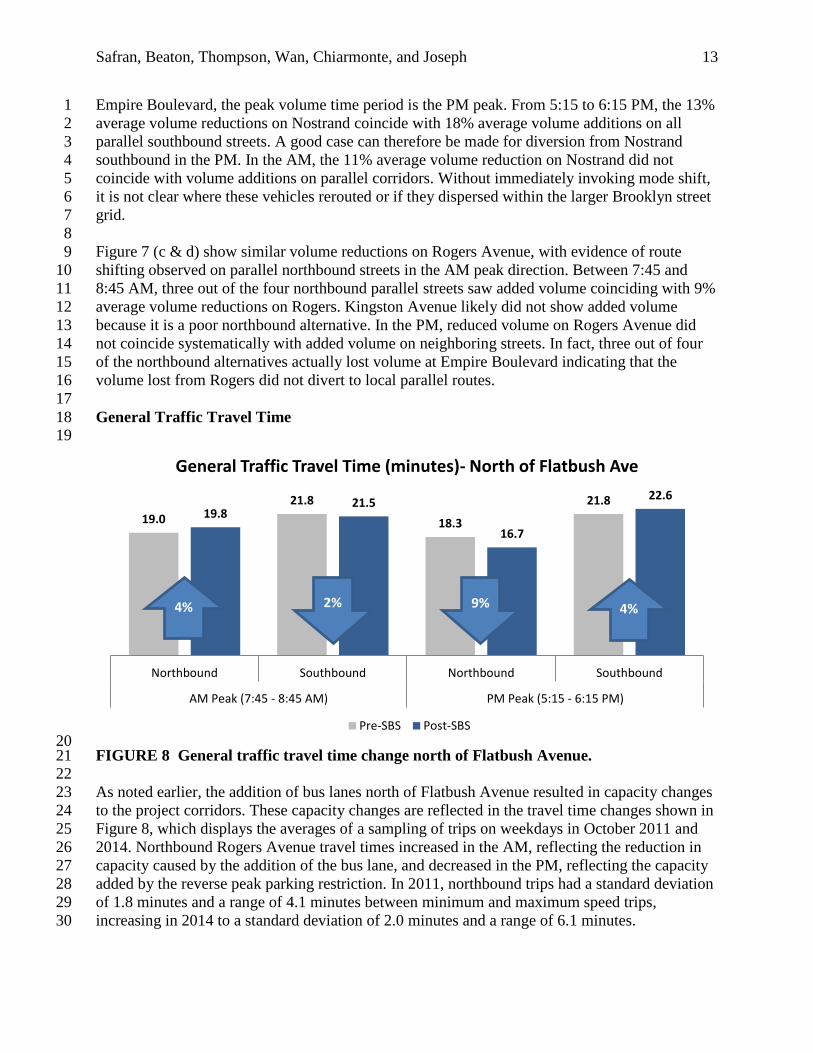
20 FIGURE 8 General traffic travel time change north of Flatbush Avenue. 21 22
As noted earlier, the addition of bus lanes north of Flatbush Avenue resulted in capacity changes 23
to the project corridors. These capacity changes are reflected in the travel time changes shown in 24
Figure 8, which displays the averages of a sampling of trips on weekdays in October 2011 and 25
2014. Northbound Rogers Avenue travel times increased in the AM, reflecting the reduction in 26
capacity caused by the addition of the bus lane, and decreased in the PM, reflecting the capacity 27
added by the reverse peak parking restriction. In 2011, northbound trips had a standard deviation 28
of 1.8 minutes and a range of 4.1 minutes between minimum and maximum speed trips, 29
increasing in 2014 to a standard deviation of 2.0 minutes and a range of 6.1 minutes. 30
19.0
21.8
18.3
21.8 19.8
21.5
16.7
22.6
Northbound Southbound Northbound Southbound
AM Peak (7:45 - 8:45 AM) PM Peak (5:15 - 6:15 PM)
General Traffic Travel Time (minutes)- North of Flatbush Ave
Pre-SBS Post-SBS
9% 4% 2% 4%

Safran, Beaton, Thompson, Wan, Chiarmonte, and Joseph 14
Southbound Nostrand Avenue travel times decreased in the AM, and increased in the 1
PM, corresponding to the reduction in capacity caused by the bus lane in the PM and the increase 2
in capacity caused by the reverse peak parking restriction in the AM. The signal mitigations at 3
Linden Boulevard and Eastern Parkway also showed direct benefits, resulting in .5 to 2.5 MPH 4
increases in average speed approaching these intersections in the peak direction and .5 to 5 MPH 5
increases approaching in the non-peak direction. Southbound trips had a standard deviation of 6
2.0 minutes and a range of 4.1 minutes between minimum and maximum speed trips in 2011, 7
both increasing to a standard deviation of 2.3 minutes and a range of 6.1 minutes in 2014. 8
9
Survey Data 10 11
As part of the after-study, B44 riders were randomly interviewed at bus stops and on-board 12
buses. The results are presented in Table 1. 13
14
TABLE 1 B44 SBS (a) Rider Experience and (b) Reasons for Riding 15
Previous B44 Riders? Percentage
Yes 80%
No 18%
Cannot recall 2%
(a)
New riders' reasons for riding B44 SBS Percentage
Better service 43%
Better accessibility 12%
More comfortable 6%
No other choice available now 29%
Other 10% (b) 16 17
Of the 387 B44 SBS riders surveyed, 18% had not been B44 riders, and therefore shifted to the 18
SBS from some other means. 43% of those new riders chose to become B44 SBS riders because 19
of the better service. The fact that 29% of new riders selected “No other choice available now” 20
indicates new trips being taken by new transit-dependent residents, workers, or shoppers in the 21
area, as it would otherwise be unlikely for people to have no other choice but to take a new 22
service without having been riders of the service it replaced. At the same time, 61% of new 23
riders indicated that they were attracted by features of the new service, indicating that the BRT 24
features likely are inducing some mode shift, route shift, and/or induced travel. 25
26
DISCUSSION 27 28
Taken alone, these strands of evidence cannot speak to mode shift directly. However, route shift 29
was observed in both bus transit and vehicular modes. In Brooklyn’s dense urban grid with an 30
abundance of transportation options, it can be difficult to distinguish between mode shift and 31
route shift without considering all modes in parallel, and investigating the changing dynamic 32
between routes and between modes that can result from project implementation. These changing 33
Safran, Beaton, Thompson, Wan, Chiarmonte, and Joseph 15
dynamics are what served as the driving forces behind the route shift and mode shift that has 1
already occurred, and any shifts that will occur in the future. 2
In particular, despite overall losses in B44 ridership from 2012 to 2014, likely caused 3
mostly by construction and partly by elimination of stops and bus rerouting, there is considerable 4
evidence that a customer base is shifting towards the B44 SBS. With larger forces driving down 5
bus ridership borough-wide, the upward trend in B44 SBS ridership shown from 2014 to 2015 is 6
unusual. Considering these ridership increases in combination with decreases observed on the 7
B49 and B44 Local, it is likely that some route shifting between these other routes and the B44 8
SBS occurred. The reasons for this recent increase in ridership can be seen in the bus travel time 9
and customer survey data. 10
The large reduction in travel times observed on the B44 SBS as compared to the Limited 11
service it replaced are being noticed by customers, with their responses indicating that the most 12
common reason for being a new B44 SBS rider is the better service. The B44 SBS is now the 13
faster transit travel option for those in the project area. 14
The other type of route shifting observed in the data was vehicular traffic shifting 15
between parallel streets. For peak direction travel especially, a portion of the vehicular volume 16
shifted away from the project corridors, and the dense Brooklyn grid absorbed it. In this way, a 17
large portion of the inconvenience to motorists caused by bus lane or bus bulb infrastructure was 18
alleviated by route shift, even if few of those motorists became transit riders. Though the 19
conversion to Select Bus Service project greatly reduced bus travel times, only mixed effects on 20
car travel times, and decreased reliability, were observed on the project corridors. Bus passenger 21
capacity was also added to the project corridors as a result of using larger buses, which may 22
become increasingly important with SBS ridership trending up. Here, route shift, mode shift, and 23
changing street dynamics are combining to create a different, more balanced and transit-friendly 24
set of choices for users. Thus, even as one to one shifting of modes might be difficult to detect, 25
evidence has been found here for route shifting and an overall shifting of the mode share towards 26
a new, more transit-friendly equilibrium as a consequence of the B44 Select Bus Service 27
implementation. 28
29
REFERENCES 30
31 1. Gopalakrishna, Deepak et al. Integrating Demand Management into the Transportation 32
Planning Process: A Desk Reference. Publication FHWA-HOP-12-035. U.S. Department 33
of Transportation & Federal Highway Administration, 2012. 34
35
2. Select Bus Service- Nostrand and Rogers Avenues- Borough of Brooklyn, New York: 36
Categorical Exclusion. Federal Transit Administration and NYC Department of 37
Transportation, 2010. 38
39
3. Beaton, E. B., et al. Select Bus Service on M15 in New York City: Bus Rapid Transit 40
Partnership. Transportation Research Record: Journal of the Transportation Research 41
Board, No. 2277, Transportation Research Board of the National Academies, 42
Washington, D.C., 2012, pp. 1–10. 43
44
4. Barr, J. E., et al. Select Bus Service on Bx12 in New York City: Bus Rapid Transit 45
Partnership of New York City DOT and Metropolitan Transportation Authority New 46
Safran, Beaton, Thompson, Wan, Chiarmonte, and Joseph 16
York City Transit. Transportation Research Record: Journal of the Transportation 1
Research Board, No. 2145, Transportation Research Board of the National Academies, 2
Washington, D.C., 2010, pp. 40–48. 3
4
5. Beaton, E., et al. Designing Bus Rapid Transit Facilities for Constrained Urban Arterials: 5
Case Study of the Selection Process for the Webster Avenue Bus Rapid Transit Running 6
Way Design in New York City. Transportation Research Record: Journal of the 7
Transportation Research Board, No. 2352, Transportation Research Board of the 8
National Academies, Washington, D.C., 2013, pp. 50–60. 9
10
6. Beaton, E.B., et al. A Limited for the 21st Century: Applying BRT Principles to Create 11
Select Bus Service on Hylan Boulevard. Presented at 93rd Annual Meeting of 4 the 12
Transportation Research Board, Washington D.C. 2014. 13
14
7. Thompson, Gregory, et al. Understanding Transit Ridership Demand for a Multi-15
Destination, Multimodal Transit Network in an American Metropolitan Area: Lessons for 16
Increasing Choice Ridership While Maintaining Transit Dependent Ridership. MTI 17
Report 11-06, January 2012. 18
19
8. Idris A.O., et al. Dissecting the Role of Transit Service Attributes in Attracting 20
Commuters: Lessons from a Comprehensive RP-SP Study on Commuting Mode 21
Switching Behaviour in Toronto. Presented at 93rd Annual Meeting of 4 the 22
Transportation Research Board, Washington D.C. 2014. 23
24
9. Tann, Helen M. & D. Hinebaugh. Characteristics of Bus Rapid Transit for Decision-25
Making. Publication FTA-FL-26-7109.2009.1. Federal Transit Administration & 26
National BRT Institute, 2009. 27
28
10. Safran, Jeremy et al. Factors Contributing to Bus Lane Obstruction and Usage in New 29
York City: Does Design Matter? Transportation Research Record: Journal of the 30
Transportation Research Board, No. 2418, Transportation Research Board of the 31
National Academies, Washington, D.C., 2014, pp. 58–65. 32
33
11. Title 34: Chapter 4: Traffic Rules. City of New York, Department of Transportation, 34
2012. 35