review water and freezing in food
TRANSCRIPT

Food Science and Technology Research, 24 (1), 1_21, 2018Copyright © 2018, Japanese Society for Food Science and Technologydoi: 10.3136/fstr.24.1
http://www.jsfst.or.jp
*To whom correspondence should be addressed. E-mail: [email protected]
Review
Water and Freezing in Food
Osato Miyawaki*
Department of Food Science, Ishikawa Prefectural University 1-308 Suematsu, Nonoichi, Ishikawa 921-8836, Japan
Received May 31, 2017 ; Accepted September 17, 2017
As an overwhelmingly major component, the role of water in food is reviewed comprehensively from a physicochemical view point. In aqueous solutions, the deviation of water activity, aw, from the ideal solution was proved to arise mainly from solute hydration. In macromolecule solutions, interactions among macromolecules were affected by aw and also the balance between the hydration and cosolute-binding of macromolecules. The ice fraction, which affects various properties of frozen food, was described well by a two-parameter equation with the initial freezing temperature and the unfrozen water content. In crystallization, ice crystal growth is extensively driven by heat transfer, causing unstable dendritic growth that is limited by water diffusion. Methods for freeze concentration were classified into four categories, and equilibrium suspension crystallization and progressive freeze-concentration were compared as possible alternatives in practice. Some chemical reactions are accelerated in the frozen state. This mechanism was explained by the concentration effect with freezing. In the freezing of cells, the freeze-induced dehydration rates of plant cells were much lower than those of microorganisms and animal cells, which seemed to explain the lower freeze-tolerance of plant cells and tissues.
Keywords: water activity, hydration of solute, ice fraction, ice structure, freeze concentration, freeze-acceleration reaction, freezing of cell
IntroductionWater is an overwhelming major component in food, and thus
its behavior is very important in food preservation and processing. In the present review, the water activity of aqueous solutions is firstly discussed, and although this topic is very classical, it is not yet completely understood. In macromolecular solutions, physical properties are affected by the coexisting solute through its effect on water activity and intermacromolecular interactions.
Because of the importance of freezing in food, the physicochemical fundamentals of freezing of water in food are reviewed briefly, and the importance of the ice fraction as a function of temperature and its effect on physical properties are discussed. Then, the mechanism of ice crystallization in food is discussed in relation to the balance between heat and mass transfer.
Freeze concentration has been known to give the best quality among the methods applied to the concentration of liquid foods.
Application of this technique, however, remains limited because of the complexity of the system, necessitating a high initial investment in the conventional method. Methods for freeze concentration are classified into four categories and a possible alternative to the conventional method will be discussed.
Because of the strong concentration effect accompanying freezing, some chemical reactions are substantially accelerated in freezing. The physicochemical aspects of this phenomenon are theoretically analyzed. Finally, the effect of freezing on the cellular structure in biological systems and food is reviewed. The freezing tolerance of the cellular structure is discussed in terms of water permeability through the plasma membrane.
Water activity in aqueous solutionsWater activity, aw, is the relative humidity shown by materials
at equilibrium. It is a macroscopic index of the state of water, and

O. Miyawaki2
its role is very important in food preservation and processing (Troller and Christian, 1978). In food preservation, the control of aw is an effective method to control the growth of microorganisms that deteriorate foods (Scott, 1957; Mossel, 1971). To this end, water vapor sorption isotherms have been obtained by measuring the relative humidity for various foods and analyzed theoretically for aw, ranging widely from 0 to 1 (van den Berg and Bruin, 1981).
In the solution system, aw can be obtained by measuring the freezing point depression (Hildebrand and Scott, 1962; Chandrasekaran and King, 1971) as follows.
ln aw = – (⊿Hf /R)(Tf –T)/TfT + (⊿Cf /R)[(Tf –T)/T – ln(Tf /T)] ······Eq. 1
where T is the freezing point of the solution (K), Tf is the freezing point of pure water (K), ⊿Hf is the latent heat of water in freezing, ⊿Cf is the change in the specific heat of water, and R is the gas constant.
Measurement of the freezing point depression is much easier than that of relative humidity, and thus many investigators have employed this method to analyze aw for various aqueous solutions and liquid foods (Ferro Fontan and Chirife, 1981; Lerici et al., 1983; Chen, 1987). The aw measured by freezing point depression is that at the freezing point so that it may be different from that measured by relative humidity measured at a different temperature. Therefore, the difference between the two has been analyzed and proved to be negligible because the effect of temperature on aw is compensated by the vapor pressure change of pure water (Ferro Fontan and Chirife, 1981; Lerici et al., 1983; Miyawaki et al., 1997; Starzak and Mathlouti, 2006).
For the theoretical analysis of aw in single-component solutions, the solution thermodynamic approach is applicable (Kozak et al.,1968; Miyawaki et al., 1997).
aw = γw Xw = γw (1–Xs) ······Eq. 2
lnγw = αXs2 + βXs
3 ······Eq. 3
where γw is the activity coefficient of water, Xw is the molar fraction of water, Xs is the molar fraction of solute. The α and β are parameters experimentally determined. Equation 3 has been applied to various aqueous solution systems and the parameters α and β have been determined as shown in Table 1, in which a single parameter equation with only α seems sufficient to describe aw accurately in most cases.
The parameter α is considered to represent the excessive free energy, gE, to describe the deviation from the ideal solution (Chandrasekaran and King, 1971).
gE = αXwXs ······Eq. 4
Therefore, the negative α corresponds to the positive interaction between the solute and solvent (water) and vice versa.
For multicomponent solutions, Ross (1975) proposed the following equation to describe the aw of mixed solution by
neglecting the solute-solute interactions.
aw = aw,1aw,2aw,3··· ······Eq. 5
where aw,i represents the water activities of the solution containing only i-component. Although a theoretical incompleteness has been pointed out for Eq. 5 (Lilley, 1987), this equation was proved to be useful in practice unless a very strong solute-solute interaction exists (Chen, 1990; Sone et al., 2015).
Effect of water activity on solution propertiesIn single component aqueous solutions with low molecules, the
viscosity changes along with the concentration of the solute as follows.
η/η0 = 1 + Bc + Cc2 ······Eq. 6
where, η and η0, respectively, are the viscosities of the solution and solvent, c is the solute concentration, and B and C are the parameters experimentally determined. The B-coefficient of viscosity in Eq. 6 can be divided into two terms (Herscovits and Kelly, 1973; Zhao, 2006; Seuvre and Mathlouti, 2010; Sato and Miyawaki, 2016).
B = Bsize + Bstructure ······Eq. 7
Bsize is the size effect of the solute on viscosity through the Einstein exclusion effect.
Bsize = 2.5Vs ······Eq. 8
where Vs is the partial molar volume of solute. By subtracting Bsize from B, Bstructure is obtained, and the hydration parameter, h, which
Table 1. Parameters to describe water activity of solutions by Eq. 3*)
Solute α β Xs,max R
NaCl 1 .825 –20 .78 0 .15 0 .9999KCl 4 .754 –49 .37 0 .07 0 .9999Ribose –1 .699 - 0 .1 0 .9993Deoxyribose3) –1 .607 - 0 .05 0 .9995Glucose –2 .734 - 0 .04 0 .9999Fructose –2 .009 - 0 .038 0 .9999Galactose1) –0 .957 - 0 .04 0 .9989Mannose1) –1 .929 - 0 .111 0 .9992Maltose –9 .549 - 0 .04 0 .9999Sucrose –7 .405 - 0 .037 0 .9999Trehalose3) –8 .744 - 0 .022 0 .9996Glycine2) 8 . 989 –185 .6 0 .027 0 .9999Proline2) 3 . 232 - 0 .035 0 .9998Ethanol –2 .029 - 0 .15 0 .9992Urea 0 .8309 - 0 .12 0 .9999Formamide 1 .218 - 0 .1 0 .9984
*)Adapted from Miyawaki et al. (1997).1) Sato and Miyawaki (2016).2) Miyawaki et al. (2014).3) Unpublished data by the present author.

Water and Freezing in Food 3
represents the moles of solvent bound per one mole of solute, can be calculated as follows.
h = 1000Bstructure /2.5Vw ······Eq. 9
where Vw is the molar volume of water (18.069 mL/mol, at 25℃). The hydration parameter h has been obtained for various alcohols, ureas, amides (Herscovits and Kelly, 1973), and sugars (Sato and Miyawaki, 2016).
In the theoretical analysis of water activity, Robinson and Stokes (1961) proposed a model to describe the effect of hydration on water activity as follows.
aw = [1 – (1 +h ) Xs ]/(1 – hXs) ······Eq. 10
From this, the activity coefficient of water, γw, is calculated provided that γw is not much different from 1 (Kozak et al., 1968).
lnγw = –hXs2 – h(1+h) Xs
3 + ··· ······Eq. 11
This directly relates the parameter α in Eq. 3 with the hydration parameter of the solute.
α = – h ······Eq. 12
In Fig. 1, the parameter h reported (Herscovits and Kelly, 1973; Sato and Miyawaki, 2016) is plotted against the parameter α in Table 1. A fairly good correlation is obtained between the theoretical expectation and the experimental results. This strongly suggests that the deviation of water activity from the ideal solution is explained mainly by the hydration of the solute.
In the aqueous macromolecular solution with low molecular cosolutes, aw also affects the viscosity of the solution. In this case, aw is hardly affected by the existence of the macromolecule because its concentration is generally not so high on the molecular basis, thus, aw is mainly determined by the coexisting low molecules. The viscosity of the whole solution, however, is affected by both components. Therefore, the effects of low molecules and the macromolecule on the viscosity of the whole solution should be separately evaluated. For this purpose, the specific viscosity, ηsp, is defined.
ηsp = (η – ηL)/ηL ······Eq. 13
where η is the viscosity of the whole solution and ηL is the viscosity containing only low molecules without macromolecule. The ηsp is expected to cancel out the contribution of low molecules.
In Fig. 2, the effect of aw on the specific viscosity of 2% (w/w) citrus pectin solution is shown in various sugar solutions at 25℃ (Sato et al., 2004). In this case, ηsp was substantially increased with a decrease in aw depending on the type of sugar. A similar result was obtained also for 5% (w/v) gelatin solution containing various sugars or urea at 25℃ (Miyawaki et al., 2003). These results mean that the coexistence of low molecules affects the intermolecular interactions among macromolecules.
In the state transition process of macromolecules in aqueous
solutions like protein unfolding and sol-gel-transition, the hydration state of macromolecules changes drastically so that the effect of aw on the transition process is important (Miyawaki, 2007, 2009). Sol-gel transition of gelatin in an aqueous solution is accompanied by changes in the hydration and cosolute-binding of gelatin molecules as shown in Fig. 3. The stoichiometric expression of this reaction can be described by the following equation (Miyawaki et al., 2015).
Fig. 1. Comparison of hydration parameter determined from the activity coefficient of water (α) and that from viscosity (h).
Fig. 2. Effect of aw on specific viscosity of 2% citrus pectin solution in various sugar solutions at 25℃. From Sato et al. (2004) with
permission.

O. Miyawaki4
G + ⊿i W +⊿ j Y → S ······Eq. 14
where G and S represents the gelatin molecule at the gel and sol states, respectively, with W for water and Y for the cosolute. The ⊿i and ⊿ j, respectively, are the number of molecules of water and the cosolute per one gelatin molecule involved in the transition.
The equilibrium constant, KS (=[S]/[G]), of this transition process has been proved to be described by the Wymann-Tanford equation (Tanford, 1969) as follows (Miyawaki et al., 2015).
dlnKS/dlnaw = ⊿i –⊿ j (Xw/XY) ······Eq. 15
where Xw and XY, respectively, are the molar fractions of water and cosolute. In Fig. 4, the sol-to-gel ratio of 5% gelatin was plotted against aw according to Eq. 15, showing that sugars stabilize and ethanol destabilizes the gel state of gelatin in a concentration-dependent manner. The stabilization effects of sugars are different among the sugar types.
By utilizing the experimental linearity in Fig. 4, Eq. 15 could be integrated to obtain ⊿⊿G, the difference in free energy for sol-gel transition between pure water (⊿G0) and solution (⊿GS), as follows.
⊿⊿G = ⊿GS –⊿G0 = –RT [⊿i –⊿ j (Xw/XY)] lnaw ······Eq. 16
The positive ⊿⊿G corresponds to the stabilization of gel in the
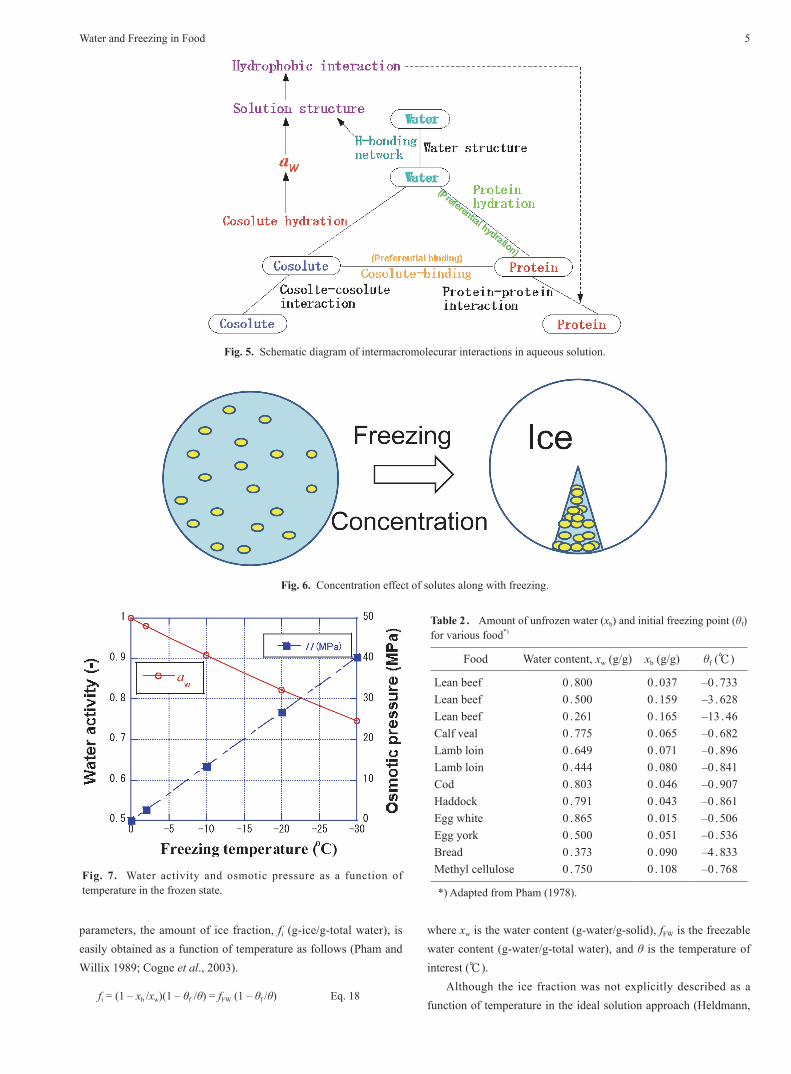
solution and the negative ⊿⊿G to destabilization. Equation 16 shows that the stabilization effect for gel state in a solution is dependent on aw and the balance between hydration and cosolute-binding of the macromolecule (Fig. 5). In addition, a change in the solution structure by the existence of cosolute may play some roles through the change in hydrophobic interaction.
Freezing of food and its physicochemical meaningThe freezing of food essentially means the freezing of water in
food. This process is inevitably accompanied by the concentration of solutes, as shown in Fig. 6, and this concentration process generates osmotic pressure in the system. The osmotic pressure, Π, is related to aw as follows (Gu et al., 2005).
Π = – (RT/Vw)lnaw ······Eq. 17
where T is the absolute temperature and Vw is the molar volume of water. The water activity of the frozen system is solely determined by temperature (Eq. 1). Therefore, the effect of temperature on aw and Π can be calculated as shown in Fig. 7. From this, it became clear that freezing at –20℃ corresponds to aw of 0.82 and Π of 26.8 MPa. This means that a substantial reduction in water activity and an increase in osmotic pressure are expected in freezing, even at the temperature of a home freezer. This explains why freezing is the most effective among various methods for the preservation of food.
Changes in food properties with freezingThermal properties of food are largely dependent on the ice
fraction. The ice fraction has been analyzed based on the ideal solution model, in which the effective molecular weight for the mixed solute was assumed for food materials (Heldmann, 1974; Chen, 1985ab). By using this model, the ice fraction has been obtained as a function of temperature for various food materials based on the enthalpy data by Riedel (1956, 1957ab, 1960). Later, the effective molecular weight was calculated on a molecular basis from the composition of food (Boonsupthip and Heldmann, 2007).
Schwartzberg (1976) introduced the concept of unfrozen water, which strongly interacts with food components so that this does not freeze in the freezing process. Pham (1987) applied this model to the enthalpy data by Riedel (1956, 1957ab, 1960) to determine the initial freezing point, θf (℃), and the amount of unfrozen water, xb (g-bound water/g-solid), as shown in Table 2. With these two
Fig. 3. Changes in hydration and solute-binding along with the sol-gel transition of macromolecules in aqueous solutions. The W and Y stand for water and cosolute, respectively.
Fig. 4. Effect of aw on sol-to-gel ratio in the sol-gel transition of 5% gelatin in various aqueous solutions. From Miyawaki et al. (2015) with permission.
Water and Freezing in Food 5
parameters, the amount of ice fraction, fi (g-ice/g-total water), is easily obtained as a function of temperature as follows (Pham and Willix 1989; Cogne et al., 2003).
fi = (1 – xb /xw)(1 – θf /θ) = fFW (1 – θf /θ) Eq. 18
where xw is the water content (g-water/g-solid), fFW is the freezable water content (g-water/g-total water), and θ is the temperature of interest (℃).
Although the ice fraction was not explicitly described as a function of temperature in the ideal solution approach (Heldmann,
Fig. 5. Schematic diagram of intermacromolecurar interactions in aqueous solution.
Fig. 6. Concentration effect of solutes along with freezing.
Fig. 7. Water activity and osmotic pressure as a function of temperature in the frozen state.
Table 2 . Amount of unfrozen water (xb) and initial freezing point (θf)for various food*)
Food Water content, xw (g/g) xb (g/g) θf (℃)
Lean beef 0 .800 0 .037 –0 .733Lean beef 0 .500 0 .159 –3 .628Lean beef 0 .261 0 .165 –13 .46Calf veal 0 .775 0 .065 –0 .682Lamb loin 0 .649 0 .071 –0 .896Lamb loin 0 .444 0 .080 –0 .841Cod 0 .803 0 .046 –0 .907Haddock 0 .791 0 .043 –0 .861Egg white 0 .865 0 .015 –0 .506Egg york 0 .500 0 .051 –0 .536Bread 0 .373 0 .090 –4 .833Methyl cellulose 0 .750 0 .108 –0 .768
*) Adapted from Pham (1978).

O. Miyawaki6
1974), this was easily done in Eq. 18. The accuracy of this equation was confirmed experimentally by comparing the ice fraction obtained by this equation and that from the phase diagram analysis (Pongsawatmanit and Miyawaki, 1993b). The two parameters in Eq. 18 have been obtained directly by freezing point measurement and DSC analysis (Pongsawatmanit and Miyawaki, 1993b; Pradipasena et al., 2007) as shown in Table 3, where the parameters are described as a function of the solid content, xs (g-solid/g-total system) as follows.
θf = axs + bxs2 + cxs
3 ······Eq. 19
xb = dxs0.5(1 – xs) ······Eq. 20
xb= exs + fxs2 ······Eq. 21
Figure 8 shows the ice fraction calculated by these equations for solutions of glucose and Dextran T500 (Pradipasena et al., 2007).
The thermal properties of water, such as density, heat capacity, and thermal conductivity, differ between the unfrozen and frozen states. Among these properties, thermal conductivity largely changes from 0.583 to 2.220 (W/m/K) in freezing. In addition, this is a transport property, thus, the thermal conductivity of a multicomponent system, like food, is dependent not only on the composition but also on the spatial structure. Therefore, this property should be treated as the effective thermal conductivity.
There are two methods to measure the effective thermal conductivity; steady state and unsteady state methods. As the effective thermal conductivity of food materials is strongly dependent on temperature through the change in ice fraction, the steady state method at a fixed temperature is preferable. For this purpose, Pham and Willix (1989) applied a guarded hot plate method and Pongsawatmanit et al. (1993a) applied a coaxial dual-cylinder apparatus. In the unsteady state method, data should be taken in a narrow temperature range to avoid the effect of the change in ice fraction.
To analyze the effective thermal conductivity, λe, various structural models have been compared as shown in Fig. 9
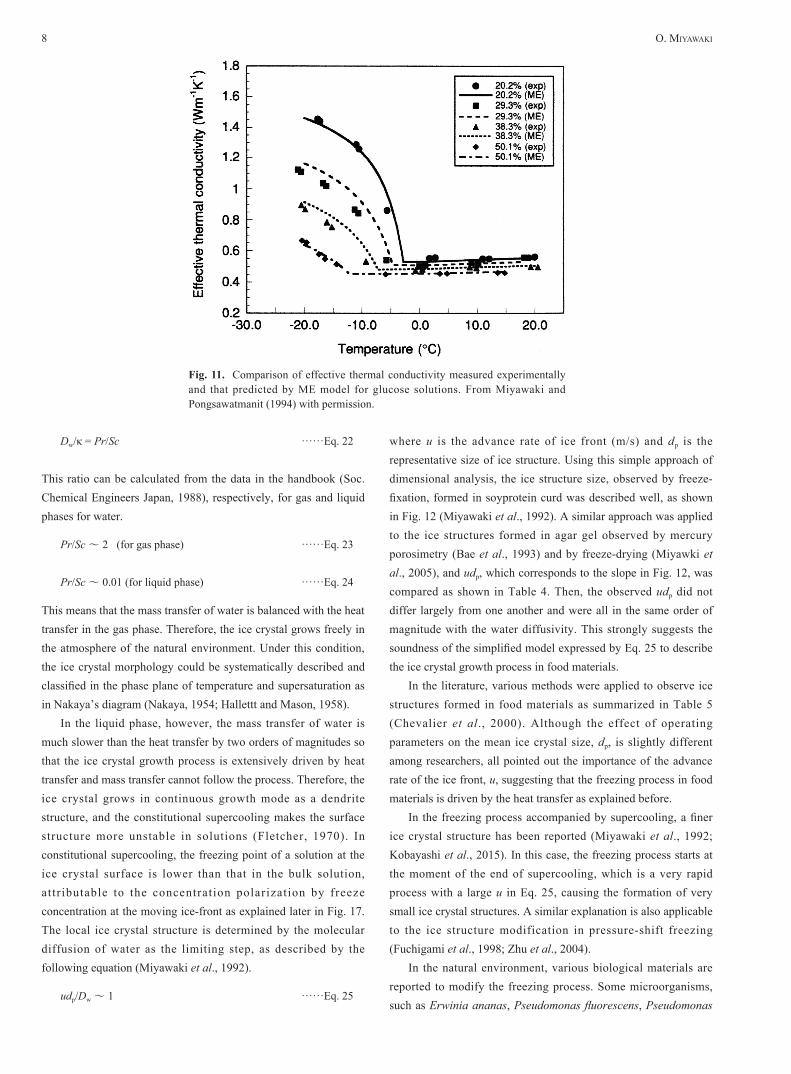
(Miyawaki and Pongsawatmanit, 1994). In the unfrozen state, all the models were applicable, but only the Maxwell-Eucken model (ME model) with dispersed ice phase was applicable to the frozen state for aqueous glucose solution as shown in Fig. 10 (Miyawaki, 1998). Similar results were also reported for aqueous solutions of glucose, sucrose, potato starch, gelatin, and egg albumin (Miyawaki and Pongsawatmanit, 1994; Renaud et al., 1992). Figure 11 shows the comparison of the predicted results of the effective thermal conductivity based on the ME model with experimental results for glucose solutions (Miyawaki and Pongsawatmanit, 1994). The temperature dependency of the effective thermal conductivity is similar to that of the ice fraction in Fig. 8, showing the strong relationship between the two.
Freezing and ice crystallization in foodFreezing consists of two consecutive steps; ice nucleation and
crystal growth (Fletcher, 1970). In ice nucleation, there are two
Fig. 8. Fraction of frozen water as a function of temperature in solutions of glucose and Dextran T500. From Pradipasena et al. (2007) with permission.
Table 3 . Parameters in Eqs . 19-21 to determine initial freezing point and bound water for various solutions
Freezing point, θf (℃) Bound water fraction, xb (g/g)
Solute a b c d e f
Glucose 10 .15 22 .73 - 0 .6872 - -Maltose 5 .301 13 .61 - 0 .5045 - -Maltotriose 1 .994 14 .35 - 0 .4727 - -Dextran T10 –0 .9048 10 .28 - - 1 .005 –1 .005Dextran T500 –0 .7843 11 .01 - - 1 .093 –1 .093Potato starch*) 0 - - - 0 .9208 –0 .9208Gelatin 0 .831 –7 .75 34 .0 - 0 .647 0 .00547Egg albumin 2 .38 8 .93 - - 0 .217 –0 .0419
*) Freezable water totally freezes just below the freezing point .

Water and Freezing in Food 7
mechanisms: homogeneous nucleation and heterogeneous nucleation. In the former case, an ice nucleus should overcome the large energy barrier to generate a new surface in the homogeneous field. In the latter case, an ice nucleus is generated on the existing solid surface of ice-nucleation-active materials, which is much easier than the former case. In the freezing of food, some components are expected to have ice-nucleation activity, and thus heterogeneous nucleation is considered to be dominant.
Once an ice nucleus is formed in the system, it grows to be a crystal. In the crystal growth process, three mechanisms exist. The first and the second mechanisms, respectively, are ice crystal growth by two-dimensional nucleation from the perfect crystal surface and that through screw dislocation. These two mechanisms are relatively slow processes and occur when the driving force for ice crystal formation is small. In these two mechanisms, ice
crystals grow systematically to maintain their crystal structure. The third mechanism of ice crystal growth is called continuous growth, which occurs when the driving force is large (Fletcher, 1970). In the freezing of food, this mechanism is dominant because food samples are frozen rapidly at a large temperature gradient. In this mechanism, ice crystal growth is driven by heat transfer so the ice crystals grow in a dendrite structure with a rough surface.
In the ice crystal growth process, the structure of the ice crystal is determined by the balance between the mass transfer of water and the heat transfer. The former is represented by diffusivity (Dw) and the latter by thermal diffusivity (κ). The ratio between the two is described by the nondimensional parameters of the Prandtl number (Pr = ν/κ; ν, kinematic viscosity) and the Schmidt number (Sc =ν/Dw) as follows.
Fig. 9. Structure models for effective thermal conductivity of multicomponent system. From Miyawaki and Pongsawatmanit (1994) with permission.
Fig. 10. Comparison among structure models for effective thermal conductivity of 20% glucose solution. From Miyawaki (1998) with permission.
O. Miyawaki8
Dw/κ = Pr/Sc ······Eq. 22
This ratio can be calculated from the data in the handbook (Soc. Chemical Engineers Japan, 1988), respectively, for gas and liquid phases for water.
Pr/Sc ~ 2 (for gas phase) ······Eq. 23
Pr/Sc ~ 0.01 (for liquid phase) ······Eq. 24
This means that the mass transfer of water is balanced with the heat transfer in the gas phase. Therefore, the ice crystal grows freely in the atmosphere of the natural environment. Under this condition, the ice crystal morphology could be systematically described and classified in the phase plane of temperature and supersaturation as in Nakaya’s diagram (Nakaya, 1954; Hallettt and Mason, 1958).
In the liquid phase, however, the mass transfer of water is much slower than the heat transfer by two orders of magnitudes so that the ice crystal growth process is extensively driven by heat transfer and mass transfer cannot follow the process. Therefore, the ice crystal grows in continuous growth mode as a dendrite structure, and the constitutional supercooling makes the surface structure more unstable in solutions (Fletcher, 1970). In constitutional supercooling, the freezing point of a solution at the ice crystal surface is lower than that in the bulk solution, attributable to the concentration polarization by freeze concentration at the moving ice-front as explained later in Fig. 17. The local ice crystal structure is determined by the molecular diffusion of water as the limiting step, as described by the following equation (Miyawaki et al., 1992).
udp/Dw ~ 1 ······Eq. 25
where u is the advance rate of ice front (m/s) and dp is the representative size of ice structure. Using this simple approach of dimensional analysis, the ice structure size, observed by freeze-fixation, formed in soyprotein curd was described well, as shown in Fig. 12 (Miyawaki et al., 1992). A similar approach was applied to the ice structures formed in agar gel observed by mercury porosimetry (Bae et al., 1993) and by freeze-drying (Miyawki et al., 2005), and udp, which corresponds to the slope in Fig. 12, was compared as shown in Table 4. Then, the observed udp did not differ largely from one another and were all in the same order of magnitude with the water diffusivity. This strongly suggests the soundness of the simplified model expressed by Eq. 25 to describe the ice crystal growth process in food materials.
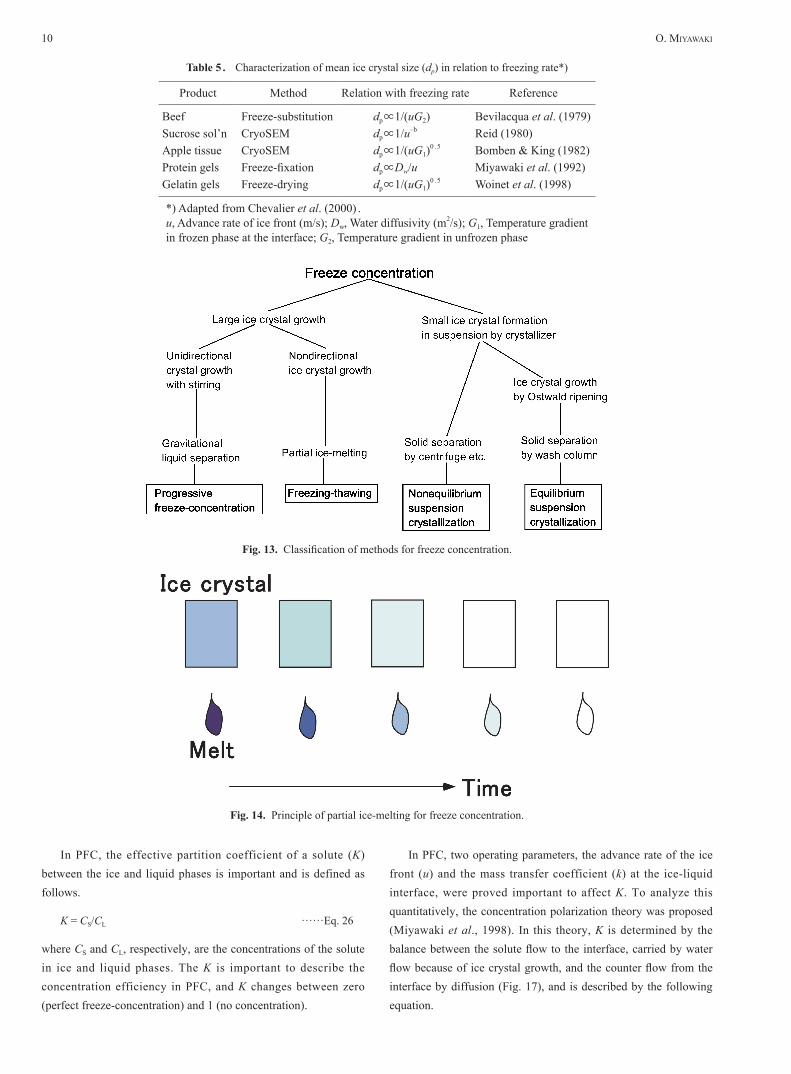
In the literature, various methods were applied to observe ice structures formed in food materials as summarized in Table 5 (Chevalier et al., 2000). Although the effect of operating parameters on the mean ice crystal size, dp, is slightly different among researchers, all pointed out the importance of the advance rate of the ice front, u, suggesting that the freezing process in food materials is driven by the heat transfer as explained before.
In the freezing process accompanied by supercooling, a finer ice crystal structure has been reported (Miyawaki et al., 1992; Kobayashi et al., 2015). In this case, the freezing process starts at the moment of the end of supercooling, which is a very rapid process with a large u in Eq. 25, causing the formation of very small ice crystal structures. A similar explanation is also applicable to the ice structure modification in pressure-shift freezing (Fuchigami et al., 1998; Zhu et al., 2004).
In the natural environment, various biological materials are reported to modify the freezing process. Some microorganisms, such as Erwinia ananas, Pseudomonas fluorescens, Pseudomonas
Fig. 11. Comparison of effective thermal conductivity measured experimentally and that predicted by ME model for glucose solutions. From Miyawaki and Pongsawatmanit (1994) with permission.

Water and Freezing in Food 9
syringae, have been reported to produce ice-nucleating proteins (Maki et al., 1974; Arny et al., 1976; Lindow et al., 1978). As for antifreeze activity, several papers have been published on antifreeze glycoproteins (Franks et al., 1987; DeVries et al., 1970; Bouvet and Ben, 2003) and antifreeze proteins (Feeney, 1978; Gupta and Deswal, 2014; Ustun and Turhan, 2015). It should be kept in mind that these materials modify the freezing process through their activity on ice nucleation and crystal growth, but these cannot entirely control the freezing because this is a physical process driven by heat transfer. Ice crystals are known to grow through recrystallization during long-term preservation (Martino and Zaritzky, 1988; Hagiwara et al., 2005). Freezing modifiers are reported to be applicable to stabilize ice crystals, thereby maintaining the quality of frozen food during storage (Ustun and Turhan, 2015).
Freezing and freeze concentrationThe concentration of liquid foods is very important in their
preservation and transportation. There are three methods in the concentration of liquids: evaporation, reverse osmosis, and freeze concentration. Among these, freeze concentration is known to give the best quality but with the highest cost (Deshpande et al., 1982).
Methods for freeze concentration are classified into four categories as shown in Fig. 13. Among these, the simplest method is “freezing-thawing (FT)”, the principle of which is based on partial ice-melting (Fig. 14). In this case, the whole sample is frozen once as an ice block and then thawed slowly. Then, a concentration gradient is observed among the thawed fractions with the higher concentration in the initial fractions. Attempts have been made to apply FT in the desalination from sea-water (Johnson,
1993; Khawaji et al., 2008; Mandri et al., 2011; Rich et al., 2012) and the concentration of liquid foods (Yee et al., 2003, 2004; Nakagawa et al., 2009, 2010ab; Moreno et al., 2013, 2014). In the use of FT alone, however, the concentration efficiency is limited, so that multiple operations are inevitable (Aider and Halleux, 2008ab) to obtain a high level of concentration, requireing high energy consumption in the process.
There have been lots of studies on “nonequilibrium suspension crystallization (NSC)” (Muller, 1967). In this method, the solution sample is introduced into a crystallizer to form small ice crystals, which are removed from the mother solution in a separator, typically by centrifugation. This method requires relatively simple system but has a drawback in the yields obtained attributable to the incorporation of solutes into the ice crystals formed rapidly in the crystallizer.
To improve this drawback in NSC, Huige and Thijssen (1972) introduced a recrystallizer between the crystallizer and the separator. In this method, small ice crystals are grown large and purified by the Ostwald ripening mechanism. By this technique, the purity of ice crystals was drastically improved and the yield of the process was greater than 99%, which made it possible to use this process in practice. This method will be called “equilibrium suspension crystallization (ESC)”. Although ESC has been now used industrially as an established process, the Ostwald ripening process, as a key technology, needs a long operation time, thus ESC is limited only to large scale systems in continuous operation mode. This necessitates a high initial investment with less flexibility in the operation, limiting the practical application of ESC.
The fourth category in freeze concentration is “progressive freeze-concentration (PFC)”, in which a single ice crystal is formed on a cooling plate in the system. PFC is compared with ESC in Fig. 15, showing that PFC is a much simpler system and highly flexible in operation to ESC. The idea of PFC started from the preconcentration of a dilute solution for analytical purposes (Matthews and Coggeshall, 1959; Shapiro, 1961). In Fig. 16, a typical small test apparatus for PFC is shown (Bae et al., 1994; Liu et al., 1997, 1998, 1999).
Fig. 12. Effect of advance rate of ice front (u) on mean ice crystal size formed in soy protein curd. From Miyawaki et al. (1992) with permission.
Table 4 . Comparison of udP measured in various systems*)
Frozen sample udP (10–9 m2/s)**)
Soy protein curd (6 .2%) 0 .36Soy protein curd (6 .2%) frozen with ultrasound 0 .365Soy protein curd (6 .2%) with AgI added 0 .2Soy protein curd (6 .2%) with CaCO3 added 0 .365Egg albumin (8 .0%) 0 .292Agar gel (1 . 5%) 0 .261Agar gel (3%) 0 .271Agar gel (5%) 0 .273
*) Adapted from Miyawaki et al . (2005a) .**) Diffusivity of water: Dw =1 .0×10–9 m2/s at 0℃
O. Miyawaki10
In PFC, the effective partition coefficient of a solute (K) between the ice and liquid phases is important and is defined as follows.
K = CS/CL ······Eq. 26
where CS and CL, respectively, are the concentrations of the solute in ice and liquid phases. The K is important to describe the concentration efficiency in PFC, and K changes between zero (perfect freeze-concentration) and 1 (no concentration).
In PFC, two operating parameters, the advance rate of the ice front (u) and the mass transfer coefficient (k) at the ice-liquid interface, were proved important to affect K. To analyze this quantitatively, the concentration polarization theory was proposed (Miyawaki et al., 1998). In this theory, K is determined by the balance between the solute flow to the interface, carried by water flow because of ice crystal growth, and the counter flow from the interface by diffusion (Fig. 17), and is described by the following equation.
Fig. 14. Principle of partial ice-melting for freeze concentration.
Fig. 13. Classification of methods for freeze concentration.
Table 5 . Characterization of mean ice crystal size (dp) in relation to freezing rate*)
Product Method Relation with freezing rate Reference
Beef Freeze-substitution dp∝1/(uG2) Bevilacqua et al. (1979)Sucrose sol’n CryoSEM dp∝1/u–b Reid (1980)Apple tissue CryoSEM dp∝1/(uG1)
0 .5 Bomben & King (1982)Protein gels Freeze-fixation dp∝Dw/u Miyawaki et al. (1992)Gelatin gels Freeze-drying dp∝1/(uG1)
0 .5 Woinet et al. (1998)
*) Adapted from Chevalier et al. (2000) .u, Advance rate of ice front (m/s); Dw, Water diffusivity (m2/s); G1, Temperature gradient in frozen phase at the interface; G2, Temperature gradient in unfrozen phase

Water and Freezing in Food 11
K = K0/[K0 + (1 – K0) exp (–u/k)] ······Eq. 27
where K0 is a parameter called limiting partition coefficient corresponding to K at u→0 and/or k →∞ and k is related to the
stirring rate by the equation below with a as an experimental parameter.
k = aN 0.2 ······Eq. 28
By using Eqs. 27 and 28, the experimental data were explained as shown in Fig. 18 (Miyawaki et al., 1998) and the limiting partition coefficient was obtained (Pradistsuwana et al., 2003; Gu et al., 2005). It was revealed that K0 is not constant, but is strongly dependent on the concentration of the solute or the osmotic pressure of the solution.
The next step for PFC is its scale-up for practical application. For this purpose, a falling film reactor was proposed (Flesland, 1995) and was applied for the concentration of various liquid foods (Hernandez et al., 2009, 2010; Sanchez et al., 2010, 2011). In this system, the ice crystal grows on a vertically placed cooling plate on which the solution to be concentrated flows as a falling film. Although this system is simple, the limited flow rate as a falling film causes a limited k in Eq. 27 and its open air surface structure may cause a loss in volatile components. Therefore, a closed tubular ice system with a circulating flow was developed for the scale-up of PFC (Miyawaki et al., 2005b).
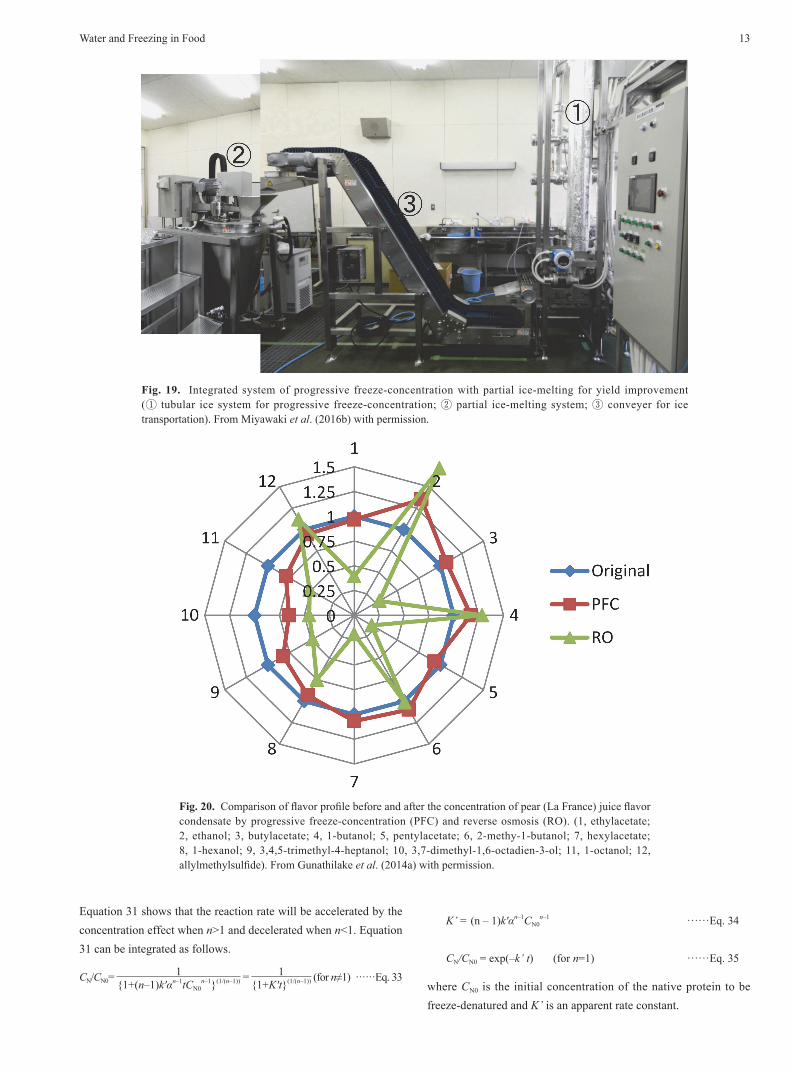
A major drawback in PFC has been the incorporation of solutes into the ice phase, which reduce yields, especially in high concentration solutions (Gu et al., 2005). To overcome this drawback, the application of partial ice-melting (PIM) in Fig. 14 to the ice formed after PFC was proved to be effective to improve yields in the process (Miyawaki et al., 2012; Gunathilake et al., 2014b), and an integrated system of PFC combined with PIM was established as shown in Fig. 19 (Miyawaki et al., 2016b).
The mechanism of the incorporation of solutes in PFC was proved to be nonselective incorporation into the space between the
Fig. 15. Comparison between equilibrium suspension crystallization (ESC) and progressive freeze-concentration (PFC).
Fig. 16. A small test apparatus for progressive freeze-concentration.

O. Miyawaki12
dendrite ice-crystal structures (Watanabe et al., 2013). This differs greatly from the other concentration methods. Components are separated and concentrated depending on the molecular size in reverse osmosis (RO) and on vapor pressure in evaporation (EV). Therefore, the profile among components is expected to be preserved in PFC but not in RO and EV. In Fig. 20, flavor profiles of pear juice flavor condensate are compared before and after concentration by PFC and RO (Gunathilake et al., 2014a). The original profile was preserved well in PFC but changed substantially in RO. In EV, all components in Fig. 20 were almost completely lost, even though the evaporation was carried out at 50℃ under a vacuum (Gunathilake et al., 2014a).
As a high quality concentration method with high flexibility, PFC is expected to be applied to concentrate various liquid foods, such as natural flavors and extracts from tea and coffee (Gunathilake et al., 2014a). Fruit juices can be concentrated by PFC to increase the sugar content, allowing the concentrates to be fermented to produce fruit wines without chaptalization. By using this method, new types of fruit wines were produced for apple (Miyawaki et al., 2016a), pineapple (Miyawaki et al., 2017b), and blueberry (Miyawaki et al., 2017c). PFC was also applied to concentrate Japanese sake (Miyawaki et al., 2017a), increasing its alcohol content from 17.0 to 27.1% (v/v). To increase the alcohol content of fermented products, this represents a new alternative to evaporation, in which the component profile is completely different before and after concentration.
Freezing and chemical reactions in aqueous systemsIn freezing, some chemical reactions in aqueous solutions are
known to be accelerated (Fennema, 1974; Poulsen and Lindelov, 1981). The alkaline hydrolysis of alkyl-4-hydroxybenzoate esters was accelerated by 20 times in the temperature change from +30 to –9℃ (Shija et al., 1992). The oxidation rate of ascorbic acid by hydrogen peroxide increased substantially under freezing (Hatley et al., 1986). The oxidation rate of nitrile by oxygen was increased by freezing to greater than 105 times (Takenaka et al., 1992). The
acid denaturation rate of ricin D showed its maximum at –29℃ (Yamasaki et al., 1988). The aggregation of bovine serum albumin by formaldehyde took place only in a frozen state (Sotelo and Mackie, 1993). The aggregation rate of actin and myosin in carp myofibrils was the highest at –4℃ (Kitazawa et al., 1997).
In the frozen state, solutes are concentrated as shown before in Fig. 6. The major mechanism of the rate of acceleration in a frozen state exists in this “concentration effect” of aqueous solutions through ice crystal formation. The freeze-denaturation of soyprotein was described by a model in which n native protein molecules react with one another to precipitate (Miyawaki and Nishino, 2016).
nCN → CD ······Eq. 29
where CN and CD are the molar concentrations of native and denatured proteins, respectively. The reaction order is assumed to be n-th order, thus the reaction rate is:
–(dCN/dt) = k'CNn ······Eq. 30
where t is time and k’ is the intrinsic reaction rate constant. When a protein solution is frozen, the protein as a solute is concentrated through ice crystal formation. Because of this “concentration effect”, the protein concentration will increase by a factor of α, while the reaction volume will decrease by a factor of 1/α, where α is the concentration factor in the freeze-induced concentration. Then, Eq. 30 can be rewritten as follows:
–(dCN/dt) = (1/α) k' (αCN)n = k'αn–1CNn ······Eq. 31
The physicochemical meaning of the concentration factor α is as follows.
α = [freezable water]/[unfrozen water] ······Eq. 32
Fig. 17. Concentration polarization model for progressive freeze-concentration. From Miyawaki et al. (1998) with permission.
Fig. 18. Effects of stirring rate (N) and advance rate of ice front (u) on effective partition coefficient (K) in progressive freeze-concentration. Lines are theoretical results by concentration polarization model. From Miyawaki et al. (1998) with permission.
Water and Freezing in Food 13
Equation 31 shows that the reaction rate will be accelerated by the concentration effect when n>1 and decelerated when n<1. Equation 31 can be integrated as follows.
CN/CN0= 1{1+(n–1)k'αn–1tCN0
n–1}(1/(n–1)) = 1{1+K't}(1/(n–1)) (for n≠1) ······Eq. 33
K’ = (n – 1)k'αn–1CN0n–1 ······Eq. 34
CN/CN0 = exp(–k’ t) (for n=1) ······Eq. 35
where CN0 is the initial concentration of the native protein to be freeze-denatured and K’ is an apparent rate constant.
Fig. 19. Integrated system of progressive freeze-concentration with partial ice-melting for yield improvement (① tubular ice system for progressive freeze-concentration; ② partial ice-melting system; ③ conveyer for ice transportation). From Miyawaki et al. (2016b) with permission.
Fig. 20. Comparison of flavor profile before and after the concentration of pear (La France) juice flavor condensate by progressive freeze-concentration (PFC) and reverse osmosis (RO). (1, ethylacetate; 2, ethanol; 3, butylacetate; 4, 1-butanol; 5, pentylacetate; 6, 2-methy-1-butanol; 7, hexylacetate; 8, 1-hexanol; 9, 3,4,5-trimethyl-4-heptanol; 10, 3,7-dimethyl-1,6-octadien-3-ol; 11, 1-octanol; 12, allylmethylsulfide). From Gunathilake et al. (2014a) with permission.

O. Miyawaki14
The freeze-denaturation of soy protein was analyzed and the changes in the native and denatured protein concentrations were separately measured. Results are shown in Fig. 21 and compared with the calculations based on Eqs. 33–35, showing the effectiveness of the theoretical model. The concentration factor α was proved to be described by the following simple equation from its definition by using Eq. 18.
α = θ/θf ······Eq. 36
The acceleration ratio increased with increases in the dilution ratio and in temperature under freezing when compared at –5, –18, and –40℃. With the addition of sucrose, as a cryoprotectant, the acceleration ratio decreased substantially. The reaction order n was estimated to be close to 2 from the analysis, suggesting the freeze-denaturation of soy protein seemed likely to be triggered by a bimolecular reaction between protein molecules, like S-S bond formation (Hashizume et al., 1971).
Freezing and cell structureFreezing causes a large increase in osmotic pressure because of
the concentration of solutes, as explained in the previous section. In the cell structure system, freezing occurs independently in extracellular and intracellular spaces (Fig. 22). In most cases, extracellular freezing occurs first and intracellular spaces are left unfrozen to be supercooled. This causes a large difference in the osmotic pressure between the outside and inside of the cell and triggers the flow of water from the inside to the outside of the cell, which is called freeze-induced osmotic dehydration (Bronshteyn and Steponkus, 1993). When this dehydration process continues until the intracellular solution has attained a glassy state avoiding intracellular freezing, the cell has a greater chance of survival (left-hand pathway in Fig. 22). In contrast, intracellular freezing induces cell death because of plasma membrane injury (right-hand pathway in Fig. 22; Ishikawa et al., 1997).
In Fig. 22, cellular fate, i.e., alive vs dead, is largely dependent on the rate of freeze-induced osmotic dehydration. This process is described by the following equation.
dV(t)/dt = –LpA [Πout – Πin(t)] ······Eq. 37
where V(t) is the cell volume at time t, A is the surface area of the cell, Πout and Πin(t), respectively, are the osmotic pressures at the outside and inside of the cell, and Lp is the permeability of water through the plasma membrane.
In the freeze-induced osmotic dehydration process, Lp is the key parameter to determine the rate of the process, and thus this parameter has been measured for various cells using various techniques. The Lp of human granulocytes was measured by a microscopic stopped flow system (Diller and Bradley, 1994), that of hamster pancreatic islet cells by an electronic particle counter (Liu et al., 1995), human blood cells by light scattering (Sidel and Solomon, 1957), ram and human spermatozoa (Curry et al., 1994)
and Holstein spermatozoa (Chaveiro et al., 2006) by fluorescence measurement. The Lp of cultured rice (Oryza sativa), grape (Vitis sp.), CH27 cells (Ishikawa et al., 1997), and yeast cells (Hanazawa et al., 1998) were measured dielectrically.
The results for Lp measurement are summarized in Table 6. In the actual cellular response to extracellular osmotic pressure stress, the cell diameter (D) also affects the process, thus the combined parameter Lp/D is ultimately important. Then, it was revealed that Lp/D of plant cells like rice and grape is much lower than that of microorganisms and animal cells by one to several orders of magnitude. This may explain why plant cells are more difficult to preserve in a frozen state compared with other type cells.
In the preservation of raw food materials, changes in cell structure play key roles. To monitor the state of cell structures, electrical impedance spectroscopy was applied to agricultural products to analyze their quality and freshness (Sugiyama et al., 1987; Kato, 1998) as well as their ripeness and maturity (Bauchot et al., 2000; Desai et al., 1977; Weaver et al., 1966). Electrical impedance measurements were also applied to assess the freezing and cold injury of agricultural products (Zhang et al., 1992ab; Dejmek and Miyawaki, 2002; Miyawaki and Shimiya, 2002; Ohnishi et al., 2002).
In Fig. 23A, impedance spectra are shown for carrot tissue before and after freezing (Miyawaki and Shimiya, 2002). After freezing, the impedance of carrot drastically decreased. In Fig. 23B, the Cole-Cole plots (Cole, 1932) are shown. For the fresh sample, a clear Cole-Cole arc is observed, showing the integrity of the cell structure, while it was completely lost after freezing-thawing, suggesting critical damage to the plasma membrane.
Fig. 21. Changes in native and denatured soy protein concentrations during freeze preservation at –5℃. Native and denatured proteins were measured by optical absorbance at 280 and 600 nm, respectively. Solid and broken lines are predictions by the theoretical model by Eq. 33. From Miyawaki and Nishino (2016) with permission.

Water and Freezing in Food 15
Similar damage to the plasma membrane by freezing was also reported for onion tissue by PFG-NMR measurement (Ando et al., 2009). Because of the damage to the plasma membrane, cells lose their turgor pressure (Falk et al., 1958) and the rheological properties change drastically (Ohnish et al., 2002, 2003, 2004; Dejmek and Miyawaki, 2002).
In Fig. 24, impedance spectra are shown for chicken meat (Miyawaki and Shimiya, 2002). The impedance of chicken meat is
much lower than that of carrot by one order of magnitude, reflecting differences in the cell structure. No substantial changes, however, were observed for chicken meat before and after freezing, including Cole-Cole plots. This different behavior in impedance before and after freezing seems to reflect the difference in freezing tolerance between plant and animal tissues.
To reduce deterioration by freezing injury, osmotic dehydration has been applied to apples (Lazar et al., 1961; Ponting et al., 1966; Tregunno and Goff, 1996), strawberries (Garrote and Bertone, 1989), kiwi fruits (Talens et al., 2003), tropical fruits (Moy et al., 1987; Moyano et al., 2002), pears (Bolin and Huxsoll, 1993), carrot and green bean (Biswal et al., 1991). Osmotic dehydration had limited effectiveness on freezing injury, both in regards to cell structure and rheological properties, and depending on the type of plant tissue (Ohnishi and Miyawaki, 2005).
Concluding remarksIn aqueous solutions, the major reason for the deviation of aw
from the ideal solution behavior was proved to exist in the hydration of solutes. In macromolecule solutions, intermolecular interactions among macromolecules are primarily dependent on aw, but are also dependent on the balance between the hydration and cosolute-binding of macromolecules. In addition, an indirect effect of the change in the solution structure may be expected through the change in hydrophobic interaction.
Freezing of food means freezing of water in the system, causing a substantial concentration effect to reduce aw and increase osmotic pressure. The ice fraction affects various properties of frozen food so that the understanding of the ice fraction as a function of temperature is of primary importance. The ice fraction could be described by a two-parameter equation with the initial freezing temperature and the unfrozen water content. Because of the large difference between unfrozen and frozen states, the
Fig. 22. Extracellular and intracellular ice crystal formation in the freezing of cell.
Table 6 . Comparison of water permeation parameter through membrane (LP/D) for various cells*)
Cell Temperature (℃) LP D LP/D Ref .
Yeast 25 0 .0332 6 5 .53 1)Rice (Oryza sativa) 25 0 .0147 20 .2 0 .73 2)Grape (Vitis sp . ) 25 0 .020 34 .2 0 .58 2)Murine B-cell (CH27) 25 0 .090 14 6 .4 2)Hamster pancreatic islet 22 0 .041 11 .4 3 .6 3)Human erythrocytes 25 0 .94 7 134 4)Human granulocyte 25 0 .189 <10 >19 5)Human spermatozoa 22 0 .476 6 .2 77 6)Ram spermatozoa 25 1 .39 6 .7 207 6)Holstein spermatozoa 22 0 .461 6 .8 6 .78 7)
LP, water permeability (pm/s/Pa); D, cell diameter (μm); LP/D , 10–9 (1/s/Pa)*) Adapted from Ishikawa et al. (1997) and Hanazawa et al. (1998).1) Hanazawa et al. (1998) . 2) Ishikawa et al. (1997). 3) Liu et al. (1995).4) Sidel and Solomon (1957) . 5) Diller and Bradley (1984). 6) Curry et al . (1994).7) Chaveiro et al. (2006).

O. Miyawaki16
effective thermal conductivity of food changes drastically upon freezing. To describe the temperature dependency of the effective thermal conductivity before and after freezing, the Maxwell-Eucken model with dispersed ice phase was useful.
In the ice crystallization process in food, the mechanism of ice crystal growth is much different from that in the gas phase and is extensively driven by heat transfer, causing unstable dendritic crystal growth, the structure of which is limited by the molecular diffusion of water. The mean ice crystal size was proved to be inversely proportional to the advance rate of the ice front.
Methods for freeze concentration, for the high quality concentration of liquid foods, were classified into four categories. Among those, the equilibrium suspension crystallization (ESC) is the only method presently available in practice. ESC, however, is a complex system that requires large initial investment and its operation mode is limited to the less flexible continuous operation with long residence time. In contrast, progressive freeze-concentration (PFC) is expected to be a less expensive alternative with greater flexibility in operation mode. The principle for the concentration of solutes at the ice-liquid interface was described by a concentration polarization theory. Application of the partial ice-melting technique was shown to be effective to improve the reduction in yield by solute incorporation into the ice phase, which has been a major drawback of PFC.
Some chemical reactions are accelerated in the frozen state. A universal theoretical model was proposed in consideration of the concentration effect with freezing. This theoretical model could effectively explain the kinetics of the freeze-denaturation process of soy protein.
When cellular structures exist in the system, freezing occurs independently in extracellular and intracellular spaces. Extracellular freezing causes freeze-induced osmotic dehydration, the rate of which determines the fate of cells to be alive or not , as intracellular freezing causes cell death due to plasma membrane injury. In the freeze-induced osmotic dehydration process, the water permeability through the plasma membrane plays a key role. The dehydration rate was compared under osmotic stress for various cell types. Then, it was revealed that the dehydration rates of plant cells were much lower than those of microorganisms and animal cells. This difference appears to explain the lower freeze-tolerance of plant cells and tissues as compared to others.
ReferencesAider, M. and de Halleux, D. (2008a). Passive and microwave-assisted
thawing in maple sap cryoconcentration technology. J. Food Eng., 85,
65–72.
Fig. 24. Impedance spectra (A) and Cole-Cole plot (B) for chicken meat before and after freezing-thawing. From Miyawaki and Shimiya (2002) with permission.
Fig. 23. Impedance spectra (A) and Cole-Cole plot (B) for carrot tissue before and after freezing-thawing. From Miyawaki and Shimiya (2002) with permission.
Water and Freezing in Food 17
Aider, M. and de Halleux, D. (2008b). Production of concentrated cherry
and apricot juices by crycconcentration technology. LWT-Food Sci.
Technol., 41, 1768–1775.
Arny, D. C., Lindow, S. E., and Upper, C. D. (1976). Frost sensitivity of
Zea mays increased by application of Pseudomonas syringae. Nature,
262, 282–284.
Ando, H., Fukuoka, M., Miyawaki, O., Watanabe, M., and Suzuki, T.
(2009). PFG-NMR study for evaluation of freezing damage in onion
tissue, Biosci. Biotechnol. Biochem., 73, 1257–1261 (2009).
Bae, S. K., Miyawaki, O., and Yano, T. (1993).Ice structure size in frozen
agar gels analyzed by mercury porosimetry. Biosci. Biotech. Biochem.,
57, 1624–1627.
Bae, S. K., Miyawaki, O., and Arai, S. (1994). Control of freezing front
structure and its effect on the concentration efficiency in progressive
freeze-concentration. Cryobiol. Cryotechnol. (Teion Seibutu Kogaku
Kaishi), 40, 29–32 (in Japanese).
Bauchot, A. D., Harker, F. R., and Arnold, W. M. (2000). The use of
electrical impedance spectroscopy to assess the physiological condition
of kiwi fruits. Postharv. Biol. Technol., 18, 9–18.
van den Berg, C. and Bruin, C. (1981). Water activity and its estimation in
food systems: Theoretical aspects. In “Water activity: Influences on food
quality,” ed. by L. B. Rockland and G. F. Stewart. Academic Press, New
York, pp.1–61.
Bevilacqua, A., Zaritzky, N. E., and Calveo, A. (1979). Histological
measurement of ice in frozen beef. J. Food Technol., 14, 237–251.
Biswal, R. N., Bozorgmehr, K., Tompkins, D. D., and Liu, X. (1991).
Osmotic concentration of green beans prior to freezing. J. Food Sci., 56,
1008–1012.
Bolin, H. R. and Huxsoll, C. C. (1993). Partial drying of cut pears to
improve freeze/thaw texture. J. Food Sci., 48, 202–205.
Bomben, J. L. and King, C. J. (1982). Heat and mass transport in the
freezing of apple tissue. J. Food Technol., 17, 615–632.
Boonsupthip, W. and Heldmann, D. R. (2007). Prediction of frozen food
properties during freezing using product composition. J. Food Sci., 72,
E254–263.
Bouvet, V. and Ben, R. N. (2003). Antifreeze glycoproteins. Cell Biochem.
Biophys., 39, 133–144.
Bronshteyn, V. L. and Steponkus, P. L. (1993). Calorimetric studies of
freeze-induced dehydration of phospholipids. Biophys. J., 65, 1853–
1865.
Chandrasekaran, S. K. and King, C. J. (1971). Solid-liquid phase equilibria
in multicomponent aqueous sugar solutions. J. Food Sci., 36, 699–704.
Chaveiro, A., Liu, J., Engel, B., Crister, J. K., and Woelders, H. (2006).
Significant variability among bulls in the sperm membrane permeability
for water and glycerol: Possible implications for semen freezing
protocols for individual males. Cryobiology, 53, 349–359.
Chen, C. S. (1985a). Thermodynamic analysis of the freezing and thawing
of foods: Enthaly and apparent specific heat. J. Food Sci., 50, 1158–
1162.
Chen, C. S. (1985b). Thermodynamic analysis of the freezing and thawing
of foods: Ice content and Mollier diagram. J. Food Sci., 50, 1163–1166.
Chen, C. S. (1987). Relationship between water activity and freezing point
depression of food systems. J. Food Sci., 52, 433–435.
Chen, C. S. (1990). Predicting water activity in solutions of mixed solutes.
J. Food Sci., 55, 494–515.
Chevalier, D., Le Bail, A., and Ghoul, M. (2000). Freezing and ice crystals
formed in a cylindrical food model: Part 1. Freezing at atmospheric
pressure. J. Food Eng., 46, 277–285.
Cogne, C., Andreu, J., Laurent, P., Besson, A., and Nocquet, J. (2003).
Experimental data and modeling of thermal properties of ice cream. J.
Food Eng., 58, 331–341.
Cole, K. S. (1932). Electric phase angle of cell membranes. J. Gen.
Physiol., 15, 641–649.
Curry, M. R., Millar, J. D., and Watson, P. F. (1994). Calculated optimal
cooling rates for ram and human sperm cryopreservation fail to conform
with empirical observations. Biol. Reproduct., 51, 1014–1021.
Dejmek, P. and Miyawaki, O. (2002). Relationship between the electrical
and rheological properties of potato tissue after various forms of
processing. Biosci. Biotechnol. Biochem., 66, 1218–1223.
Desai, D. and Liang, T. (1977). Electrical impedance as an index of
macadamia nut ripeness. Trans. ASAE., 20, 444–449.
Deshpande, S.S., Bolin, H.R., and Salunkhe, D.K., (1982). Freeze
concentration of fruit juices. Food Technol. 36, 68–82.
DeVries, A. L., Komatsu, S. K., and Feeney, R. E. (1970). Chemical and
physical properties of freezing point-depressing glycoproteins from
Antarctic fishes. J. Biol. Chem., 245, 2901–2908.
Diller, K. R. and Bradley, D. A. (1984). Measurement of the water
permeability of single human granulocytes on a microscopic stopped-
flow mixing system. Trans. ASME, 106, 384–393.
Falk, S., Hertz, C. H., and Virgin, H. I. (1958). On the relation between
turgor pressure and tissue integrity. Physiol. Plant, 11, 802–817.
Feeney, R. E. and Yeh, Y. (1978). Antifreeze proteins from fish bloods.
Adv. Protein Chem., 32, 191–282.
Fennema, O. (1974). Reaction kinetics in partially frozen aqueous systems.
In “Water relations of foods,” ed. by R. B. Duckworth. Academic Press,
London, pp.539–556.
Ferro Fontan, C. and Chirife, J. (1981). The evaluation of water activity in
aqueous solutions from freezing point depression. J. Food Technol., 16,
21–30.
Flesland. O. (1995). Freeze concentration by layer crystallization. Dry.
Technol., 13, 1713–1739.
Fletcher, N. H. (1970). “The chemical physics of ice.” Cambridge
University Press, Cambridge.
Franks, F., Darlington, J., Schenz, T., Mathias, S. F., Slade, L., and Levine,
H. (1987). Antifreeze activity of Antarctic fish glycoprotein and a
synthetic polymer. Nature, 325, 146–147.
Fuchigami, M., Teramoto, A., and Ogawa, N. (1998). Structural and
textural quality of kinu-tofu frozen-then-thawed at high pressure. J. Food
Sci., 63, 1054–1057.
Garrote, R. L. and Bertone, R. A. (1989). Osmotic concentration at low
temperature of frozen strawberry halves. Effect of glycerol, glucose and
sucrose solutions on exudate loss during thawing. Lebens. Wiss.

O. Miyawaki18
Technol., 22, 264–267.
Gu, X., Suzuki, T., and Miyawaki, O. (2005). Limiting partition coefficient
in progressive freeze-concentration, J. Food Sci., 70, E546–551.
Gunathilake, M. Shimmura, K., Dozen, M., and Miyawaki, O. (2014a)
Flavor retention in progressive freeze-concentration for concentration of
coffee extract and pear (La France) juice flavor concentrate., Food Sci.
Technol. Res., 20, 547–554.
Gunathilake, M., Dozen, M., Shimmura, K., and Miyawaki, O. (2014b) An
apparatus for partial ice-melting to improve yield in progressive freeze-
concentration., J. Food Eng., 142, 64–69.
Gupta, R. and Deswal, R. (2014). Antifreeze proteins enable plants to
survive in freezing conditions. J. Biosci., 39, 931–944.
Hagiwara, T., Mao, J., Suzuki, T., and Takai, R. (2005). Ice recrystallization
in sucrose solutions stored in a temperature range of –21℃ to –50℃. Food
Sci. Technol. Res., 11, 407–411.
Hallettt, J. and Mason, B. J. (1958). The influence of temperature and
supersaturation on the habit of ice crystals grown from the vapour. Proc.
Roy. Soc. London, A247, 440–453.
Hanazawa, T., Ishikawa, E., and Miyawaki, O. (1988). Water permeability
of plasma membrane of various cells measured by dielectric method.
Cryobiol. Cryotechnol. (Teion Seibutu Kogaku Kaishi), 44, 38–40 (in
Japanese).
Hashizume, K., Kakiuchi, K., Koyama, E., and Watanabe, T. (1971).
Denaturation of soybean protein by freezing. Agric. Biol. Chem., 35,
449–459.
Hatley, R.H.M., Franks, F., and Day, H. (1986). Subzero-temperature
preservation of reactive fluids in the undercooled state. II. The effect on
the oxidation of ascorbic acid of freeze concentration and undercooling.
Biophys. Chem., 24, 187–192.
Heldmann, D. R. (1974). Predicting the relationship between unfrozen
water fraction and temperature during food freezing using freezing point
depression. Trans. ASAE., 17, 63–66.
Hernandez, E., Raventos, M., Auleda, J.M., and Ibarz A. (2009).
Concentration of apple and pear juices in a multi-plate freeze
concentrator. Innov. Food Sci. Emerg. Technol., 10, 348–355.
Hernandez, E., Raventos, M., Auleda, J.M., and Ibarz A. (2010). Freeze
concentration of must in a pilot plant falling film cryoconcentrator.
Innov. Food Sci. Emerg.Technol. 11, 130–136.
Herskovits, T. T. and Kelly, T. M. (1973). Viscosity studies of aqueous
solutions of alcohols, ureas, and amides. J. Phys. Chem., 77, 381–388.
Hildebrand, J. H. and Scott, R. L. (1962). “Regular solutions”, p.20,
Prentice Hall, Englewood Cliffs, N.J.
Huige, N.J.J. and Thijssen, H.A.C. (1972). Production of large crystals by
continuous ripening in a stirrer tank. J. Cryst. Growth, 13/14, 483–487.
Ishikawa, E., Bae, S.-K., Miyawaki, O., Nakamura, K., Shiinoki, Y., and
Ito, K. (1997a). Freezing injury of cultured rice cell analyzed by
dielectric measurement. J. Ferment. Bioeng., 83, 222–226.
Ishikawa, E., Miyawaki, O., and Nakamura, K. (1997b).Water permeability
of plasma membranes of cultured rice, grape, and CH27 cells measured
dielectrically. Biosci. Biotech. Biochem., 61, 1826–1830.
Johnson, W.E. (1993). The story of freeze desalting. Desalin. Water Reuse,
3, 20–27.
Kato, K. (1988). Nondestructive measurement of fruits quality by electrical
impedance (Part 1). J. Jpn. Soc. Agric. Machin. (Nougyou Kikai
Gakkaishi), 50, 99–107 (in Japanese).
Khawaji, A.D., Kutubkhanah, I.K., and Wie, J.M. (2008). Advances in
seawater desalination technologies. Desalin., 221, 47–69.
Kitazawa, H., Kawai, Y., Yamazaki, K., Inoue, N., and Shinano, H. (1997).
Aggregation of actin and myosin in carp myofibrils during frozen storage
under phosphate buffer conditions. Fisher. Sci., 63, 635–638.
Kobayashi, R., Kimizuka, N., Watanabe, M., and Suzuki, T. (2015). The
effect of supercooling on ice structure in tuna meat observed by using
X-ray computed tomography. Intern. J. Refrig., 60, 270–277.
Kozak, J. J., Knight, W. S., and Kauzmann, W. (1968). Solute-solute
interactions in aqueous solutions. J. Chem. Phys., 48, 675–690.
Lazar, M. E., Chapin, E. O., and Smith, G. S. (1961). Dehydrofrozen
apples: recent developments in processing methods. Food Technol., 14,
32–36.
Lerici, C. R., Piva, M., and Dalla Rosa, M. (1983). Water activity and
freezing point depression of aqueous solutions and liquid foods. J. Food
Sci., 48, 1667–1669.
Lilley, T. H. (1987). Criticism of a proposed corrected form of the Ross
equation and a suggested extension of the equation. Intern. J. Food Sci.
Technol., 22, 563–567.
Lindow, S. E., Arny, D. C., and Upper, C. D. (1978). Distribution of ice
nucleation-active bacteria on plants in nature. Appl. Environ. Microbiol.,
36, 831–838.
Liu, C., Benson, C. T., Gao, D., Haag, B. W., McGann, L. E., and Crister, J.
K. (1995). Water permeability and its activation energy for individual
hamster pancreatic cells. Cryobiolgy, 32, 493–502.
Liu, L., Miyawaki, O., and Nakamura, K. (1997). Progressive freeze-
concentration of model liquid food. Food Sci. Technol. Intern. Tokyo, 3,
348–352.
Liu, L., Fujii, T., Hayakawa, K., and Miyawaki, O. (1998). Prevention of
initial supercooling in progressive freeze-concentration, Biosci. Biotech.
Biochem., 62, 2467–2469.
Liu, L., Miyawaki, O., and Hayakawa, K. (1999). Progressive freeze-
concentration of tomato juice. Food Sci. Tech. Intern. Tokyo, 5, 108–112
(1999).
Maki, L. R., Galyan, E. L., Chien, M. M. C., and Caldwell, D. R. (1974).
Ice nucleation induced by Pseudomonas syringae. Appl. Microbiol., 28,
456–459.
Mandri, Y., Rich, A., Mangin, D., Abderafi, S., Bebon, C., Semlali, N.,
Klein, J.P., Bounahmidi, T., and Bouhaouss, A. (2011). Parametric study
of the sweating step in the seawater desalination process by indirect
freezing. Desalin., 269, 142–147.
Martino, M. N. and Zaritzky, N. E. (1988). Ice crystal size modifications
during frozen beef storage. J. Food Sci., 53, 1631–1637.
Matthews, J.S. and Coggeshall, N.D. (1959). Concentration of impurities
from organic compounds by progressive freezing. Anal. Chem., 31,
1124–1125.
Miyawaki, O., Abe, T., and Yano, T. (1992). Freezing and ice structure

Water and Freezing in Food 19
formed in protein gels. Biosci. Biotech. Biochem., 56, 953–957.
Miyawaki, O. and Pongsawatmanit, R. (1994). Mathematical analysis of the
effective thermal conductivity of food materials in the frozen state.
Biosci. Biotech. Biochem., 58, 1222–1225.
Miyawaki, O., Saito, A., Matsuo, T., and Nakamura, K. (1997). Activity
and activity coefficient of water in aqueous solutions and their
relationship with solution structure parameters. Biosci. Biotech.
Biochem., 61, 466–469.
Miyawaki, O., Liu, L., and Nakamura, K. (1998). Effective partition
constant of solute between solid and liquid phases in progressive freeze-
concentration, J. Food Sci., 63, 756–758.
Miyawaki, O. (1998). Thermal properties of food. Japan J. Thermophys.
Ptopert. (Netsu Bussei), 12, 211–216 (in Japanese).
Miyawaki, O. and Shimiya, Y. (2002). Freezing-thawing dehydration of
food waste. Kagaku Kogaku Ronbunshu., 28, 618–620 (in Japanese).
Miyawaki, O., Norimatsu, Y., Kumagai, H., Irimoto, Y., Kumagai, H., and
Sakurai, H. (2003). Effect of water potential on sol-gel transition and
intermolecular interaction of gelatin near the transition temperature.
Biopolymers, 70, 482–491.
Miyawaki, O., Fujii, T., and Shimiya, T. (2005a). Analysis of ice structure
formed in frozen agar gel, Food Sci. Technol. Res., 10, 1–5.
Miyawaki, O., Liu, L., Shirai, Y., Sakashita, S., and Kagitani, K. (2005b).
Tubular ice system for scale-up of progressive freeze-concentration, J.
Food Eng, 69, 107–113.
Miyawaki, O. (2007) Hydration state change of proteins upon unfolding in
sugar solutions. Biochim. Biophys. Acta-Proteins & Proteomics, 1774,
928–935.
Miyawaki, O. (2009). Thermodynamic analysis of protein unfolding in
aqueous solutions as a multisite reaction of protein with water and solute
molecules, Biophys. Chem., 144, 46–52.
Miyawaki, O., Kato, S., and Watabe, K. (2012). Yield improvement in
progressive freeze-concentration by partial melting of ice. J. Food Eng.,
108, 377–382.
Miyawaki, O., Dozen, M., and Nomura, K. (2014). Thermodynamic
analysis of osmolyte effect on thermal stability of ribonuclease A in
terms of water activity. Biophys. Chem., 185, 19–24.
Miyawaki, O., Omote, C., and Matsuhira, K. (2015). Thermodynamic
analysis of sol-gel transition of gelatin in terms of water activity in
various solutions. Biopolymers, 103, 685–691.
Miyawaki, O. and Nishino, H. (2016). Kinetic analysis of freeze
denaturation of soyprotein by a generalized theoretical model for freeze-
acceleration reaction. J. Food Eng., 190, 109–115.
Miyawaki, O., Gunathilake, M., Omote, C., Koyanagi, T., Sasaki, T., Take,
H., Matsuda, A., Ishisaki, K., Miwa, S., and Kitano, S. (2016a)
Progressive freeze-concentration of apple juice and its application to
produce a new type apple wine. J. Food Eng., 171, 153–158.
Miyawaki, O., Omote, C., Gunathilake, M., Ishisaki, K., Miwa, S., Tagami,
A., and Kitano, S. (2016b). Integrated system of progressive freeze-
concentration combined with partial ice melting for yield improvement.
J. Food Eng., 184, 38–43.
Miyawaki, O., Omote, C., Koyanagi, T., Sasaki, T., Take, H., Matsuda, A.,
and Kitano, S. (2017a). Progressive freeze-concentration of Japanese
sake. J. Jap. Soc. Food Sci. Technol. (Nippon Shokuhinn Kagaku Kogaku
Kaishi), 64, 98–101 (in Japanese).
Miyawaki, O., Omote, C., Koyanagi, T., Sasaki, T., Take, H., Matsuda, A.,
Tadokoro, K., Miwa, S., and Kitano, S. (2017b). Progressive freeze-
concentration of pineapple juice and its application to wine production. J.
Jap. Soc. Food Sci. Technol. (Nippon Shokuhinn Kagaku Kogaku
Kaishi), 64, 256–262 (in Japanese).
Miyawaki, O., Omote, C., Koyanagi, T., Sasaki, T., Take, H., Matsuda, A.,
Tadokoro, K., Miwa, S., and Kitano, S. (2017c). Progressive freeze-
concentration of blueberry juice and its application to produce blueberry
wine. J. Japan Soc. Food Eng. (Nippon Shokuhin Kogaku Kaishi), 18,
45–51 (in Japanese).
Moreno, F.L., Robles, C.M., Sarmiento, Z., Ruiz, Y., and Pardo, J.M.
(2013). Effect of separation and thawing mode on block freeze-
concentration of coffee brews. Food Bioprod. Process., 91, 396–402.
Moreno, F.L., Raventos, M., Hernandez, E., and Ruiz, Y. (2014). Block
freeze-concentration of coffee extract: Effect of freezing and thawing
stages on solute recovery and bioactive compounds. J. Food Eng., 120,
158–166.
Mossel, D. A. A. (1971). Physiological and metabolic attributes of
microbial groups associated with foods. J. Appl. Bact., 34, 95–118.
Moy, J. H., Lau, N. B. H., and Dollar, A. M. (1987). Effects of sucrose and
acids on osmovac-dehydration of tropical fruits. J. Food Process.
Preserv., 2, 131–135.
Moyano, P. C., Vega, R. E., Bunger, A., Garreton, J., and Osorio, F. A.
(2002). Effect of combined processes of osmotic dehydration and
freezing on papaya preservation. Food Sci. Technol. Inst., 8, 295–301.
Muller, J. G. (1967). Freeze concentration of food liquids: Theory, practice,
and economics. Food Technol., 21, 49–61.
Nakagawa, K., Maebashi, S., and Maeda, K. (2009). Concentration of
aqueous dye solution by freezing and thawing. Can. J. Chem. Eng., 87,
779–787.
Nakagawa, K., Maebashi, S., and Maeda, K. (2010a). Freeze-thawing as a
path to concentrate aqueous solution. Separat. Purif. Technol., 73, 403–
408.
Nakagawa, K., Nagahama, H., Maebashi, S., and Maeda, K. (2010b).
Usefulness of solute elution from frozen matrix for freeze-concentration
technique. Chem. Eng. Res. Desig., 88, 718–724.
Nakaya, U. (1954). “Snow crystals: Natural and artificial.” Harvard Univ.
Press., Cambridge, Mass.
Ohnishi, S., Fujii, T., and Miyawaki, O. (2002). Electrical and rheological
analysis of freezing injury of agricultural products. Intern. J. Food
Propert., 5, 317–332.
Ohnishi, S., Fujii, T., and Miyawaki, O. (2003). Freezing injury and
rheological properties of agricultural products. Food Sci. Tech. Res., 9,
367–371.
Ohnish, S., Shimiya, Y., Kumagai, H., and Miyawaki, O. (2004). Effect of
freezing on electrical and rheological properties of food materials. Food
Sci. Technol. Res., 10, 453–459.
Ohnishi, S. and Miyawaki, O. (2005). Osmotic dehydrofreezing for
O. Miyawaki20
protection of rheological properties of agricultural products from
freezing injury, Food Sci. Technol. Res., 11, 52–58.
Pham, Q. T. (1987). Calculation of bound water in frozen food. J. Food
Sci., 52, 210–212.
Pham, Q. T. and Willix, J. (1989). Thermak conductivity of fresh lamb
meat, offals and fat in the range –40 to +30℃: Measurements and
corrections. J. Food Sci., 54, 508–515.
Pongsawatmanit, R., Miyawaki, O., and Yano, T. (1993a). Measurement of
the thermal conductivity of unfrozen and frozen food materials by a
steady state method with coaxial dual-cylinder apparatus. Biosci.
Biotech. Biochem., 57, 1072–1076.
Pongsawatmanit, R. and Miyawaki, O. (1993b). Measurement of
temperature-dependent ice fraction in frozen foods. Biosci. Biotech.
Biochem., 57, 1650–1654.
Ponting, J. D., Watters, G. G., Forrey, R. R., Jackson, R., and Stanley, W. L.
(1966). Osmotic dehydration of fruits. Food Technol., 20, 125–128.
Poulsen, K.P. and Lindelov, F. (1981). Acceleration of chemical reactions
due to freezing. In “Water activity: Influences on food quality” ed by
L.B. Rockland and G.F. Stewart. Academic Press, New York, pp.651–
678.
Pradipasena, P., Tattiakul, J., Nakamuta, K., and Miyawaki, O. (2007).
Temperature dependence of fraction of frozen water in solutions of
glucose and its oligomers, dextrans, and potato starch. Food Sci. Tech.
Res., 13, 286–290.
Pradistsuwana, C., Theprugsa, P., and Miyawaki, O. (2003). Measurement
of limiting partition coefficient in progressive freeze-concentration. Food
Sci. Technol. Res., 9, 190–192.
Reid, D. S. (1980). Cryomicroscope studies of the freezing process in tissue
and model systems. Intern. J. Refrig., 3, 226–228.
Renaud, T., Briery, P., Andrieu, J., and Laurent, M. (1992). Thermal
properties of model foods in the frozen state. J. Food Eng., 15, 83–97.
Rich, A., Mandri, Y., Mangin, D., Rivoire, A., Abderafi, S., Bebon, C.,
Semlali, N., Klein, J.P., Bounahmidi, T., Bouhaouss, A., and Veesler, S.
(2012). Sea water desalination by dynamic layer melt crystallization:
Parametric study of the freezing and sweating steps. J. Cryst. Growth,
342, 110–116.
Riedel, L. (1956). Calorimetric investigation of the freezing of fish meat.
Kaltetechnik, 8, 374–377.
Riedel, L. (1957a). Calorimetric investigation of the meat freezing process.
Kaltetechnik, 9, 38–40.
Riedel, L. (1957b). Calorimetric investigation of the freezing of egg white
and york. Kaltetechnik, 9, 342–345.
Riedel, L. (1960). A test substance for freezing experiments. Kaltetechnik,
12, 222–225.
Robinson, R. A. and Stokes, R. H. (1961). Activity coefficients in aqueous
solutions of sucrose, mannitol and their mixtures at 25o. J. Phys. Chem.,
65, 1954–1958.
Ross, K. D. (1975). Estimation of water activity in intermediate moisture
food. Food Technol., 29, 26–34.
Sanchez, J., Ruiz, Y., Raventos, M., Auleda, J.M., and Hernandez, E.
(2010). Progressive freeze concentration of orange juice in a pilot plant
falling film. Innov. Food Sci. Emerg. Technol., 11, 644–651.
Sanchez, J., Hernandez, E., Auleda, J.M., and Raventos, M. (2011). Freeze
concentration of whey in a falling-film based pilot plant: Process and
characterization. J. Food Eng., 103, 147–155.
Sato, Y., Kawabuchi, S., Irimoto, Y., and Miyawaki, O. (2004). Effect of
water activity and solvent-ordering on intermolecular interaction of high
mothoxyl pectins in various sugar solutions. Food Hydrocolloids, 18,
527–534.
Sato, Y. and Miyawaki, O. (2016). Analysis of hydration parameter for
sugars determined from viscosity and its relationship with solution
parameters, Food Chem., 190, 594–598.
Schwartzberg, H. G. (1976). Effective heat capacities for the freezing and
thawing of food. J. Food Sci., 41, 152–156.
Scott, W. J. (1957). Water relations of food spoilage microorganisms. Adv.
Food Res., 7, 83–127.
Shapiro, J. (1961). Freezing-out, a safe technique for concentration of dilute
solutions. Science, 133, 2063–2064.
Shija, R., Sunderland, V.B., and McDonald, C. (1992). Alkaline hydrolysis
of methyl, ethyl and n-propyl 4-hydroxybenzoate esters in the liquid and
frozen states. Intern. J. Pharm., 80, 203–211.
Sidel, V. W. and Solomon, A. K. (1957). Entrance of water into human red
cells under an osmotic pressure gradient. J. Gen. Physiol. 41, 243–257.
Soc. Chemical Engineers Japan (1988). “Handbook of chemical engineering
(Kagaku-Kogaku-Binran).” 5th ed., Maruzen, Tokyo (in Japanese).
Sone, H., Omote, C., and Miyawaki, O. (2015). Effect of intermolecular
interactions on water activity of multicomponent aqueous solutions.,
Japan J. Food Eng., 16, 55–59.
Sotelo, C. and Mackie, I.M. (1993). The effect of formaldehyde on the
aggregation behavior of bovine serum albumin during storage in the
frozen and unfrozen states in the presence and absence of cryoprotectants
and other low molecular weight hydrophilic compounds. Food Chem.,
47, 263–270.
Starzak, M. and Mathlouthi, M. (2006). Temperature dependence of water
activity in aqueous solutions of sucrose. Food Chem., 96, 346–370.
Suevre, A. M. and Mathlouti, M. (2010). Solutions properties and solute-
solvent interactions in ternary sugar-salt-water solutions. Food Chem.,
122, 232–238.
Sugiyama, J., Hayashi, T., and Horiuchi, H. (1987). Electrical impedance of
kiwi fruits. J. Jap. Soc. Food Sci. Technol. (Nippon Shokuhinn Kogyo
Gakkaishi), 34, 725–730 (in Japanese).
Takenaka, N., Ueda, A., and Maeda, Y. (1992). Acceleration of the rate of
nitrite oxidation by freezing in aqueous solution. Nature, 358, 736–738.
Talens, P., Escriche, I., Martinez-Navarrete, N., and Chiralt, A. (2003).
Influence of osmotic dehydration and freezing on the volatile profile of
kiwi fruit. Food Res. Int., 36, 635–642.
Tanford, C. (1969). Extension of the theory of linked functions to
incorporate the effects of protein hydration. J. Mol. Biol. 39, 539–544.
Tregunno, N. B. and Goff, H. D. (1996). Osmodehydrofreezing of apple:
structural and textural effects. Food Res. Int., 29, 471–479.
Troller, J. A. and Christian, J. H. B. (1978). “Water activity and food.”
Academic Press, New York.
Water and Freezing in Food 21
Ustun, N. S. and Turhan, S. (2015). Antifreeze proteins: Characteristics,
function, mechanism of action, sources and application to foods. J. Food
Process. Preserv., 39, 3189–3197.
Watanabe, A., Miyawaki, O., Watanabe, M., and Suzuki, T. (2013).
Mechanism of solute incorporation into ice phase in progressive freeze-
concentration. J. Japan Soc. Food Eng. (Nippon Shokuhin Kogaku
Kaishi), 14, 163–168 (in Japanese).
Weaver, G. M. and Jackson, H. O. (1966). Electric impedance, an objective
index of maturity in peach. Can. J. Plant Sci., 46, 323–326.
Woinet, B., Andrieu, J., Laurent, M., and Min, S. G. (1998). Experimental
and theoretical study os model food freezing. Part 2. Characterization
and modeling of ice crystal size. J. Food Eng., 35, 395–407.
Yamasaki, N., Hatakeyama, T., and Funatsu, G. (1988). Denaturation of
ricin D in frozen aqueous solutions. Agric. Biol. Chem., 52, 2547–2553.
Yee, P.L., Wakisaka, M., Shirai, Y., and Hassan, M.A. (2003). Effects of
single food components on freeze concentration by freezing and thawing
technique. Jap. J. Food Eng., 4, 77–82.
Yee, P.L., Wakisaka, M., Shirai, and Y., Hassan, M.A. (2004). Effect of
sodium chloride on freeze concentration of food components by freezing
and thawing technique. Jap. J. Food Eng. 5, 97–102.
Zhang, M. I. N. and Willison, J. H. M. (1992a). Electrical impedance
analysis in plant tissues: in vivo detection of freezing injury. Can. J. Bot.
70, 2254–2258.
Zhang, M. I. N. and Willison, J. H. M. (1992b). Electrical impedance
analysis in plant tissues: The effect of freeze-thaw injury on the electrical
properties of potato tuber and carrot root tissues. Can. J. Plant Sci., 72,
545–553.
Zhao, H. (2006). Viscosity B-coefficients and standard partial molar
volumes of amino acids, and their roles in interpreting the protein
(enzyme) stabilization. Biophys. Chem., 122, 157–183.
Zhu, S., Le Bail, A., Ramaswamy, H. S., and Chapleau, N. (2004).
Characterization of ice crystals in pork muscle formed by pressure-shift
freezing as compared with classical freezing methods. J. Food Sci., 69,
FEP190–197.