review using airborne lidar to predict leaf area index in · pdf file ·...
TRANSCRIPT

ARTICLE IN PRESS
Journal of AridEnvironments
0140-1963/$ -
doi:10.1016/j
�CorrespoE-mail ad
Journal of Arid Environments 72 (2008) 1–15
www.elsevier.com/locate/jaridenv
Review
Using airborne lidar to predict Leaf Area Index in cottonwoodtrees and refine riparian water-use estimates
A. Farida,�, D.C. Goodrichb, R. Bryantb, S. Sorooshianc
aDepartment of Hydrology and Water Resources, University of Arizona, Tucson, AZ 85721, USAbUSDA-ARS-SWRC, Southwest Watershed Research Center, Tucson, AZ, USA
cDepartment of Civil and Environmental Engineering, University of California, Irvine, CA, USA
Received 26 April 2006; received in revised form 12 March 2007; accepted 24 April 2007
Available online 6 June 2007
Abstract
Estimation of riparian forest structural attributes, such as the Leaf Area Index (LAI), is an important step in identifying
the amount of water use in riparian forest areas. In this study, small-footprint lidar data were used to estimate biophysical
properties of young, mature, and old cottonwood trees in the Upper San Pedro River Basin, Arizona, USA. Canopy height
and maximum and mean laser heights were derived for the cottonwood trees from lidar data. Linear regression models
were used to develop equations relating lidar height metrics with corresponding field-measured LAI for each age class of
cottonwoods. Four metrics (tree height, height of median energy, ground return ratio, and canopy return ratio) were
derived by synthetically constructing a large-footprint lidar waveform from small-footprint lidar data which were
compared to ground-based high-resolution Intelligent Laser Ranging and Imaging System (ILRIS) scanner images. These
four metrics were incorporated into a stepwise regression procedure to predict field-derived LAI for different age classes of
cottonwoods. This research applied the Penman–Monteith model to estimate transpiration of the cottonwoods using lidar-
derived canopy metrics. These transpiration estimates compared very well to ground-based sap flux transpiration estimates
indicating lidar-derived LAI can be used to improve riparian cottonwood water-use estimates.
r 2007 Elsevier Ltd. All rights reserved.
Keywords: Cottonwood; Leaf Area Index; Lidar; Riparian; San Pedro River Basin
Contents
1. Introduction . . . . . . . . . . . . . . . . . . . . . . . . . . . . . . . . . . . . . . . . . . . . . . . . . . . . . . . . . . . . . . . . . . . . . . . 2
2. Study sites . . . . . . . . . . . . . . . . . . . . . . . . . . . . . . . . . . . . . . . . . . . . . . . . . . . . . . . . . . . . . . . . . . . . . . . . 3
3. Data acquisition . . . . . . . . . . . . . . . . . . . . . . . . . . . . . . . . . . . . . . . . . . . . . . . . . . . . . . . . . . . . . . . . . . . . 4
3.1. Ground inventory data . . . . . . . . . . . . . . . . . . . . . . . . . . . . . . . . . . . . . . . . . . . . . . . . . . . . . . . . . . . 4
3.2. Lidar data sets . . . . . . . . . . . . . . . . . . . . . . . . . . . . . . . . . . . . . . . . . . . . . . . . . . . . . . . . . . . . . . . . . 5
.
n
d
3.2.1. Ground-based laser scanner. . . . . . . . . . . . . . . . . . . . . . . . . . . . . . . . . . . . . . . . . . . . . . . . . . 5
see front matter r 2007 Elsevier Ltd. All rights reserved.
jaridenv.2007.04.010
ding author. Tel.: +1520 891 0735; fax: +1 520 626 4479.
ress: [email protected] (A. Farid).

ARTICLE IN PRESSA. Farid et al. / Journal of Arid Environments 72 (2008) 1–152
4. Analysis . . . . . . . . . . . . . . . . . . . . . . . . . . . . . . . . . . . . . . . . . . . . . . . . . . . . . . . . . . . . . . . . . . . . . . . . . . 6
4.1. Modeling a return waveform and comparing with ground-based laser scanner . . . . . . . . . . . . . . . . . . . . 6
4.2. Estimation of LAI from lidar data . . . . . . . . . . . . . . . . . . . . . . . . . . . . . . . . . . . . . . . . . . . . . . . . . . . 7
4.2.1. The relationship between LAI and various laser height metrics . . . . . . . . . . . . . . . . . . . . . . . . . 7
4.2.2. Estimation of LAI from synthetic lidar full waveforms . . . . . . . . . . . . . . . . . . . . . . . . . . . . . . 9
4.3. Estimation of cottonwood transpiration from lidar data. . . . . . . . . . . . . . . . . . . . . . . . . . . . . . . . . . . 11
5. Conclusions . . . . . . . . . . . . . . . . . . . . . . . . . . . . . . . . . . . . . . . . . . . . . . . . . . . . . . . . . . . . . . . . . . . . . . 13
Acknowledgments . . . . . . . . . . . . . . . . . . . . . . . . . . . . . . . . . . . . . . . . . . . . . . . . . . . . . . . . . . . . . . . . . . 14
References . . . . . . . . . . . . . . . . . . . . . . . . . . . . . . . . . . . . . . . . . . . . . . . . . . . . . . . . . . . . . . . . . . . . . . . 14
1. Introduction
Vegetation patterns and associated canopy structure influence landscape functions such as water use,biomass production, and energy cycles. The properties of vegetation and canopy must be quantified in orderto understand their roles in landscapes and before management plans can be developed for the purpose ofconserving natural resources. In arid and semi-arid regions, with high potential evaporative demand, thepresence of perennial flow and verdant riparian corridors can constitute a major source of water use (net loss)in overall basin water budgets (US Dept. of Interior, 2006). The net loss of basin water resources from riparianevaporation and transpiration is a critical boundary condition for regional groundwater models, which isnecessary for overall basin water management. However, basin-level riparian water use is difficult to estimatewith standard micro-meteorological techniques due to the often narrow, non-uniform corridors, which violatethe necessary fetch requirements of many of these systems (Goodrich et al., 2000). The narrow, non-uniformnature of typical riparian corridors also makes rapid measurement of critical canopy parameters for riparianevapotranspiration estimates, such as Leaf Area Index (LAI), difficult and time consuming. Remote sensingoffers approaches to overcome some of these limitations and uncertainties. In particular, multi-return airbornelidar can provide the capability to identify riparian tree species (Farid et al., 2006a) and age and canopycharacteristics (Farid et al., 2006b).
Recent progress in three-dimensional forest characterization at the stand level mainly includes digitalstereophotogrammetry, synthetic aperture radar, and lidar (light detecting and ranging). Lidar is a techniquein which light at high frequencies, typically in the infrared wavelengths, is used to measure the range between asensor and a target, based on the round trip travel time between source and target. Airborne Laser Scanning isa measurement system in which pulses of light (most commonly produced by a laser) are emitted from aninstrument mounted in an aircraft and directed to the ground in a scanning pattern. This method of recordingthe travel time of the returning pulse is referred to as pulse ranging (Wehr and Lohr, 1999). The type ofinformation collected from this returning pulse distinguishes two broad categories of lidar sensors: discrete-return (small-footprint) lidar devices and full-waveform (large-footprint) recording devices. Discrete-returnsystems typically allow for one (e.g., first or last), two (e.g., first and last), or a few (e.g., five) returns to berecorded for each pulse during flight. Conversely, a full-waveform lidar system senses and records the amountof energy returned to the sensor for a series of equal time intervals. The number of recording intervalsdetermines the level of detail present in a laser footprint. For forested environments, the result is a waveformindicative of the forest structure (i.e., from the top of the canopy, through the crown volume and understorylayer, and finally to the ground surface). The footprint for most discrete-return systems is on the order of0.2–0.9m. For full-waveform systems, the footprint size may vary from 8 to 70m (Means et al., 1999).
Previous studies model full-waveform characteristics for simple, unvegetated terrain (Gardner, 1992), andfor one-dimensional surfaces (Abshire et al., 1994).
Additionally, Blair and Hofton (1999) demonstrated that vertical distribution of the discrete-return data isclosely related to the full-waveforms recorded by waveform-recording devices when certain conditions are met,the most important being a high density of samples collected using a very small footprint (on the orderof 25 cm).
The foundations of lidar forest measurements lie with photogrammetric techniques developed to assess treeheight, canopy density, forest volume, and biomass. Airborne laser measurements were used in place ofphotogrammetric measurements to estimate forest heights and canopy density (Nelson et al., 1984) and forest

ARTICLE IN PRESSA. Farid et al. / Journal of Arid Environments 72 (2008) 1–15 3
volume or biomass (Maclean and Krabill, 1986; Nelson et al., 1988a, b). For instance, Nelson et al. (1988b)predicted the volume and biomass of southern pine (Pinus taeda, P. elliotti, P. echinata, and P. palustris)forests using several estimates of canopy height and cover from small-footprint lidar, explaining between53% and 65% of the variance in field measurements of these variables.
The primary objective of this research was to use a small-footprint lidar to derive various height metrics(maximum laser height, mean laser height, and canopy height) and model full-waveform characteristics incottonwood trees in the San Pedro Riparian National Conservation Area (SPRNCA) in southeasternArizona, USA. The SPRNCA is a globally important migratory bird route. Its cottonwood riparian forestsupports a great diversity of species and is widely recognized as a regionally and globally important ecosystem(World Rivers Review, 1997). Additionally, lidar studies published at this point have shown success in severalforest types with large-footprint lidar, but applications of small-footprint lidar have not progressed as far(Means, 2000), being limited mainly to measuring even-aged coniferous stands. Thus, the performance of lidarin cottonwood riparian forests remains untested and any related analytical and processing issues are yet to beidentified.
The secondary objective of this study was to estimate LAI from various laser height metrics and syntheticlarge-footprint lidar waveform for different age classes of cottonwood trees. Additionally, this study appliedthe Penman–Monteith (P–M) model (Monteith and Unsworth, 1990) to estimate cottonwood transpirationusing lidar-derived LAI, compared with transpiration measured by sap flow. Riparian cottonwood trees usewater in proportion to their age and canopy shape (Schaeffer et al., 2000), and are especially large users ofwater in flood plains along rivers in semi-arid environments. More accurate quantification of riparian wateruse is required to manage basin water resources to maintain the economic, social, and ecological viability ofthese areas and ensure water for a growing human population in the basin. Cottonwoods of different agecannot be distinguished by multi-spectral methods. Because older cottonwoods exhibit a canopy that is morecrowned in shape than the younger trees, differences in tree shape as a function of tree age led us to investigatethe use of lidar to identify cottonwoods of different age classes and estimate LAI, both of which impact a tree’swater use.
The specific objectives of this study were:
(1)
Model a laser altimeter return waveform as the sum of reflections within a laser small footprint andcompare the results with ground-based Intelligent Laser Ranging and Imaging System (ILRIS) scannerimages in cottonwood trees.(2)
Derive maximum laser height, mean laser height, and canopy height from the small-footprint lidar dataand determine how well they can estimate LAI for different age classes of cottonwoods.(3)
Derive four metrics (canopy height, height of median energy (HOME), ground return ratio (GRND), andcanopy return ratio (CRND)) from synthetic lidar full waveform. These four metrics are incorporated intoa stepwise regression procedure to predict field-derived LAI for different age classes of cottonwood trees.(4)
Apply the P–M model to estimate transpiration of the cottonwoods using lidar-derived LAI and comparethe results with transpiration measured by sap flow techniques.Meanwhile, the analysis presented herein focuses on isolated trees to provide a ‘‘proof of concept’’ of thestated objectives for this less complex case.
2. Study sites
The three study sites are located on the floodplain of the San Pedro River within the SPRNCA insoutheastern Arizona, USA. The Escalante study site (311510N, 1101130W; 1110m elevation) is about 1.2 kmlong north to south and 1.4 km wide east to west and is relatively flat. The Escalante study site is located alongan intermittent reach of the river where the groundwater depth ranged from 4.3 to 4.5m. This study site wasused to estimate LAI from various laser height metrics and synthetic large-footprint lidar waveform fordifferent age classes of cottonwood trees. This study area is populated by young-to-old dense cottonwoodstands with patches of cottonwood riparian forest located along the stream channel.

ARTICLE IN PRESSA. Farid et al. / Journal of Arid Environments 72 (2008) 1–154
The Boquillas study site (311690N, 1101180W; 1180m elevation) is located along an intermittent reach of theriver where the groundwater depth ranged from 3.1 to 3.9m. In contrast, the Lewis Springs study site(311330N, 1101070W; 1250m elevation) is located along a perennially flowing reach of the San Pedro Riverwhere the groundwater depth ranged from 1.1 to 1.8m. These two additional sites were used to apply the P–Mmodel to estimate cottonwood transpiration using lidar-derived LAI, compared with transpiration measuredby sap flow for individual cottonwood trees within an isolated cluster of cottonwoods. The cottonwood treesat both sites were very similar in age and size characteristics.
The overstory for these three study sites is dominated by riparian forest vegetation, such as Fremontcottonwood (Populus fremontii), Goodding willow (Salix gooddingii), and velvet mesquite (Prosopis velutina)woodlands. The understory consists mainly of sacaton (Sporobolus wrightii) grassland and tamarisk (Tamarix
chinensis) in these three sites.
3. Data acquisition
3.1. Ground inventory data
Ground validation data were collected from April 2003 to October 2004. Three different ages ofcottonwood trees were included in the field sampling—young cottonwoods (less than 15 years), maturecottonwoods (16–50 years), and old cottonwoods (greater than 50 years) (Fig. 1). Stem diameters at breastheight (dbh) (diameter measured at 1.37m above the ground) were measured with a diameter tape andrecorded to the nearest mm to discriminate between young, mature, and old cottonwood patches, based onriver-specific equations that relate dbh to tree age (Stromberg, 1998). Dbh values varied, from less than 25 cmfor young cottonwoods, 25–90 cm for mature cottonwood stands, and greater than 90 cm for old cottonwoods.
A total of 41 cottonwood trees were used to determine LAI. Of the 41 cottonwoods, 9 old, 15 mature, and17 young isolated trees were selected that were at least 6m apart. A differential global positioning system(DGPS) was used to determine the location of each individual tree within sub-meter planimetric accuracy(5700 GPS, Trimble Navigation, Ltd., Sunnyvale, CA). We measured four points around each tree at the edgeof the tree canopy. In addition, all tree locations were determined using 60-s static measurements with a12-channel GPS receiver. The GPS antenna height varied between 1.8 and 3.6m, with an average height of 2.5m.All measurements were collected during the leaf-off season. The lack of canopy foliage and the raised antenna inthe old cottonwood stands reduced the error effects of forest canopies on GPS measurements. These trees wereidentified in the lidar data set by matching field DGPS locations with the georeferenced lidar data.
The LAI was measured using a plant canopy analyzer (LAI 2000, Li-Cor, Inc., Lincoln, NE) in June 2003for different age classes of cottonwoods. LAI readings were taken from the four cardinal directions around thebase of each cottonwood tree by one sensor with a 901 view cap. The sensor was aligned along the canopy of
Fig. 1. Photos depicting (a) young, (b) mature, and (c) old cottonwood trees. Figure adapted from Farid et al. (2006b), with permission
from the Society of American Foresters.

ARTICLE IN PRESSA. Farid et al. / Journal of Arid Environments 72 (2008) 1–15 5
the tree, as well as across the canopy. Measurements were made after sunset at dusk, when the sky is stillilluminated, but after the direct beam radiation leaves the canopy.
In 2006, Gazal et al. measured sap flow of four cottonwood trees within an isolated cluster at each of thetwo study sites (Boquillas and Lewis Springs), using constant heat flow Granier-type probes (TDP-30 andTDP-80, Dynamax, Inc., Houston, TX).
Additionally, air temperature, relative humidity, solar radiation, wind speed, and air pressure weremeasured at nearby meteorological towers located 3 km from the Boquillas intermittent stream site and 0.3 kmfrom the Lewis Springs perennial stream site (Scott et al., 2000). For both perennial and intermittent streamsites, the measurements were recorded every 15 and 30min, respectively. Stand transpiration was estimated forthe period 1–11 June 2003 (DOY: 152-162), which corresponded to the timing of the lidar survey.
3.2. Lidar data sets
The Optech ALTM 1233 (Optech, Inc., Toronto, Canada) was used to survey the study site on June 6, 2003.Characteristics of the ALTM 1233 include a scanning frequency of 28Hz, a scan angle of 7201, a collectionmode of first and last returns, and intensity of returns from a 1064-nm laser. The ALTM 1233 was mounted ona University of Florida plane flying at 750m above the ground at a velocity of 60m s�1. The aircraft andALTM 1233 configuration resulted in a cross-track point spacing of 0.9m, a forward point spacing of 2.1m,and a footprint size of approximately 15 cm in diameter. The average ground swath width was 546m andthe entire study area was covered by four parallel flight lines. For the entire research area, 50% overlappingflight lines were used to ensure complete coverage, which generated approximately 2 million laser returns.The lidar data were processed and classified using the Optech REALM 3.0.3d software. Three data layerswere produced from the classification: (1) ground last return, (2) vegetation last return and (3) vegetationfirst return. The ground last return data layer was a robust representation of the terrain. For this study,vegetation last and vegetation first data layers were merged into a single vegetation class. The attributesof any given laser return not only include x, y, and z coordinate data but also an intensity return value (Faridet al., 2006a).
3.2.1. Ground-based laser scanner
The ground-based laser scanner acquired for the study site on June 2004, was the Intelligent Laser Rangingand Imaging System-Three-Dimensional (ILRIS-3D, Optech, Inc., Toronto, Canada), with a vertical accuracyof 0.3 cm. The laser scanner fires a focused laser at ground targets and measures the target position based onlaser travel time to the target and back to the sensor. The hit size is 1.5 cm in diameter at 50m from thescanner, which was the approximate distance. The laser scanner collects x, y, and z relative coordinates forevery 1.5 cm hit scanned for a complete three-dimensional image of the object. Distance between hits(resolution) was on average 0.2 cm. The resolution changes with distance between the target and the scanner.
Capturing an entire cottonwood tree canopy required two scans on opposite sides of the tree. If three sub-meter accuracy GPS points can be located within each scanned image, the images can easily be merged. Weplaced three large cardboard boxes in the foreground of each cottonwood tree that was to be scanned and thensecured a piece of rebar into the ground at the corner of each box. Fig. 2 shows the boxes in the foreground ofone old cottonwood tree as an example (two scans on opposite sides of the tree). These points on the groundwere then georeferenced with a DGPS at a later date. The corners of the boxes where the rebar was locatedallowed us to locate the georeferenced points in the scanned image. Then the x, y, and z coordinates of theimages were given UTM values and sea-level altitude values in meters. Unfortunately, due to our remotelocation which is covered by dense vegetation and the stream channel bank, only one scanned tree hadgeoreferenced points with enough accuracy for the images to be merged accurately into a full canopy. Theother trees had to be manually merged. Manually merging is a tedious process and only works if at least threecommon points can be located in each image that is to be merged. This limitation reduced the number of treeswith fully scanned canopies to five. Therefore, of the 24 old and mature cottonwoods, three old and twomature cottonwood trees were selected. No young trees were selected because their locations were neighboredby dense vegetation, and the river bank obstructed the laser scanning beams.

ARTICLE IN PRESS
Fig. 2. Cardboard boxes in the (a) foreground and (b) back part of one of the old cottonwood trees (two scans on opposite sides the tree).
A. Farid et al. / Journal of Arid Environments 72 (2008) 1–156
4. Analysis
This analysis will include a combination of both ground-based and airborne lidar data from 2003 and 2004.
4.1. Modeling a return waveform and comparing with ground-based laser scanner
Our model for a large-footprint lidar waveform is constructed under the assumption that the shape of anywaveform represents the vertical distribution of intercepted surfaces within a small footprint. We chose theaverage crown width of an old cottonwood tree for a synthetic waveform footprint as a starting point. Themodeled large-footprint lidar waveform is the sum of the reflections from different parts in the footprint thatvertically stacked the elevations produced by the small-footprint elevation data. Fig. 3a contains the three-dimensional distribution of small-footprint lidar data from within a 26m footprint centered on a treeapproximately 30m tall. Fig. 3b illustrates the distribution of these points as a function of height. A similartechnique was used by Blair and Hofton (1999), which demonstrated that vertical distribution of the small-footprint lidar data is closely related to the full waveforms recorded by waveform-recording devices in tropicalforests in Costa Rica. However, modeling of large-footprint return waveform in cottonwood riparian forestsremains untested and any related analytical and processing issues are yet to be identified. As in Blair andHofton’s (1999) study, we tested the similarity between each modeled waveform and the return waveformfrom the ILRIS scanner using Pearson correlation, r, given by r ¼ Sxy=
ffiffiffiffiffiffiffiffiffiffiffiffiffiffiSxxSyy
p, where Sxx, Syy, and Sxy are
the variances and shared variance of the ILRIS and synthetic waveforms. The waveform comparison utilized2004 airborne lidar and 2004 ground-based ILRIS data.
Fig. 4 plots five synthetic waveforms and corresponding ILRIS return waveforms. The results ofcomparison of the modeled waveform and the return waveform from ILRIS for old cottonwood trees arepresented in Fig. 4a–c. In this case, the highest r was 0.73 between the modeled and ILRIS waveforms. Fig. 4dand e contains the waveforms comparing modeled and ILRIS for mature cottonwoods. The highest r valueincreased from 0.73 to 0.75 when mature cottonwoods were considered. Simple, single modal waveforms aretypically returned from flat, unvegetated ground surfaces (Fig. 4a and e). The modeled and ILRIS waveformsfrom vegetated regions were multi-modal, each mode representing a vertically distinct, consolidated layerwithin the canopy.
Overall, the ground and airborne-based waveforms had a good degree of correlation. Although the modeledand ILRIS waveforms identify reflecting layers at the same elevations, the relative strengths of reflections fromthose layers varied; for instance, the modeled and ILRIS waveforms both detected a reflecting surface at

ARTICLE IN PRESS
5.7465
5.7466
5.7467
5.7468
x 105
3.5254
3.5254
3.5255
x 106
1100
1110
1120
1130
1140
Local Easting (m)
Local Northing (m)
Ele
vation (
m)
0 50 100 150 200 2501105
1110
1115
1120
1125
1130
1135
Number of Hits
Ele
vation (
m)
Fig. 3. Illustration of the potential for creating synthetic lidar waveforms from small-footprint lidar data. (a) shows the three-dimensional
distribution of small-footprint lidar data from within a 22m� 26m footprint. (b) shows the vertical distribution of these returns.
A. Farid et al. / Journal of Arid Environments 72 (2008) 1–15 7
�18m elevation, but the reflection was much stronger when measured by ILRIS, possibly a result of differenttree cover conditions at the time of the airborne and ILRIS surveys. The systematic difference noted betweenmodeled and ILRIS waveforms was the consistently higher amplitude of the canopy response in the ILRISreturn waveform (e.g. Fig. 4a). This difference is due to the first-return only nature of the ILRIS system, and adifferent view angle configuration between the airborne and ILRIS sensors. Also, a large gap through thecanopy along the beam path may result in reduction of the amplitude of the canopy response in the modeledreturn waveform using the airborne system. Furthermore, the ILRIS system presents difficulties in detectingthe uppermost portion of old cottonwood tree canopies because of the conical and flat-topped nature of thetree crown. However, the top portion of the crown may not be of sufficient area to register as a significantreflecting surface and therefore may not be detected well. Finally, the majority of modeled and ILRIS waveshapes have similar vertical structure in cottonwood trees.
4.2. Estimation of LAI from lidar data
4.2.1. The relationship between LAI and various laser height metrics
For each cottonwood tree, three laser height metrics were derived by all small-footprint lidar returns fromthe cottonwood canopy surface: (1) canopy height (hcanopy), (2) maximum laser height (Lzmax): the highest

ARTICLE IN PRESS
Fig. 4. ILRIS (solid line) and modeled (dashed line) waveforms for (a–c) old and (d–e) mature cottonwood trees. r is the Pearson
correlation coefficient.
A. Farid et al. / Journal of Arid Environments 72 (2008) 1–158
elevation of all lidar returns from canopy surface, and (3) mean laser height (Lzmean): the mean laser elevationderived from all lidar returns for a canopy surface. To derive any type of tree height measurement, a groundreference level must be established. The point data in ground-classified hits were kriged to produce a DigitalElevation Model (DEM) with a 0.5m pixel grid. The point data in vegetation-classified hits were interpolatedto a regular grid that corresponded to the DEM, thereby creating a canopy altitude model. The canopyaltitude model has a grid size of 0.5m. Fig. 5 shows the terrain and overlaid canopy altitude model for thestudy site. The local maximum technique was used to discriminate cottonwoods in the canopy altitude model(Farid et al., 2006b). It operates with two shapes of the search window, specifically a square n� n window anda circular window that is more appropriate for identifying tree crowns. Variable window sizes were used byWulder et al. (2000) for the extraction of tree locations and estimation of basal area from high spatialresolution imagery for stands of Douglas fir and western red cedar. The top of the tree was assumed to be thetallest point in the tree’s canopy altitude model. The base of the tree was taken to be the point on the DEMbeneath the top of the tree. Canopy height (hcanopy) was calculated by subtracting of the elevations of thebottom from the top of the tree.
Additionally, the derivation of two other laser height metrics is straightforward. The derivations of thesetwo laser height metrics were formulated as Eqs. (1) and (2).
Maximum laser height ðmÞ Lzmax ¼ maxðall_zhits_treeÞ, (1)
Mean laser height ðmÞ Lzmean ¼
Pni¼1tree_zhitðiÞ
n. (2)
Fig. 6a–c contains the scatterplots comparing field-measured LAI and lidar-derived canopy height for eachtype of cottonwood tree. In this case, the coefficients of determination for field LAI versus lidar canopyheights were 0.77, 0.75, and 0.63 for young, mature, and old, respectively (Po0.01). As noted above, the lidarsystem presents difficulties in detecting the uppermost portion of old cottonwood tree canopies because of theconical nature of the tree crown and the small area of the top portion of the crown. In addition, determining

ARTICLE IN PRESS
Fig. 5. Spatial pattern of DEMs (a) bare ground model and (b) canopy altitude model for the study site.
A. Farid et al. / Journal of Arid Environments 72 (2008) 1–15 9
the exact elevation of the ground surface poses difficulties for both old and mature cottonwoods because theunderstory is dense enough to substantially occlude the ground surface. The r2 increased from 0.63 to 0.77when young cottonwoods were considered. The actual ground terrain detected by lidar for young trees is moreaccurate and precise than those estimates for old and mature trees because the area beneath the young trees ispredominantly bare soil. The scatterplots comparing field-measured LAI and maximum laser height for eachage class of cottonwood trees are presented in Fig. 6d–f. The coefficient of determination for field LAI versusmaximum laser heights were 0.74, 0.73, and 0.67 for young, mature, and old, respectively (Po0.01). Thelowest r2 value was obtained for old cottonwoods for the reasons stated above.
The scatterplots comparing field-measured LAI and mean laser height for each age class of cottonwoods areshown in Fig. 6g–i. Results from regressing LAI and mean laser height on all age classes of cottonwoods didnot produce r2 values greater than 0.80, where the P-value was below the 0.05 significance level. Lzmean isaffected by canopy cover as demonstrated when Lzmean was used to estimate LAI, where the mean laser heightof an old cottonwood with high canopy cover was found to be dominated by the high number of laser returnsfrom the canopy surface. The lowest r2 value was obtained for young cottonwoods due to the presence of thegaps in young canopies which permitted a number of the laser pulses to penetrate the canopy, generating lowervalues for canopy cover. As a result, the Lzmean value is problematic in a regression model.
4.2.2. Estimation of LAI from synthetic lidar full waveforms
Four metrics were derived by synthetically constructing a large-footprint lidar waveform (see Fig. 7) fromthe airborne small-footprint lidar data for different age classes of cottonwoods. Lidar canopy height (LHT)

ARTICLE IN PRESS
Fig. 7. Metrics derived from synthetic large-footprint lidar waveforms. See text for discussion. These metrics were then used to estimate
LAI for different age classes of cottonwoods.
2.9 3 3.1 3.2 3.30
0.2
0.4
0.6
0.7
ln(canopy height)
ln(L
AI)
Old cottonwoods
R2: 0.63
2.6 2.8 3 3.20
0.4
0.8
1.2
ln(canopy height)
ln(L
AI)
Mature cottonwoods
R2: 0.75
1.8 2 2.2 2.4 2.6 2.80
0.4
0.8
1.2
1.6
ln(canopy height)
ln(L
AI)
Young cottonwoods
R2: 0.77
7.028 7.03 7.032 7.0340
0.2
0.4
0.6
0.7
ln(Lzmax)
ln(L
AI)
R2: 0.67
7.023 7.026 7.0290
0.4
0.8
1.2
ln(Lzmax)
ln(L
AI)
R2: 0.73
7.016 7.02 7.023 7.0270
0.4
0.8
1.2
1.6
ln(Lzmax)
ln(L
AI)
R2: 0.74
7.016 7.02 7.0240
0.2
0.4
0.6
0.7
ln(Lzmean)
ln(L
AI)
R2: 0.77
7.014 7.018 7.0220
0.4
0.8
1.2
ln(Lzmean)
ln(L
AI)
R2: 0.67
7.012 7.016 7.020
0.4
0.8
1.2
1.6
ln(Lzmean)
ln(L
AI)
R2: 0.62
Fig. 6. Linear least-squares fit between LAI and (a–c) canopy height, (d–f) Lzmax, and (g–i) Lzmean for each type of cottonwood tree on the
study region.
A. Farid et al. / Journal of Arid Environments 72 (2008) 1–1510
ARTICLE IN PRESS
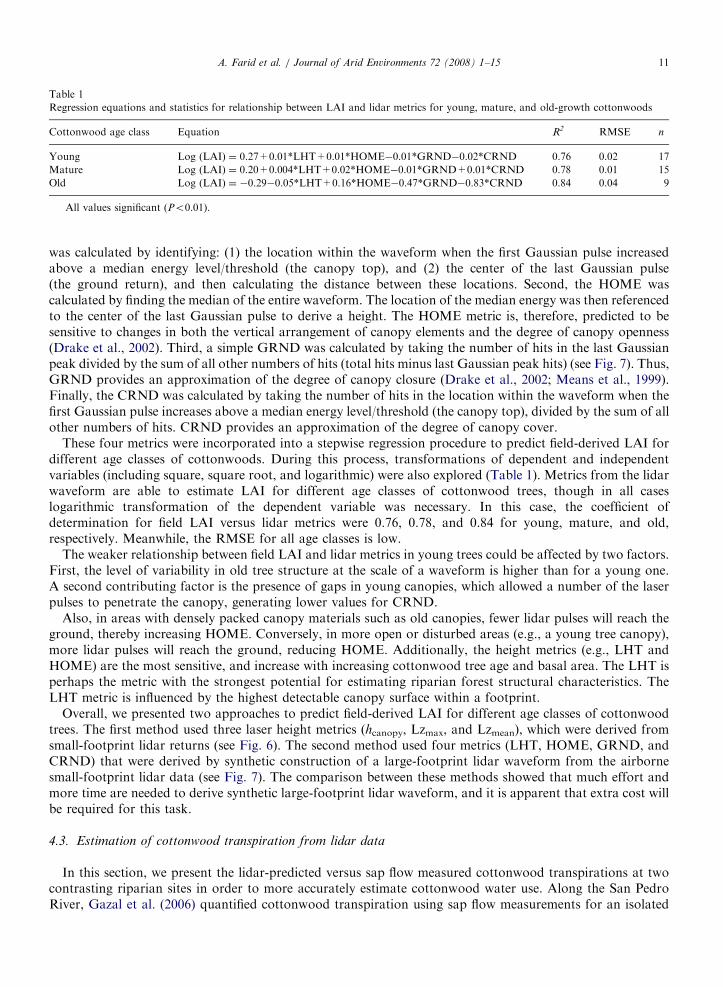
Table 1
Regression equations and statistics for relationship between LAI and lidar metrics for young, mature, and old-growth cottonwoods
Cottonwood age class Equation R2� RMSE n
Young Log (LAI) ¼ 0.27+0.01*LHT+0.01*HOME�0.01*GRND�0.02*CRND 0.76 0.02 17
Mature Log (LAI) ¼ 0.20+0.004*LHT+0.02*HOME�0.01*GRND+0.01*CRND 0.78 0.01 15
Old Log (LAI) ¼ �0.29�0.05*LHT+0.16*HOME�0.47*GRND�0.83*CRND 0.84 0.04 9
�All values significant (Po0.01).
A. Farid et al. / Journal of Arid Environments 72 (2008) 1–15 11
was calculated by identifying: (1) the location within the waveform when the first Gaussian pulse increasedabove a median energy level/threshold (the canopy top), and (2) the center of the last Gaussian pulse(the ground return), and then calculating the distance between these locations. Second, the HOME wascalculated by finding the median of the entire waveform. The location of the median energy was then referencedto the center of the last Gaussian pulse to derive a height. The HOME metric is, therefore, predicted to besensitive to changes in both the vertical arrangement of canopy elements and the degree of canopy openness(Drake et al., 2002). Third, a simple GRND was calculated by taking the number of hits in the last Gaussianpeak divided by the sum of all other numbers of hits (total hits minus last Gaussian peak hits) (see Fig. 7). Thus,GRND provides an approximation of the degree of canopy closure (Drake et al., 2002; Means et al., 1999).Finally, the CRND was calculated by taking the number of hits in the location within the waveform when thefirst Gaussian pulse increases above a median energy level/threshold (the canopy top), divided by the sum of allother numbers of hits. CRND provides an approximation of the degree of canopy cover.
These four metrics were incorporated into a stepwise regression procedure to predict field-derived LAI fordifferent age classes of cottonwoods. During this process, transformations of dependent and independentvariables (including square, square root, and logarithmic) were also explored (Table 1). Metrics from the lidarwaveform are able to estimate LAI for different age classes of cottonwood trees, though in all caseslogarithmic transformation of the dependent variable was necessary. In this case, the coefficient ofdetermination for field LAI versus lidar metrics were 0.76, 0.78, and 0.84 for young, mature, and old,respectively. Meanwhile, the RMSE for all age classes is low.
The weaker relationship between field LAI and lidar metrics in young trees could be affected by two factors.First, the level of variability in old tree structure at the scale of a waveform is higher than for a young one.A second contributing factor is the presence of gaps in young canopies, which allowed a number of the laserpulses to penetrate the canopy, generating lower values for CRND.
Also, in areas with densely packed canopy materials such as old canopies, fewer lidar pulses will reach theground, thereby increasing HOME. Conversely, in more open or disturbed areas (e.g., a young tree canopy),more lidar pulses will reach the ground, reducing HOME. Additionally, the height metrics (e.g., LHT andHOME) are the most sensitive, and increase with increasing cottonwood tree age and basal area. The LHT isperhaps the metric with the strongest potential for estimating riparian forest structural characteristics. TheLHT metric is influenced by the highest detectable canopy surface within a footprint.
Overall, we presented two approaches to predict field-derived LAI for different age classes of cottonwoodtrees. The first method used three laser height metrics (hcanopy, Lzmax, and Lzmean), which were derived fromsmall-footprint lidar returns (see Fig. 6). The second method used four metrics (LHT, HOME, GRND, andCRND) that were derived by synthetic construction of a large-footprint lidar waveform from the airbornesmall-footprint lidar data (see Fig. 7). The comparison between these methods showed that much effort andmore time are needed to derive synthetic large-footprint lidar waveform, and it is apparent that extra cost willbe required for this task.
4.3. Estimation of cottonwood transpiration from lidar data
In this section, we present the lidar-predicted versus sap flow measured cottonwood transpirations at twocontrasting riparian sites in order to more accurately estimate cottonwood water use. Along the San PedroRiver, Gazal et al. (2006) quantified cottonwood transpiration using sap flow measurements for an isolated

ARTICLE IN PRESSA. Farid et al. / Journal of Arid Environments 72 (2008) 1–1512
cluster of trees located on a perennial section of the river and another located along a reach with intermittentstream flow. Hydrologically, these sites differed in the depth and seasonal fluctuation of the water table.
The P–M model (Monteith and Unsworth, 1990) was selected to estimate cottonwood transpiration usinglidar-derived LAI for June 1 through June 11, 2003 (DOY: 152–162). This model allows the calculation ofevaporation from meteorological variables and resistances which are related to the stomatal and aerodynamiccharacteristics of the tree, and has the form
E ¼1
lDAþ racpD=ra
Dþ gð1þ rc=raÞ
� �ðmm=dayÞ, (3)
where D is the slope of the saturation vapor pressure/temperature curve (kPa 1C�1), ra the density of moist air(kgm�3), cp ¼ 1.013 (kJ kg�1 1C�1) the specific heat capacity of dry air under constant pressure, D the vaporpressure deficit (kPa), g the psychrometric constant (kPa 1C�1), rc the bulk canopy resistance (sm�1), ra theaerodynamic resistance (sm�1), l the latent heat of vaporization of water (MJ kg�1), and A the availableenergy (MJm�2 day�1). Parameters such as D, ra, g, and D were calculated from air temperature, relativehumidity, and air pressure measured from nearby meteorological stations. The available energy to the canopyis given by
A ¼ S # ð1� aÞ þ Lnet � St, (4)
where S is the incoming solar radiation (MJm�2 day�1), a the canopy albedo, Lnet the net long-wave radiation(MJm�2 day�1), and St the temporary storage of energy into the tree itself (trunk and limbs) and the energyused in the photosynthesis process (MJm�2 day�1). Canopy albedo was estimated to be 0.18, a value whichhas been measured over broadleaf oak trees (Bras, 1990). St was estimated to be 5% of the incoming solarradiation based on work by Moore and Fisch (1986) who found that St ranged between 0% and 10% of thenet radiation available to a tropical forest. The net long-wave radiation contribution to the available energywas calculated from a formula provided by Shuttleworth (1993, p. 4.7).
The aerodynamic resistance (ra) is the sum of the turbulent resistance between the canopy and theatmosphere from turbulent eddies and the boundary layer resistance (Thom, 1975). Due to the relatively opennature of the cottonwood canopy, the turbulent canopy resistance is assumed negligible in comparison tothe boundary layer resistance (Goodrich et al., 2000). Hence ra is assumed to equal the boundary layerresistance (rb). To estimate the boundary layer resistance, the model proposed by Choudhury and Monteith(1988) was used:
rb ¼1
ðLAIÞðbÞ
aattð1� expð�ð1=2ÞaattÞÞ
ffiffiffiffiffioU
r. (5)
In this equation, LAI is the canopy projected Leaf Area Index (the same as Leaf Area Index) derived fromsynthetic large-footprint lidar. The quantity b was set equal to 0.0067m s�1/2. It is a scaling coefficient for leafboundary layer resistance (Magnani et al., 1998). aatt is an attenuation coefficient for wind speed inside thecanopy, o ¼ 0.05m is a typical leaf width, and U the wind speed outside the canopy (measured at 10m abovethe ground). The value for the wind attenuation coefficient, aatt, was set equal to 3 following Magnani et al.(1998).
The only remaining quantity required to compute cottonwood transpiration is the bulk canopy resistance(rc). The canopy resistance is related to individual leaf stomatal resistance (rs) by the following expression(Goodrich et al., 2000):
rc ¼rs
2LAI, (6)
where rs was estimated by Gazal et al. (2006) at both sites. LAI was derived for both sites using the modeledwaveform lidar and from ground-based measurements (LAI 2000, Li-Cor, Inc., Lincoln, NE; Gazal et al.,2006). The lidar-derived LAI at the perennial was 3.48 and at intermittent stream site was 2.78. It was assumedthat these values were constant over the study period (DOY: 152-162) centered around the lidar flight.
Daily total lidar-predicted transpiration of the cottonwoods at the perennial stream site was higher thanthat at the intermittent stream site throughout the study period (Fig. 8). Total lidar-predicted E was 23mm at

ARTICLE IN PRESS
Fig. 9. The lidar-predicted versus sap flow measured cottonwood mean daily transpirations at the intermittent and perennial stream sites
over an 11-day period centered on the lidar flight.
0.0
1.0
2.0
3.0
4.0
5.0
6.0
150 152 154 156 158 160 162 164
DOY (2003)
E (
mm
/day)
Lidar intermittent site
Sap flow intermittent siteLidar perennial site
Sap flow perennial site
Fig. 8. Daily total lidar-predicted versus sap flow measured cottonwood transpirations at the intermittent and perennial stream sites.
A. Farid et al. / Journal of Arid Environments 72 (2008) 1–15 13
the intermittent stream site, and 55mm at the perennial stream site. This is consistent with Schaeffer et al.(2000) who found that riparian water use was correlated to LAI. Depth to groundwater (dgw) at theintermittent stream site was deeper than at the perennial stream site. At the intermittent stream site, dgwincreased from 3.1m during the early part of the spring season to 3.9m during the peak of the drought period(Gazal et al., 2006). At the perennial stream site, dgw had a gradual but much smaller decline during the pre-monsoon drought. The depth at the beginning of the spring season was 1.5m and increased to only 1.8m atthe peak of the drought period (0.5m less than at the intermittent site; Gazal et al., 2006). Thus, greater depthsto groundwater corresponded with lower rates of lidar-predicted LAI and transpiration. Additionally, rs at theintermittent stream site was greater than at the perennial stream site with maximum rs attained at the peak ofthe pre-monsoon drought period (Gazal et al., 2006). At the intermittent stream site, the combination ofdecreased LAI and the increase in rs caused large reductions in lidar-predicted transpiration that may beassociated with both loss of leaf area and the loss of hydraulic conductivity that also facilitated a reduction instomatal conductance.
Lidar-predicted transpiration of the cottonwoods at two stream sites was 2–5% more than their sap flowmeasurements (Fig. 9). The differences in lidar-derived LAI and ground-based measurements of LAI(LAI 2000, Li-Cor, Inc., Lincoln, NE; Gazal et al., 2006) account for most of the differences in the magnitude ofE. Lidar-derived LAI was greater than ground-based measured LAI at two stream sites. Hence, greater LAIvalues corresponded with higher rates of cottonwood transpiration at two contrasting riparian sites.
5. Conclusions
We have shown that one can synthesize the vertical structure information for cottonwood trees in amedium-large footprint laser altimeter return waveform using a small-footprint elevation data set. The

ARTICLE IN PRESSA. Farid et al. / Journal of Arid Environments 72 (2008) 1–1514
similarity between modeled waveform and return waveform from ILRIS scanner was assessed using thePearson correlation statistic. Overall, the waveforms had a good degree of correlation. Although the modeledand ILRIS waveforms identify reflecting layers at the same elevations, the relative strengths of reflections fromthose layers varied. In addition, cottonwood tree-age changes are likely mirrored in the shape or verticalgeolocation of the waveform.
For each cottonwood tree, three laser height metrics were derived by all small-footprint lidar returns fromcottonwood canopy surface. The hcanopy and Lzmax laser height metrics were demonstrated as capable ofestimating LAI for different age classes of cottonwoods. Additionally, four metrics were derived from themodeled large-footprint return waveforms for different age classes of cottonwood trees in a riparian corridor.These four metrics were incorporated into a stepwise regression procedure to predict field-derived LAI. Themetrics from the lidar waveform were able to estimate LAI for different age classes of cottonwood trees,though in all cases logarithmic transformation of the dependent variable was necessary.
Lidar and meteorological-based estimates of cottonwood transpiration versus sap flow estimatedtranspiration at perennial and intermittent riparian sites were also made. Lidar-met-based transpirationestimates of the cottonwood at the two stream sites were 2–5% greater than their sap flow measurements overan 11-day period centered on the lidar flight. The differences in lidar-derived LAI and ground-basedmeasurements of LAI account for most of the differences in the magnitude of E.
Overall, airborne lidar offers the distinct advantage of providing LAI estimates over large areas which canthen be used to improve riparian water-use estimates. Airborne, multi-return small-footprint lidar systems arebecoming more widely available and the cost of lidar data acquisition is expected to continue to decrease. Thisstudy primarily concentrated on individual cottonwood trees to develop the relationships to estimate LAI forriparian water-use estimates and may not be applicable to dense, overlapping canopies. Additionally, lidarcannot provide information on stomatal control which also regulates riparian cottonwood water use soindependent estimates or typical ranges of canopy-level stomatal resistance will be required. However,strategically acquired lidar data and derived spatially explicit LAI measurements offer significant potential toimprove corridor-level riparian water-use estimates.
Future research will investigate how well lidar can derive LAI in more complex and interacting canopies atthe overall corridor level. The P–M model to estimate cottonwood transpiration using lidar-derived canopymetrics for the whole riparian corridor will then be investigated.
Acknowledgments
This study is based upon work supported by SAHRA (Sustainability of semi-Arid Hydrology and RiparianAreas) under the STC Program of the National Science Foundation, Agreement No. EAR-9876800. Fundsprovided by the U.S. Dept. of Defense Legacy Program in support of this research are gratefullyacknowledged. We are indebted to the following people who assisted us in various aspects of this work:Michael Sartori and William Cable. In addition, we wish to acknowledge the staff at the USDA-ARSSouthwest Watershed Research Center, Tucson, Arizona.
References
Abshire, J.B., McGarry, J.F., Pacini, L.K., Blair, J.B., Elman, G.C., 1994. Laser altimetry simulator version 3.0 user’s guide, NASA
Technical Memorandum 104588, Greenbelt, Maryland, p. 70.
Blair, J.B., Hofton, M.A., 1999. Modeling laser altimeter return waveforms over complex vegetation using high-resolution elevation data.
Geophysical Research Letters 26, 2509–2512.
Bras, R., 1990. Hydrology. Addison-Wesley, Reading, MA, p. 44.
Choudhury, B.J., Monteith, J.L., 1988. A four-layer model for the heat budget of homogeneous land surfaces. Quarterly Journal of Royal
Meteorological Society 114, 373–398.
Drake, J.B., Dubayah, R.O., Clark, D.B., Knox, R.G., Blair, J.B., Hofton, M.A., Chazdon, R.L., Weishampel, J.F., Prince, S.D., 2002.
Estimation of tropical forest structural characteristics using large-footprint lidar. Remote Sensing of Environment 79, 305–319.
Farid, A., Rautenkranz, D., Goodrich, D.C., Marsh, S.E., Sorooshian, S., 2006a. Riparian vegetation classification from airborne laser
scanning data with an emphasis on cottonwood trees. Canadian Journal of Remote Sensing 32, 15–18.

ARTICLE IN PRESSA. Farid et al. / Journal of Arid Environments 72 (2008) 1–15 15
Farid, A., Goodrich, D.C., Sorooshian, S., 2006b. Using airborne lidar to discern age classes of cottonwood trees in a riparian area.
Western Journal of Applied Forestry 21, 149–158.
Gardner, C.S., 1992. Ranging performance of satellite laser altimeters. IEEE Transactions on Geoscience and Remote Sensing 30,
1061–1072.
Gazal, R.M., Scott, R.S., Goodrich, D.C., Williams, D.G., 2006. Controls on transpiration in a semiarid riparian cottonwood forest.
Agricultural and Forest Meteorology 137, 56–67.
Goodrich, D.C., Scott, R., Qi, J., Goff, B., Unkrich, C.L., Moran, M.S., Williams, D., Schaeffer, S., Snyder, K., Macnish, R., Maddock,
T., Pool, D., Chehbouni, A., Cooper, D.I., Eichinger, W.E., Shuttleworth, W.J., Kerr, Y., Marsett, R., Ni, W., 2000. Seasonal
estimates of riparian evapotranspiration using remote and in-situ measurements. Agricultural and Forest Meteorology 105, 281–309.
Maclean, G.A., Krabill, W.B., 1986. Gross-merchantable timber volume estimation using an airborne LIDAR system. Canadian Journal
of Remote Sensing 12, 7–18.
Magnani, F., Leonardi, S., Tognetti, R., Grace, J., Borghetti, M., 1998. Modelling the surface conductance of a broadleaf canopy: effects
of partial decoupling from the atmosphere. Plant, Cell Environment 21, 867–879.
Means, J.E., 2000. Comparison of large-footprint and small-footprint lidar systems: design, capabilities, and uses. In: Proceedings of the
Second International Conference on Geospatial Information in Agriculture and Forestry. Lake Buena Vista, Florida, pp. 85–192.
Means, J.E., Acker, S.A., Harding, D.J., Blair, J.B., Lefsky, M.A., Cohen, W.B., Harmon, M., McKee, W.A., 1999. Use of large-footprint
scanning airborne lidar to estimate forest stand characteristics in the western Cascades of Oregon. Remote Sensing of Environment 67,
298–308.
Monteith, J.L., Unsworth, M.H., 1990. Principles of Environmental Physics. Edward Arnold, London, England.
Moore, C.J., Fisch, G., 1986. Estimating heat storage in Amazonian tropical forests. Agricultural and Forest Meteorology 38, 147–169.
Nelson, R.F., Krabill, W.B., Maclean, G.A., 1984. Determining forest canopy characteristics using airborne laser data. Remote Sensing of
Environment 15, 201–212.
Nelson, R.F., Swift, R., Krabill, W.B., 1988a. Using airborne lasers to estimate forest canopy and stand characteristics. Journal of
Forestry 86, 31–38.
Nelson, R.F., Krabill, W.B., Tonelli, J., 1988b. Estimating forest biomass and volume using airborne laser data. Remote Sensing of
Environment 24, 247–267.
Schaeffer, S.M., Williams, D.G., Goodrich, D.C., 2000. Transpiration of cottonwood/willow forest estimated from sap flux. Agricultural
and Forest Meteorology 105, 257–270.
Scott, R.L., Shuttleworth, W.J., Goodrich, D.C., Maddock III, T., 2000. The water use of two dominant vegetation communities in a
semiarid riparian ecosystem. Agricultural and Forest Meteorology 105, 241–256.
Shuttleworth, W.J., 1993. Evaporation. In: Maidment, D.R. (Ed.), Handbook of Hydrology. McGraw-Hill, New York, pp. 4.1–4.53.
Stromberg, J.C., 1998. Dynamics of Fremont cottonwood (Populus fremontii) and saltcedar (Tamarix chinensis) populations along the San
Pedro River, Arizona. Journal of Arid Environments 40, 133–155.
Thom, A.S., 1975. Momentum, mass and heat exchange of plant communities. In: Monteith, J.L. (Ed.), Vegetation and the Atmosphere.
Academic Press, New York, pp. 57–109.
US Department of the Interior, 2006. Water management of the regional aquifer in the Sierra Vista sub watershed, Arizona—Report to
Congress. US Geological Survey, 26.
Wehr, A., Lohr, U., 1999. Airborne laser scanning—an introduction and overview. ISPRS Journal of Photogrammetry and Remote
Sensing 54, 68–82.
World Rivers Review, 1997. Biodiversity, North America. World Rivers Review, News Briefs 12, February 1997. International Rivers
Network, Internet document /http://www.irn.org/pubs/wrr/9701/briefs.htmlS (last date accessed: 15 May 2004).
Wulder, M., Niemann, K.O., Goodenough, D.G., 2000. Local maximum filtering for the extraction of tree locations and basal area from
high spatial resolution imagery. Remote Sensing of Environment 73, 103–114.