review particle packed columns and monolithic columns in...
TRANSCRIPT

A
ctpmIcos©
K
C
0d
Available online at www.sciencedirect.com
Journal of Chromatography A, 1184 (2008) 393–415
Review
Particle packed columns and monolithic columns in high-performanceliquid chromatography-comparison and critical appraisal
Klaus K. Unger a,∗, Romas Skudas a, Michael M. Schulte b
a Institut fur Anorganische Chemie und Analytische Chemie, Johannes Gutenberg-Universitat-Mainz, Duesbergweg 10-14, D-55099 Mainz, Germanyb Performance & Life Science Chemicals R&D, Merck KGaA, Frankfurter Land Str. 250, 64293 Darmstadt, Germany
Available online 23 December 2007
Dedicated to Professor K.S.W. Sing, Professor emeritus at the former Department of Chemistry, Brunel University,Uxbridge, UK for his strong support over thirty years.
bstract
The review highlights the fundamentals and the most prominent achievements in the field of high-performance liquid chromatography (HPLC)olumn development over a period of nearly 50 years. After a short introduction on the structure and function of HPLC columns, the first part treatshe major steps and processes in the manufacture of a particle packed column: synthesis and control of particle morphology, sizing and size analysis,acking procedures and performance characterization. The next section is devoted to three subjects, which reflect the recent development and theain future directions of packed columns: minimum particle size of packing, totally porous vs. core/shell particles and column miniaturization.
n the last section an analysis is given on an alternative to packed columns—monolithic columns, which have gained considerable attraction. The
hallenges are: improved packing design based on modeling and simulation for targeted applications, and enhanced robustness and reproducibilityf monolithic columns. In the field of miniaturization, particularly in chip-based nano-LC systems, monoliths offer a great potential for theeparation of complex mixtures e.g. in life science. 2007 Elsevier B.V. All rights reserved.eywords: Particle packed columns; Monolithic columns; High-performance liquid chromatography; Fundamental aspects and recent developments
ontents
1. Introduction . . . . . . . . . . . . . . . . . . . . . . . . . . . . . . . . . . . . . . . . . . . . . . . . . . . . . . . . . . . . . . . . . . . . . . . . . . . . . . . . . . . . . . . . . . . . . . . . . . . . . . . . . . . . 3942. Particle packed columns . . . . . . . . . . . . . . . . . . . . . . . . . . . . . . . . . . . . . . . . . . . . . . . . . . . . . . . . . . . . . . . . . . . . . . . . . . . . . . . . . . . . . . . . . . . . . . . . . 395
2.1. Structure and function of a high-performance liquid chromatography column . . . . . . . . . . . . . . . . . . . . . . . . . . . . . . . . . . . . . . . . . . . 3952.2. How to make a high-performance liquid chromatography column? . . . . . . . . . . . . . . . . . . . . . . . . . . . . . . . . . . . . . . . . . . . . . . . . . . . . . 395
2.2.1. Synthesis and particle formation . . . . . . . . . . . . . . . . . . . . . . . . . . . . . . . . . . . . . . . . . . . . . . . . . . . . . . . . . . . . . . . . . . . . . . . . . . . . 3952.2.2. Sizing and size analysis . . . . . . . . . . . . . . . . . . . . . . . . . . . . . . . . . . . . . . . . . . . . . . . . . . . . . . . . . . . . . . . . . . . . . . . . . . . . . . . . . . . . 3972.2.3. Packing procedures . . . . . . . . . . . . . . . . . . . . . . . . . . . . . . . . . . . . . . . . . . . . . . . . . . . . . . . . . . . . . . . . . . . . . . . . . . . . . . . . . . . . . . . 3982.2.4. Evaluation of the column performance . . . . . . . . . . . . . . . . . . . . . . . . . . . . . . . . . . . . . . . . . . . . . . . . . . . . . . . . . . . . . . . . . . . . . . 400
2.3. Selected topics . . . . . . . . . . . . . . . . . . . . . . . . . . . . . . . . . . . . . . . . . . . . . . . . . . . . . . . . . . . . . . . . . . . . . . . . . . . . . . . . . . . . . . . . . . . . . . . . . . . . 4012.3.1. The ultimate minimum particle size in high-performance liquid chromatography – fiction and facts . . . . . . . . . . . . . . . 4012.3.2. Totally porous vs. core/shell particles . . . . . . . . . . . . . . . . . . . . . . . . . . . . . . . . . . . . . . . . . . . . . . . . . . . . . . . . . . . . . . . . . . . . . . . 4032.3.3. Column miniaturization: from meso to micro to nano – where is the end? . . . . . . . . . . . . . . . . . . . . . . . . . . . . . . . . . . . . . . . 403
3. Monolithic columns . . . . . . . . . . . . . . . . . . . . . . . . . . . . . . . . . . . . . . . . . . . . . . . . . . . . . . . . . . . . . . . . . . . . . . . . . . . . . . . . . . . . . . . . . . . . . . . . . . . . . 405
3.1. The basic idea and the pioneers . . . . . . . . . . . . . . . . . . . . . . . . . . .3.2. Monolithic silica columns . . . . . . . . . . . . . . . . . . . . . . . . . . . . . . . .3.2.1. Formation processes and pore structure control of sil
∗ Corresponding author. Tel.: +49 6151 152630; fax: +49 6151 152631.E-mail address: [email protected] (K.K. Unger).
021-9673/$ – see front matter © 2007 Elsevier B.V. All rights reserved.oi:10.1016/j.chroma.2007.11.118
. . . . . . . . . . . . . . . . . . . . . . . . . . . . . . . . . . . . . . . . . . . . . . . . . . . . . . . . . . 405. . . . . . . . . . . . . . . . . . . . . . . . . . . . . . . . . . . . . . . . . . . . . . . . . . . . . . . . . 405ica monoliths . . . . . . . . . . . . . . . . . . . . . . . . . . . . . . . . . . . . . . . . . . . . . 405

394 K.K. Unger et al. / J. Chromatogr. A 1184 (2008) 393–415
3.2.2. Chromatographic properties . . . . . . . . . . . . . . . . . . . . . . . . . . . . . . . . . . . . . . . . . . . . . . . . . . . . . . . . . . . . . . . . . . . . . . . . . . . . . . . . 4073.3. Polymer-based monolithic columns . . . . . . . . . . . . . . . . . . . . . . . . . . . . . . . . . . . . . . . . . . . . . . . . . . . . . . . . . . . . . . . . . . . . . . . . . . . . . . . . . 407
3.3.1. Synthesis approaches and characterization . . . . . . . . . . . . . . . . . . . . . . . . . . . . . . . . . . . . . . . . . . . . . . . . . . . . . . . . . . . . . . . . . . . 4073.3.2. Chromatographic properties . . . . . . . . . . . . . . . . . . . . . . . . . . . . . . . . . . . . . . . . . . . . . . . . . . . . . . . . . . . . . . . . . . . . . . . . . . . . . . . . 408
4. Comparison of the structure and performance of particle packed and monolithic columns . . . . . . . . . . . . . . . . . . . . . . . . . . . . . . . . . . . . . . . 4095. Conclusion – where are we now and where are we going? . . . . . . . . . . . . . . . . . . . . . . . . . . . . . . . . . . . . . . . . . . . . . . . . . . . . . . . . . . . . . . . . . . . 410
5.1. Where are the needs and where are the alternatives? . . . . . . . . . . . . . . . . . . . . . . . . . . . . . . . . . . . . . . . . . . . . . . . . . . . . . . . . . . . . . . . . . . 410Acknowledgements . . . . . . . . . . . . . . . . . . . . . . . . . . . . . . . . . . . . . . . . . . . . . . . . . . . . . . . . . . . . . . . . . . . . . . . . . . . . . . . . . . . . . . . . . . . . . . . . . . . . . 410
Appendix A. Survey on the most common methods of particle size analysis of HPLC packings . . . . . . . . . . . . . . . . . . . . . . . . . . . . . . . . . . . . 410A.1. Sieve and classification analysis . . . . . . . . . . . . . . . . . . . . . . . . . . . . . . . . . . . . . . . . . . . . . . . . . . . . . . . . . . . . . . . . . . . . . . . . . . . . . . . . . . . . 410A.2. Light scattering . . . . . . . . . . . . . . . . . . . . . . . . . . . . . . . . . . . . . . . . . . . . . . . . . . . . . . . . . . . . . . . . . . . . . . . . . . . . . . . . . . . . . . . . . . . . . . . . . . 411A.3. Sedimentation . . . . . . . . . . . . . . . . . . . . . . . . . . . . . . . . . . . . . . . . . . . . . . . . . . . . . . . . . . . . . . . . . . . . . . . . . . . . . . . . . . . . . . . . . . . . . . . . . . . . 411A.4. Electronic measurements . . . . . . . . . . . . . . . . . . . . . . . . . . . . . . . . . . . . . . . . . . . . . . . . . . . . . . . . . . . . . . . . . . . . . . . . . . . . . . . . . . . . . . . . . . 411A.5. Microscopic methods . . . . . . . . . . . . . . . . . . . . . . . . . . . . . . . . . . . . . . . . . . . . . . . . . . . . . . . . . . . . . . . . . . . . . . . . . . . . . . . . . . . . . . . . . . . . . 411A.6. Field flow fractionation . . . . . . . . . . . . . . . . . . . . . . . . . . . . . . . . . . . . . . . . . . . . . . . . . . . . . . . . . . . . . . . . . . . . . . . . . . . . . . . . . . . . . . . . . . . 411
. . . . .
1
mHoficc
saisi4
bumler
iisaaa
rbi
agso
cccbcmctoadpatptepep
liascsodmpita
References . . . . . . . . . . . . . . . . . . . . . . . . . . . . . . . . . . . . . . . . . . . . . . .
. Introduction
The consumption of analytical columns worldwide is esti-ated to be ca 2 million per year. If one assumes that eachPLC instrument requires five columns per year on average,ne can easily estimate the number of HPLC instruments. Thesegures clearly indicate that a HPLC column is a widely usedonsumable; nevertheless, its impact on system performance isonsiderably higher than its cost contribution.
Only a minority of users, however, can imagine the complextructure of HPLC columns. Typically, an analytical column hasn inner diameter (I.D.) of 4.6 mm and a length of 100 mm ands packed with 5 �m spherical particles. A simple calculationhows that such a column contains roughly 10 billion particlesn a dense array taking into account that the column porosity is0%.
It should be emphasized that it took more than 20 yearsefore scientists and engineers were able to design and man-facture such columns in reproducible enough fashion toeet the stringent demands in quality control of modern ana-
ytical laboratories. It is evident that many innovative andxperienced investigators have contributed to achieve theseesults.
This happened less in a planned concerted action but moren a frog-leap way with alternating technical and technolog-cal advances between equipment, e.g. high pressure pumps,ensitive UV-detectors, particle synthesis and characterizationnd corresponding column hardware design, until the idea wasccepted, realized and integrated into a convincing technicalpproach.
The majority of the pioneers of modern liquid chromatog-aphy started from gas chromatography, while others had aackground in inorganic, organic, physical or surface chemistry,n physics, or in chemical and mechanical engineering.
It took several decades before scientists invented, as an
lternative to particle packed beds, columns made of a sin-le monolithic block, composed of porous polymers or porousilica. The development of monoliths was born in the fieldf ceramics, where they were used as carriers in the field ofncaI
. . . . . . . . . . . . . . . . . . . . . . . . . . . . . . . . . . . . . . . . . . . . . . . . . . . . . . . . . 412
atalytic conversion of automobile exhaust gases which wereonverted into non-toxic effluents such as water, nitrogen andarbon dioxide. Monoliths composed of high temperature sta-le oxides were manufactured as solid porous rods with regularhannels with millimetre openings. The open structure of suchonoliths enabled a fast reaction of the exhaust gas with the
atalytic components deposited at the surface of the channels ofhe monoliths [1]. While such monoliths were made by extrusionf a paste composed of powdered and highly dispersed oxidesnd oxihydrates, attempts were made to generate monoliths withefined and controlled pore system via the sol–gel route usingorogens. Pioneering work was done by Soga and Nakanishit the Kyoto University, Japan [2,3]. Tanaka at the Kyoto Insti-ute of Technology [4] was the first who recognized the value oforous monolithic rods as columns for HPLC. The basic idea waso employ such monoliths as stable and reproducible columnsnabling a much faster separation at lower pressure than particleacked beds were able to achieve. Simultaneously, Tennikovat al. synthesized rigid porous monoliths made of cross-linkedolymers [5].
The development of porous microparticles and porous mono-iths were one significant achievement among other drivers e.g.n instrumentation which provided the basis for the widespreadpplication of HPLC in pharmaceutical and industrial analy-is. The hyphenation of HPLC as a multidimensional techniqueoupled to mass spectrometric detection was another significanttep towards solving complex analytical tasks. Looking forwardne can assume that combining reliable equipment with sensitiveetection is likely to become one of the most powerful analyticalethods available for modern life science approaches such as
roteomics, peptidomics, metabolomics. Yet this field is still ints infancy as compared to routine HPLC analysis in pharmaceu-ical industry, where the majority of today’s produced columnsre applied and consumed.
This article will focus on aspects of column structure in con-
ection with the expected chromatographic resolution and willritically examine the limitations and pitfalls in column designnd development drawing on 50 years experience in this field.n addition, an attempt is made to compare and critically review
mato
tm
2
2c
slspmtpcAsbifatAtbOmpidmtwp
t
Fn
ctpbctdbbasta
2c
oTcfi(cipsTtScp
2
K.K. Unger et al. / J. Chro
he two types of sorbents, namely packed particulate beds andonolithic structures applied to HPLC.
. Particle packed columns
.1. Structure and function of a high-performance liquidhromatography column
The selective separation of a complex mixture into individualpecies by column liquid chromatography requires a sufficientlyarge surface of the adsorbent particles with interactive surfaceites to selectively retain analytes based on their chemical com-osition and structure. Usually a column packed with porousicron-sized particles (see Fig. 1) is applied in order to achieve
his separation. In elution chromatography, the sample is trans-orted by a convective flow through the packed column. Theonvective flow is generated by a pump (pressure driven mode).s the particles possess pores of the order of 10 nm, the internal
urface carrying the molecular discriminators has to be reachedy diffusion of the analytes. Diffusion of solutes in a liquid phases usually three orders of magnitude slower than in the gas phaseor small to medium sized molecules. In addition, diffusion intond out of tortuous pores (pore diffusion) reduces significantlyhe diffusivity as compared to diffusion in the liquid bulk phase.
central problem in HPLC is therefore to overcome the limita-ions of hindered mass transfer of solutes due to pore diffusiony providing sufficient access to the interactive surface sites.ne way is to reduce the average particle size of the packing toinimize the diffusion path length by using micro particulate
ackings. Unfortunately, any reduction in particle size results inncreased column pressure drop. Another alternative is to intro-uce a bimodal pore size distribution within the particles withesopores to generate sufficient surface area and macropores
o enhance the mass transfer kinetics. Those flow-through pores
ith sizes larger than 80 nm enable a convective flow within thearticle.The most powerful means, however, is to use an elec-rical field along the packed column (electrically driven
ig. 1. Transmission electron micrograph of a porous silica microparticle (mag-ification ×150,000 times) (reproduced by the permission of author [6]).
taccfcpTHUpwfspdcewssp
gr. A 1184 (2008) 393–415 395
hromatography in packed capillaries is called capillary elec-rochromatography or CEC). In the case of silica particles as aacking material, which carry a negative surface charge, and auffer as an eluent, an electroosmotic flow (EOF) directed to theathode is generated, which leads to a convective flow withinhe porous particles. As a result, the mass transfer kinetics arerastically enhanced, which is reflected in achieving large num-ers of theoretical plates of such columns [7]. Although CECecame popular at the beginning of 1990s, the potential of thispproach was hardly recognized. The theoretical treatment istill in its infancy and thus a basic understanding of the massransfer and distribution equilibrium, particularly for chargednalytes, is lacking [8–12].
.2. How to make a high-performance liquidhromatography column?
A HPLC column is normally a stainless steel tube with 4.0r 4.6 mm I.D. densely packed with micron size silica particles.he pathway from a mirror-finished tube to a packed HPLColumn comprises a sequence of carefully controlled steps. Therst is the synthesis and manufacturing of spherical particlessee Section 2.2.1). The second is the sizing and size classifi-ation (see Section 2.2.2). The surface functionalization usuallynvolves several steps on its own. Next, a particle suspension isrepared, which is filtered at high flow-rate and increasing pres-ure through the column (column packing) (see Section 2.2.3).he column has to be flushed and conditioned and subjected
o tests to assess the column performance and selectivity (seeection 2.2.4). Fig. 2 shows a scheme of the manufacturing pro-ess of an n-octadecyl bonded silica material of 5 �m averagearticle size [13].
.2.1. Synthesis and particle formationClassical LC is performed with irregularly shaped silica par-
icles of 30–40 �m, 40–60 �m or larger sizes. These particlesre obtained by consecutive grinding or milling of larger parti-les e.g. of silica xerogel lumps, followed by size classification,ommonly performed with sieves of a given aperture. This holdsor particles larger than 25 �m. Microparticulate packings arelassified employing the air elutriation technique. In this wayackings of 5–10 �m were made at the beginning of HPLC.here have been heavy scientific debates at the beginning ofPLC mainly at the annual Zlatkis Meetings in Houston, TX,SA, between 1969 and 1975, whether irregular or sphericalarticles would be the preferred packings of HPLC columnsith respect to pressure drop, column stability and column per-
ormance. This discussion is still ongoing. To go deeper intouch comparison, it must be said that not only the particle mor-hology must be taken into account but also the particle sizeistribution, the amount of fines and the type of packing pro-edure. A study under these aspects was performed by Verzelet al. [14]. In the period between 1970 and 1995 the columns
ith irregular particles were replaced by those packed withpherical particles at least for analytical columns. Spherical orpheroidal particles were produced from synthetic cross-linkedolymers according to specific synthesis procedures. Packings

396 K.K. Unger et al. / J. Chromatog
Fig. 2. A scheme of the manufacturing processes of an n-octadecyl bonded silicamaterial for liquid chromatography. The synthesis comprise: PES (polyethoxy-silane) synthesis (step 1); conversion of PES into hydrogel beads (step 2);washing, aging and drying (step 3); calcination (step 4); blending of individualbatches into a master batch (step 5); size classification (step 6); rehydroxylation(c
wm
ca
gFp
(
(
(
(
(
sgpobac
anap
mm(
(
atm
tos
e(cssoe
lpadwmiHic(critical parameter as a result of the strong interactions between
step 7); silanazition (step 8); and blending and packing material into HPLColumns (step 9) [13].
ith irregular particles, in particular silica, are still on thearket.At the beginning of the seventies no spherical silica parti-
les in the size range between 5 and 10 �m were available andppropriate synthesis protocols had to be developed.
Several synthetic routes and processes can be employed toenerate spherical particles, which are specific for each material.or the manufacture of spherical silica particles the followingrocesses were employed:
1) subjecting colloidal silica dispersions to gelling into a twophase system [15,16];
2) hydrolysis and polycondensation of polyethoxysiloxane(PES) to silica hydrogel beads under stirring in a two-phasesystem [17–23];
3) agglutination of silica sols in presence of a polymer followedby calcination of the beads [24];
4) spray drying of silica sol suspensions [25];
tbs
r. A 1184 (2008) 393–415
5) formation and growing of silica nano particles in suspen-sions [26,27].
The silica sources were sodium silicates, stabilized silica soluspensions and alkoxysilanes. In some cases templates, poro-ens and detergents were added to adjust and to control theore structural parameters and to achieve the spherical morphol-gy. Afterwards, the additives had to be thoroughly removedy washing after or the dried particles had to be subjected tocontrolled calcination up to 600 ◦C to burn out the organic
onstituents.The major goals of the manufacturing processes were to
chieve a spherical morphology of the particles and simulta-eously adjust and control the pore structural parameters suchs the specific surface area, the specific pore volume or particleorosity and the average pore diameter.
The following values were reported for the most com-only used silica based packing materials employed as baseaterials for the separation of low molecular weight analytes
MW < 1000 Da):
(i) specific surface area, as (BET): 100–400 m2/g;(ii) specific pore volume, vp: 0.4–1.0 mL/g;iii) average pore diameter, pd: 6–50 nm.
Packings suitable for the separation of synthetic polymersnd biopolymers possess larger pores of average pore diame-er >50 nm. Correspondingly the specific surface area of these
aterials becomes smaller than 50 m2/g.One has to take into account that these values decrease after
he surface functionalization. The extent of decrease dependsn the chemistry or the way the modification is performed (e.g.ilanization, polymer coating, etc.).
Generally, a decision has to be made, whether the packing ismployed for the separation of low molecular weight analytesMW < 1000 Da) or for the separation of high molecular weightompounds (MW � 10,000 Da). As a rule of thumb, for efficienteparation, the average pore diameter of an adsorbent particlehould be four times larger than the hydrodynamic diameterf the analytes, in order to minimize hindered diffusion and tonhance mass transfer kinetics [28].
The major field of application is the resolution of low molecu-ar weight fine chemicals and pharmaceuticals. Here, an averageore diameter of ca. 10–12 nm is sufficient, which results inspecific surface area of roughly 300 m2/g. An average pore
iameter of 30 nm is needed to resolve analytes of a moleculareight between 20,000 and 50,000 Da. For polymers of largerolecular weight an average pore diameter of 50 or even 100 nm
s required. The specific surface area then is notably lower.owever, in surface–solute interactions with biopolymers by
on-exchange chromatography (IEC), hydrophobic interactionhromatography (HIC), reversed-phase liquid chromatographyRPLC), etc., the magnitude of the specific surface is not the
he biopolymer and the active sites of the surface. Studies oniopolymer separations with nonporous 2 �m particles and apecific surface area of only 5 m2/g in RPLC, HIC and IEC

mato
mt
hmalspmpiea
dsgtitsif
ppda[cbsabafrmip
umtru0lhe(fitrb
Tpb
2
ieTpnpeo(mccctuss
tstpr2lwbato
oabbastn
tacce
l
K.K. Unger et al. / J. Chro
odes have demonstrated that fast and high-resolution separa-ions can be achieved [29–32].
In terms of pore size and pore size distribution, two aspectsave to be considered. First, a packing material should be free oficropores (pores < 2 nm). Micropores generate a high surface
rea, with a high adsorption potential. In addition, small poresead to small mass transfer kinetics by slowing down the diffu-ion of solute molecules in the pores. The second issue is that theores of packing should be highly interconnected to facilitate theass transfer of analytes during the chromatographic separation
rocess. The aspect of pore connectivity, which is well knownn the design of heterogeneous catalysts, has received consid-rable attention during the last decade in the field of modellingnd simulation of pore structures [33–35].
When discussing pore structural parameters and comparingifferent packing materials one should keep in mind that thepecific surface area according to BET is determined with nitro-en – a small probe molecule in the gas phase at 77 K. HPLCakes place in a liquid phase and separates molecules, which typ-cally are considerably larger than the nitrogen molecule. Thushe magnitude of the specific surface area according to BET, inuch case, is not a proper measure of the accessibility of poresn the liquid phase. As a consequence, the effective surface areaor specific interactions may be much smaller.
The same distinction holds for the characterization of theore size, or more precisely the pore volume distribution ofackings. Usually, the pore size distribution is derived from theesorption branch of the nitrogen sorption isotherm at 77 K bypplication of the Kelvin equation with appropriate corrections36]. An alternative method, known as inverse size-exclusionhromatography (ISEC) using polymer standards [37–42] cane applied to overcome the drawbacks of gas sorption methods,ince ISEC is based on liquid chromatographic measurementsnd more relevant specific surface areas and pore volume distri-ution values are obtained. This holds for both inorganic porousdsorbents with various surface modifications [43] as well asor swellable cross-linked organic polymers [44,45]. Variouseviews [41,46] showed the applicability and reliability of theethod, without taking of the pore connectivity and pore shape
nto account. Grimes et al. [42] recently achieved to estimate theore connectivity.
The reported parameters can be expressed in relation to thenit of mass of adsorbent and packing. However, it is generallyore relevant to refer to unit of column volume. Instead of using
he bulk density of particles, the packing density is the mosteliable parameter, i.e. the mass of particle being packed pernit volume of the column. The packing density ranges between.4 g/cm3 for highly porous particles with a specific pore volumearger then 1 g/cm3 up to 0.8 g/cm3 for low porosity particlesaving a specific pore volume of approximately 0.4 g/cm3. Forxample, highly ordered mesoporous silica of type MCM-41mobil composition of matter), first introduced by researchersrom Mobil Oil Corp., USA, possess a high specific surface area
n excess of 1000 m2/g and a high specific pore volume of largerhan 1 cm3/g [47,48]. The bulk and packing density, however, iselatively low and thus the specific surface area per unit volumeecomes by a factor of ∼2 smaller then the value per unit mass.tpt
gr. A 1184 (2008) 393–415 397
his becomes important when one compares different columnackings. In consequence the pore structural parameters shoulde expressed per unit volume.
.2.2. Sizing and size analysisAt the early application of HPLC, the packings of choice were
rregularly shaped native silica particles operated with organicluents in the so-called normal-phase chromatography mode.he first action was to mill and to grind larger silica xerogelarticles to batches with the desired particle size. At this timeo technical means were available to fractionate or size microarticulate packings. Sieving, as done traditionally, was not anfficient and economic process. Therefore, in the 1970s, basedn their experience in air stream technology for aircrafts, AlpineAugsburg, Germany) developed and introduced novel equip-ent for sizing based on the phenomenon of air elutriation. The
ore of the Alpine Zig-Zag siever was a metal wheel with zig-zaghannels rotating at high speed, which gives a separation intooarse and fine particles. Removing particles at the upper andhe lower end of the particle size distribution had to be repeatedntil a desired particle size distribution was achieved. The clas-ification was accompanied by particle analysis to control theizing process [49,50].
The smaller the particle – the higher the rotation speed ofhe wheel had to be. The particles were subjected to high abra-ion forces while running through the channels of the siever andhus fines were formed, often adhering to the surface of largerarticles. Based on the relationship between particle size andotation speed the lower limit of sizing silica particles was ca.�m. The sizing process usually resulted in substantial material
osses, depending on how narrow the intended size distributionas. Losses of 50% (w/w) were common. In addition, the silicaecame polluted with iron; the latter had to be removed by ancid treatment of the sized material [13]. Apart from air elutria-ion [51], other methods can be applied [52] e.g. sedimentationf the dilute silica suspension in the counter current mode [53].
Particle size analysis is an essential tool to control the resultf sizing. Nowadays, a number of effective technologies arevailable to assess the particles size distribution in the rangeetween 1 and 10 �m. More than 50 different methods haveeen described in the literature for the analysis of particle shapend size distribution. They mainly differ in the applied mea-uring principle, the particle size range they can be used for,he information they are extracting from the particles and theecessary measuring time.
The most common measuring principles for the determina-ion of particle size distributions of chromatographic packingsre listed in Table 1. They can be grouped into five differentategories according to their measuring principle: Sieve- andlassification analysis, light scattering, sedimentation analysis,lectronic measurements and microscopic principles.
The most common particle size analysis methods are col-ected and briefly described in Appendix A.
Each instrument is based on a given principal and measuringechnique and thus provides a specific and varying average of thearticle diameter – dp. The particle diameter can be expressed ashe number average – dpn, the surface average – dps, the weight

398 K.K. Unger et al. / J. Chromatogr. A 1184 (2008) 393–415
Table 1The measuring principles for the determination of particle size distributions of chromatographic packings
Method Particle sizerange (�m)
Information fromsingle particles ormultitude
Form information Separatingmethod
System manufacturers (web address)
Sieve analysisDry sieving >20 Single No Yes Retsch (www.retsch.deAir sieving >5 Single No YesSonic sieving >5 Single No Yes Gilsonic (www.christison.com)
Light scatteringLaser diffraction 0.05–30 Multitude No No Malvern (www.malvern.co.uk); HelosTurbidimetric systems 0.05–30 Multitude No NoSingle-particle optical sensing (SPOS) 0.5–400 Single No Yes Nicomp, Particle Sizing Systems
(www.pssnicomp.com)Light obscuration (AccuSizer)
SedimentationPipette analysis 0.5–300 Multitude No YesSedimentation balance 0.5–300 Multitude No YesPhoto- or X-ray sedimentation >2 Multitude No YesCentrifugal sedimentation 0.0005–50 Single No Yes CPS instruments
(www.cpsinstruments-eu.com)
Resistazone countersElectrical sensing zone (ESZ) method 0.4–1200 Single No No Coulter Counter (www.beckman.com)
Optical methodsLight microscopy 0.5–250 Single Yes No Image analysis: SigmaScan
(www.spssscience.com)Electron microscopy 0.001–10 (100) Single Yes NoFlow through photometry 2–9000 Single Yes YesFlow cytometry (Sysmex) 0.7–160 Single Yes Yes Malvern (www.malvern.co.uk)
Field flow fractionationGravitational FFF 10–100 Multitude No Yes Postnova analytics
ar
d
vsota
td[osov
sitlt
p[
2
pottdpbw
psnpcI
Centrifugal sedimentation FFF 2–15 Multitude
verage – dpw and the volume average – dpv. For statisticaleasons ranking of averages is as follows [54]:
pn< dps
< dpw< dpv
The smallest value is the number average; the largest is theolume average in this series. Assuming that the weight of thepherical particle wi ≈ sidi ≈ nid
2i , where si is the surface area
f the spherical particle of diameter di and ni is the number ofhe spherical particles, the weight average can be expressed bysurface average and the number average [18,55].
The particle size distribution can be presented as a cumula-ive distribution or as a differential distribution. There are threeifferent average values: the mean, the median and the mode55]. Table 2 gives an example of certain characteristic valuesf silica packing. In HPLC, the volume average of the particleize is the most informative one, because it refers to the volumef the column. However, the number average is also useful toisualize the fine particle and their distribution.
There has been much discussion on how narrow a particleize distribution should be to generate the most stable pack-
ng and the highest column performance. As a rule of thumbhe ratio of the dp90 value (average value at 90% of the cumu-ative distribution) to the dp10 value (average value at 10% ofhe cumulative distribution) should amount from 1.5 to 2.0 forb1a
(www.postnova.com)No Yes
articles in the range of 3–7 �m (analytical HPLC columns)56].
.2.3. Packing proceduresIn the early stages of LC, columns were obtained by dry
acking 30–40 �m particles into glass columns using a method-logy, that involved repeated damping (mechanically tappinghe column or lifting it up in the air and letting it drop) ofhe packed column. [57]. The first HPLC columns were alsory-packed into stainless steel columns with microparticulateackings by Huber and Kraak at the University of Amsterdamy mechanically pushing the particles into the column blankith a rod.Enormous efforts were undertaken to develop an efficient
acking procedure for micro particulate packings in stainlessteel columns [58]. The most common one is the slurry tech-ique: a dilute suspension of the particles is forced under highressure and high flow-rate into the column. The column endontains a porous frit, which retains the particles. When 4.6 mm.D. 250 mm long columns are packed with 5 �m particles, the
ack pressure may rise up to 500 bar at flow rates in excess of0 mL/min. Such procedure would require a high pressure pumpnd a properly designed stainless steel reservoir.The steps are as follows [59]:

K.K. Unger et al. / J. Chromatogr. A 1184 (2008) 393–415 399
Table 2Summary of a particle size measurement (volume and number statistics), performed with Particle Sizing Systems, Santa Barbara, California, U.S.A. (data suppliedby Dr. F. Krebs, Merck KGaA, Darmstadt)
Volume statistics (geometric) 6.01
Calculations from 0.96 to 33.50%Volume 100.0% Coinc. connected 195,770Mean 8.267 �m SD 0.091Median 8.236 �mMean/median ratio 1.004 Variance 0,0082Mode 8.089 �m Skewness:-4.625e-001 left skewed
% <5.000 <10.00 <50.00 <90.00 <95.00Size (�m) 6.067 6.475 8.236 10.74 11.54
dp90/dp10 1.66
Number statistics (geometric) 6.01
Calculations from 0.96 to 33.50%Number 100.0% Coinc. connected 195,770Mean 6.240 �m SD 0.221Median 7.138 �mMean/median ratio 0.874 Variance 0.049Mode 7.341 �m Skewness:-2.010e-001 left skewed
% <5.000 <10.00 <50.00 <90.00 <95.00Size (�m) 1.545 2.865 7.138 9.344 10.09
d
(
natccimrettp4pincftotmfi
IuHbpid
aitsdedon[obob
32rsp
p90/dp10 3.26
(i) preparation of a stable suspension of highly dispersed par-ticles;
(ii) filling of the column at high flow rates of >10 mL/min andhigh pressures up to 500 bar employing a stainless steelreservoir;
iii) washing the column and conditioning with the eluent.
As a rule of thumb the packing pressure should always be sig-ificantly higher than the working pressure. A stable column hasporosity between 35 and 45%. This value does not correspond
o the densest packing order, which is 26% for a hexagonallylose packed bed [60]. However, the packing density varieslose to the wall as compared to the center. Inhomogeneitiesn the packing due to wall effects are assumed for approxi-
ately 20 particle diameters. Such packing inhomogeneities canesult in channel formation and voiding effects, diminishing thexpected column performance. Most experience was gained onhe packing of 3–10 �m particles in stainless steel columns. Itook column manufacturers approximately 10 years to developrocedures to reproducibly pack analytical columns of 4 and.6 mm I.D., respectively. The main outcome is discussed in theaper of Kirkland and DeStefano [61]: “A very important aspectdentified was that the particles must be totally suspended andot aggregated in the slurry liquid to be used for the packing pro-ess. Higher packing pressures generally were found favouredor both performance and stability. This high-pressure opera-ion requires good strength in particles, which is characteristicf porous silica micro spheres used in the test; irregular par-
icles were deficient in this regard. The low viscosity slurryethod was identified as superior over high-density techniquesor packing silica micro spheres, and the constant pressure pack-ng method invariably was favoured over the constant flow rate.
pdcm
t was found that thin screens for capturing the packing at col-mn inlets and outlets produced the highest column efficiency.owever, this material is less useful for preparing long-term sta-le columns, and thin porous frits generally are preferred for thisurpose. There was no performance advantage found for pack-ng the column in an upwards vs. downwards direction, but theownwards approach is more convenient.”
Particles larger than 10 �m could be packed by the dynamicxial compression technique in preparative columns of 50 mmnner diameter and larger. In general, there exist two methodso fill columns in preparative scale: this is dry packing andlurry packing (filtration technique) methods. Even though thery filling method is easy to perform, the slurry method gives,specially for smaller particles, more efficient and more repro-ucible columns [62]. For extended stability and reproducibilityf the packing processes in the preparative mode, new tech-iques were developed, such as dynamically axial compression63–67] and radial compression [68–73]. These methods allowne to change the packed bed volume, through solving the insta-ility problem in the packed bed, which is due to the formationf channels, voids and inhomogeneous dense packing formedy slurry packing process.
The packing of microbore columns (I.D. between 1 andmm) and of fused silica capillaries (I.D. between 200 and0 �m I.D.) requires different conditions and extended expe-ience. Different column packing techniques could be applied,uch as: dry packing [74], high-pressure slurry packing [75],acking using supercritical carbon dioxide [76], electrokinetic
acking [77], and packing with centripetal forces [78]. Thoughifferent packing methods allows one to obtain a stable capillaryolumn, the preparation of robust frits is not easy. The most com-on technique is the fusing of silica particles [79,80]. Although
4 atog
swdc
sbsi
ossv
2
H
(
(
(
2�
l
ps
�
w5subbctucmde
2c[mbecta
uclfm
TC
v
G
S
H
K
H
v
Y
00 K.K. Unger et al. / J. Chrom
ilica particles can be fused together, the general observationas that after such a treatment the column performance hadecreased, still leaving the problem of the frit preparation in theapillary columns an unresolved issue.
Particular effort is required to pack columns with particlesmaller than 3 �m. The adhesion forces between the particlesecome much larger then for particles with dp > 5 �m and thustable suspension have to be prepared with highly dispersedndividual particles before slurry packing.
A number of research projects related to the characterizationf column bed structure involved the application of techniquesuch as NMR imaging [81–84], pulsed-field-gradient NMRpectroscopy [85–87], hydrodynamic chromatography [88], andisual monitoring of elution bands in glass columns [89].
.2.4. Evaluation of the column performanceIn general there are three major criteria in characterizing a
PLC column:
a) The hydrodynamic properties expressed by the column pres-sure vs. flow dependency provide an insight into the flowbehaviour. From these data the column permeability can becalculated and compared with the expected value based onthe average particle diameter and the column dimensions.
b) The kinetic properties of the column expressing the masstransfer kinetics of analytes are a measure of the peak dis-persion of a column. The peak dispersion is characterizedby the theoretical plate height (H) and the number of theo-retical plates (N). A more detailed diagnosis of the kineticperformance is based on the dependency of the plate height(H) as the function of the linear velocity (u) of the eluent.
c) The thermodynamic properties are expressed by the reten-tion coefficients and the selectivity coefficient of test solutesunder constant conditions.
.2.4.1. Hydrodynamic properties. The column pressure dropp is proportional to the viscosity η of the eluent, the column
ength (L) and the linear velocity of the eluent u and inversely
DcKd
able 3omparison of plate height models (reproduced by the permission of the authors [97
Model
an Deemter et al. [94] h = A + B
ν
iddings [96] h = 1
1/A +nyder (1969) h = A�n (0.3
uber and Hulsman (1976) h =1/A +
ennedy and Knox [128] h = Aν1/3 +
orvath and Lin (1978) h =1/A +
an Krefeld and van den Hoed (1978); Afeyan et. al (1990) h = 1
1/A +ang et al. (1992) h = A + B
ν
r. A 1184 (2008) 393–415
roportional to the average particle diameter (dp) of the packingquared (Eq. (1)):
p = ΦηLu
d2p
(1)
here Φ is the column resistance factor, which varies between00 and 1000 for a well packed column [90]. The operating pres-ures of reversed phase columns of 4 mm I.D. and 100 mm lengthsually range between 50 and 100 bar. Changes of the columnackpressure are commonly a strong indicator that the columned structure alters and the column performance declines. Theolumn pressure drop becomes significant when the particles ofhe packing are smaller then 2 �m (see Section 2.3.1.) The col-mn pressure is important for particles of all sizes, as it plays aentral role in maximizing plates/time or optimizing the perfor-ance of a given column. There are many review articles, which
iscuss the critical role of pressure in both using columns andvaluating their performance [91,92].
.2.4.2. Peak dispersion. The first researchers who systemati-ally studied peak dispersion phenomena were Martin and Synge93], van Deemter et al. [94] and Giddings [95,96]. The treat-ent of the mass transfer processes and the distribution equlibria
etween the mobile and stationary phase in a column lead toquations which link the theoretical plate height as the decisiveolumn performance parameter to the properties of the LC sys-ems such as linear velocity of eluent, diffusion coefficient ofnalyte, retention coefficient of analyte, column porosity, etc.
van Deemter proposed an equation, which described the col-mn performance as a function of the linear velocity for a packedolumn in gas chromatography coated with a stationary liquidayer. Similar equations, however, with other terms were derivedor LC by numerous researchers (see Table 3). It became com-on practice to refer to all H vs. u plots collectively as van
eemter plots. A minimum in the plate height vs. linear velocityurve is observed where the column performance is the highest.nox suggested a three term equation to describe the depen-ency of the theoretical plate height H of a column as a function
])
Limiting case for large ν (velocity)
+ Cν h + A + Cν
1/Eν+ B
ν+ Cν h + A + Cν
≤ n ≤ 0.7)
1
1/Eν1/2+ B
ν+ Cν + Dν1/2 h = A + cν + Dν1/2
B
ν+ Cν h = Aν1/3 + Cν
1
1/Eν1/3+ B
ν+ Cν + Dν1/3 h = A + cν + Dν2/3
1/Eν+ B
ν+ F h = A + F
+ DCν
D + Cνh = A + D

mato
o
H
wi
tpittbh
b
h
v
wp
cuiS
P
S
R
weaPE
cd
caad
isacir
rhtcitiwl
aata
yauadm
cw[(wttkccop
noitsrtctr
2
2h
dI
K.K. Unger et al. / J. Chro
f the linear velocity of the eluent by Eq. (2):
total = L
N= Au1/3 + B
u+ Cu (2)
here Htotal, is the total theoretical plate height of a column; u,s the linear velocity of the eluent and A, B and C are constants.
The A-term corresponds to the convective dispersion by flowhrough the tortuous column bed, the B-term expresses the dis-ersion due to longitudinal molecular diffusion and the C-terms a measure of the equilibration of the analyte between the sta-ionary and mobile phase in a column. Htotal vs. u is dominated athe left hand side of the minimum by B and at the right hand sidey the term C at higher linear velocities. Well packed columnsave the approximate values of A < 1, B ∼= 2 and C < 0.1. [98].
It is useful to convert H and u to dimensionless parametersy Eqs. (3) and (4):
= H
dp(reduced theoretical plate height) (3)
= udp
Dm(reduced linear velocity) (4)
here Dm is the diffusion coefficient of the analyte in the mobilehase.
The application of reduced parameter is quite common forhemical engineers comparing the performance of columns innit operations such as distillation, extraction, adsorption. Typ-cal reduced parameters are: the Peclet number (Eq. (5)), theherwood number (Eq. (6)) and the Reynolds number (Eq. (7)):
e = dpu
Dm(Peclet number) (5)
h = kifdp
Dm(Sherwood number) (6)
e = udp
υm(Reynolds number) (7)
here dp is the average particle size; u, linear velocity of the elu-nt; kif, partial mass transport coefficient in the flowing medium,nd υm is the kinetic viscosity of the mobile phase [99]. Theeclet number is then identical with the reduced velocity (seeqs. (4) and (5)).
The particular advantage of this approach is the ability toompare the performance of columns packed with particles ofifferent sizes.
Unger et al. [100] demonstrated experimentally that theourse of the reduced plate height-reduced linear velocity plotsre similar for all types of packings independent of whether theyre irregular or spherical, for silicas and aluminas of widelyiffering average particle diameter.
A more detailed analysis of the H vs. u curves publishedn the LC literature is often not possible for the following rea-ons: Firstly, the plate height is commonly measured by simple
pproximations and not accurately by the method of statisti-al moments. Secondly, the measurements were performed onnstruments, which had substantial dead volumes, and no cor-ections were performed to correct the total plate height withoiiw
gr. A 1184 (2008) 393–415 401
espect to the extra-column contributions. Needless to say, plateeight measurements should be performed at isocratic condi-ions. A recent investigation including a number of commercialolumns packed with micron size particles has indicated that thempact of these terms in assessing the column performance haso be re-investigated [101]. Still, the usual aim in column designs the need to make C-term of H vs. u curve as small as possible,hat would allow a fast and efficient separation, even at higher
inear velocities, where ν � 10.The optimum linear velocity is νopt was found to be between 2
nd 5 with reduced plate heights between 2 and 5. In other words,t the best conditions the plate height values correspond to twicehe average particle diameter. H value have been reported whichre smaller than 2 [102].
The current trend in column development is to make the anal-sis faster and more sensitive with respect to detection. Onelternative is to reduce the particle size on the expense of col-mn pressure drop using classical packing materials. The otherlternative is to change the particle design or to apply electricallyriven chromatography such as CEC. We will treat this issue inore detail in the next section.A more advanced concept on the characterization of the
olumn performance was pioneered by Poppe [91], whichas further developed by Tanaka et al. [103] and Gzil et al.
104]. Poppe introduced the so-called kinetic plots: plate timelog(t0/N)) as a function of the number of theoretical plates N,here t0 is the elution time of a non-retained compound. In order
o assess the limits of column performance as a function of par-icle size, column pressure drop, etc. Tanaka et al. [103] appliedinetic plots to compare monolithic silica columns with parti-le packed columns. The experimentally obtained kinetic plotslearly indicated the advantage of monolithic column structuresver particle packed columns with respect to maximum columnerformance.
The increase of the plate numbers of a HPLC column or theumber of plates per unit time of the LC system, however, isnly one side of the coin and very much resembles the situationn HPLC at the middle 1970s. It should be remembered thathe chromatographic resolution Rs is mainly governed by theelectivity of the phase system (stationary and mobile phase)ather than by the column performance. Thus the message iso develop highly selective stationary phases with acceptableolumn performance and column stability. As the emphasis ofhis article is not directed to stationary phase development, theeader is referred to numerous literature sources [105–110].
.3. Selected topics
.3.1. The ultimate minimum particle size inigh-performance liquid chromatography – fiction and facts
The subject of minimum particle size in HPLC was alreadyiscussed in depth at the advent of HPLC by several researchers.n 1975 Halasz stated in a paper: “At a column pressure
f approximately 500 bar, the temperature of the eluent mayncrease up to 35 ◦C. Temperature and viscosity gradients existn axial and radial directions inside the column. For routineork the particle size should be 5 �m < dp < 3 �m. The mini-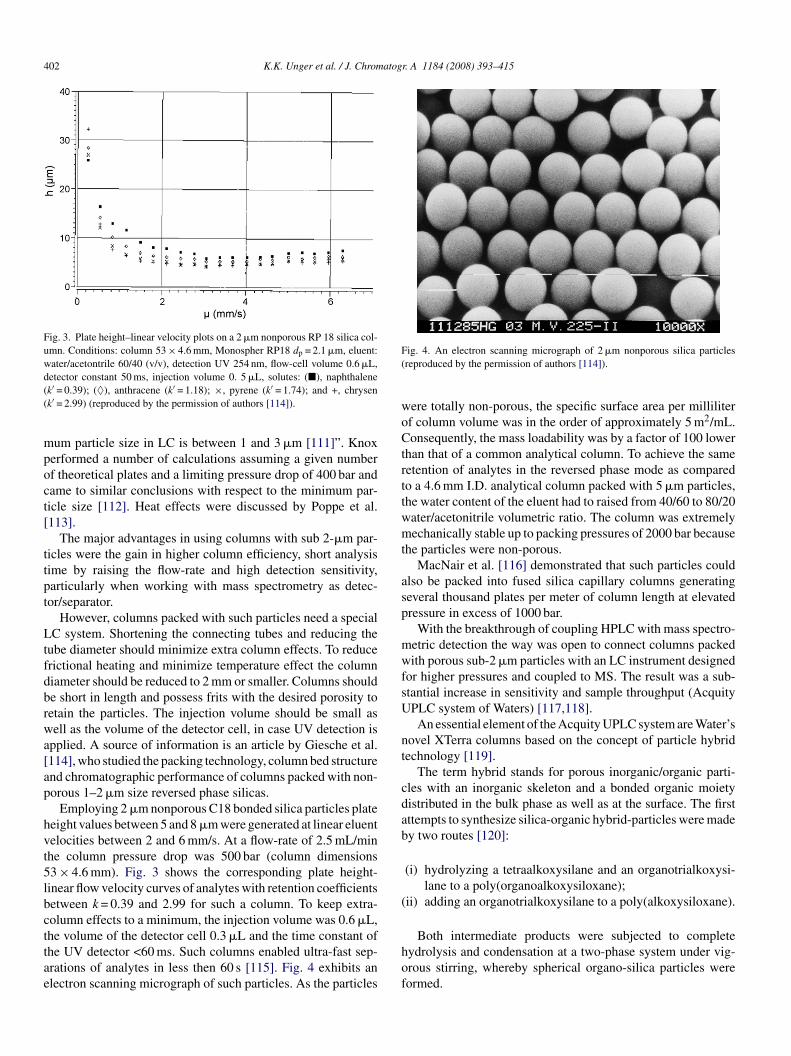
402 K.K. Unger et al. / J. Chromatogr. A 1184 (2008) 393–415
Fig. 3. Plate height–linear velocity plots on a 2 �m nonporous RP 18 silica col-umn. Conditions: column 53 × 4.6 mm, Monospher RP18 dp = 2.1 �m, eluent:water/acetontrile 60/40 (v/v), detection UV 254 nm, flow-cell volume 0.6 �L,d((
mpoct[
ttpt
Ltfdbrwa[ap
hvt5lbcttae
F(
woCtrttwmt
asp
mwfsU
nt
cdab
(
etector constant 50 ms, injection volume 0. 5 �L, solutes: (�), naphthalenek′ = 0.39); (♦), anthracene (k′ = 1.18); ×, pyrene (k′ = 1.74); and +, chrysenk′ = 2.99) (reproduced by the permission of authors [114]).
um particle size in LC is between 1 and 3 �m [111]”. Knoxerformed a number of calculations assuming a given numberf theoretical plates and a limiting pressure drop of 400 bar andame to similar conclusions with respect to the minimum par-icle size [112]. Heat effects were discussed by Poppe et al.113].
The major advantages in using columns with sub 2-�m par-icles were the gain in higher column efficiency, short analysisime by raising the flow-rate and high detection sensitivity,articularly when working with mass spectrometry as detec-or/separator.
However, columns packed with such particles need a specialC system. Shortening the connecting tubes and reducing the
ube diameter should minimize extra column effects. To reducerictional heating and minimize temperature effect the columniameter should be reduced to 2 mm or smaller. Columns shoulde short in length and possess frits with the desired porosity toetain the particles. The injection volume should be small asell as the volume of the detector cell, in case UV detection is
pplied. A source of information is an article by Giesche et al.114], who studied the packing technology, column bed structurend chromatographic performance of columns packed with non-orous 1–2 �m size reversed phase silicas.
Employing 2 �m nonporous C18 bonded silica particles plateeight values between 5 and 8 �m were generated at linear eluentelocities between 2 and 6 mm/s. At a flow-rate of 2.5 mL/minhe column pressure drop was 500 bar (column dimensions3 × 4.6 mm). Fig. 3 shows the corresponding plate height-inear flow velocity curves of analytes with retention coefficientsetween k = 0.39 and 2.99 for such a column. To keep extra-olumn effects to a minimum, the injection volume was 0.6 �L,
he volume of the detector cell 0.3 �L and the time constant ofhe UV detector <60 ms. Such columns enabled ultra-fast sep-rations of analytes in less then 60 s [115]. Fig. 4 exhibits anlectron scanning micrograph of such particles. As the particleshof
ig. 4. An electron scanning micrograph of 2 �m nonporous silica particlesreproduced by the permission of authors [114]).
ere totally non-porous, the specific surface area per milliliterf column volume was in the order of approximately 5 m2/mL.onsequently, the mass loadability was by a factor of 100 lower
han that of a common analytical column. To achieve the sameetention of analytes in the reversed phase mode as comparedo a 4.6 mm I.D. analytical column packed with 5 �m particles,he water content of the eluent had to raised from 40/60 to 80/20ater/acetonitrile volumetric ratio. The column was extremelyechanically stable up to packing pressures of 2000 bar because
he particles were non-porous.MacNair et al. [116] demonstrated that such particles could
lso be packed into fused silica capillary columns generatingeveral thousand plates per meter of column length at elevatedressure in excess of 1000 bar.
With the breakthrough of coupling HPLC with mass spectro-etric detection the way was open to connect columns packedith porous sub-2 �m particles with an LC instrument designed
or higher pressures and coupled to MS. The result was a sub-tantial increase in sensitivity and sample throughput (AcquityPLC system of Waters) [117,118].An essential element of the Acquity UPLC system are Water’s
ovel XTerra columns based on the concept of particle hybridechnology [119].
The term hybrid stands for porous inorganic/organic parti-les with an inorganic skeleton and a bonded organic moietyistributed in the bulk phase as well as at the surface. The firstttempts to synthesize silica-organic hybrid-particles were madey two routes [120]:
(i) hydrolyzing a tetraalkoxysilane and an organotrialkoxysi-lane to a poly(organoalkoxysiloxane);
ii) adding an organotrialkoxysilane to a poly(alkoxysiloxane).
Both intermediate products were subjected to completeydrolysis and condensation at a two-phase system under vig-rous stirring, whereby spherical organo-silica particles wereormed.

mato
taTatmrac
Mie
eaP0i
elmpoa[
2
waubppobcaf2ap
aona[p1mqpo
tbposCaK
nbloTavIslwo
tipmaawHr
2–
yIaii[mhw
soorapa
K.K. Unger et al. / J. Chro
The particular feature of Waters novel hybrid technology washe use of ethane bridged silanes (e.g. (bistriethoxysilyl)ethane)nd tetraethoxysilane to form a bridged poly(ethoxysiloxane).he bridged ethylsiloxane silica (called BEH) was synthesizeds porous sub 2 �m particles with a narrow particle size dis-ribution. Due to the ethyl bridge the particles display a high
echanical stability and an enhanced pH stability in the pHange between 1 and 12. XTerra materials and columns arevailable with different kinds of organic moieties and surfacehemistries [121].
In order to avoid the application of high pressure Advancedaterials Technology, Chadds Ford, PA, USA have recently
ntroduced particles with a solid core and a porous shell, asxplained in Section 2.3.2.
A promising alternative to using submicron particles is tomploy them in CEC. In this case, the electrical field gener-tes the flow and plate heights of 1–2dp have been generated.orous silica beads with an average particle diameter between.2 and 3 �m, n-octyl surface functionalized have been studiedn 100 �m I.D. fused silica capillaries in CEC [122].
Thus there is still a need for fundamental studies on CEC tolucidate the retention mechanism for polar and charged ana-ytes and to design appropriate systems. Furthermore, CEC isuch more complex than pressure driven LC with regard to two
henomena: (i) the EOF is not constant but varies as a functionf many system- and operational parameters and (ii) retentionnd selectivity in CEC is changing when the field strength alters123].
.3.2. Totally porous vs. core/shell particlesThe development of efficient packing materials in HPLC
as never a straightforward approach. There were false startsnd intermediate solutions, which in the long run proved to bensuccessful. An example was the introduction of porous layereads. Before totally porous particles were applied in HPLC,orous layer beads were introduced as packings based on theioneering work of Horvath and co-workers [124,125]. Thebjective was to enhance the mass transfer kinetics of solutesy reducing the diffusion path length. Due to the large parti-le diameter the columns generated relatively low backpressurend were dry packed by damping. Although the specific sur-ace area was considerably larger as compared to nonporous�m particles the mass loadability was limited. Such productsre still commercially available and employed as packings inrecolumns.
The porous layer bead particles consisted of an imperme-ble core of 30–40 �m diameter and a porous silica shellf approximately 1 �m thickness. They were operated in theormal-phase LC mode. The porous layer contained mesoporesnd the specific surface areas ranged between 1 and 30 m2/g126]. Chromatographic tests of commercial products in normal-hase chromatography gave plate height values in the range of–4 mm at a linear velocity of 2.5 cm/s. The measured plate is
ainly determined by the A-Term, which represents the packinguality of the column bed. At higher velocities, the C term oflate height curves was relatively small and this enabled one tobtain efficient and fast separations [126].
swop
gr. A 1184 (2008) 393–415 403
An investigation was subsequently made of the impact ofhe estimated thickness of the porous layer ds in the rangeetween 0.5 < ds < 0.9 �m at constant particle size and constantore diameter of the porous layer on the theoretical plate heightf selected solutes in normal-phase chromatography. A relation-hip of H = d1.4
s was obtained which is to be expected [127].omparative column performance studies of porous layer beadsnd totally porous particles were carried out by Kennedy andnox [128] at the same time.Recently, Advanced Materials Technology has introduced a
ovel type of a column known as Halo HPLC column, which isased on a fused core particle technology developed by Kirk-and. The 2.7 �m silica particles are composed of a solid coref 1.7 �m thickness surrounded by a porous layer of 0.5 �m.he particles possess a specific surface area of 150 m 2/g andn average pore diameter of 9 nm. They are available with aariety of bonded reversed phase chemistry [129]. The column.D. is 2.1, 3.0 and 4.6 mm, respectively. Columns packed withuch particles show low mass transfer resistance values at highinear velocities enabling very fast separations of low moleculareight analytes in less then one minute at column back pressuresf approximately 300 bar.
Recently Gritty and Guiochon [101] performed a compara-ive study on the performance of micron size RP silica columnsncluding the Halo column at a wide range of the mobilehase velocities. The Halo column performed best for lowolecular compounds (e.g. naphthalene), but is not as good
s the other studied columns using insulin as solute. The rel-tively high C-term of the Halo column at high flow ratesas attributed to the roughness of the external surface of thealo particles which might generate a high film mass transfer
esistance.
.3.3. Column miniaturization: from meso to micro to nanowhere is the end?Column miniaturization has been under discussion for many
ears, particularly since 1980 when fused silica capillaries of.D. in 100 �m range were first manufactured. They were firstpplied in gas chromatography with liquid stationary phase coat-ngs inside. It is beyond the scope of this article to provide ann depth survey of micro bore and capillary columns in HPLC92,130]. The main idea to reduce the column diameter was toinimize the dilution of the sample to be resolved and to achieve
igher peak heights as compared to the 4.6 mm I.D. columns,hile maintaining the column efficiency.The next step in I.D. diminution was to introduce Microbore
tainless steel columns of 1–2 mm I.D. Such columns can be stillperated with a conventional HPLC system. Systematic studiesn the packing procedure and the efficiency of such columnsevealed that indeed the same column performance could bechieved as compared to 4 mm I.D. columns using the sameacking materials. The critical issue is the column hardwarend the packing process. The stainless steel tubings should be
table to high pressures and contain a mirror finish of the insideall. The packing pressure is commonly above 1000 bar. Theptimum packing pressure is dependant on the type of silicaacking.
404 K.K. Unger et al. / J. Chromatogr. A 1184 (2008) 393–415
Table 4A survey of HPLC columns of varying I.D. and the corresponding flow-rates
Column I.D. (�m) Flow rate (�L/min) Column volume (�L) Mass of silica per column (mg) Mass loadability per column (�g)
4600 1000 1660 1100 1104000 760 1260 830 832000 190 310 210 211000 47 80 50 5
300 4.3 7 5 0.5100 0.5 0.8 0.5 0.05
50 0.125 0.2 0.13 0.0110 0.005 0.08 0.05 0.005
A skele0 hors [
2atctbinH[
mw1arndsldd
iTs[
rcvtinsp
romoo
doscdpamttsmrstteeoc
awp
asuwbs
m
(
(
ssumptions: column dimensions, L = 100 mm, total column porosity εt = 0.7,.1 mg/g of stationary phase was assumed (reproduced by the permission of aut
Roumeliotis et al. [131] increased packing pressures to000 bar and the silicas were still mechanically stable. Tochieve the expected column performance several factors (injec-ion volume, detection volume, connecting tubes) have to beonsidered to minimize the contributions of extra-column effectso the total peak dispersion. It should be emphasized that 1 mmore columns require a very low peak broadening system, min-mizing extra-column-volume contribution otherwise the plateumber are adversely effected. Table 4 provides a survey ofPLC columns of varying I.D. and the corresponding flow-rates
132].Viewing Table 4 it becomes evident, that the operation of
icro and nano columns require low volume flow-rates forhich classical HPLC instruments that run with columns of.0–4.6 mm I.D. are not designed. Consequently, a micro-LCnd nano-LC system, respectively, is required to match the flow-ate in the microliter to nanoliter/min range. Such systems areot only operated under isocratic conditions, but also under gra-ient elution conditions. Rapp and Tallarek have reviewed thetate-of-art in the generation and control of micro- and nano-iter flow rates with special emphasis on feasibility, automation,elay times and dead volumes [133]. In addition, the volume ofetector cells has to be reduced.
The range of 300–20 �m column I.D. is covered by fused sil-ca capillaries coated outside with a poly(ethyleneimine) layer.hey can be operated as open tubes and packed tubes. Themallest I.D. capillary columns applied had an I.D. of 20 �m134].
For the operation of capillary columns, special equipment isequired. One has to make sure that for the range of 10–300 �molumn I.D. the approximately typical flow rate (linear eluentelocities between 1 and 10 mm/s) is in the range from 10 nL/mino 100 �L/min and the pressure limit up to 5000 psi [135]. Var-ous injection systems and detectors are applicable. Also oneeeds special frits and column connections. The packing of fusedilica capillaries is achieved by slurry packing, but a miniaturizedacking device should be employed.
Another important aspect using micro and nano-LC columnselates to the mass loadability of the column, which is a measure
f the column capacity [136,137]. Analytical columns are com-only operated in the linear range where the retention coefficientf an analyte and the plate number N is constant and independentf the sample size. Further increase of the sample size leads to a
(
b
ton porosity εs = 0.3, silica skeleton density 2.2 g/cm3. A mass loadability of132]).
iminution of the retention coefficient k and a drastic decreasef column plate number N. At further increase of the sampleize, the column is overloaded. The linear range, where analyti-al columns could be operated without overload was arbitrarilyefined as the linear capacity corresponding to the sample masser gram of the stationary phase causing a 10% decrease of knd a 50% decrease of N for a given solute [57]. However, theass loadability or column capacity is affected by a number of
he parameters such as the composition and type of eluent, theype of stationary phase (e.g. the chain length of an alkylbondedilica), the type of solute (ionic, neutral, basic, acidic) and itsolecular weight. As a rule of thumb, the mass loadability for
eversed phase C18 column is about 2 mg of sample per gram oftationary phase for a low molecular weight solute. It accountso about 10 mg/g of stationary phase for peptides and increaseso about 100 mg/g of stationary phase for proteins on an ion-xchange column. Mc Calley et al. [138,139] and Buckenmeisert al. [140] have studied over-loading effects for various solutesn a large number of columns (reversed phase silicas, polymericolumns) and came to much more refined conclusions.
By decreasing the column I.D. the mass of packing or station-ry phase decreases proportionally too (see Table 4). In otherords, a packed 100 �m I.D. column contains ca. 0.13 mg ofacking and the mass loadability is estimated to be 0.01 �g.
The lowest I.D. of capillary columns is reported to be 10nd 20 �m. The latter were packed with 0.8 �m reversed-phaseilica particles [134]. The capillary columns were employed inltrahigh-throughput proteomics using fast RPLC separationsith electrospray ionization (ESI) MS/MS. Also monolithic C18onded silica columns were manufactured and tested for theame purpose by the same group [141].
There are a number of inherent problems associated with theanufacture and operation of these capillary columns:
a) packing of capillaries with particulate materials or/and man-ufacture of stable and homogeneous monolithic columns;
b) selection of appropriate frit systems in case of particlepacked capillaries to avoid significant extra-column volumecontributions;
c) connection to the mass spectrometer.
To overcome these problems a microfluidic chip was designedy Agilent Technologies, Germany to be used at nano- and

mato
ppc
3
3
rprd
ptitsai[ptpawnSmPtamtts
dsc
aswdpnoaw
dI
ws
3
3s
tasacaistrgptvmhsmts[
4rdkTM
leI
a2oufa
bt(rttds
K.K. Unger et al. / J. Chro
ico-litre flow-rates which integrates most of the functional com-onents of a conventional nano column LC/MS directly to ahip.
. Monolithic columns
.1. The basic idea and the pioneers
As compared to particle bed columns, monolithic columnsepresent a single piece made of porous cross-linked polymer ororous silica. Monoliths are made in different formats as porousods, generated in thin capillaries or made as thin membranes orisks.
When one critically judges the progress made with particleacked columns in HPLC over the last 50 years and considerhe problems caused by the assembly of particles in a columnt becomes immediately obvious, that the search for alterna-ives is a logical consequence. Cross-linked polymers are ideallyuited to be synthesized in a confined space. Thus, the initialttempts were made with polyurethane foams to be appliedn size exclusion chromatography and in gas chromatography142–144]. Hjerten was the first one who developed continuousolymer beds based on polyacrylamide for the fast separa-ion of biopolymers [145]. Tennikova and Svec synthesizedoly(glycidyl methacrylate ethylene dimethacrylate) polymerss disks called macroporous polymer membranes [5] whichere commercialized later by BIA Separations, Lubljana, Slove-ia under the trade name Convective Interaction Media (CIM).vec and Frechet [146] extended the family of continuous poly-er beds by poly(styrene divinylbenzene) copolymers. Later onremstaller et al. [147] extended the approach to prepare func-
ionalized polymeric capillaries for the separation of nucleiccids. Buchmeiser et al. [148] introduced the ring-openingetathesis polymerization (abbreviated as ROMP) as an alterna-
ive synthetic route to free radical polymerization which enabledhe syntheses of materials with a controlled pore structure andurface functionality.
Polysaccharides such as agarose, cellulose and cross-linkedextran were also employed as such [149,150] or used byupports in layered stacks and rolled layer [151,152]. Polysac-harides suffer from weak mechanical stability.
Parallel to the development of cross-linked polymers, Sogand Nakanishi made the fundamental studies [2,3,153] to synthe-ize continuous beds made of porous silica. The specific featureas that the monoliths contained a discrete bimodal pore sizeistribution made by large flow through pores in the micrometerore size range and smaller diffusive pores (meso pores) in them size range. Tanaka immediately recognized the added valuef the so-called “silica rods” as monolithic columns in HPLCnd made the pioneering investigations in close collaborationith Nakanishi and co-workers.Based on this concept Merck, Darmstadt, Germany, intro-
uced monolithic columns as 4.6 mm columns and as 100 �m
.D. capillaries.The major goals of applying monolithic columns in HPLCere to achieve high-speed separations; low column backpres-
ure and fast mass transfer kinetics [154].
toi[
gr. A 1184 (2008) 393–415 405
.2. Monolithic silica columns
.2.1. Formation processes and pore structure control ofilica monoliths
The starting silica sources are tetramethoxysilane, ter-raethoxysilane or n-alkyltrialkoxysilanes which are subjected tocid catalyzed hydrolysis and condensation in presence of wateroluble polymers such as polyethyleneglycols and polyacryliccid and surfactants as additives. The multicomponent solutiononverts into a sol–gel system by a nucleation and growth mech-nism in which small fractions of a finely dispersed phase grown size (see Fig. 5a) being limited by a thermally activated diffu-ion process. A second process, called spinodal decomposition,akes place leading to a co-continuous domain structure, whichemains stable over an extended period of time (see Fig. 5b). Theel morphology is controlled by the kinetics of two competitiverocesses: the domain coarsening and the structure freezing byhe sol–gel transition. The resulting gels are aged and a sol-ent exchange is performed to tailor the pore structure. Theacroporous gel domains are filled with the polymer, which
as been burned out by calcination after drying. The mesoporetructure and mesopore size is adjusted by hydrothermal treat-ent conditions. In this way the process enables to generate
wo continuous pore systems and to adjust and control the poreize, and porosity of macropores and mesopores independently2–4,153,156–171].
The manufacturing process of monolithic silica rods with.6 mm I.D. comprises the following consecutive steps: prepa-ation of the starting sol, phase separation and gelation, aging andrying. After drying the rods are cladded with poly(ether etheretone) (PEEK). Surface functionalization is performed in situ.he product is called Chromolith Performance and marketed byerck, Darmstadt, Germany.In case of fused silica capillaries the formation of the mono-
ithic structure occurs within the capillary. Fig. 6 shows anlectron scanning micrograph of the cross section of a 100 �m.D. capillary.
The bimodal pore structure of a Chromolith column is char-cterized by a distinct bimodal pore structure: macropores of�m in diameter and mesopores with an average pore diameterf approximately 13 nm. The total porosity of the monolithic col-mn amounts to 80% and higher, the larger proportion accountsor the macropores. The mesopores generate a specific surfacerea of approximately 300 m2/g.
Silica monoliths (rods) of 4.6 mm I.D. size were characterizedy the classical pore structure analysis such as nitrogen sorp-ion at 77 K, mercury intrusion, scanning electron microscopySEM) and transmission electron microscopy (TEM). As aesult the mesopore volume and macropore volume distribu-ion were assessed to detect the size of diffusive pore andhe size of flow through pores. Tanaka and co-worker intro-uced the parameter of domain size as a measure being theum of the thickness of the silica skeleton and the flow
hrough pore diameter. These authors stated that large ratiosf flow through pores to the skeleton size and a high poros-ty lead to high column efficiencies per unit pressure drop158].
406 K.K. Unger et al. / J. Chromatogr. A 1184 (2008) 393–415
F where( sponti r [15
ho6tehtpdda
d
Fc
acadcrlaCeu
ig. 5. (a) Nucleation and growth (diffusion limited) of silica-based monoliths,reproduced by the permission of author [155]). (b) Spinoidal decomposition (nterfaces grow exponentially with time (reproduced by the permission of autho
Unger et al. [172] examined the column performance andydrodynamic properties of a series of native silica monolithsf 4.6 mm I.D. with graded macropore size between 1.9 and�m at constant mesopore size of 12 nm. They also determined
he pore connectivity of the mesopores using the model of Mey-rs et al. [173,174]. They found, that the pore connectivity nTad a tendency to decrease with increasing macropore diame-er. Increasing macropore size lead also to increased theoreticallate heights at uoptimumn of the plate height linear velocityependencies. The column pressure drop vs. volume flow-rateependencies were lowest for the highest macropore diameter
nd increased with smaller flow-through pores.Tallarek and co-workers introduced the equivalent sphereimension as a parameter to compare monolithic silica columns
ig. 6. An electron scanning micrograph of the cross section of a 100 �m I.D.apillary (reproduced by the permission of author [155]).
c
totmemdmwrmpwtoolsdsw
dispersed domains with sharp interfaces grow by diffusion-controlled kineticsaneous) of silica-based monoliths, where interconnected domains with diffuse5]).
nd microparticulate packed silica columns [175–177]. Theylaimed that silica monoliths have to be described by two char-cteristic lengths: a characteristic length for the band dispersiondisp derived from the C-term of the H vs. u curve and a parti-le diameter dperm representing the hydraulic permeability. As aesult of this analysis applying insulin and angiotensin as ana-ytes on a C18 modified monolith they found that ddisp was 3.9nd 2.5 �m, respectively, and dperm 15.6 �m. In other words the18 bonded silica monolithic showed a column performancequivalent to approximately 3 �m packed column and a col-mn permeability comparable to approximately 15 �m packedolumn.
The structure of silica monoliths and the flexibility to tailorhe pore structure and the column format have initiated a numberf systematic studies to model and to simulate the pore struc-ure by the pore network model und to compare the results of
odel analysis with particle packed columns [178,179]. Liapist al. stated [179]: “The results of this work indicate that since inonoliths the size of through-pores could be controlled indepen-
ently from the size of the skeletons, then if one could constructonolith structures having (a) relatively large through-poresith high through-pore connectivity that can provide high flow-
ates at low pressure drops and (b) small-sized skeletons withesopores having an appropriate pore size distribution (meso-
ores having diameters that are relatively large when comparedith the diameter of the diffusing solute) and high pore connec-
ivity, nT, the following positive results, which are necessary forbtaining efficient separations, could be realized: (i) the valuef the pore diffusion coefficient, Dmp, of the solute would bearge, (ii) the diffusion path length in the skeletons would be
hort, (iii) the diffusion velocity, vD, would be high, and (iv) theiffusion response time, tdrt, would be small. Monoliths withuch pore structures could provide more efficient separationsith respect to (a) dynamic adsorptive capacity and (b) required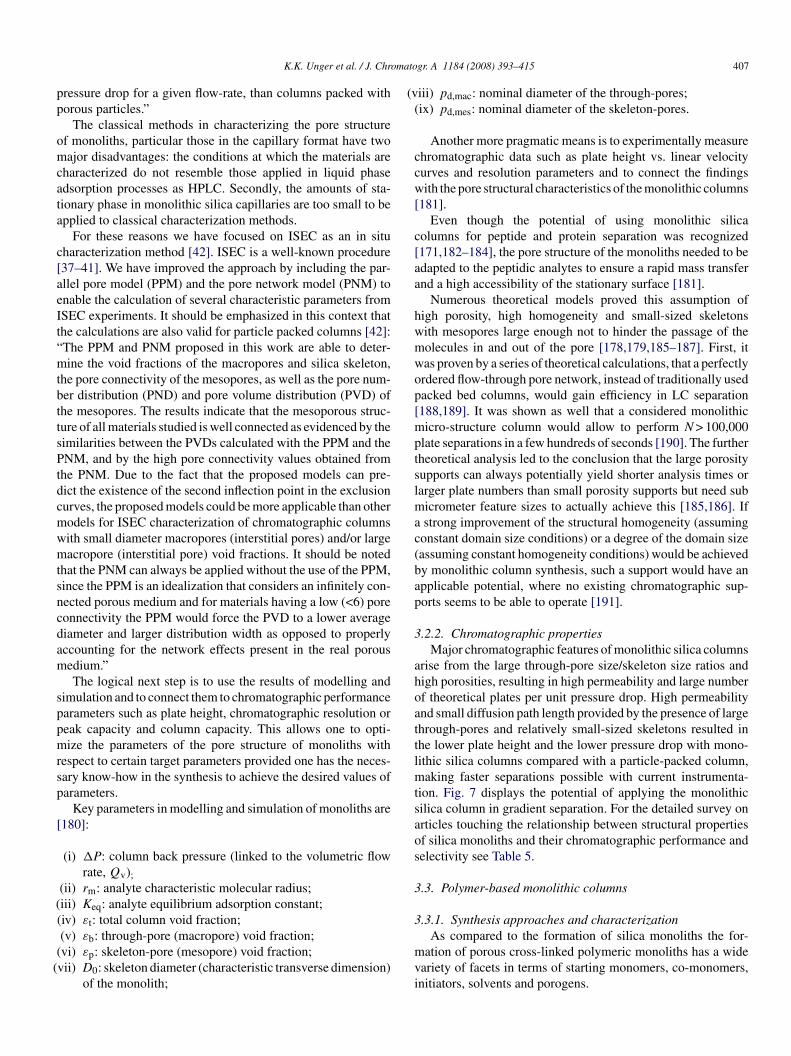
mato
pp
omcata
c[aeIt“mtbttsPtdcmwmtsncdam
sppmrsp
[
((
((
(v(
ccw[
c[aa
hwmwop[mptslmac(bap
3
ahoattlmtsaos
3
3
K.K. Unger et al. / J. Chro
ressure drop for a given flow-rate, than columns packed withorous particles.”
The classical methods in characterizing the pore structuref monoliths, particular those in the capillary format have twoajor disadvantages: the conditions at which the materials are
haracterized do not resemble those applied in liquid phasedsorption processes as HPLC. Secondly, the amounts of sta-ionary phase in monolithic silica capillaries are too small to bepplied to classical characterization methods.
For these reasons we have focused on ISEC as an in situharacterization method [42]. ISEC is a well-known procedure37–41]. We have improved the approach by including the par-llel pore model (PPM) and the pore network model (PNM) tonable the calculation of several characteristic parameters fromSEC experiments. It should be emphasized in this context thathe calculations are also valid for particle packed columns [42]:The PPM and PNM proposed in this work are able to deter-ine the void fractions of the macropores and silica skeleton,
he pore connectivity of the mesopores, as well as the pore num-er distribution (PND) and pore volume distribution (PVD) ofhe mesopores. The results indicate that the mesoporous struc-ure of all materials studied is well connected as evidenced by theimilarities between the PVDs calculated with the PPM and theNM, and by the high pore connectivity values obtained from
he PNM. Due to the fact that the proposed models can pre-ict the existence of the second inflection point in the exclusionurves, the proposed models could be more applicable than otherodels for ISEC characterization of chromatographic columnsith small diameter macropores (interstitial pores) and/or largeacropore (interstitial pore) void fractions. It should be noted
hat the PNM can always be applied without the use of the PPM,ince the PPM is an idealization that considers an infinitely con-ected porous medium and for materials having a low (<6) poreonnectivity the PPM would force the PVD to a lower averageiameter and larger distribution width as opposed to properlyccounting for the network effects present in the real porousedium.”The logical next step is to use the results of modelling and
imulation and to connect them to chromatographic performancearameters such as plate height, chromatographic resolution oreak capacity and column capacity. This allows one to opti-ize the parameters of the pore structure of monoliths with
espect to certain target parameters provided one has the neces-ary know-how in the synthesis to achieve the desired values ofarameters.
Key parameters in modelling and simulation of monoliths are180]:
(i) �P: column back pressure (linked to the volumetric flowrate, Qv);
(ii) rm: analyte characteristic molecular radius;iii) Keq: analyte equilibrium adsorption constant;iv) εt: total column void fraction;
(v) εb: through-pore (macropore) void fraction;vi) εp: skeleton-pore (mesopore) void fraction;vii) D0: skeleton diameter (characteristic transverse dimension)of the monolith;
mvi
gr. A 1184 (2008) 393–415 407
iii) pd,mac: nominal diameter of the through-pores;ix) pd,mes: nominal diameter of the skeleton-pores.
Another more pragmatic means is to experimentally measurehromatographic data such as plate height vs. linear velocityurves and resolution parameters and to connect the findingsith the pore structural characteristics of the monolithic columns
181].Even though the potential of using monolithic silica
olumns for peptide and protein separation was recognized171,182–184], the pore structure of the monoliths needed to bedapted to the peptidic analytes to ensure a rapid mass transfernd a high accessibility of the stationary surface [181].
Numerous theoretical models proved this assumption ofigh porosity, high homogeneity and small-sized skeletonsith mesopores large enough not to hinder the passage of theolecules in and out of the pore [178,179,185–187]. First, itas proven by a series of theoretical calculations, that a perfectlyrdered flow-through pore network, instead of traditionally usedacked bed columns, would gain efficiency in LC separation188,189]. It was shown as well that a considered monolithicicro-structure column would allow to perform N > 100,000
late separations in a few hundreds of seconds [190]. The furtherheoretical analysis led to the conclusion that the large porosityupports can always potentially yield shorter analysis times orarger plate numbers than small porosity supports but need sub
icrometer feature sizes to actually achieve this [185,186]. Ifstrong improvement of the structural homogeneity (assuming
onstant domain size conditions) or a degree of the domain sizeassuming constant homogeneity conditions) would be achievedy monolithic column synthesis, such a support would have anpplicable potential, where no existing chromatographic sup-orts seems to be able to operate [191].
.2.2. Chromatographic propertiesMajor chromatographic features of monolithic silica columns
rise from the large through-pore size/skeleton size ratios andigh porosities, resulting in high permeability and large numberf theoretical plates per unit pressure drop. High permeabilitynd small diffusion path length provided by the presence of largehrough-pores and relatively small-sized skeletons resulted inhe lower plate height and the lower pressure drop with mono-ithic silica columns compared with a particle-packed column,
aking faster separations possible with current instrumenta-ion. Fig. 7 displays the potential of applying the monolithicilica column in gradient separation. For the detailed survey onrticles touching the relationship between structural propertiesf silica monoliths and their chromatographic performance andelectivity see Table 5.
.3. Polymer-based monolithic columns
.3.1. Synthesis approaches and characterization
As compared to the formation of silica monoliths the for-ation of porous cross-linked polymeric monoliths has a wideariety of facets in terms of starting monomers, co-monomers,nitiators, solvents and porogens.

408 K.K. Unger et al. / J. Chromatogr. A 1184 (2008) 393–415
Table 5Survey on important research articles connecting the structural properties with the chromatographic properties of silica monoliths
Properties Subject and specific features in brief
Fast separation property due to the low-pressure dropacross the column
Monolithic silica rod columns can be prepared with independent control of the mesopores and thethrough-pores (macropores) [2–4,153,156–172]. As a result, chromatographic columns with highertotal porosity and bigger through-pore sizes as compared to particulate ones are obtained[4,158,169,192–194,175]. This enables one to perform faster separations[139,172,176,195–198,182,199–206].
High-efficiency property due to the fast mass transferkinetics and high binding capacity of monolithicsilica columns
Monolithic silica columns show high efficiency on the basis of the small-sized silica skeletonsproviding sufficient surface area for the separation and fast mass transfer kinetics due to thelarge-sized through-pores. Such monolithic silica columns were used as a robust and efficientseparation medium for the peptide mapping by reversed-phase HPLC [206], separation of biologicalmacromolecules [198,182] as well as separation of low molecular weight analytes[207,187,208–210].
ApplicationsAnalysis of low molecular weight analytes The structure and performance of monolithic silica based columns appeared to be very suitable for
the resolution of low molecular weight analytes up to 10 kDa [207,187,208–210].High throughput analysis of drugs and metabolites Monolithic high throughput characteristic application in the rapid separation of: microcystins and
nodularin [197], methylphenidate [211] and other drugs and their metabolites [212–216] proved to bebeneficial in separation time if compared with conventional particulate columns.
Separation of environmentally relevant substancesand food additives
Monolithic silica columns have been applied in: separations of pollutants or ions in water [217–224]and various applications in the field of food analysis [225–227].
Separation of enantiomers Monolithic silica columns have been used in the field of enantiomeric separation as a robust andefficient separation media [217,228–230].
Separation of complex biological samples Monolithic high-throughput characteristic application in the metabonomic studies of biofluid samples[196], the peptide mapping by reversed-phase HPLC [194,175,197,182,206,231] and biologicalmacromolecules [198,232,233].
Separation of complex biological samples in The low flow resistance feature of the monolithic silica columns enables one to use such separationplicat234–2
tesg
FrtpoAtHt1
t
multidimensional HPLC media in the comdecisive factors [
The syntheses of macroporous cross-linked polymers,
heir structural characterization and their application in size-xclusion chromatography (SEC) is described in depth in aurvey article by Seidl et al. [239]. The most in depth mono-raph in this field was published by. Svec et al. [240]. Theig. 7. Peak number as a function on the flow rate at gradient elution on aeversed phase monolithic column. The peak number was calculated accordingo a program integrated in Agilent software. The peak number is assumed to beroportional to the chromatographic resolution (reproduced by the permissionf E. Machtejevas, Merck, Darmstadt, Germany). Conditions: system, standardgilent HPLC 1100 system; column, chromolith 100 × 4.6 mm I.D. thermostat-
ed at 25 ◦C; sample, 48 �g (2 �L) human hemofiltrate; mobile phases, (A)
2O + 0.1% TFA, (B) ACN + 0.1% TFA; gradient volume, 20 mL; and gradientime, 0 min 95% A and 5% B; 20 min 50% A and 50% B; 22 min 0% A and00% B.
f
ddpaIot
mahovc
3
p
t
(
ed multidimensional HPLC, where usually column back pressure is one of the38].
ailoring of the morphology of polymeric monoliths is shownor methacrylate-ester based monoliths by Eltink et al. [241].
Typically, the pore texture of polymeric monoliths can beescribed as an assembly of fused micro globules with gradedensities. The interstices generate a macroporous system withore diameters in excess of 100 nm. The reported specific surfacerea is much smaller than those of monolithic silicas (<50 m2/g).t seems that smaller pores (mesopores and micropores) areften present to a minor degree, their appearance depends onhe solvent and the swelling properties of the material.
One major advantage of polymeric monoliths over silicaonoliths is the fact that the surface functionality can be gener-
ted and controlled by the use of appropriate co-monomers. Thusydrophobic, hydrophilic, polar and charged surfaces can bebtained. Also polymeric monoliths are manufactured in a wideariety of column formats as thin membranes, disks, capillaryolumns and large bore preparative columns.
.3.2. Chromatographic propertiesFor the detailed survey on the chromatographic properties of
olymeric monoliths, we refer to selected reading [242–245].In general, polymeric-based monolithic columns, concerning
heir chromatographic properties, are applied in two areas:
(i) as monolithic capillaries with hydrophobic and other func-
tionalities as capillaries in the separation of peptides andproteins, particular in the proteomics field [246–249];ii) as disks, rods and other formats in the isolation and purifica-tion of biopolymers. Poly(methylmethacrylate) monoliths

K.K. Unger et al. / J. Chromatogr. A 1184 (2008) 393–415 409
Table 6Structural and chromatographic parameters of monolithic silica columns Chromolith® Performance (RP 18e) and microparticulate silica columns (C18 reversedphase)
Property Monolithic silicas (chromolith) Microparticulate silicas
Pore structural dataPore modality Bimodal BimodalMeso pore diameter 13 nm 7–30 nmColumn porosity and specific pore volume, respectively Column porosity >80%, and pore
volume approximately 1 cm3/gSpecific pore volume of the particles0.3–1.1 cm3/g: column porosity depends onthe packing density of particles and can be inthe range of 40–60%
Macropore diameter 2 �m (flow through pores) Interstitial pores (pore size approximately40% of average particle size)
Column macroporosity Approximately 55% 35–50% (interstitial column porosity)Specific surface area 300 m2/g 70–510 m2/g
Chromatographic parametersColumn format (L; I.D.) 100 mm; 4.6 mm 100–250 mm, 4–4.6 mmColumn hardware PEEK Usually stainless steelColumn pressure drop <20 bar at 1 mL/min 40–150 bar at 1 mL/minVolume flow-rate range 0.01 mL/min–10 mL/min 0.01 mL/min–5 mL/minPlate height valuesa Approximately 12 �m >9 �mPlate number valuesa Approximately 80,000 N/m 30,000–110,000 N/m
C 4 to 1
(o
4p
uiclc
tvhat
mpdlvo
TC
P
PMMTPSCC
LPp
T
omparison data on commonly used C18 phases, of average particle size froma Values are given for a neutral compound.
are marketed by BIA Separations as Convective InteractionMedia (CIM).
The column performance characteristics of polymethylmethacrylate) monolithic capillaries under the aspectsf kinetic plots was studied in detail by Eeltink et al. [241].
. Comparison of the structure and performance ofarticle packed and monolithic columns
The column performance of a 5 �m C 18 bonded silica col-mn was compared with a monolithic C 18 bonded silica column
n Reversed Phase HPLC under isocratic conditions. The parti-le packed column showed a plate height H of 10–15 �m at ainear velocity of 1 mm/s. The H vs. u. curve of the monolithicolumn followed the same course but remained nearly parallelsclc
able 7omparison of pore structural and operational parameters of monolithic polymeric co
roperty Cross-linked polymeric monoliths
ore modality Unimodal (broad)acropore diameter 0.05–10.0 �macroporosity 10–95%
otal column porosity Low-density and high density monolithsore morphology Globular structureurface functionality Adjusted by functional co-monomersolumn format Preparative size to capillary formatsolumn pressure drop Distinct higher column back pressure as
compared to monolithic silica columnsinear velocity range 1–7 mm/s and higherlate height and plate numbers H = 5–10 �m at optimum uH range for application Acidic to strong alkaline
ypical application areas Separation of peptides and proteins (analyticIsolation and purification of biopolymers
0 �m.
o the abscissa up to a linear velocity of 7 mm/s. At this highelocity the packed column could not be operated due to theigh column back pressure. The monolithic RP column showedcolumn back pressure which was three to five times lower than
he particle packed column [169].A fundamental examination on the chromatographic perfor-
ance of monolithic silica columns as compared to particleacked columns was made by Leinweber et al. [175]. The bandispersion characteristics of insulin and angiotensin II on mono-ithic C18 bonded silica columns were examined. From the Hs. u curves the mechanical and non-mechanical contributionf the dispersion to the total plate height was analyzed. The
uperposition of the reduced plate height – reduced velocityurves indicated that the mass transfer properties of the mono-ithic columns in the mesopores corresponded to that of packedolumns with an equivalent dispersion particle diameter of 3 �m.lumns and research monolithic silica columns
Silica monoliths
Bimodal (macro + meso)1–10 �m40–70%0.8–0.9Spongy and worm-like structureIntroduced by grafting from and grafting on surface modificationAnalytical, microbore, capillary formats1/3–1/5 as compared to 5 �m packed columns
1–7 mm/s and higherH = 5–10 �m at optimum uAcidic to pH 8
al) Separation of low molecular weight compounds and peptides

4 atog
Ttsp
alt
imrt
cmo
5g
5
nprtTtnidatcb
Iiutlhit
cmf(aw
rhw
afe
fiim
pafa
sOalp
mci
ppaam
d
ss
A
aiGw
Ap
A
cupf(
10 K.K. Unger et al. / J. Chrom
he through pore system of the monolithic column controllinghe hydraulic permeability was translated into an interstitial poreystem of a packed bed. The comparison resulted in a equivalentermeability particle diameter of 15 �m.
Tanaka et al. [169] applied the kinetic plots (log t0/N vs. N)s a measure to demonstrate the superior performance of mono-ithic silica capillary columns vs. microparticle packed beds inhe capillary format.
In a more fundamental study Gzil et al. [185] treated thempact of variable bed porosity on the chromatographic perfor-
ance parameters. They defined limiting cases for separationsequiring small plate number and high plate numbers and linkedhis parameter to the optimum external porosity.
Tables 6 and 7 provide a comparison of the structural andhromatographic properties of monolithic silica columns andicroparticulate silica columns (Table 6) and the characteristics
f polymer based and monolithic silicas (Table 7).
. Conclusion – where are we now and where are weoing?
.1. Where are the needs and where are the alternatives?
The success of HPLC as a widely accepted separation tech-ique and platform at analytical scale, preparative scale androcess scale was a result of an interdisciplinary and integratedesearch and development combined with a rapid technologyransfer into effective, versatile robust and reliable systems.he central and most essential part of an HPLC system is
he separation column. More than 20 years of academic, tech-ical and engineering knowledge and experience have beennvested into the manufacture of selective, efficient, repro-ucible and robust columns. Most of the achievements madere based on experimental and technical experience knowinghe needs of the users and the demands in the respective appli-ation areas rather then on a solid fundamental theoreticalasis.
Contrary to many predictions and expectations, 4 and 4.6 mm.D. columns packed with microparticulate C18 bonded sil-cas dominate the market. There is a slight tendency to these of miniaturized column formats [250,251]. This meanshat microparticulate packed C18 columns will maintain itseading position as benchmark columns in the future. Theigh surface area and the relatively high mass loadabil-ty make them most suitable as working horses in HPLCechnology.
Miniaturized columns such as micro bore and fused silicaapillaries cover only a minor part in application. They areostly applied in research laboratories. The reasons for this
act are that firstly one needs a miniaturized HPLC equipmentat least for fused silica capillaries) and secondly, experiencend skills are required to operate such systems in an optimumay.
Monolithic columns are still the major subject of extensiveesearch. Monolithic columns as compared to particulate onesave the ability and potential of designing an optimum structure,hich will lead to designed columns with optimum performance
Ttfim
r. A 1184 (2008) 393–415
nd selectivity for the various facets of application areas. Apartrom this option monolithic columns offer a high robustness andasier maintenance than packed columns with frits.
Most of the modelling and simulation activities are seen in theeld of monolithic silicas. There is still an unexplored potential
n the fundamental understanding and design of polymer-basedonoliths.The results obtained on columns packed with 2 �m spherical
articles hyphenated to mass spectrometers as second separatorsnd detector will meet the current demands on sensitive andast high resolution separations in pharmaceutical and chemicalnalysis.
The future challenges and highest demands on liquid basedeparation techniques will originate in life science applications.n the top is the search for biomarkers for diagnostic purposes
nd the development of therapeutics. Related to that is the iso-ation and purification of biotech products such as recombinantroteins and vaccines by bio-processing.
The sample mixtures in bio fluids from human sources, ani-als and plants are extremely complex with regard to chemical
omposition and structure. They contain a large number of chem-cal entities and cover a large range of abundance ratio.
The resolution of such complex mixtures can be only accom-lished by using multidimensional LC systems with selectivehase systems in combination with powerful detection systems e.g. mass spectrometers. Selectivity is the key target parameternd can be achieved by a design of novel materials with superiorass transfer properties and advanced surface functionalities.The potential of packing and stationary phase design and
evelopment has not been explored to the full extent.Other powerful separation techniques based on electro-driven
ystems are still in their infancy and promise a high potential ofelective molecular recognition for polar and charged analytes.
cknowledgements
The authors are grateful to Dr. J. J. Kirkland, Dr. R. Ditznd Professor K. Sing for critical comments and suggestions tomprove the manuscript as well as to Merck KGaA, Darmstadt,ermany for financial, material, and intellectual support for thisork.
ppendix A. Survey on the most common methods ofarticle size analysis of HPLC packings
.1. Sieve and classification analysis
One of the oldest and easiest methods to determine the parti-le size distribution is the sieve analysis. Because of its ease ofse this method is widely applied in official methods, e.g. manyharmacopoeias (USP, Ph.Eur.). The mesh width of sieves, usedor sieve analysis, is standardized according to DIN-methodsDIN 4188) or US-standard methods (ASTM E11-70/E 161-70).
he most serious drawback of sieve analysis is the applica-ion range, which is to particles >20 �m. For the analysis ofner powders the sieve analysis has to be combined with otherethods.

mato
A
alwaiqoMlpt
tvdc
A
s
d
g(p
dfasMtst
yhvod1mm
rd
A
t
tpodacTsooeap
A
abtpatsoygt
hpstoma(
A
fi(dmfiwttdsci
K.K. Unger et al. / J. Chro
.2. Light scattering
When light hits a collective of particles it is partly absorbednd partly diffracted. The angle and the intensity of the diffractedight are depending on the size of the particle. At a constantavelength large particles diffract the light into small scattering
ngles and small particles with low intensity into high scatter-ng angles. The intensity of the diffracted light can be used foruantification. Several systems with different geometric designf the equipment have been developed over the last few years.ost of the systems use lasers as the source of focused light. As
ight scattering is a technique, which is applied to a multitude ofarticles, the biggest problems stems from the deconvolution ofhe obtained light pattern.
When comparing particle size distributions it is very impor-ant to know which instrument is used, because the recordedalues can be considerably affected by differences in opticsesign, software algorithms and sample preparation and con-entration [252–254].
.3. Sedimentation
The sedimentation of a particle in a liquid is dependent on itsize, density and form in accordance with Stoke’s law (Eq. (8)):
p =√
18η
(ρ − ρ0)g
√h
t(8)
, gravitation; h, falling height; t, falling time; η, viscosity;ρ − ρ0), difference in density between the particle and the dis-ersion solvent.
For particles as small as 0.5 �m the measurement can beone under the earth’s gravity. One of the oldest instrumentsor sedimentation analysis is the ANDREASEN-pipette, wheret definite times samples are withdrawn from a sedimentinguspension and the mass fraction is determined by weighing.
odern systems are working with light or X-ray detection ofhe particles passing by the analysis window. To speed up analy-is time the sample cell itself can be moved at a given rate passinghe detector (wide-angle scanning photo-sedimentometer).
Some prerequisites must be fulfilled for sedimentation anal-sis: the sedimentation liquid has to be totally inert and mustave a density, which is lower than the particle density. No con-ection within the liquid should take place due to temperaturer density gradients. As a high particle concentration can causeensity gradients, the particle concentration should be below%. For systems working with the earth’s gravitation the mini-um particle diameter is around 1 �m because of the Brownianotion, which disturbs the measurement of smaller particles.Sedimentation analysis gives relatively high resolution
esults and is used for a wide range of materials, including theetermination of agglomerates [255].
.4. Electronic measurements
The change of the electrical resistance is measured in an elec-ro zone stream counter. The system most commonly used is
mdrl
gr. A 1184 (2008) 393–415 411
he Coulter Counter. The particles of interest have to be sus-ended in a conducting electrolyte and are passed through anrifice, which is situated between two electrodes. For the con-ucting electrolyte the same prerequisites have to be fulfilleds for the suspension liquid in sedimentation analysis. In mostases sodium chloride solutions at low concentrations are used.he particles within the suspension liquid are forced through themall orifice by means of a controlled vacuum. On either sidef the orifice two electrodes are mounted. Due to the presencef a particle within the inspection zone, which exhibits a highlectrical field, the resistance of the electrolyte changes, gener-ting a voltage pulse the amplitude of which is assumed to beroportional to the volume of the particles.
.5. Microscopic methods
Microscopic methods are characterized by a particular dis-dvantage and one great advantage. The disadvantage is giveny the fact that only a small population of particles is used forhe determination of the particle size distribution. Before therograms of computer-automated image analysis became avail-ble the determination of the particles size distribution was veryedious and laborious since it involved direct comparison withets of reference circles (the reticule, engraved on the eyepiecef the microscope). Even with the newest powerful image anal-sis programs hundreds of digitized images may be required toet enough information to establish statistical significance forhe particle size determination.
The biggest advantage, which all image analysis systemsave in common, is the shape information obtained from singlearticles. Only by using microscopic techniques is it pos-ible to judge the quality of a chromatographic sorbent inerms of its physical uniformity. The most valuable informationbtained from microscopy is the determination of fines in theicrometer and sub-micron range attached to particles (Fig. 8A)
nd the identification of miss-formed and broken particlesFig. 8B).
.6. Field flow fractionation
The combination of two different forces is used in theeld flow fractionation technique (FFF), where a gravitationalGFFF) or centrifugal field is applied perpendicular to a flowirection. The particles are placed in an empty capillary andoved by the liquid flow in one direction. Due to the appliedeld the particles are forced according to their size towards aall of the capillary. The particles are driven by the mobile phase
owards the capillary outlet at different velocities depending onheir size. The particle size distribution is recorded by an UV-etector placed at the end of the capillary. With this instrumentaletup it is possible to determine the particle size distribution ofhromatographic sorbents either of inorganic or organic naturen the particle size range from 1 to 100 �m [256–258]. The
ethod is supposed to be accurate, fast and inexpensive, as stan-ard HPLC equipment can be used for the measurement. Onlyecently first attempts have been made to set up a standard-ess method for the measurement of silica particles. The method

412 K.K. Unger et al. / J. Chromatog
Fig. 8. Scanning electron microscopy-pictures of different silica sorbents (repro-duced by permission of Merck, Darmstadt, Germany). (A) Nucleoprep 100-30(1p
as
R
25–40 �m) (magnification ×3000), small attached particles. (B) Zorbax LP00/40 Si (40 �m) (magnification ×100), high content of misformed and brokenarticles.
llows the direct conversion of fractograms into quantitative,ize-distribution profiles without calibration of the system [259].
eferences
[1] W. Weigert, E. Koberstein, Angew. Chem. 88 (1976) 657.[2] K. Nakanishi, N. Soga, J. Am. Ceram. Soc. 74 (1991) 2518.[3] K. Nakanishi, N. Soga, J. Non Cryst. Solids 139 (1992) 1.[4] H. Minakuchi, K. Nakanishi, N. Soga, N. Ishizuka, N. Tanaka, Anal.
Chem. 68 (1996) 3498.[5] T.B. Tennikova, F. Svec, B.G. Belenkii, J. Liq. Chromatogr. 13 (1990)
63.[6] C. du Fresne von Hohenesche, Ph.D. thesis, University of Mainz, 2002.[7] S. Luedtke, Th. Adam, K.K. Unger, J. Chromatogr. A 786 (1997) 229.[8] B.A. Grimes, S. Ludtke, K.K. Unger, A.I. Liapis, J. Chromatogr. A 979
(2002) 447.[9] I. Nischang, G. Chen, U. Tallarek, J. Chromatogr. A 1109 (2006) 32.
[10] F.C. Leinweber, U. Tallarek, J. Phys. Chem. B. 109 (2005) 21481.[11] F. Leinweber, M. Pfafferodt, A. Seidel-Morgenstern, U. Tallarek, Anal.
Chem. 77 (2005) 5839.[12] I. Nischang, K. Spannmann, U. Tallarek, Anal. Chem. 78 (2006) 3601.[13] C. du Fresne von Hohenesche, V. Ehwald, K.K. Unger, J. Chromatogr. A
1025 (2004) 177.[14] M. Verzele, C. Dewaele, J. Chromatogr. 391 (1987) 111.[15] P.G. Bird, US Pat. 2,244 325, assigned to P. G. Bird (1945).[16] W. Stober, A. Fink, E. Bohm, J. Colloid Interface Sci. 26 (1968) 62.[17] R.K. Iler, The Chemistry of Silica, Wiley, New York, 1979, p. 866.
r. A 1184 (2008) 393–415
[18] K.K. Unger, Porous Silica, its Properties and Use as a Support in ColumnLiquid Chromatography, Elsevier, Amsterdam, 1979, p. 77.
[19] D. Barby, in: G.D. Parfitt, G.S.W. Sing (Eds.), Characterization of PowderSubstances, Academic Press, London, UK, 1976, p. 353.
[20] C.J. Brinker, G.W. Scherer, Sol–Gel Science, Academic Press, New York,1990, p. 303.
[21] L.L. Hench, J.K. West, Chem. Rev. 90 (1990) 33.[22] G.W. Scherer, J. Non-Cryst. Solids 147 (1992) 363.[23] G.W. Scherer, in: A.S. Mujumdar (Ed.), Drying’92, Elsevier, Amsterdam,
1992, p. 92.[24] Ullmann’s Encyclopedia of Industrial Chemistry, vol. A23, Silica, VCH,
Weinheim, 1993, Chapter 6.[25] H. Reinhardt, A. Becker, R. Kuhlmann, P. Nauroth (Degussa AG) DE-OS
3 639 845, 1986.[26] G. Buechel, M. Gruen, K.K. Unger, A. Matsumoto, K. Tsutsumi, J.
Supramolec. Sci. 5 (1998) 253.[27] K.K. Unger, D. Kumar, M. Gruen, G. Buechel, S. Luedtke, Th. Adam, K.
Schumacher, S. Renker, J. Chromatogr. A 892 (2000) 47.[28] B.A. Grimes, A.I. Liapis, personal communication.[29] K.K. Unger, G. Jilge, J.N. Kinkel, M.T.W. Hearn, J. Chromatogr. 359
(1986) 61.[30] G. Jilge, R. Janzen, H. Giesche, K.K. Unger, J.N. Kinkel, M.T.W. Hearn,
J. Chromatogr. 397 (1987) 71.[31] R. Janzen, K.K. Unger, H. Giesche, J.N. Kinkel, M.T.W. Hearn, J. Chro-
matogr. 397 (1987) 91.[32] G. Jilge, K.K. Unger, U. Esser, H.-J. Schafer, G. Rathgeber, W. Muller,
J. Chromatogr. (1989) 135.[33] J.J. Meyers, A.I. Liapis, J. Chromatogr. A 827 (1998) 197.[34] J.J. Meyers, et al., J. Chromatogr. A 908 (2001) 35.[35] A.I. Liapis, J. Chromatogr. A 865 (1999) 13.[36] F. Rouquerol, J. Rouquerol, K.S.W. Sing, Adsorption by Powders and
Porous Solids, Academic Press, London, 1999.[37] I. Halasz, K. Martin, Ber. Bunsenges. Phys. Chem. 79 (1975) 731.[38] I. Halasz, K. Martin, Angew. Chem., Int. Ed. Engl. 17 (1978) 901.[39] J.H. Knox, H.P. Scott, J. Chromatogr. 316 (1984) 311.[40] A.A. Gorbunov, L. Ya. Solovyova, V.A. Pasechnik, Vysokomol. Soedin.
Ser. A 26 (1984) 967.[41] A.A. Gorbunov, L.Ya. Solovyova, V.A. Pasechnik, J. Chromatogr. 448
(1988) 307.[42] B.A. Grimes, R. Skudas, K.K. Unger, D. Lubda, J. Chromatogr. A 1144
(2007) 14.[43] A. Kurganov, V. Davankov, T. Isajeva, J. Chromatogr. A 660 (1994)
97.[44] M. Ousalem, X.X. Zhu, J. Hradil, J. Chromatogr. A 903 (2000) 13.[45] K. Jerabek, K.J. Shea, D.Y. Sasaki, G.J. Stoddard, J. Polym. Sci. A: Polym.
Chem. 30 (2003) 605.[46] Y. Yao, A.M. Lenhoff, J. Chromatogr. A 1037 (2004) 273.[47] J.S. Beck, J.C. Vartuli, W.J. Roth, M.E. Leonowicz, C.T. Kresge, K.D
Schmitt, C.T.-W. Chu, D.H. Olson, E.W Sheppard, S.B. McCullen, J.B.Higgins, J.L. Schlenker, J. Am. Chem. Soc. 114 (10) (1992) 834.
[48] C.T. Kresge, M.E. Leonowicz, W.J. Roth, J.C. Vartulli, J.C. Beck, Nature359 (1992) 710.
[49] O. Lauer, Grain Size Measurements on Commercial Powders, Alpine,Augsburg, 1962.
[50] Process Technology for Tomorrow, Hosokawa Alpine Augsburg, Ger-many, 2007.
[51] M. Shapiro, V. Galperin, Chem. Eng. Proc. 44 (2005) 279.[52] J.H. Perry, Chemical Engineers Handbook, third ed., McGraw Hill, New
York, 1950.[53] R.H. Davis, A. Acrivos, Ann. Rev. Fluid Mech. 17 (1985) 91.[54] J.T. Roscoe, Fundamental Research Statistics for the Behavioral Sciences,
Holt, Rinehart and Winston, New York, 1975.[55] T. Allen, Particle Size Measurement, Chapman and Hall, London, 1974.
[56] Kromasil – for your analytical HPLC, Eka Chemicals, Bohus, Sweden,2006.[57] L.R. Snyder, J.J. Kirkland, Introduction to Modern Liquid Chromatogra-
phy, second ed., Wiley, New York, 1979, Chapter 5.[58] J.J. Kirkland, J. Chromatogr. Sci. 9 (1971) 206.

mato
K.K. Unger et al. / J. Chro[59] U.D. Neue, HPLC columns, Wiley-VCH, New York, 1997, p. 93 (Chapter5).
[60] R.G. Avery, J.D. Ramsay, J. Colloid Interface Sci. 42 (1973) 597.[61] J.J. Kirkland, J.J. DeStefano, J. Chromatogr. A 1126 (2006) 50.[62] J. Dingenen, Anal. Mag. 26 (1998) M18.[63] E. Godbille, P. Devaux, J. Chromatogr. 122 (1976) 317.[64] H. Colin, P. Hilaireau, J. de Tournemire, LC–GC 8 (1990) 302.[65] D.-R. Wu, K. Lohse, J. Chromatogr. A 658 (1994) 381.[66] M. Sarker, G. Guiochon, J. Chromatogr. A 702 (1995) 27.[67] M. Sarker, G. Guiochon, J. Chromatogr. A 709 (1995) 227.[68] J.N. Little, R.L. Cotter, J.A. Prendergast, P.D. McDonald, J. Chromatogr.
126 (1976) 439.[69] P.D. McDonald, R.V. Vivilecchia, D.R. Lorenz, US Patent 4,211,658
(1980).[70] C.W. Rausch, Y. Tuvin, U.D. Neue, US Patent 4,228,007 (1980).[71] P.D. McDonald, C.W. Rausch, US Patent 4,250,035 (1981).[72] M. Sarker, G. Guiochon, J. Chromatogr. A 683 (1994) 293.[73] M. Sarker, Y. Yun, G. Guiochon, J. Chromatogr. A 728 (1996) 3.[74] L.A. Colon, T.D. Maloney, A.M. Fermier, J. Chromatogr. A 887 (2000)
43.[75] R.J. Boughtflower, T. Underwood, C.J. Paterson, Chromatographia 40
(1995) 329.[76] M.M. Robson, S. Roulin, S.M. Shariff, M.W. Raynor, K.D. Bartle, A.A.
Clifford, P. Meyers, C.M. Euerby, C.M. Johnson, Chromatographia 43(1996) 313.
[77] R. Stol, M. Mazereeuw, U.R. Tjaden, J. van der Greef, J. Chromatogr. A873 (2000) 293.
[78] A.M. Fermier, L. Colon, J. Microcolumn Sep. 10 (1998) 439.[79] T. Adam, K.K. Unger, M.M. Dittmann, G.P. Rozing, J. Chromatogr. A
887 (2000) 327.[80] C. Fujimoto, Anal. Sci. 18 (2002) 19.[81] J.B. Miller, TrAC 10 (1991) 9.[82] E. Bayer, W. Muller, M. Ilg, K. Albert, Angew. Chem. 101 (1989) 1033.[83] U. Tallarek, E. Bayer, D. van Dusschoten, T. Scheenen, H. Van As, G.
Guichon, U.D. Neue, AIChE J. 44 (1998) 1962.[84] U. Tallarek, E. Baumeister, K. Albert, E. Bayer, G. Guiochon, J. Chro-
matogr. A 696 (1995) 1.[85] J. Karger, H. Pfeifer, W. Heink, Adv. Mag. Reson. 12 (1988) 1.[86] U. Tallarek, D. van Dusschoten, M. Von As, E. Bayer, G. Guiochon, J.
Phys. Chem. B 102 (1998) 3486.[87] U. Tallarek, F.J. Vergeldt, H. Van As, J. Phys. Chem. B 103 (1999)
7654.[88] J. Kraak, R. Ostervink, H. Poppe, U. Esser, K.K. Unger, Chromatographia
27 (1989) 585.[89] M. Hallmann, Ph.D. thesis, University Mainz, Germany, 1995.[90] J.H. Knox, High Performance Liquid Chromatography, Edinburgh Uni-
versity Press, Edinburgh, Scotland, 1978, p. 9.[91] H. Poppe, J. Chromatogr. A 778 (1997) 3.[92] G. Guiochon, in: Cs. Horvath (Ed.), Optimization in Liquid Chromatogra-
phy, HPLC, Advances and Perspectives, Academic Press, London, 1980,p. 1.
[93] J.P. Martin, R.L. Synge, Biochem. J. 35 (1941) 1358.[94] J.J. van Deemter, F.J. Zuiderweg, A. Klinkenberg, Chem. Eng. Sci. 5
(1956) 271.[95] J.C. Giddings, J. Chromatogr. 5 (1961) 47.[96] J.C. Giddings, J. Chromatogr. 5 (1961) 61.[97] K.H. Hamaker, M.R. Ladisch, Sep. Purif. Methods 25 (1996) 47.[98] A. Bristow, J.H. Knox, Chromatographia 10 (1977) 279.[99] J.F.K. Huber, Ber. Bunsenges. Phys. Chem. 77 (1973) 179.
[100] K.K. Unger, W. Messer, K.F. Krebs, J. Chromatogr. A 149 (1978) 1.[101] F. Gritti, G. Guiochon, J. Chromatogr. A 1166 (2007) 30.[102] R.W. Stout, J.J. Destefano, L.R. Snyder, J. Chromatogr. 282 (1983) 263.[103] N. Tanaka, H. Kobayashi, N. Ishizuka, H. Minaguchi, K. Nakanishi, K.
Hosoya, T. Ikegami, J. Chromatogr. A 965 (2002) 35.[104] P. Gzil, N. Verwoort, G.V. Baron, G. Desmet, Anal. Chem. 76 (2004)
6707.[105] E.C. Vonk, B.M.W. Langeveld-Voss, J.L.J. van Dongen, R.A.J. Janssen,
H.A. Claessens, C.A. Cramers, J. Chromatogr. A 911 (2001) 13.
gr. A 1184 (2008) 393–415 413
[106] A. Mendez, E. Bosch, M. Roses, U.D. Neue, J. Chromatogr. A 986 (2003)33.
[107] P. Dehouck, D. Visky, Z. Kovacs, B. Noszal, E. Adams, J. Hoogmartens,LC–GC Europe (2003) 2.
[108] N.S. Wilson, J. Gilroy, J.W. Dolan, L.R. Snyder, J. Chromatogr. A 1026(2004) 91.
[109] L.R. Snyder, J.W. Dolan, P.W. Carr, J. Chromatogr. A 1060 (2004) 77.[110] L.R. Snyder, J.W. Dolan, P.W. Carr, Anal. Chem. (2007) 3255.[111] I. Halasz, R. Endele, J. Asshauer, J. Chromatogr. 122 (1975) 37.[112] J.H. Knox, J. Chromatogr. Sci. 15 (1977) 352.[113] H. Poppe, J.C. Kraak, J.F.K. Huber, J.H.M. van der Berg, Chro-
matographia 14 (1981) 515.[114] H. Giesche, K.K. Unger, U. Esser, B. Erray, U. Trudinger, J. Chromatogr.
465 (1989) 39.[115] T. Issaeva, A. Kourganov, K.K. Unger, J. Chromatogr. A 846 (1999) 13.[116] J. MacNair, K.D. Patel, J.W. Jorgensen, Anal. Chem. 71 (1999) 700.[117] H. Engelhardt, J. Asshauer, U. Neue, N. Weigand, Anal. Chem. 46 (1974)
336A.[118] J.R. Mazzeo, U.D. Neue, M. Kele, R.S. Plumb, Anal. Chem. (2005) 460A.[119] Patent WO 03/014450A1, PCT/US02/25193, February 20, 2003.[120] K.K. Unger, N. Becker, P. Roumeliotis, J. Chromatogr. 125 (1976) 115.[121] E.S. Grumbach, Th.E. Wheat, J.R. Masseo, Aquity UPLC System, Appli-
cation Notebook, Waters, Milford, MA, March 2006, p. 6.[122] S. Luedtke, Th. Adam, N. von Doehren, K.K. Unger, J. Chromatogr. A
887 (2000) 339.[123] I. Nischang, U. Tallarek, Electrophoresis 28 (2007) 611.[124] C.G. Hovath, B.A. Preiss, S.R. Lipsky, Anal. Chem. 39 (1967) 1422.[125] C.G. Hovath, S.R. Lipsky, Anal. Chem. 41 (1969) 1227.[126] K. Unger, P. Ringe, J. Schick-Kalb, B. Straube, Z. Anal. Chem. 264 (1973)
267.[127] K.K. Unger, J. Schick-Kalb, B. Straube, in: S. Modry, M. Svata (Eds.),
Pore Structure and Properties of Materials, Academia, Prague, 1974, p.B47.
[128] G.J. Kennedy, J.H. Knox, J. Chromatogr. Sci. 10 (1972) 549.[129] K.K. Unger, J. Chromatogr. A 1000 (2004) 1 (Table 3, p. 4).[130] J.P.C. Vissers, J. Chromatogr. A 856 (1999) 117.[131] P. Roumeliotis, M. Chatziathanassiou, K.K. Unger, Chromatographia 19
(1984) 145.[132] G. Rozing, LC–GC–LC Col. Technol. Suppl. June (2004) 12–16.[133] E. Rapp, U. Tallarek, J. Sep. Sci. 26 (2003) 453.[134] Y. Shen, R.D. Smith, K.K. Unger, D. Kumar, D. Lubda, Anal. Chem. 77
(2005) 6692.[135] G. Rozing, Recent developments in LC column technology, LC–GC June
(2003) 2–7.[136] J.H. Knox, H.M. Pyper, J. Chromatogr. 363 (1986) 1.[137] L.R. Snyder, J.J. Kirkland, J.L. Glajch, Practical HPLC Method Devel-
opment, second ed., Wiley, New York, 1997, p. 50.[138] D.M. McCalley, J. Chromatogr. A 793 (1998) 31.[139] D.M. McCalley, Anal. Chem. 75 (2003) 3404.[140] St.M.C. Buckenmeiser, D.M. McCalley, M.R Euerby, Anal. Chem. 74
(2004) 4672.[141] Q. Luo, Y. Shen, K.K. Hixon, R. Zhao, F. Yang, R.J. Moore, H.M. Mottaz,
R.D. Smith, Anal. Chem. 77 (2005) 5028.[142] M. Kubin, P. Spacek, P. Chromecek, Coll. Czechosl. Chem. Commun. 32
(1967) 3881.[143] W.D. Ross, R.T. Jefferson, J. Chromatogr. Sci. 8 (1970) 386.[144] F.D. Hileman, R.E. Sievers, G.G. Hess, W.D. Ross, Anal. Chem. 45 (1973)
1126.[145] S. Hjerten, J.L. Liao, R. Zhang, J. Chromatogr. A 473 (1989) 273.[146] F. Svec, J.M.J. Frechet, Anal. Chem. 54 (1992) 820.[147] A. Premstaller, H. Oberacher, C.G. Huber, Anal. Chem. 72 (2000) 4386.[148] M.R. Buchmeiser, N. Atzl, G.K. Bonn, J. Am. Chem. Soc. 119 (1997)
9166.
[149] P.-E. Gustavsson, P.-O. Larsson, J. Chromatogr. A 925 (2001) 69.[150] M. Khayyami, M.T. Perez Pita, N. Pena Garcia, G. Johansson, B. Daniels-son, P.-O. Larsson, Talanta 45 (1998) 557.[151] D. Zhou, H. Zou, J. Ni, L. Yang, L. Jia, Q. Zhang, Y. Zhang, Anal. Chem.
71 (1999) 155.

4 atog
14 K.K. Unger et al. / J. Chrom[152] K. Hamaker, S.-L. Rau, R. Hendrickson, J. Liu, C.M. ladisch, M.R.Ladisch, Ind. Eng. Chem. Res. 38 (1999) 865.
[153] K. Nakanishi, N. Soga, J. Non Cryst. Solids 139 (1992) 14.[154] A.M. Siuoffi, J. Chromatogr. A 1000 (2003) 801.[155] D. Lubda, Ph.D. thesis, University of Vienna, 2004.[156] K. Nakanishi, J. Porous Mater. 4 (1997) 67.[157] K. Nakanishi, H. Minakuchi, N. Soga, N. Tanaka, J. Sol–Gel. Sci. Technol.
8 (1997) 547.[158] H. Minakuchi, K. Nakanishi, N. Soga, N. Ishizuka, N. Tanaka, J. Chro-
matogr. A 762 (1997) 135.[159] K. Nakanishi, H. Minakuchi, N. Soga, N. Tanaka, J. Sol–Gel. Sci. Technol.
13 (1998) 163.[160] N. Ishizuka, H. Minakuchi, K. Nakanishi, N. Soga, K. Hosoya, N. Tanaka,
J. Chromatogr. A 797 (1998) 133.[161] K. Cabrera, G. Wieland, D. Lubda, K. Nakanishi, N. Soga, H. Minakuchi,
K.K. Unger, TrAC 17 (1998) 50.[162] K. Nakanishi, J. Sol–Gel Sci. Technol. 19 (2000) 65.[163] N. Ishizuka, K. Nakanishi, K. Hirao, J. Sol–Gel. Sci. Technol. 19 (2000)
371.[164] K. Cabrera, D. Lubda, H. Minakuchi, K. Nakanishi, J. High Resolut.
Chromatogr. Commun. 23 (2000) 81.[165] K. Nakanishi, K. Cabrera, D. Lubda, J. High Resolut. Chromatogr. 23
(2000) 111.[166] P. Zoellner, A. Leitner, D. Lubda, K. Cabrera, W. Lindner, Chro-
matographia 52 (2000) 818.[167] D. Lubda, K. Cabrera, H. Minakuchi, K. Nakanishi, J. Sol–Gel Sci.
Technol. 23 (2002) 185.[168] M. Motokawa, H. Kobayashi, N. Ishizuka, H. Minakuchi, K. Nakanishi,
H. Jinnai, K. Hosoya, T. Ikegami, N. Tanaka, J. Chromatogr. A 961 (2002)53.
[169] N. Tanaka, H. Kobayashi, N. Ishizuka, H. Minakuchi, K. Nakanishi, K.Hosoya, T. Ikegami, J. Chromatogr. A 965 (2002) 35.
[170] N. Tanaka, H. Kobayashi, Anal. Bioanal. Chem. 376 (2003) 298.[171] K. Cabrera, J. Sep. Sci. 27 (2004) 843.[172] K.K. Unger, B. Bidlingmaier, C. du Fresne von Hohenesche, D. Lubda,
in: F. Rodriguez-Reinoso, B. McEnany, J. Rouquerol, K.K. Unger (Eds.),Characterization of Porous Solids VI, Elsevier, Amsterdam, 2002, p. 115.
[173] J.J. Meyers, S. Nahar, D.K. Ludlow, A.I. Liapis, J. Chromatogr. A 907(2001) 57.
[174] J.J. Meyers, O.K. Crosser, A.I. Liapis, J. Chromatogr. A 908 (2001) 35.[175] F.C. Leinweber, D. Lubda, K. Cabrera, U. Tallarek, Anal. Chem. 74 (2002)
2470.[176] U. Tallarek, F.C. Leinweber, A. Seidel-Morgenstern, Chem. Eng. Technol.
25 (2002) 1177.[177] F.C. Leinweber, U. Tallarek, J. Chromatogr. A 1006 (2003) 207.[178] J.J. Meyers, A.I. Liapis, J. Chromatogr. A 852 (1999) 3.[179] A.I. Liapis, J.J. Meyers, O.K. Crosser, J. Chromatogr. A 865 (1999) 13.[180] B.A. Brian, R. Skudas, K.K. Unger, in preparation.[181] R. Skudas, B.A. Grimes, E. Machtejevas, V. Kudirkaite, T.P. Hnnessy, D.
Lubda, K.K. Unger, J. Chromatogr. A 1144 (2007) 72.[182] L. Xiong, R. Zhang, F.E. Regnier, J. Chromatogr. A 1030 (2004) 187.[183] B. Barroso, D. Lubda, R. Bischoff, J. Proteome Res. 2 (2003) 633.[184] L. Rieux, H. Niederlander, E. Verpoorte, R. Bischoff, J. Sep. Sci. 28
(2005) 1628.[185] P. Gzil, N. Vervoort, G.V. Baron, G. Desmet, Anal. Chem. 76 (2004)
6707.[186] N. Vervoort, P. Gzil, G.V. Baron, G. Desmet, J. Chromatogr. A 1030
(2004) 177.[187] F. Gritti, W. Piatkowski, G. Guiochon, J. Chromatogr. A 978 (2002) 81.[188] P. Gzil, N. Vervoort, G.V. Baron, G. Desmet, Anal. Chem. 75 (2003) 6244.[189] J. De Smet, P. Gzil, N. Vervoort, H. Verelst, G.V. Baron, G. Desmet, Anal.
Chem. 76 (2004) 3716.[190] P. Gzil, G.V. Baron, G. Desmet, J. Chromatogr. A 991 (2003) 169.
[191] P. Gzil, J. De Smet, G. Desmet, J. Sep. Sci. 29 (2006) 1675.[192] H. Minakuchi, N. Ishizuka, K. Nakanishi, N. Soga, N. Tanaka, J. Chro-matogr. A 797 (1998) 121.[193] H. Minakuchi, N. Ishizuka, K. Nakanishi, N. Soga, N Tanaka, J. Chro-
matogr. A 797 (1998) 133.
r. A 1184 (2008) 393–415
[194] H. Minakuchi, N. Ishizuka, K. Nakanishi, N. Soga, N. Tanaka, J. Chro-matogr. A 828 (1998) 83.
[195] B. Bidlingmaier, N. von Doehren, K.K. Unger, J. Chromatogr. A 832(1999) 11.
[196] H. Pham-Tuan, L. Kaskavelis, C.A. Daykin, H.-G. Janssen, J. Chro-matogr. B 789 (2003) 283.
[197] L. Spoof, J. Meriluoto, J. Chromatogr. A 947 (2002) 237.[198] L. Rieux, H. Niederlander, E. Verpoorte, R. Bischoff, J. Sep. Sci. 28
(2005) 1628.[199] Y. Chun, C.F. Poole, J. Chromatogr. A 1003 (2003) 113.[200] M.R. Euerby, P. Petersson, J. Chromatogr. A 994 (2003) 13.[201] J.J. Gilroy, J.W. Dolan, L.R. Snyder, J. Chromatogr. A 1000 (2003) 801.[202] F. Gritti, G. Guiochon, Anal. Chem. 75 (2003) 5726.[203] P. Jandera, M. Halama, K. Novotna, S. Buncekova, Chromatographia 57
(2003) 153.[204] D.V. McCalley, J. Chromatogr. A 987 (2003) 17.[205] C. Stella, P. Seuret, S. Rudaz, P.-A. Carrupt, J.-Y. Gauvrit, P. Lanteri, J.-L.
Veuthey, Chimia 57 (2003) 210.[206] T.P. Hennessy, R.I. Boysen, M.I. Huber, K.K. Unger, M.T.W. Hearn, J.
Chromatogr. A 1009 (2003) 15.[207] B. Chankvetnadze, C. Yamamoto, Y. Okamoto, Chem. Lett. 32 (2003)
850.[208] F.C. Leinweber, D.G. Schmid, D. Lubda, K.-H. Weismuller, G. Jung, U.
Tallarek, Rapid Commun. Mass Spectrom. 17 (2003) 1180.[209] D. Lubda, K. Cabrera, N. Nakanischi, W. Lindner, Anal. Bioanal. Chem.
377 (2003) 892.[210] D. Lubda, W. Lindner, J. Chromatogr. A 1036 (2004) 135.[211] N. Barbarin, B.D. Mawhinney, R. Black, J. Henion, J. Chromatogr. B 783
(2003) 73.[212] Y. Hsieh, G. Wang, Y. Wang, S. Chackalamannil, J.-M. Brisson, K. Ng,
W.A. Korfmacher, Rapid Commun. Mass Spectrom. 16 (2002) 944.[213] A.M. van Nederkassel, A. Aerts, A. Dierick, D.L. Massart, Y. Van der
Heyden, J. Pharm. Biomed. Anal. 32 (2003) 233.[214] G. Dear, R. Plumb, D. Mallet, Rapid Commun. Mass Spectrom. 15 (2001)
152.[215] K. Pihlainen, E. Sippola, R. Kostiainen, J. Chromatogr. A 994 (2003) 93.[216] F. Gerber, M. Krummen, H. Potgeter, A. Roth, Ch. Siffrin, Ch. Spoendlin,
J. Chromatogr. A 1036 (2004) 127.[217] Q. Xu, M. Mori, K. Tanaka, M. Ikedo, W. Hu, J. Chromatogr. A 1026
(2004) 191.[218] T. Koal, A. Asperger, J. Efer, W. Engewald, Chromatographia 57 (2003)
93.[219] Q. Xu, K. Tanaka, M. Mori, M.I.H. Helaleh, H. Toada, W. Hu, K. Hasebe,
Chromatographia 57 (2003) 19.[220] Q. Xu, K. Tanaka, M. Mori, M.I.H. Helaleh, W. Hu, K. Hasebe, H. Toada,
J. Chromatogr. A 997 (2003) 183.[221] A. Asperger, J. Efer, Th. Koal, W. Engewald, J. Chromatogr. A 960 (2002)
109.[222] J. Efer, Th. Koal, A. Asperger, W. Engewald, GIT Special Sep. 22 (2002)
58.[223] A. Asperger, J. Efer, Th. Koal, W. Engewald, J. Chromatogr. A 937 (2001)
65.[224] P. Hatsis, Ch.A. Lucy, Analyst 127 (2002) 451.[225] P. Zollner, A. Leitner, D. Lubda, K. Cabrera, W. Lindner, Chro-
matographia 52 (2000) 818.[226] M. Castellari, E. Sartini, A. Fabiabi, G. Arfelli, A. Amati, J. Chromatogr.
A 973 (2002) 221.[227] A. Jakab, E. Forgacs, Chromatographia 56 (2002) 69.[228] D. Lubda, K. Cabrera, K. Nakanishi, W. Lindner, Anal. Bioanal. Chem.
377 (2003) 892.[229] G. Massolini, E. Calleri, A. Lavecchia, F. Loiodice, D. Lubda, C. Tem-
porini, G. Fracchiolla, P. Tortorella, E. Novellino, G. Caccialanza, Anal.Chem. 75 (2003) 535.
[230] E. Calleri, C. Temporini, G. Massolini, G. Caccialanza, J. Pharm. Biomed.Anal. 35 (2004) 243.
[231] V.V. Tolstikov, A. Lommen, K. Nakanishi, N. Tanaka, O. Fiehn, Anal.Chem. 75 (2003) 6737.
[232] A.J. Shah, F. Crespi, C. Heidbreder, J. Chromatogr. B 781 (2002) 151.

mato
K.K. Unger et al. / J. Chro[233] B. Barroso, D. Lubda, R. Bischoff, J. Prot. Res. 2 (2003) 633.[234] N. Tanaka, H. Kimura, D. Tokuda, K. Hosoya, T. Ikegami, N. Ishizuka,
H. Minakuchi, K. Nakanishi, Y. Shintani, M. Furona, K. Cabrera, Anal.Chem. 76 (2004) 1273.
[235] C.J. Venkatramani, Y. Zelechonok, Anal. Chem. 75 (2003) 3484.[236] T. Murahashi, Analyst 128 (2003) 611.[237] T. Ikegami, T. Hara, H. Kimura, H. Kobayashi, K. Hosoya, K. Cabrera,
N. Tanaka, J. Chromatogr. A 1106 (2006) 112.[238] E. Machtejevas, S. Andrecht, D. Lubda, K.K. Unger, J. Chromatogr. A
1144 (2007) 97.[239] J. Seidl, J. Malinski, K. Dusek, W. Heitz, Adv. Polymer Sci. 5 (1967) 113.[240] Monolithic Materials: Preparation, Properties and Applications, F. Svec,
T.B. Tennikova, Z. Deyl (Eds.), J. Chromatogr. Lib., Elsevier, Amsterdam,2003.
[241] S. Eltink, J.M. Herrero-Martinez, G.P. Rozing, P.J. Shoemakers, W.Th.Kok, Anal. Chem. 77 (2005) 7342.
[242] Special Issue on Momolithic Columns, J. High Resolut. Chromatogr. 23
(2000) 3–116.[243] D. Josic, J.G. Clifton, J. Chromatogr. 1144 (2007) 2.[244] A. Podgornik, Advantages of Chromatographic Monoliths, Monolith
Summer School, Portoroz, Slovenia, 27–31 May 2006.[245] S. Eeltink, Ph.D. thesis, University of Amsterdam, 2005.
gr. A 1184 (2008) 393–415 415
[246] H. Oberacher, C.G. Huber, Trends Anal. Chem. 21 (2002) 166.[247] B. Mayr, K. Eder, M.R. Buchmeiser, C.G. Huber, Anal. Chem. 74 (2002)
6080.[248] W. Walcher, H. Oberacher, S. Troiani, G. Holzl, P.J. Oefner, L. Zolla,
C.G. Huber, J. Chromatogr. B 782 (2002) 111.[249] H. Oberacher, A. Premstaller, C.G. Huber, J. Chromatogr. A 1030 (2004)
201.[250] R.E. Majors, LC–GC N. Am. 24 (2006) 248.[251] R.E. Majors, LC–GC N. Am. 24 (2006) 356.[252] M. Wedd, GIT-Labor-Fachz. 44 (2000) 610.[253] D. Nicoli, P. OıHagan, G. Pokrajac, K. Hasapidis, Int. Lab. 30 (2000)
16.[254] D. Driscoll, F. Etzler, T. Barber, J. Nehne, W. Niemann, B. Bistrian, Int.
J. Pharm. 219 (2001) 21.[255] R. Trottier, B. Kaye, Size Measurement of Particles, Encyclopedia of
Polymer Science and Technology, Wiley, New York, 1987, p. 267.[256] P. Reschiglian, G. Torsi, Chromatographia 40 (1995) 467.
[257] J. Pazourek, J. Microcol. Sep 9 (1997) 611.[258] P.J.P. Cardot, J.-M. Launay, M. Martin, J. Liq. Chromatogr. Rel. Technol.20 (1997) 2543.[259] P. Reschiglian, D. Melucci, G. Torsi, A. Zattoni, Chromatographia 51
(2000) 87.