review of the groundwater hydrology of the cadiz … · 2017-12-01 · review of the groundwater...
TRANSCRIPT

aquilogic environment ● water ● strategy
Aquilogic Inc. 245 Fischer Avenue, Suite D-2
Costa Mesa, CA 92626 Tel. +1.714.770.8040
Web: www.aquilogic.com
REVIEW OF THE GROUNDWATER HYDROLOGY
OF THE CADIZ PROJECT San Bernardino County, California
Prepared for:
Laborers International Union of America “LIUNA” Pursuant to Settlement of Rodrigo Briones, Lonnie Passmore, Laborers’ International
Union of North America Local Union No. 783 v. Santa Margarita Water District et al., Orange County Superior Court Case No. 30-2012-00620636-CU-WM-CXC
October 2013

aquilogic, Inc. environment ● water ● strategy
245 Fischer Avenue, Suite D-2 Costa Mesa, CA 92626
Tel. +1.714.770.8040 Web: www.aquilogic.com
REVIEW OF THE GROUNDWATER HYDROLOGY
OF THE CADIZ PROJECT San Bernardino County, California
Prepared for: Laborers International Union of America
“LIUNA” Pursuant to Settlement of Rodrigo Briones, Lonnie Passmore, Laborers’ International Union of North America Local Union No. 783 v. Santa Margarita Water
District et al., Orange County Superior Court Case No. 30-2012-00620636-CU- WM-CXC
Project No.: 008-01
October 2013

aquilogic
i
Review of the Groundwater Hydrology of the Cadiz Project
October 2013
TABLE OF CONTENTS
EXECUTIVE SUMMARY ............................................................................ I
1.0 INTRODUCTION ....................................................................... 1 1.1 Scope of Retention ....................................................................................... 1 1.2 Objectives .................................................................................................... 1 1.3 Project Understanding .................................................................................. 2
1.3.1 Project Overview ................................................................................................. 2 1.3.2 Project Purpose ................................................................................................... 6 1.3.3 Project Components ............................................................................................ 7
2.0 INTRODUCTION TO GROUNDWATER HYDROLOGY .................... 9 2.1 Hydrologic Cycle ........................................................................................... 9 2.2 Hydraulic Continuity ................................................................................... 11 2.3 Water Balance ............................................................................................ 11 2.4 Water in Soil and Rocks .............................................................................. 12 2.5 Underground Water ................................................................................... 13 2.6 Aquifers and Aquitards ............................................................................... 14 2.7 Porosity ...................................................................................................... 15 2.8 Specific Yield .............................................................................................. 16 2.9 Heads and Gradients .................................................................................. 17 2.10 Hydraulic Conductivity ................................................................................ 18 2.11 Groundwater Velocity ................................................................................ 19 2.12 Transmissivity............................................................................................. 20 2.13 Cone of Depression .................................................................................... 20 2.14 Quality of Groundwater .............................................................................. 21 2.15 Saline Intrusion .......................................................................................... 23
3.0 SITE SETTING ......................................................................... 25 3.1 Location ..................................................................................................... 25 3.2 Topography ................................................................................................ 25 3.3 Surficial Geology......................................................................................... 27 3.4 Structural Geology ...................................................................................... 30 3.5 Geologic Development of the Project Area ................................................. 31 3.6 Stratigraphy ............................................................................................... 32 3.7 Climate ...................................................................................................... 33
3.7.1 Precipitation ...................................................................................................... 34

aquilogic
ii
Review of the Groundwater Hydrology of the Cadiz Project
October 2013
3.7.2 Temperature ..................................................................................................... 36 3.8 Surface Water ............................................................................................ 36
3.8.1 Intermittent Streams ......................................................................................... 36 3.8.2 Springs ............................................................................................................... 37
3.9 Land Use .................................................................................................... 39 3.10 Groundwater Production ............................................................................ 39
4.0 HYDROGEOLOGY OF THE PROJECT AREA................................. 40 4.1 Hydrologic Inputs ....................................................................................... 40
4.1.1 Precipitation ...................................................................................................... 40 4.1.2 Infiltration ......................................................................................................... 40 4.1.3 Recharge ........................................................................................................... 41
4.2 Groundwater Flow ..................................................................................... 41 4.3 Hydrologic Outflow .................................................................................... 42
4.3.1 Groundwater Pumping ...................................................................................... 42 4.3.2 Dry Lakes ........................................................................................................... 42 4.3.3 Evapotranspiration ............................................................................................ 43
4.4 Storage Volume .......................................................................................... 43 4.5 Aquifers ..................................................................................................... 44
4.5.1 Alluvial Aquifer .................................................................................................. 44 4.5.2 Carbonate Aquifer ............................................................................................. 44 4.5.3 Granitic Aquifer ................................................................................................. 45
4.6 Hydraulic Properties ................................................................................... 45 4.7 Geochemistry ............................................................................................. 46 4.8 Conceptual Hydrogeologic Model ............................................................... 47
5.0 COMPARISON WITH SIMILAR BASINS ..................................... 50
6.0 CRITICISMS RAISED WITH RESPECT TO HYDROLOGY ................ 51 6.1 Impact on Springs ....................................................................................... 51 6.2 Subsidence ................................................................................................. 55
6.2.1 Load Compaction Subsidence ............................................................................ 55 6.2.2 Carbonate Collapse Subsidence ......................................................................... 55 6.2.3 Groundwater Pumping Subsidence ................................................................... 56
6.3 Saline Intrusion in Alluvial Sediments .......................................................... 58 6.4 Water Balance ............................................................................................ 60
6.4.1 Hydrologic Inflow – Recharge ............................................................................ 61 6.4.2 Hydrologic Outflow – Evaporation..................................................................... 61 6.4.3 Water Budget .................................................................................................... 62

aquilogic
iii
Review of the Groundwater Hydrology of the Cadiz Project
October 2013
6.4.4 Effect on Assessment of Impacts ....................................................................... 63 6.5 Other General Criticisms Raised by Johnson Wright .................................... 64
7.0 CONCLUSIONS ....................................................................... 66 7.1 Springs ....................................................................................................... 66 7.2 Subsidence ................................................................................................. 66 7.3 Saline Intrusion in Alluvial Sediments .......................................................... 66 7.4 Water Balance ............................................................................................ 67 7.5 Summary of Conclusions............................................................................. 68
8.0 CLOSURE ............................................................................... 69
9.0 REFERENCES .......................................................................... 70

aquilogic
iv
Review of the Groundwater Hydrology of the Cadiz Project
October 2013
LIST OF TABLES
Table ES.1: Southern California Groundwater Basin Comparison iv Table 2.1: Freshwater of the Hydrosphere and Its Rate of Exchange 9
Table 2.2: Rate of Movement and Distribution of Water 11 Table 2.3: Selected Values of Porosity 16
Table 2.4: Selected Values of Porosity, Specific Yield and Specific Retention 16 Table 2.5: Range of Hydraulic Conductivity Values by Various Rock/Sediment Types 19
Table 2.6: Natural Inorganic Constituents Commonly Dissolved in Groundwater 22 Table 4.1: Total Volume of Precipitation by Watershed 40
Table 4.2: Hydraulic Conductivity Values Used in Groundwater Modeling and Obtained from Pumping Tests 46
Table 4.3: Summary of Water Quality Analyses in the Project Area 46 Table 5.1: Southern California Groundwater Basin Comparison 50
Table 6.1: Estimated Spring Elevations From Groundwater Modeling 54

aquilogic
v
Review of the Groundwater Hydrology of the Cadiz Project
October 2013
LIST OF FIGURES
Figure 1.1: Location of the Cadiz Project 3 Figure 1.2: Cadiz Project Area 4
Figure 1.3: Watersheds in the Cadiz Project Area 5 Figure 1.4: Conceptual Surface and Groundwater Flow 8
Figure 2.1: The Hydrological Cycle 10 Figure 2.2: Watershed Hydrologic Variables 12
Figure 2.3: Hydrologic Zones within the Subsurface 14 Figure 2.4: Aquifers and Aquitards 15
Figure 2.5: Hydraulic Heads and Gradient 17 Figure 2.6: Cones of Depression in Unconfined and Confined Aquifers 21
Figure 3.1: Project Area Topography 26 Figure 3.2: Regional Surficial Geology 29
Figure 3.3: Generalized Stratigraphic Column of the Fenner Gap 33 Figure 3.4: Precipitation Isohyets for the Watersheds Surrounding the Cadiz Project 35
Figure 3.5: Springs within the Project Area 38
Figure 4.1: Simplified Hydrogeologic Section up Fenner Valley 47 Figure 4.2: Simplified Hydrogeologic Section across Fenner Gap 48
Figure 6.1a: Scenario 1 – Groundwater in Alluvium in Direct Hydraulic Communication with (and Sustaining) Spring 52
Figure 6.1b: Scenario 2 – Fault Acts as a Partial Groundwater Flow Barrier (Groundwater in Alluvium Not in Direct Hydraulic Communication with Spring 52
Figure 6.1c: Scenario 3 – Stratigraphic Unit (i.e. Aquitard) Acts as a Partial Groundwater Flow Barrier (Groundwater in Alluvium Not in Direct Hydraulic Communication with Spring) 53
Figure 6.2: Limestone Subsidence Calculation 56 Figure 6.3: Predicted Subsidence Based Upon Drawdown 58

aquilogic
vi
Review of the Groundwater Hydrology of the Cadiz Project
October 2013
LIST OF APPENDICES
A Anthony Brown’s Curriculum Vitae

aquilogic
vii
Review of the Groundwater Hydrology of the Cadiz Project
October 2013
ACRONYMS AND ABBREVIATIONS
A cross-sectional area ARZC Arizona and California Railroad AF acre-feet AFY acre-feet per year b aquifer thickness bgs below ground surface cm centimeters Cadiz Cadiz, Inc. Cadiz Project Cadiz Valley Water Conservation, Recovery, and Storage Project CEQA California Environmental Quality Act d day DBCP dibromochloropropane DRI Desert Research Institute E modules of elasticity ET evapotranspiration °F degrees Fahrenheit FEIR Final Environmental Impact Report ft feet GMMMP Groundwater Management, Monitoring, and Mitigation Plan GWI groundwater inflow GWO groundwater outflow K hydraulic conductivity km kilometer i hydraulic gradient L liter m meter MAF million acre-feet mg/L milligrams per liter mi mile MSL mean sea level MTBE methyl tert-butyl ether NGVD National Geodetic Vertical Datum n porosity ne effective porosity P precipitation Pi1 intergranular soil pressure prior to pumping Pi2 intergranular soil pressure at maximum drawdown ppb parts per billion ppm parts per million ppt parts per trillion psi pounds per square inch Q flow rate (quantity of water per time) S storage SMWD Santa Margarita Water District

aquilogic
viii
Review of the Groundwater Hydrology of the Cadiz Project
October 2013
Su compression of aquifer SWI surface water inflow SWO surface water outflow SWP State Water Project T transmissivity TCE trichloroethene TDS total dissolved solids USA United States of America USGS United States Geological Survey v velocity (distance per time) W aquifer unit width yr year Z thickness of aquifer layer

aquilogic
i
Review of the Groundwater Hydrology of the Cadiz Project
October 2013
EXECUTIVE SUMMARY
There is litigation pending in Orange County Superior Court entitled Rodrigo Briones, Lonnie Passmore, Laborers’ International Union of North America Local Union No. 783 v. Santa Margarita Water District et al., Orange County Superior Court Case No. 30-2012-00620636-CU- WM-CXC (LIUNA) (Action). As a condition of settlement, Aquilogic was tasked with the responsibility of conducting an impartial, objective, third-party review of the groundwater hydrology of the Cadiz Valley Water Conservation, Recovery, and Storage Project (the Cadiz Project).
Given the magnitude of the data and documentation relevant to the groundwater hydrology of the Cadiz Project, our review focused on two areas:
Evaluating the conceptual hydrologic model; and, Evaluating criticisms raised by project opponents related to groundwater hydrology.
Introduction to Groundwater Hydrology
In order for the State of California to receive maximum benefit from its groundwater resource, and to understand the value of the Cadiz project, it is important that project stakeholders (in fact, every California resident) become more knowledgeable about the occurrence, development, and protection of groundwater. Therefore, an introduction to groundwater hydrology is presented in the report to help project stakeholders improve their understanding of the basic scientific concepts relevant to the groundwater hydrology of the Cadiz Project.
One of the most important principles in hydrology is the concept of hydraulic continuity. As evident in the hydrologic cycle, there is no beginning or end for water as it moves within the hydrosphere. In addition, water is not lost or added to the overall system. Therefore, for any hydrologic system (at any scale) the water in the system must “balance”, such that “water in” (Qin) must equal “water out” (Qout), plus or minus any change in storage (ΔS). Without excess groundwater extraction or artificial recharge, the system exists under steady-state conditions; that is, there is no change in storage, and:
Qin = Qout
Thus, all water entering the hydrologic system as precipitation must exit the system, and vice-versa.
Hydrogeology of the Project
The oldest rocks underlying the project area are Archean granites. During the Archean or Cambrian periods, a series of major northwest-southeast fault zones developed. Over time, the

aquilogic
ii
Review of the Groundwater Hydrology of the Cadiz Project
October 2013
area between these fault zones subsided creating a deep (greater than 6000 feet) graben structure. During the Cambrian and Permian periods, the Archean granites were overlain by sedimentary units, predominantly dolomite limestone, shale, and carbonate limestone (karst).
During the Jurassic period, plutonic intrusions uplifted the Cambrian and Permian sediments to the northeast of the Cadiz Valley fault zone into a broad anticline. In addition, ancillary, unnamed faults (mapped by Kenney, 2011), perpendicular to the main fault zone created “sub-grabens” (e.g. the Fenner Gap) and a series of horsts (e.g. Marble Mountains, Ship Mountains). Subsequent to the Jurassic intrusions, the sediments of the anticline were partially eroded away. In the higher-energy mountain environments, only isolated areas of Cambrian and Permian rocks remain on the flanks of the mountains, and uplift and erosion exposed the Jurassic granite plutons at these horsts. During the Miocene, portions of the sub-grabens were in-filled with fanglomerates, and during the Quaternary period, substantial thicknesses of alluvium accumulated in the sub-grabens and basins.
The geologic development has, over time, created a closed hydrologic system. Surface waters flow down the channels in the alluvium and discharge to the Bristol and Cadiz Dry Lakes, the lowest points in the closed hydrologic system. Most recharge enters the system as infiltration in the surrounding mountains (both from rainfall and snow-melt). This infiltration recharges the groundwater within the basins, and groundwater flows toward the deep graben. Both surface water and groundwater exit the hydrologic system as evaporation at the dry lakes. Over geologic time, this has resulted in a deep saline water body beneath the dry lakes. Given the flow of groundwater into the graben from the surrounding basins, and the density of the saline water, the zone of saline water has been restricted to the graben (i.e. directly beneath the dry lakes), but likely extends many thousands of feet.
Alluvium, fanglomerates, and limestone make up the groundwater basins within the overall watersheds that surround the Cadiz Project. Precipitation falls across the area, increasing with elevation. Nearly all of the rainfall on the alluvium is lost to the system as evapotranspiration and never recharges groundwater. Most of the recharge into the groundwater basins comes from water that has infiltrated in the surrounding mountains, and thence recharges groundwater as fracture-baseflow from bedrock to alluvium, or infiltration of surface water flows at the mountain bedrock-alluvium contact.
Throughout most of the alluvial basins, groundwater is found at depths greater than 100 feet below ground surface. Only at the Bristol and Cadiz Dry Lakes is shallow groundwater encountered. However, at some locations, perched groundwater is present behind fault scarps and above low-permeability strata in the mountains. In these locations, springs can be found or created by drilling or tunneling into saturated rock/sediments. Given their elevation (i.e. more
aquilogic
iii
Review of the Groundwater Hydrology of the Cadiz Project
October 2013
than 500 feet above groundwater in the nearby alluvium) and hydrologic origin, these springs are not in direct hydraulic communication with the groundwater in the alluvium.
In general, groundwater flows down the alluvial valleys toward the point of lowest hydraulic head within the system – the Bristol and Cadiz dry lakes. No groundwater flows into adjacent basins or discharges to surface water that flows into adjacent watersheds, and all groundwater is eventually lost to the system as evaporation at the dry lakes (quantified at 31,590 AFY).
Groundwater within the Fenner Valley, and tributary groundwater that enters the Fenner Valley from the Lanfair Valley, eventually flows through the Fenner Gap between the Marble and Ship Mountains. In addition, groundwater in the Orange Blossom Wash flows to the south of the Fenner Gap before flowing to Bristol Dry Lake. All of this groundwater is tributary to the Cadiz Project. It has been estimated that between 17 and 34 million acre-feet of groundwater storage, and between 5,000 and 32,000 acre-feet per year of annual recharge, is tributary to the Cadiz Project.
Cadiz plans to pump groundwater at proposed well locations within the Fenner Gap. The proposed pumping rate will exceed the annual groundwater recharge that is tributary to the Cadiz Project, and some water will be removed from long-term aquifer storage. After 50 years, pumping will cease and the aquifers will be allowed to recharge for at least 50 years.
Comparison with Other Basins
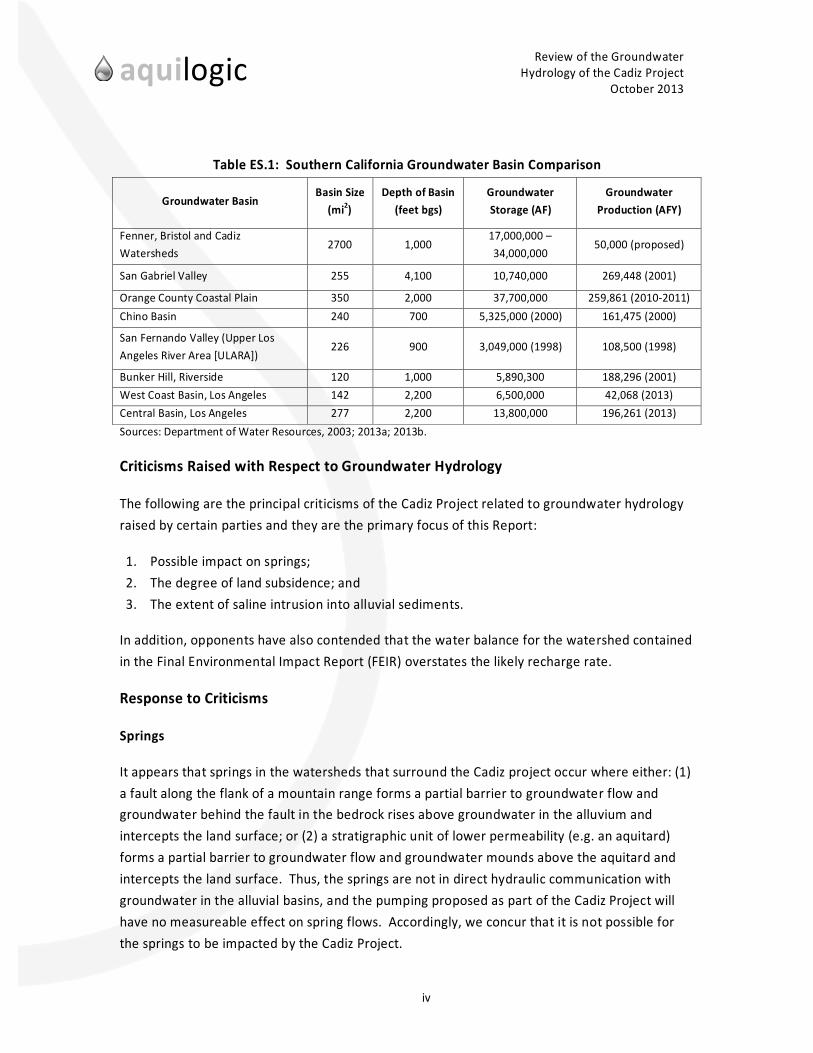
The watersheds that surround the Cadiz Project are located far from any major urban center. The size of the watersheds and their potential as sources of groundwater supply are difficult to envision without visiting the area. Therefore, to provide some perspective to stakeholders, and by means of comparison, the following table details the size, storage volume, and groundwater pumping rates for similar groundwater basins in Southern California.
aquilogic
iv
Review of the Groundwater Hydrology of the Cadiz Project
October 2013
Table ES.1: Southern California Groundwater Basin Comparison
Groundwater Basin Basin Size
(mi2) Depth of Basin
(feet bgs) Groundwater Storage (AF)
Groundwater Production (AFY)
Fenner, Bristol and Cadiz Watersheds
2700 1,000 17,000,000 – 34,000,000
50,000 (proposed)
San Gabriel Valley 255 4,100 10,740,000 269,448 (2001)
Orange County Coastal Plain 350 2,000 37,700,000 259,861 (2010-2011) Chino Basin 240 700 5,325,000 (2000) 161,475 (2000)
San Fernando Valley (Upper Los Angeles River Area [ULARA])
226 900 3,049,000 (1998) 108,500 (1998)
Bunker Hill, Riverside 120 1,000 5,890,300 188,296 (2001) West Coast Basin, Los Angeles 142 2,200 6,500,000 42,068 (2013) Central Basin, Los Angeles 277 2,200 13,800,000 196,261 (2013) Sources: Department of Water Resources, 2003; 2013a; 2013b.
Criticisms Raised with Respect to Groundwater Hydrology
The following are the principal criticisms of the Cadiz Project related to groundwater hydrology raised by certain parties and they are the primary focus of this Report:
1. Possible impact on springs; 2. The degree of land subsidence; and 3. The extent of saline intrusion into alluvial sediments.
In addition, opponents have also contended that the water balance for the watershed contained in the Final Environmental Impact Report (FEIR) overstates the likely recharge rate.
Response to Criticisms
Springs
It appears that springs in the watersheds that surround the Cadiz project occur where either: (1) a fault along the flank of a mountain range forms a partial barrier to groundwater flow and groundwater behind the fault in the bedrock rises above groundwater in the alluvium and intercepts the land surface; or (2) a stratigraphic unit of lower permeability (e.g. an aquitard) forms a partial barrier to groundwater flow and groundwater mounds above the aquitard and intercepts the land surface. Thus, the springs are not in direct hydraulic communication with groundwater in the alluvial basins, and the pumping proposed as part of the Cadiz Project will have no measureable effect on spring flows. Accordingly, we concur that it is not possible for the springs to be impacted by the Cadiz Project.

aquilogic
v
Review of the Groundwater Hydrology of the Cadiz Project
October 2013
Subsidence
Subsidence of the land surface can occur when fluids are removed from the subsurface. Such subsidence has been associated with oil extraction (e.g. Long Beach, California), groundwater pumping (e.g. Central Valley, California, Mexico City), and a combination of the two (e.g. Bakersfield, California).
We have reviewed the predicted subsidence results from the groundwater flow models developed by Geoscience (Geoscience, 2011a). The sediments contain very little clay content, except beneath the dry lakes, and the elastic storage coefficient used in the modeling (0.00001) appear reasonable for the sediments observed. We have performed calculations of possible subsidence that confirm the subsidence predicted by the modeling. These levels of subsidence over the areas predicted are well within the railroad tolerances. Accordingly, we agree that the Cadiz Project does not display a present risk of subsidence that would cause harm to any physical structures or the environment.
Saline Intrusion in Alluvial Sediments
An area of saline groundwater extends beneath the footprint of the dry lakes and to considerable depths (likely thousands of feet, given the increased density of the saline waters). A saline-fresh water interface will be present where “fresh” groundwater contacts this saline water. The location of the saline interface estimated in the FEIR appears reasonable given the hydrogeologic conditions. Without the proposed pumping, the flow of fresh groundwater through the Fenner Gap would maintain the current interface some distance from the Cadiz Project. However, with pumping of groundwater at rates greater than recharge tributary to the Cadiz Project, the saline-fresh water interface will move toward the pumping well-field. In fact, the Cadiz Project is designed to pull back some freshwater to the southwest of the Fenner Gap that would eventually be lost to the saline zone and evaporation.
Based upon our review of the groundwater flow models, and calculations of advective solute transport velocity, the representation of the saline-fresh water interface in the alluvium presented in the FEIR appears reasonable. Therefore, under the pumping plan proposed, the well-field would not be impacted by saline waters in the alluvium. Consequently, we concur that the Cadiz Project does not present a material risk of saline intrusion in the alluvial sediments.
Water Balance
As discussed, the watersheds that surround the Cadiz Project form a closed hydrologic system, both for surface water and groundwater. Thus, all water entering the system as precipitation must exit the system.

aquilogic
vi
Review of the Groundwater Hydrology of the Cadiz Project
October 2013
In 2012, the Desert Research Institute (DRI) conducted an evaporation survey at the Bristol and Cadiz Dry Lakes (DRI, 2012). This survey included more than 50,000 evaporation measurements. Applying the DRI, the measured evaporation rates over the area of the dry lakes, the evaporative losses from Bristol and Cadiz Dry Lakes were calculated to be 7,860 acre-feet per year (AFY) and 23,730 AFY, respectively. In addition to the evaporation losses from the hydrologic system, on average, an additional 4,600 AFY has been pumped over recent years as part of Cadiz agricultural operations.
As stated, Qin = Qout, and in reverse - what goes out, MUST go in! While there may be debate about recharge estimates, it is hard to argue that evaporative losses are not 31,590 AFY. The key question is, “how much of the 31,590 AFY is recharge available to the Cadiz Project?” The Cadiz Project FEIR addresses this issue by using a range of recharge estimates between 5,000 and 32,000 AFY for the purpose of evaluating potential impacts.
The total evaporative loss from the Bristol and Cadiz Dry Lakes has been quantified at 31,590 AFY. Thus, total recharge to the hydrologic system (watersheds) must be at least 31,590 (Qin = Qout). Perhaps not all of this total recharge may always be available for capture by the Cadiz Project well-field. However, given that most precipitation (and recharge) occurs at the higher elevations that surround the Fenner and Lanfair Valleys and the planned method of operation, the majority of the total recharge is likely available to the project. Therefore, it is reasonable to conclude that recharge available to the Cadiz Project is within the upper quartile of the range considered in the FEIR.
Irrespective of recharge that is tributary to the Project, there are NO significant environmental impacts from the proposed groundwater pumping at the Cadiz Project. To reiterate, aside from the amount of groundwater that is removed from long-term aquifer storage (i.e. the amount beyond the available recharge):
Pumping groundwater at 50,000 AFY from the Cadiz Project, with available recharge anywhere between 5,000 and 32,000 AFY, has no measureable effect on the springs;
The groundwater flow models reasonably estimate the likely subsidence associated with this groundwater pumping, and subsidence levels for all recharge amounts evaluated are well within railroad tolerances; and
The movement (i.e. intrusion) of the saline fresh-water interface in the alluvium induced by this pumping is limited for all recharge amounts evaluated, will not impact the proposed well-field or other water users, and is reversible, over time.
To summarize the above:
aquilogic
vii
Review of the Groundwater Hydrology of the Cadiz Project
October 2013
The criticisms of the Project hydrology have failed to account for the actual field-measured evaporation data, which quantifies that at least 31,000 AFY is being lost to evaporation from the hydrologic system – and what goes out, must go in!
The range of recharge estimates used to assess possible project impacts appears to be reasonable and conservative.
Compared with other actively managed groundwater basins in southern California, the Project proposes a relatively low extraction rate versus the large quantity of water in storage in the tributary watersheds.
Largely due to the hydrogeology of the Project area and the manageable amounts of extraction proposed, we cannot identify any significant impacts from proposed groundwater pumping by the Cadiz Project on springs, subsidence, or saline intrusion in the alluvium. ● The levels of subsidence and saline intrusion presented in the FEIR appear to reasonably
reflect likely conditions, and the proposed pumping will not lead to significant subsidence or saline intrusion.
● Due to hydrologic separation, the pumping will have no effect on the springs. If the recharge available to the Project is lower than anticipated, the only party that would
bear any potential impact, if one were to unexpectedly occur, is Cadiz. The condition imposed on the Cadiz Project by the County of San Bernardino that limits
water-table drawdown will address this issue and serve to negate any potential impacts.

aquilogic
1
Review of the Groundwater Hydrology of the Cadiz Project
October 2013
1.0 INTRODUCTION
1.1 Scope of Retention
There is litigation pending in Orange County Superior Court entitled Rodrigo Briones, Lonnie Passmore, Laborers’ International Union of North America Local Union No. 783 v. Santa Margarita Water District et al., Orange County Superior Court Case No. 30-2012-00620636-CU-WM-CXC (LIUNA) (Action), between Real Parties-in-Interest Cadiz, Inc. and Fenner Valley Mutual Water Company (Fenner), (collectively, Cadiz Parties) and, Rodrigo Briones, an individual, Lonnie Passmore, an individual, and Laborers International Union of North America Local Union No.783. Aquilogic has been retained in connection with the Parties desire to resolve the pending litigation. As a condition of settlement Aquilogic was tasked with the responsibility of conducting an impartial, objective, third-party review of the groundwater hydrology of the Cadiz Valley Water Conservation, Recovery, and Storage Project (the Cadiz Project). As part of this work, Aquilogic was given unrestricted access to the project area, existing geoscience and engineering consultants working on the Cadiz Project, and any documentation generated as part of the Cadiz Project.
Given the magnitude of the data and documentation relevant to the groundwater hydrology of the Cadiz Project, our review focused on two areas:
Evaluating the conceptual hydrologic model, and presenting the groundwater hydrology of the Cadiz Project in a way that a non-hydrologist (i.e. layman) can understand; and
Evaluating criticisms raised by project opponents related to groundwater hydrology.
With respect to the second item, we specifically attempted to identify any data or analysis from the actual project area that would support any of the criticisms leveled by project opponents, and conversely, any data or analysis that would refute the criticisms.
1.2 Objectives
The objectives of our work were as follows:
Evaluate the project conceptual hydrologic model; Provide a description of the groundwater hydrology of the Cadiz project that a non-
hydrologist could understand; Confirm whether criticisms related to groundwater hydrology were valid, and what steps
need to be taken to address valid criticisms; Present data or analysis that would refute criticisms that were not valid; and Contrast the Cadiz Project with other groundwater basins, perhaps more familiar to the
general public.

aquilogic
2
Review of the Groundwater Hydrology of the Cadiz Project
October 2013
1.3 Project Understanding
The following project overview is taken directly from the Final Environmental Impact Report (FEIR) for the Cadiz Project prepared by ESA for Santa Margarita Water District (SMWD) (ESA, 2012). More detailed information about the project can be found within the FEIR. The following sections of the FEIR are particularly pertinent to the groundwater hydrology:
Section 2 Project Background Section 3 Project Description Section 4.6 Geology and Soils Section 4.9 Hydrology and Water Quality Section 5.3.6 Geology and Soils (under Cumulative Impacts) Section 5.3.9 Hydrology and Water Quality Appendix B: Groundwater Management Appendix H: Hydrology Reports
1.3.1 Project Overview
Cadiz Inc. (Cadiz) is a private corporation that owns approximately 34,000 mostly contiguous acres in the Cadiz and Fenner Valleys (Cadiz Property), which are located in the Mojave Desert portion of eastern San Bernardino County, California (Figure 1.1).
Cadiz, in collaboration with SMWD and other water providers participating in the Project (Project Participants), has developed the Cadiz Valley Water Conservation, Recovery, and Storage Project (the Cadiz Project) to implement a comprehensive, long-term groundwater management program for the closed groundwater basin underlying its property. The program would allow for both the beneficial use of some of the groundwater and storage of imported surface water in the groundwater basin (Figure 1.2).
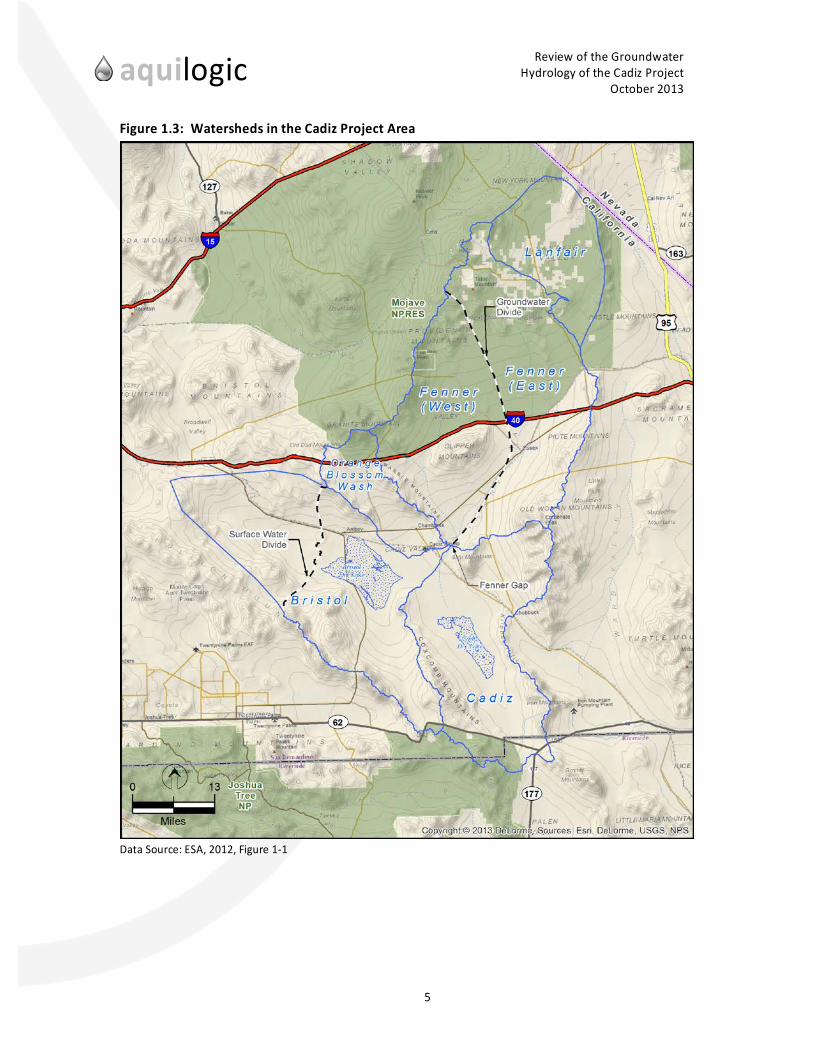
Underlying the Cadiz, Fenner and Bristol Valleys is a vast groundwater basin that holds an estimated 17 to 34 million acre-feet (MAF) of fresh groundwater. The Project area, which would be sited on Cadiz Property, is located at the confluence of the Fenner, Orange Blossom Wash, Bristol and Cadiz Watersheds (Watersheds), which span over 2,700 square miles (Figure 1.3).
Within this closed basin system, groundwater percolates and migrates downward from the higher elevations in the Watersheds and eventually flows to Bristol and Cadiz Dry Lakes (Figure 1.4). The Dry Lakes represent the low point in the closed watershed basin, meaning that all surface and groundwater within the surrounding Watersheds eventually flows down-gradient to these Dry Lake areas and not beyond. Once the fresh groundwater reaches the Dry Lake areas, it evaporates, first mixing with the highly saline groundwater zone under the Dry Lakes and getting trapped in the salt sink, no longer fresh, suitable, or available to support freshwater beneficial

aquilogic
3
Review of the Groundwater Hydrology of the Cadiz Project
October 2013
uses. The portion that evaporates is lost from the groundwater basin and is therefore also unable to support beneficial uses.
Figure 1.1: Location of the Cadiz Project

aquilogic
4
Review of the Groundwater Hydrology of the Cadiz Project
October 2013
Figure 1.2: Cadiz Project Area
Data Source: ESA, 2012, Figure ES-1
aquilogic
5
Review of the Groundwater Hydrology of the Cadiz Project
October 2013
Figure 1.3: Watersheds in the Cadiz Project Area
Data Source: ESA, 2012, Figure 1-1
aquilogic
6
Review of the Groundwater Hydrology of the Cadiz Project
October 2013
1.3.2 Project Purpose
The California Constitution mandates maximizing the reasonable and beneficial use of water and the avoidance of waste. The fundamental purpose of the Cadiz Project is to save substantial quantities of groundwater that are presently wasted and lost to evaporation by natural processes. In the absence of this Project, approximately 3 million acre-feet of groundwater presently held in storage between the proposed wellfield and the Dry Lakes would become saline and evaporate over the next 100 years. By strategically managing groundwater levels, the Project would conserve up to 2 million acre-feet of this water, retrieving it from storage before it is lost to evaporation. The conservation opportunity is unique and garners special emphasis. The proposed conservation is not dependent upon future rainfall, snow pack or the needs and demands of others: the groundwater is already in storage. Moreover, the conservation and resulting water supply augmentation can be achieved independently from the environmental and regulatory conditions that generally constrain the importation of water to Southern California. The geographic isolation of the groundwater makes it non-tributary to the Colorado River system and, therefore, eligible for distinctive treatment under federal regulations that may unlock additional complementary storage opportunities, both within the Basin and in Lake Mead.
The Cadiz Project makes available a reliable water supply for Southern California Project Participants, to supplement or replace existing supplies and enhance dry-year supply reliability. Both the State Water Project (SWP) and Colorado River water supplies are experiencing reductions from historic deliveries. As a result, Southern California water providers are looking for affordable new supplies to replace or augment current supplies and enhance dry-year supply reliability. The Project would optimize the reasonable and beneficial use of water within the aquifer system in a sustainable fashion—conserving water that would otherwise be wasted—to create a local water supply alternative for Southern California water providers.
The objectives of the Cadiz Project are as follows:
Maximize beneficial use of groundwater in the Bristol, Cadiz, and Fenner Valleys by conserving and using water that would otherwise be lost to brine and evaporation;
Improve water supply reliability for Southern California water providers by developing a long-term source of water that is not significantly affected by drought;
Reduce dependence on imported water by utilizing a source of water that is not dependent upon surface water resources from the Colorado River or the Sacramento-San Joaquin Delta;
Enhance dry-year water supply reliability within the service areas of SMWD and other Southern California water provider Project Participants;

aquilogic
7
Review of the Groundwater Hydrology of the Cadiz Project
October 2013
Enhance water supply opportunities and delivery flexibility for SMWD and other participating water providers through the provision of carry-over storage and, for Phase 2, imported water storage;
Support operational water needs of the Arizona and California Railroad (ARZC) in the Project area;
Create additional water storage capacity in Southern California to enhance water supply reliability; and
Locate, design, and operate the Cadiz Project in a manner that minimizes significant environmental effects and provides for long-term sustainable operations.
1.3.3 Project Components
The proposed Cadiz Project includes two distinct but related components:
1. Groundwater Conservation and Recovery Component 2. Imported Water Storage Component
Under the Groundwater Conservation and Recovery Component, an annual average of 50,000 acre-feet (AF) of groundwater would be pumped from the basin over a 50-year period for delivery to Project Participants in accordance with agreements with Cadiz Inc. and the Cadiz Groundwater Management, Monitoring and Mitigation Plan (GMMMP). The GMMMP has been developed to guide the long-term groundwater management of the basin for the Cadiz Project. The level of groundwater pumping proposed under the Groundwater Conservation and Recovery Component is designed specifically to extract and conserve groundwater that would otherwise migrate to the Dry Lakes, enter the brine zone, and evaporate. The Groundwater Conservation and Recovery Component was analyzed at a project level in the FEIR in accordance with California Environmental Quality Act (CEQA) Guidelines Sections 15161 and 15378(a).

aquilogic
8
Review of the Groundwater Hydrology of the Cadiz Project
October 2013
Figure 1.4: Conceptual Surface and Groundwater Flow
Source: ESA, 2012, Figure 3-3a

aquilogic
9
Review of the Groundwater Hydrology of the Cadiz Project
October 2013
2.0 INTRODUCTION TO GROUNDWATER HYDROLOGY
In order for the State of California to receive maximum benefit from its groundwater resource, and to understand the value of the Cadiz Project, it is important that project stakeholders (in fact, every California resident) become more knowledgeable about the occurrence, development, and protection of groundwater. This section of the report has been written to help project stakeholders improve their understanding of the basic scientific concepts relevant to the groundwater hydrology of the Cadiz Project.
Groundwater is one of the world’s most valuable natural resources. In the United States of America (USA), it is the source of almost 40 percent of the water used for all purposes exclusive of power generation (hydroelectric generation and power plant cooling). However, for such a valuable resource, the general public (and even many scientists and engineers) have limited understanding about groundwater and the scientific principles that control its occurrence, movement, geochemistry, and potential for development as a source of sustainable water supply. In fact, groundwater is the subject of many widespread misconceptions, such as the belief that groundwater occurs in underground rivers resembling surface streams or underground lakes.
“Groundwater hydrology is the subdivision of the science of hydrology that deals with the occurrence, movement, and quality of water beneath the Earth’s surface” (USGS, 1983). It involves the application of mathematical, physical, and biological sciences to assess the occurrence and movement of water in complex subsurface environments; thus, it is one of the most complex of the sciences. However, many of its basic principles and methods can be understood readily by non-hydrologists.
Table 2.1: Freshwater* of the Hydrosphere and Its Rate of Exchange Source Volume of Freshwater (km3) Percentage of all Freshwater Exchange Rate (years)
Ice sheets and glaciers 24,000,000 84.95 8,000 Groundwater 4,000,000 14.16 280 Lakes and reservoirs 155,000 0.55 7 Soil moisture 83,000 0.29 1 Vapors in the atmosphere 14,000 0.05 0.027 River water 1,200 0.004 0.031 Total 28,253,200 100 ---
* Freshwater constitutes only 6% of all water on earth, as 94% is seawater Source: USGS, 1983
2.1 Hydrologic Cycle
The hydrologic cycle refers to the constant movement of water above, on, and below the Earth's surface in various stages. The hydrologic cycle has neither a beginning nor an end, but it is convenient to discuss its principal features by starting with evaporation from vegetation,

aquilogic
10
Review of the Groundwater Hydrology of the Cadiz Project
October 2013
exposed moist surfaces (including soil), and from the ocean. This moisture forms clouds, which return the water to the land or oceans in the form of precipitation (e.g. rain, snow).
Figure 2.1: The Hydrological Cycle
Source: http://www.bannockcounty.us/groundwater/?page_id=14
Falling rain wets vegetation and other surfaces and then begins to infiltrate into the ground. Infiltration rates vary widely, depending on land use, the character and moisture content of the soil, and the intensity and duration of precipitation. They can be as high as one inch per hour in mature forests on sandy soils to hundredths of an inch in clayey soils to near zero in paved areas. If the soils are saturated or the rainfall intensity exceeds the infiltration capacity of the soils, some water will pool and flow along the ground surface as surface runoff or overland flow. Infiltrating rainfall and snow melt percolates through the underlying soil/sediments. Some is drawn up by plant roots and thence transpired back to the atmosphere, and some eventually percolates to groundwater.
Groundwater flows laterally and vertically, in response to differences in hydraulic head (see Section 2.9), to sites of groundwater discharge, such as springs, streams, lakes, the ocean, or pumping wells. Water reaching streams, both by overland flow and from groundwater discharge, moves to the sea, where it again evaporates to perpetuate the hydrologic cycle.

aquilogic
11
Review of the Groundwater Hydrology of the Cadiz Project
October 2013
Water movement is the key element in the hydrologic cycle. Some "typical" rates of movement are shown in the following table, along with the distribution of the Earth's water.
Table 2.2: Rate of Movement and Distribution of Water Location Rate of Movement Percentage of Earth’s Water
Atmosphere 100’s of kilometers per day 0.001 Water on land surface 10’s of kilometers per day 0.019 Water below the land surface Centimeters per day 4.12 Ice caps and glaciers Centimeters per day 1.65 Oceans 10’s of kilometers per day 93.96
Source: USGS, 1983
2.2 Hydraulic Continuity
One of the most important principles in hydrology is the concept of hydraulic continuity. As evident in the hydrologic cycle, there is no beginning or end for water as it moves within the hydrosphere. Therefore, for any hydrologic system (at any scale) the water in the system must “balance”, such that “water in” (Qin) must equal “water out” (Qout), plus or minus any change in storage (ΔS):
Qin = Qout +/- ΔS
Without excess groundwater extraction or artificial recharge, over an extended period of time encompassing variable climatic inputs, the system exists under steady-state conditions; that is, there is no change in storage, and:
Qin = Qout
Thus, all water entering the hydrologic system as precipitation must exit the system.
2.3 Water Balance
Given hydraulic continuity, water coming into any hydrologic system can only leave the system or change the storage in the system; that is, the equation must “balance”. Water can be stored in snow-pack, lakes/ponds/marshes, unsaturated soils, and biota. However, the majority of storage in most hydrologic watersheds (or basins) is present in groundwater. To quantify the water balance in a watershed, water inputs must be calculated (e.g. rainfall, snow melt, inter-basin groundwater inflow, import water recharge), outputs must be calculated (e.g. evapotranspiration, runoff, inter-basin groundwater outflow, groundwater pumping), and any change in storage estimated (e.g. from a rise or fall in total head for groundwater).
aquilogic
12
Review of the Groundwater Hydrology of the Cadiz Project
October 2013
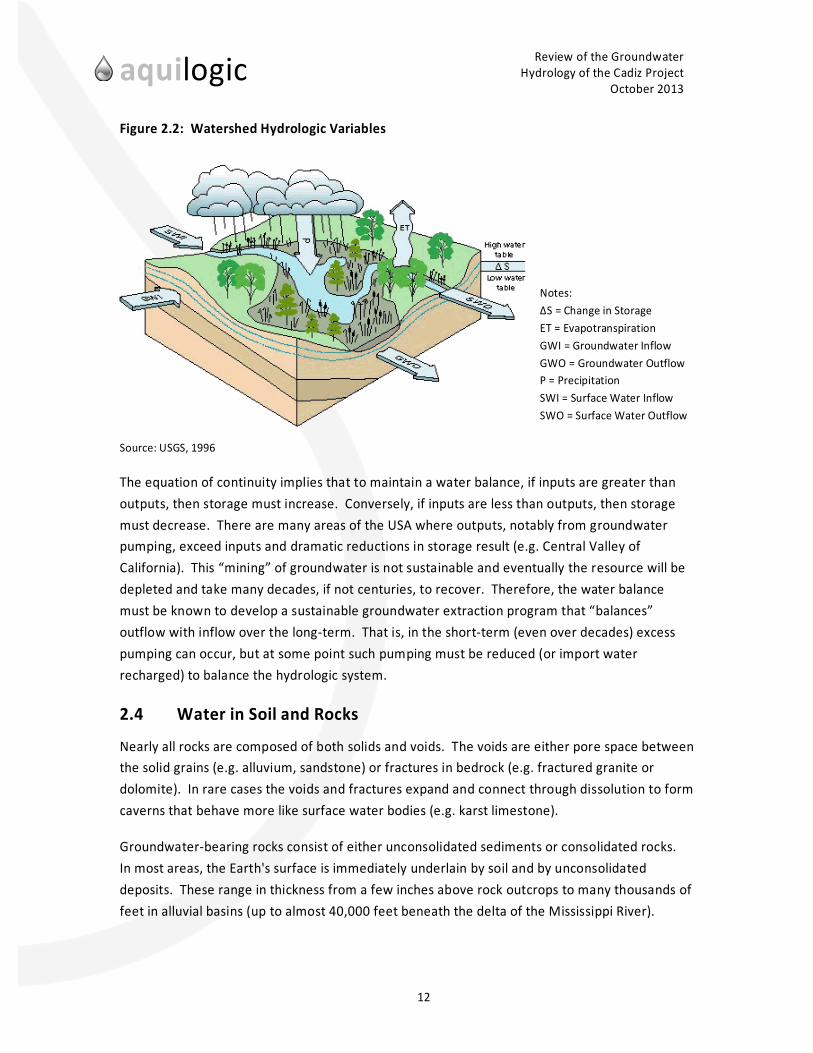
Figure 2.2: Watershed Hydrologic Variables
Notes: ΔS = Change in Storage ET = Evapotranspiration GWI = Groundwater Inflow GWO = Groundwater Outflow P = Precipitation SWI = Surface Water Inflow SWO = Surface Water Outflow
Source: USGS, 1996
The equation of continuity implies that to maintain a water balance, if inputs are greater than outputs, then storage must increase. Conversely, if inputs are less than outputs, then storage must decrease. There are many areas of the USA where outputs, notably from groundwater pumping, exceed inputs and dramatic reductions in storage result (e.g. Central Valley of California). This “mining” of groundwater is not sustainable and eventually the resource will be depleted and take many decades, if not centuries, to recover. Therefore, the water balance must be known to develop a sustainable groundwater extraction program that “balances” outflow with inflow over the long-term. That is, in the short-term (even over decades) excess pumping can occur, but at some point such pumping must be reduced (or import water recharged) to balance the hydrologic system.
2.4 Water in Soil and Rocks
Nearly all rocks are composed of both solids and voids. The voids are either pore space between the solid grains (e.g. alluvium, sandstone) or fractures in bedrock (e.g. fractured granite or dolomite). In rare cases the voids and fractures expand and connect through dissolution to form caverns that behave more like surface water bodies (e.g. karst limestone).
Groundwater-bearing rocks consist of either unconsolidated sediments or consolidated rocks. In most areas, the Earth's surface is immediately underlain by soil and by unconsolidated deposits. These range in thickness from a few inches above rock outcrops to many thousands of feet in alluvial basins (up to almost 40,000 feet beneath the delta of the Mississippi River).
aquilogic
13
Review of the Groundwater Hydrology of the Cadiz Project
October 2013
The unconsolidated deposits are underlain everywhere by consolidated rocks. These rocks are of three basic types: igneous, sedimentary, and metamorphic. Igneous rocks are derived from the magma that underlies the Earth’s crust and either form at the Earth’s surface as volcanic rocks (e.g. basalt) or beneath the surface as plutonic rocks (e.g. granite). Sedimentary rocks, as the name implies, result from the consolidation (e.g. compaction and cementation) of unconsolidated sediments derived from the weathering and erosion of consolidated rocks (e.g. sandstone). Metamorphic rocks are formed when igneous rocks intrude into sedimentary rock and the resulting heat and pressure transforms the sedimentary rocks into a new rock structure (e.g. limestone to marble). Igneous rocks can be metamorphosed.
In general, igneous and metamorphic rocks have very little primary porosity (i.e. pores between rock grains formed when the rock was created), but can have secondary porosity (i.e. fractures formed after the rock was created) that contain and transmit groundwater. Sedimentary rocks can have both primary and secondary porosity that contain and transmit groundwater. In some, such as sandstone, groundwater movement occurs primarily in the primary porosity; whereas in others, such as shales, groundwater movement occurs in the secondary porosity.
Unconsolidated sediments contain significant voids between the soil or rock grains, and groundwater occurs and moves within this primary porosity. However, some secondary porosity (e.g. fractures or desiccation cracks) can occur in finer-grained sediments (e.g. clays).
2.5 Underground Water
Underground water (as opposed to surface water) occurs in two different zones: the unsaturated or vadose zone, and the saturated zone. In general, the vadose zone occurs immediately below ground surface and can extend to depths in excess of hundreds of feet. In the vadose zone, the pore spaces are filled with both water and air and, thus, are unsaturated with respect to water. The hydraulic pressure within the vadose zone is negative, and while water can be drawn both up and down within the vadose zone, it cannot flow laterally or yield water to supply wells. The vadose zone is often divided into two intervals: the soil zone and the intermediate zone. The soil zone is the interval that supports plants and animals (e.g. worms) and often has higher permeability associated with root and worm holes. In general, this zone is rarely greater than five feet thick. The intermediate zone is the interval between the soil zone and the capillary fringe (see below).

aquilogic
14
Review of the Groundwater Hydrology of the Cadiz Project
October 2013
Figure 2.3: Hydrologic Zones within the Subsurface
Adapted from: USGS, 1983
The vadose zone is underlain by a zone where the pore spaces are filled entirely with water. This saturated zone is further divided into two intervals: the capillary fringe, and the groundwater zone. In the capillary fringe, the pores are filled with water, but the water is held at negative pressure by capillary suction (resulting from the interfacial tension between water, air, and the solid grains). This phenomenon can be observed by placing a small-diameter straw in a glass of water. The capillary suction causes the water in the straw to rise slightly above the water level in the glass. The capillary fringe in coarser sediments (e.g. sands and gravels) is rarely more than a foot thick. However, in finer-grained soils (e.g. clays), the capillary fringe can be many feet thick, due to the small pore size (notably the narrow pore-throat diameter) and resulting increased capillary suction. In the groundwater zone, the pressure (or hydraulic head) is positive, and this water can flow laterally in response to differences in hydraulic head. Thus, only the groundwater zone yields water to wells and springs.
2.6 Aquifers and Aquitards
With respect to groundwater occurrence, all rocks and sediments can be classified either as aquifers or aquitards. An aquifer is a unit that will yield water in a usable quantity to a well or spring. An aquitard is a unit having very low permeability that restricts (or retards) the movement of groundwater. Aquicludes are units that preclude the movement of groundwater; however, this term is rarely used as true aquicludes are extremely rare.
aquilogic
15
Review of the Groundwater Hydrology of the Cadiz Project
October 2013
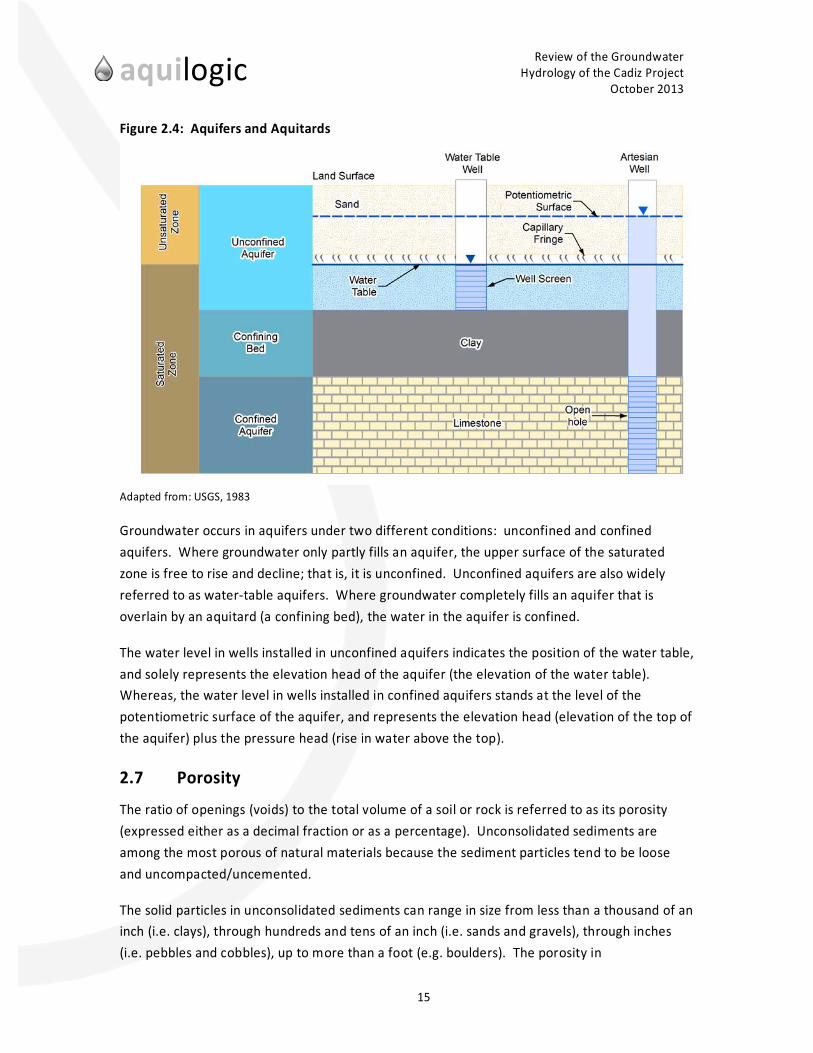
Figure 2.4: Aquifers and Aquitards
Adapted from: USGS, 1983
Groundwater occurs in aquifers under two different conditions: unconfined and confined aquifers. Where groundwater only partly fills an aquifer, the upper surface of the saturated zone is free to rise and decline; that is, it is unconfined. Unconfined aquifers are also widely referred to as water-table aquifers. Where groundwater completely fills an aquifer that is overlain by an aquitard (a confining bed), the water in the aquifer is confined.
The water level in wells installed in unconfined aquifers indicates the position of the water table, and solely represents the elevation head of the aquifer (the elevation of the water table). Whereas, the water level in wells installed in confined aquifers stands at the level of the potentiometric surface of the aquifer, and represents the elevation head (elevation of the top of the aquifer) plus the pressure head (rise in water above the top).
2.7 Porosity
The ratio of openings (voids) to the total volume of a soil or rock is referred to as its porosity (expressed either as a decimal fraction or as a percentage). Unconsolidated sediments are among the most porous of natural materials because the sediment particles tend to be loose and uncompacted/uncemented.
The solid particles in unconsolidated sediments can range in size from less than a thousand of an inch (i.e. clays), through hundreds and tens of an inch (i.e. sands and gravels), through inches (i.e. pebbles and cobbles), up to more than a foot (e.g. boulders). The porosity in
aquilogic
16
Review of the Groundwater Hydrology of the Cadiz Project
October 2013
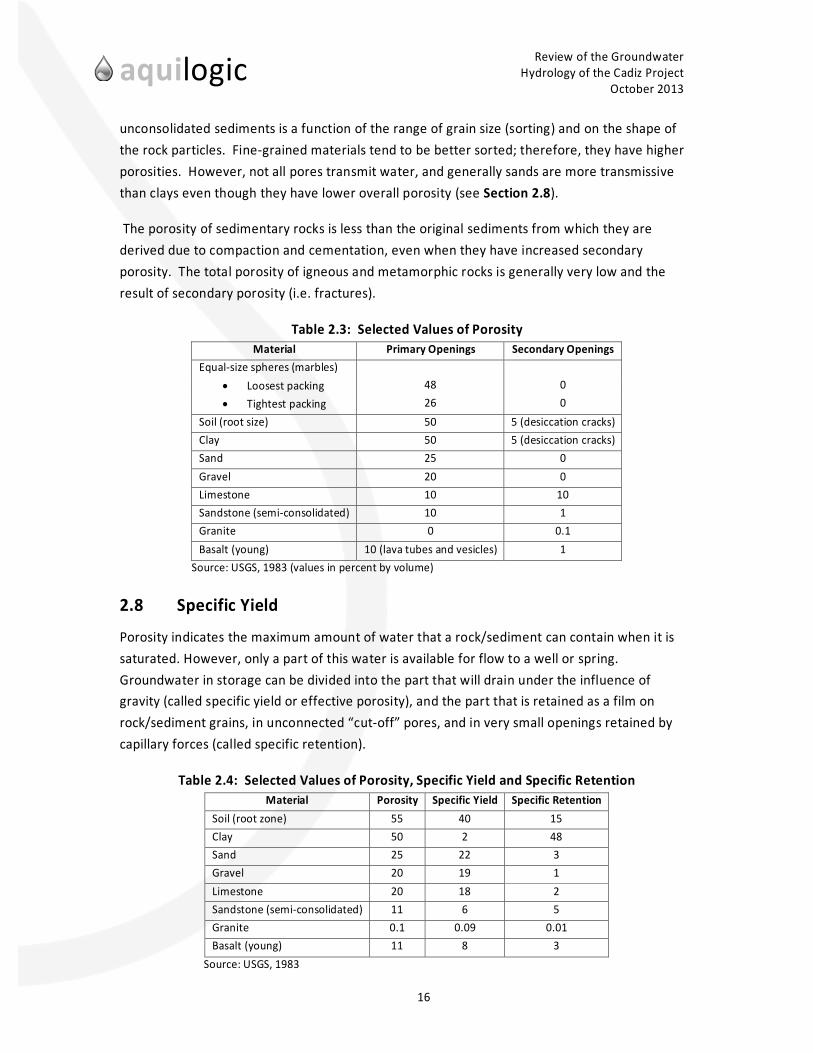
unconsolidated sediments is a function of the range of grain size (sorting) and on the shape of the rock particles. Fine-grained materials tend to be better sorted; therefore, they have higher porosities. However, not all pores transmit water, and generally sands are more transmissive than clays even though they have lower overall porosity (see Section 2.8).
The porosity of sedimentary rocks is less than the original sediments from which they are derived due to compaction and cementation, even when they have increased secondary porosity. The total porosity of igneous and metamorphic rocks is generally very low and the result of secondary porosity (i.e. fractures).
Table 2.3: Selected Values of Porosity Material Primary Openings Secondary Openings
Equal-size spheres (marbles) • Loosest packing 48 0 • Tightest packing 26 0
Soil (root size) 50 5 (desiccation cracks) Clay 50 5 (desiccation cracks) Sand 25 0 Gravel 20 0 Limestone 10 10 Sandstone (semi-consolidated) 10 1 Granite 0 0.1 Basalt (young) 10 (lava tubes and vesicles) 1
Source: USGS, 1983 (values in percent by volume)
2.8 Specific Yield
Porosity indicates the maximum amount of water that a rock/sediment can contain when it is saturated. However, only a part of this water is available for flow to a well or spring. Groundwater in storage can be divided into the part that will drain under the influence of gravity (called specific yield or effective porosity), and the part that is retained as a film on rock/sediment grains, in unconnected “cut-off” pores, and in very small openings retained by capillary forces (called specific retention).
Table 2.4: Selected Values of Porosity, Specific Yield and Specific Retention Material Porosity Specific Yield Specific Retention
Soil (root zone) 55 40 15 Clay 50 2 48 Sand 25 22 3 Gravel 20 19 1 Limestone 20 18 2 Sandstone (semi-consolidated) 11 6 5 Granite 0.1 0.09 0.01 Basalt (young) 11 8 3
Source: USGS, 1983

aquilogic
17
Review of the Groundwater Hydrology of the Cadiz Project
October 2013
2.9 Heads and Gradients
The direction of the slope of the water table (unconfined aquifers) and potentiometric surface (confined aquifers) indicates the direction of groundwater movement. The position and the slope of the water table or potentiometric surface is determined by measuring the water level in wells relative to a datum plane that is common to all the wells (e.g. mean sea level). The water level in the well is referred to as the total hydraulic head for groundwater at that location. Total head, as defined in fluid mechanics, is composed of elevation head, pressure head, and velocity head. However, because groundwater moves relatively slowly, velocity head can be ignored. Therefore, the total head in a confined aquifer is equal to the elevation head plus the pressure head, and in an unconfined aquifer is equal to solely the elevation head.
Figure 2.5: Hydraulic Heads and Gradient
Adapted from: USGS, 1983
Groundwater moves in a direction from higher total head to lower total head. Total head varies laterally within an aquifer, but also vertically within and between aquifers; therefore, groundwater flow is nearly always in three-dimensions. All other factors being constant, the rate of groundwater movement depends on the hydraulic gradient. The hydraulic gradient is the change in head per unit of distance in a given direction. A minimum of three measuring points in the same aquifer are needed to determine the lateral direction of groundwater movement and the lateral hydraulic gradient. Additional measuring points screened at different depths are needed to determine the vertical direction and vertical hydraulic gradient.
aquilogic
18
Review of the Groundwater Hydrology of the Cadiz Project
October 2013
2.10 Hydraulic Conductivity
Aquifers move groundwater from recharge areas to discharge areas. The factors controlling groundwater movement were first expressed in the form of the following equation by Henry Darcy, a French engineer, in 1856:
Q = KiA
Where Q is the quantity of water per unit of time; K is the hydraulic conductivity; i is the hydraulic gradient (see Section 2.9); and A is the cross-sectional area, at a right angle to the flow direction, through which the flow occurs.
Hydraulic conductivity is a measure of the ability of an aquifer material to transmit water, and depends on the size and arrangement of the water-transmitting openings (pores and fractures) and on the dynamic characteristics of the fluid (water) such as kinematic viscosity, density, and the strength of the gravitational field. In simple terms, hydraulic conductivity (K) can be viewed as an inverse resistance term; that is, the lower the K value the more resistant the sediments are to allowing groundwater flow. Thus, the units of hydraulic conductivity are those of velocity (or distance divided by time).
It is still common practice to refer in qualitative terms to "permeable" (higher hydraulic conductivity) or “impermeable”(lower hydraulic conductivity). However, intrinsic permeability (lower case k) is strictly a function of the rock or sediment properties and not the dynamic properties of the water.
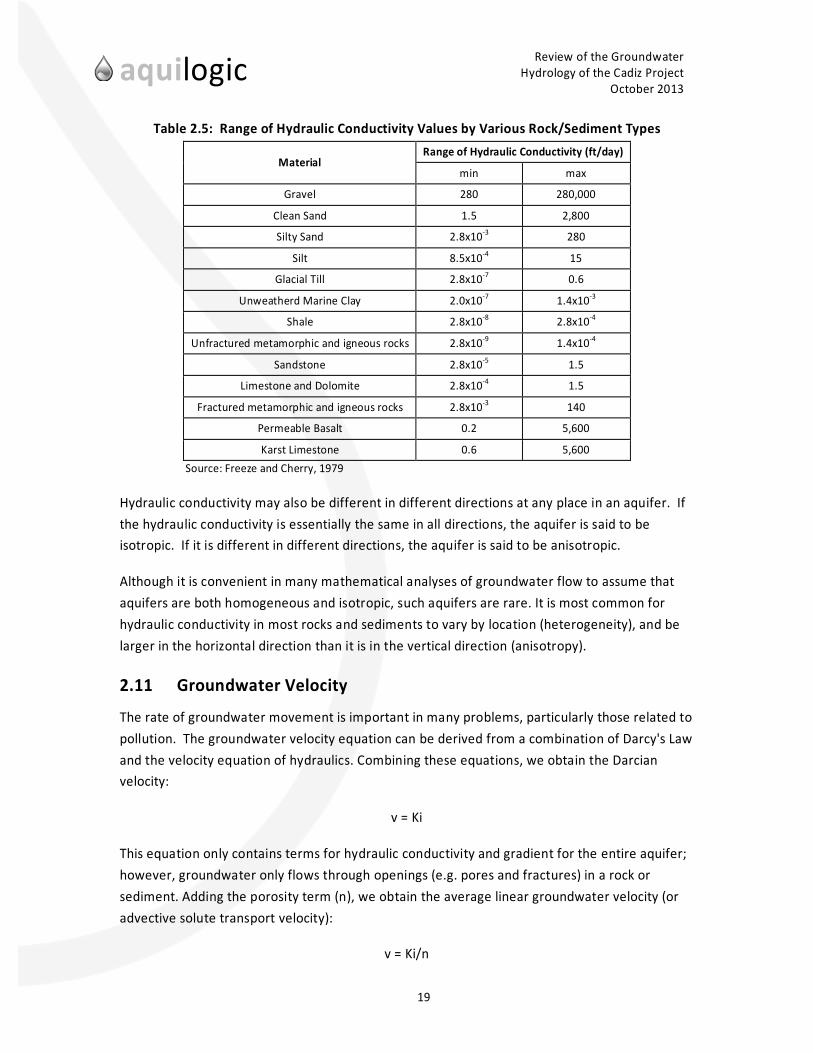
The hydraulic conductivity of rocks and sediments ranges through 12 orders of magnitude (see Table 2.5). There are few physical parameters in nature whose values range so widely. In addition, hydraulic conductivity is not only different in different types of rocks or sediments but may also be different from place to place in the same rock/sediment. If the hydraulic conductivity is essentially the same in any area, the aquifer is said to be homogeneous. If, on the other hand, the hydraulic conductivity differs from one part of the area to another, the aquifer is said to be heterogeneous.
aquilogic
19
Review of the Groundwater Hydrology of the Cadiz Project
October 2013
Table 2.5: Range of Hydraulic Conductivity Values by Various Rock/Sediment Types
Material Range of Hydraulic Conductivity (ft/day)
min max
Gravel 280 280,000
Clean Sand 1.5 2,800
Silty Sand 2.8x10⁻³ 280
Silt 8.5x10⁻⁴ 15
Glacial Till 2.8x10⁻⁷ 0.6
Unweatherd Marine Clay 2.0x10⁻⁷ 1.4x10⁻³
Shale 2.8x10⁻⁸ 2.8x10⁻⁴
Unfractured metamorphic and igneous rocks 2.8x10⁻⁹ 1.4x10⁻⁴
Sandstone 2.8x10⁻⁵ 1.5
Limestone and Dolomite 2.8x10⁻⁴ 1.5
Fractured metamorphic and igneous rocks 2.8x10⁻³ 140
Permeable Basalt 0.2 5,600
Karst Limestone 0.6 5,600 Source: Freeze and Cherry, 1979
Hydraulic conductivity may also be different in different directions at any place in an aquifer. If the hydraulic conductivity is essentially the same in all directions, the aquifer is said to be isotropic. If it is different in different directions, the aquifer is said to be anisotropic.
Although it is convenient in many mathematical analyses of groundwater flow to assume that aquifers are both homogeneous and isotropic, such aquifers are rare. It is most common for hydraulic conductivity in most rocks and sediments to vary by location (heterogeneity), and be larger in the horizontal direction than it is in the vertical direction (anisotropy).
2.11 Groundwater Velocity
The rate of groundwater movement is important in many problems, particularly those related to pollution. The groundwater velocity equation can be derived from a combination of Darcy's Law and the velocity equation of hydraulics. Combining these equations, we obtain the Darcian velocity:
v = Ki
This equation only contains terms for hydraulic conductivity and gradient for the entire aquifer; however, groundwater only flows through openings (e.g. pores and fractures) in a rock or sediment. Adding the porosity term (n), we obtain the average linear groundwater velocity (or advective solute transport velocity):
v = Ki/n
aquilogic
20
Review of the Groundwater Hydrology of the Cadiz Project
October 2013
In reality some openings do not transmit water (e.g. the specific retention), and only water-transmitting porosity (ne) can be substituted in the equation, where:
v = Ki/ne
Average linear velocities calculated using the above equations are, at best, average estimates. As discussed, most aquifers are heterogeneous, and groundwater velocities along preferential zones of increased permeability (e.g. sand lenses or fractures) may be several times higher than the average velocity. In addition, the rates of movement in limestone caverns, lava tubes, and large rock fractures may approach those observed in surface streams.
2.12 Transmissivity
The capacity of an aquifer to transmit water is referred to as its transmissivity (T), equal to the hydraulic conductivity (K) of the aquifer multiplied by the saturated thickness (b) of the aquifer:
T = Kb
If this equation is combined with Darcy's Law, the resultant equation can be used to calculate the quantity of water (Q) moving through a unit width (W) of an aquifer:
Q = TWi
Because transmissivity depends on both K and b, its value differs in different aquifers and from place to place in the same aquifer (as a result of heterogeneity and variation in aquifer thickness).
2.13 Cone of Depression
As groundwater is withdrawn from aquifers at pumping wells, the water level in the well begins to decline below the level in the surrounding aquifer as water is removed from storage. As a result, water begins to move from the aquifer into the well. As pumping continues, the water level in the well continues to decline, and the rate of flow into the well from the aquifer continues to increase until the rate of inflow equals the rate of withdrawal.

aquilogic
21
Review of the Groundwater Hydrology of the Cadiz Project
October 2013
Figure 2.6: Cones of Depression in Unconfined and Confined Aquifers
Adapted from: USGS, 1983
The movement of water from an aquifer into a well removes water from aquifer storage, and lowers water levels in the aquifer surrounding the well. This results in the formation of a cone of depression. Because water must converge on the well from all directions and because the area through which the flow occurs decreases toward the well, the hydraulic gradient must get steeper toward the well.
Several important differences exist between the cones of depression in confined and unconfined aquifers. Withdrawals from an unconfined aquifer result in drainage of water from the rocks and sediments through which the water table declines as the cone of depression forms and expands slowly. On the other hand, dewatering of the aquifer results in a decrease in transmissivity, which causes, in turn, an increase in drawdown both in the well and in the aquifer.
Withdrawals from a confined aquifer cause a drawdown in pressure head but do not (normally) cause a dewatering of the aquifer. The water withdrawn from a confined aquifer is derived from expansion of the water and compression of the rock/sediment matrix of the aquifer, which results in a very rapid expansion of the cone of depression. Consequently, the mutual interference of expanding cones around adjacent wells occurs more rapidly in confined aquifers than it does in unconfined aquifers.
2.14 Quality of Groundwater
Water frequently is referred to as the universal solvent because at least small amounts of almost all substances can dissolve in water. Therefore, as groundwater passes through the rock and sediments, small amounts of the minerals dissolve into the water. In addition, some mineral content in groundwater is also derived from chemicals in precipitation and soil biota or

aquilogic
22
Review of the Groundwater Hydrology of the Cadiz Project
October 2013
biological reactions. These naturally-occurring minerals are usually metals (cations, e.g. sodium), inorganic anions (e.g. chlorine), or salts (e.g. sodium chloride). Cumulatively, they are referred to as total dissolved solids (TDS).
Table 2.6: Natural Inorganic Constituents Commonly Dissolved in Groundwater
Substance Major natural sources Effect on Water Use Concentrations of Significance
(mg/L) Bicarbonate and carbonate
Products of the solution of carbonate rocks, mainly limestone and dolomite by water containing carbon dioxide.
Control the capacity of water to neutralize strong acids. Bicarbonates of calcium and magnesium decompose in steam boilers and water heaters to form scale and release corrosive carbon dioxide gas. In combination with calcium and magnesium, cause carbonate hardness.
150 - 200
Calcium and Magnesium
Soils and rocks containing limestone, dolomite, and gypsum. Small amounts from igneous and metamorphic rocks.
Principal cause of hardness and of boiler scale and deposits in hot water heaters.
25 – 50
Chloride In inland areas, primarily from seawater trapped in sediments at time of deposition. In coastal areas, from seawater in contact with freshwater in productive aquifers
In large amounts, increases corrosiveness of water and, in combination with sodium, gives water a salty taste.
250
Fluoride Both sedimentary and igneous rocks. Not widespread in occurrence
In certain concentrations, reduces tooth decay; at higher concentrations, causes mottling of tooth enamel.
0.7-1.2
Iron and Manganese
Iron present in most soils and rocks; manganese less widely distributed
Stain laundry and are objectionable in food processing, dyeing, bleaching, ice manufacturing, brewing, and certain other industrial processes.
> 0.3 (Iron) > 0.05 (Manganese)
Sodium Same as for chloride. In some sedimentary rocks, a few hundred milligrams per liter may occur in freshwater as a result of exchange of dissolved calcium and magnesium for sodium in the aquifer materials.
See chloride. In large concentrations, may affect persons with cardiac difficulties, hypertension, and certain other medical conditions. Depending on the concentrations of calcium and magnesium also present in the water, sodium may be detrimental to certain irrigated crops.
69 (irrigation) 20-170 (health)
Sulfate Gypsum, pyrite, and other rocks containing sulfur compounds.
In certain concentrations, gives water a bitter taste and, at higher concentrations, has a laxative effect. In combination with calcium, forms a hard calcium carbonate scale in steam boilers.
300-400 (taste) 600-1,000 (laxative)
Source: USGS, 1983
The concentrations of substances dissolved in water are usually reported as weight per unit volume of water (e.g. milligrams per liter [mg/L]). At standard temperature and pressure, one liter of water weighs one kilogram; therefore, one milligram in one kilogram, is one part per million (ppm). To provide a sense of scale, an Olympic swimming pool (50m x 25 m x 2m) contains 2,500,000 liters of water. A level teaspoon of salt weighs 5 grams. Therefore,

aquilogic
23
Review of the Groundwater Hydrology of the Cadiz Project
October 2013
dissolving a teaspoon of salt in an Olympic pool of pure water results in a dissolved salt concentration of 2 mg/L (or 2 ppm).
In addition to these naturally-occurring minerals, anthropogenic chemicals may also be present in groundwater. These include naturally-occurring metals (e.g. hexavalent chromium), nitrates, solvents (e.g. trichlorethene [TCE]), petroleum hydrocarbon constituents (e.g. benzene), fuel additives (e.g. MTBE), agricultural chemicals (e.g. DBCP), refrigerants (i.e. Freons), propellants/explosives (e.g. perchlorate), flame retardants, and pharmaceuticals. Many of these chemicals are mobile in groundwater and have some degree of toxicity to humans or biota. Therefore, their presence even at very low levels (i.e. parts per billion [ppb] or parts per trillion [ppt]) can require costly water treatment to meet water quality standards.
2.15 Saline Intrusion
Water that contains TDS concentrations less than 3,000 mg/L is generally considered “fresh” (although TDS concentrations greater than 1,000 mg/L may result in an unacceptable taste or odor). Water with higher TDS concentrations is considered brackish (3,000-10,000 mg/L), saline (10,000-35,000 mg/L), or a brine (>35,000 mg/L, the TDS in seawater).
Saline or brackish waters can be found in coastal areas due to seawater intrusion, in areas where deep, highly-mineralized waters up-well into aquifers due to over-pumping, beneath dry lakes where evaporation has concentrated minerals in the groundwater, or as a result of anthropogenic activity (e.g. agricultural practices or oil-field produced waters).
Groundwater with elevated TDS concentrations will still move in response to the differences in total hydraulic head (laterally and vertically). However, given the increased TDS concentrations, saline water and brines will have higher densities and vertical movement is accentuated, with saline waters “sinking” beneath any freshwater resulting from precipitation or migration of “fresh” groundwater. This is particularly evident in coastal areas, where “fresh” groundwater is moving toward the sea, forming a freshwater lens above a wedge of saline seawater that has intruded into the near-coastal aquifers.
The higher the water-table stands above sea level, the thicker the freshwater lens. When freshwater heads are lowered by withdrawals at pumping wells, the freshwater-saltwater contact migrates toward the point of withdrawal. The movement of saltwater into zones previously occupied by freshwater is referred to as saltwater encroachment or intrusion. Saltwater encroachment is a serious problem in coastal areas with urban populations and significant groundwater pumping. In many of these areas (e.g. Los Angeles and Orange Counties), freshwater injection wells are used to form a hydraulic barrier to prevent further saltwater intrusion.

aquilogic
24
Review of the Groundwater Hydrology of the Cadiz Project
October 2013
It is important to remember that saltwater encroachment may not be detected in shallow wells, given that the higher-density saline water will be migrating at depth as a saltwater wedge below a freshwater lens. Thus, pumping wells are usually impacted by saline waters due to upwelling induced by pumping.
aquilogic
25
Review of the Groundwater Hydrology of the Cadiz Project
October 2013
3.0 SITE SETTING
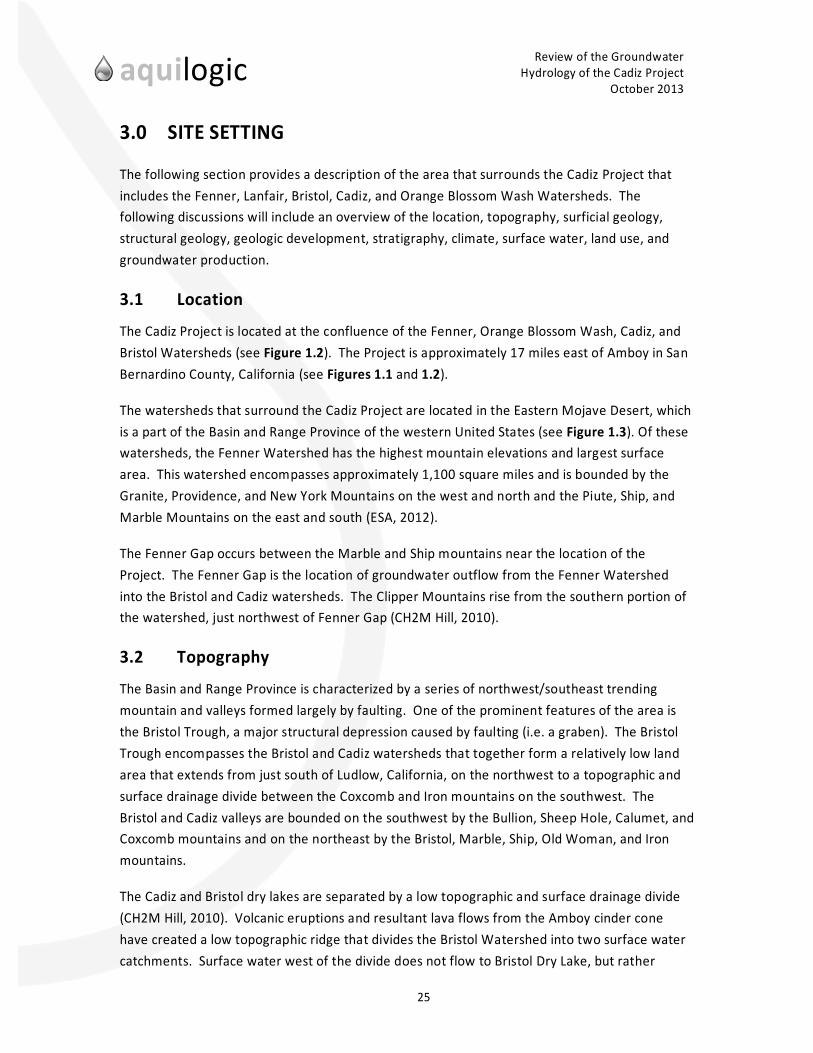
The following section provides a description of the area that surrounds the Cadiz Project that includes the Fenner, Lanfair, Bristol, Cadiz, and Orange Blossom Wash Watersheds. The following discussions will include an overview of the location, topography, surficial geology, structural geology, geologic development, stratigraphy, climate, surface water, land use, and groundwater production.
3.1 Location
The Cadiz Project is located at the confluence of the Fenner, Orange Blossom Wash, Cadiz, and Bristol Watersheds (see Figure 1.2). The Project is approximately 17 miles east of Amboy in San Bernardino County, California (see Figures 1.1 and 1.2).
The watersheds that surround the Cadiz Project are located in the Eastern Mojave Desert, which is a part of the Basin and Range Province of the western United States (see Figure 1.3). Of these watersheds, the Fenner Watershed has the highest mountain elevations and largest surface area. This watershed encompasses approximately 1,100 square miles and is bounded by the Granite, Providence, and New York Mountains on the west and north and the Piute, Ship, and Marble Mountains on the east and south (ESA, 2012).
The Fenner Gap occurs between the Marble and Ship mountains near the location of the Project. The Fenner Gap is the location of groundwater outflow from the Fenner Watershed into the Bristol and Cadiz watersheds. The Clipper Mountains rise from the southern portion of the watershed, just northwest of Fenner Gap (CH2M Hill, 2010).
3.2 Topography
The Basin and Range Province is characterized by a series of northwest/southeast trending mountain and valleys formed largely by faulting. One of the prominent features of the area is the Bristol Trough, a major structural depression caused by faulting (i.e. a graben). The Bristol Trough encompasses the Bristol and Cadiz watersheds that together form a relatively low land area that extends from just south of Ludlow, California, on the northwest to a topographic and surface drainage divide between the Coxcomb and Iron mountains on the southwest. The Bristol and Cadiz valleys are bounded on the southwest by the Bullion, Sheep Hole, Calumet, and Coxcomb mountains and on the northeast by the Bristol, Marble, Ship, Old Woman, and Iron mountains.
The Cadiz and Bristol dry lakes are separated by a low topographic and surface drainage divide (CH2M Hill, 2010). Volcanic eruptions and resultant lava flows from the Amboy cinder cone have created a low topographic ridge that divides the Bristol Watershed into two surface water catchments. Surface water west of the divide does not flow to Bristol Dry Lake, but rather
aquilogic
26
Review of the Groundwater Hydrology of the Cadiz Project
October 2013
evaporates at a topographic low west of the lava flows. Whereas, surface water east of the divide does flow to Bristol Dry Lake.
Figure 3.1: Project Area Topography
aquilogic
27
Review of the Groundwater Hydrology of the Cadiz Project
October 2013
As can be seen on Figure 3.1, the New York Mountains, at the northern extent of the Fenner Valley, rise to elevations of approximately 7,532 feet above mean sea level (MSL). The Granite and Providence Mountains, to the west and northwest, range from 6,786 feet to 7,178 feet above MSL, respectively. The Piute Mountains located to the northeast, range up to 4,165 feet above MSL. The Clipper Mountains in the center of the Fenner Valley rise to an elevation of more than 4,600 feet above MSL. Finally, the Marble and Ship mountains, located to the southwest and south of the Clipper Mountains in the center of the Fenner Valley, range up to 3,842 and 3,239 feet above MSL, respectively. Generally, the Fenner Valley slopes southward toward the Fenner Gap, which is the groundwater outlet from the valley, at an elevation of about 900 feet above MSL (CH2M Hill, 2010).
The mountain ranges surrounding the Bristol and Cadiz watersheds are lower in elevation than those mountain ranges surrounding the Fenner Watershed. Peak elevations for these mountains include the following: Bristol at 3,422 feet above MSL; Iron at 3,296 feet above MSL; Bullion at 4,187 feet above MSL; Sheep Hole at 4,685 feet above MSL; Calumet at 1,751 feet above MSL; and Coxcomb at 4,416 feet above MSL.
The alluvial basins surrounded by these mountain ranges form gently sloping topographic valleys. In the Lanfair Valley, the alluvial surface slopes to the southeast and ranges in elevation from approximately 4,500 to 3,500 feet above MSL. In the Fenner Valley, the alluvial surface slopes generally to the south and ranges in elevation from 3,500 to 1,000 feet above MSL. In the Orange Blossom Wash, the alluvial surface slopes to the southeast and ranges in elevation from 2,500 to 1,000 feet above MSL. In the Bristol and Cadiz Valleys, the alluvial surface slopes radially toward the dry lakes, and ranges in elevation from 1,000 to 600 feet above MSL.
The Bristol and Cadiz dry lakes represent the lowest elevations within the Watersheds at 595 and 545 feet above MSL, respectively.
3.3 Surficial Geology
The surficial geology in the vicinity of the Project can be classified into the following three types of cover:
Bedrock outcrops and mountain exposures; Hillslope erosional deposits; and Alluvial basins.
In general, the bedrock outcrops and exposures in the mountains are either Archean granite, Cambrian shale, dolomitic limestone and quartzite, Permian carbonate limestone, or Jurassic granite, with some Tertiaty volcanics. The hillslope deposits are either exposed Miocene fanglomerates or Quaternary colluvium, talus, and landslide deposits, with disaggregated cover over the mountain bedrock. The surficial materials in the alluvial basins are generally coarse-

aquilogic
28
Review of the Groundwater Hydrology of the Cadiz Project
October 2013
grained Quaternary sediments ranging from fine-sand to cobbles, with some finer-grained Holocene sediment in ephemeral stream channels.
Cadiz and Bristol dry lakes are locally bordered by active dunes formed by fine to medium-grained windblown sand. These Holocene deposits overlie older playa deposits of differentiated Quaternary age (CH2M Hill, 2010).
Amboy Crater, located near the western margin of Bristol Dry Lake, is a basaltic cinder cone and lava field believed to be as young as 6,000 years.
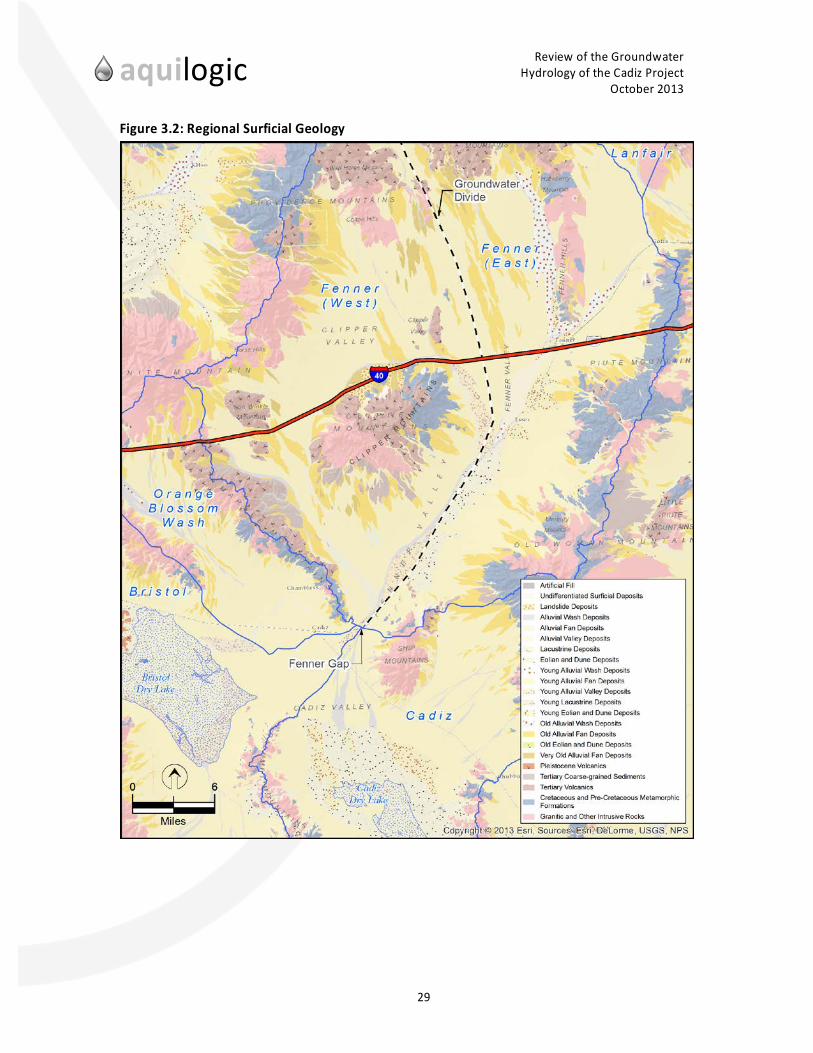
aquilogic
29
Review of the Groundwater Hydrology of the Cadiz Project
October 2013
Figure 3.2: Regional Surficial Geology

aquilogic
30
Review of the Groundwater Hydrology of the Cadiz Project
October 2013
3.4 Structural Geology
The project area of study is located at the eastern margin of the eastern California shear zone, a broad seismically active region dominated by northwest-trending right-lateral strike-slip faulting. Roughly a dozen fault zones showing evidence of Quarternary movement (during the last 1.6 million years) have been identified in, and adjacent to, Bristol, Cadiz, and Fenner valleys (CH2M Hill, 2010).
Cadiz Valley is underlain by two major northwest-trending faults, inferred on the basis of gravity and magnetic data. These fault zones have strike lengths of at least 25 miles, and may merge to the north and northwest with extensions of the Bristol-Granite Mountains and South Bristol Mountains fault zones (CH2M Hill, 2010).
Right-lateral slip of as much as 16 miles along the Cadiz Valley fault zone has been postulated on the basis of correlation of a distinctive Precambrian gneiss unit across the zone. Slickenside surfaces produced by fault movement and steeply dipping sediments recovered from cored drill holes beneath Cadiz Dry Lake suggest the fault zone displaces sediments of Pleistocene age (CH2M Hill, 2010).
Bristol Dry Lake is bordered by probable extensions of the Cadiz Valley and South Bristol Mountains fault zones to the east, and by probable extensions of the Broadwell Lake and Dry Lake fault zones to the west. Geophysical data indicate this structural depression (or graben) may exceed 6,000 feet in depth. Geologic cores recovered from drilling at depths of more than 1,000 feet beneath Bristol Dry Lake suggest that subsidence of this basin began by Pliocene time and continues to the present, and therefore may be tectonically active (CH2M Hill, 2010).
Fenner Gap appears to be a structural sub-graben, formed by a system of northeast-trending, northwest-dipping normal faults, some of which are exposed in outcrops of the bedrock that flank the gap. The presence of these northeast-trending faults beneath the alluvial deposits that underlay the gap can be inferred from surface geology mapping, gravity surveys, a seismic reflection survey conducted across the gap, and recent test wells drilled in the Fenner Gap (CH2M Hill, 2010).
The system of normal faults that formed the sub-graben of Fenner Gap displace and tilt volcanic rocks of mid- to late- Tertiary age. However, these faults do not displace Quarternary sediments and are, therefore, not considered to be either active or potentially active (CH2M Hill, 2010).
The mountains that flank the Bristol-Cadiz graben are essentially block mountains (horsts) that have been uplifted relative to the adjacent graben and sub-grabens.
In addition to tectonic movement, Jurassic plutonic intrusions have affected the structural evolution of the regional geology. In many areas, including the Fenner Watershed, the

aquilogic
31
Review of the Groundwater Hydrology of the Cadiz Project
October 2013
intrusions created broad anticlinal structures. Subsequently, these structures were partially eroded-away and in-filled with fanglomerates and alluvium.
3.5 Geologic Development of the Project Area
The oldest rocks underlying the project area are Archean granites. During the Archean or Cambrian periods, a series of major northwest-southeast fault zones developed. These fault zones include the South Bristol Mountains – Cadiz Valley fault zone, the Broadwell Lake – Calumet – Dry Lake fault zone, and the Ludlow – Sheep Hole fault zone. Over time, the area between these fault zones subsided creating a deep (>6000 feet) graben structure. During the Cambrian and Permian periods, the Archean granites were overlain by sedimentary units, predominantly dolomite limestone, shale, and carbonate limestone (karst), likely deposited during periods of shallow marine inundation (limestone) and deltaic or continental settings (shales).
During the Jurassic period, plutonic intrusions (likely coupled with movement along the fault zones) uplifted the Cambrian and Permian sediments to the northeast of the Cadiz Valley fault zone into a broad anticline. In addition, ancillary, unnamed faults (mapped by Kenney, 2012), perpendicular to the main fault zone created “sub-grabens” (e.g. the Fenner Gap, and sub-basins within the Fenner watershed) and a series of horsts (e.g. Marble Mountains, Ship Mountains). Subsequent to the Jurassic intrusions, the sediments of the anticline were partially eroded away. In the higher-energy mountain environments, only isolated areas of Cambrian and Permian rocks remain on the flanks of the mountains, and uplift and erosion exposed the Jurassic granite plutons at these horsts. Within the sub-grabens, erosion created an unconformity at the top of Cambrian and Permian units formerly folded in a broad anticline. During the Miocene, portions of the sub-grabens were in-filled with fanglomerates, and during the Quaternary period, substantial thicknesses of alluvium accumulated in the sub-grabens and basins. The Quaternary alluvium is present at the surface across most of the basins. However, in areas with ephemeral streams flow, a thin veneer of Holocene alluvium is present. In addition, late Quaternary and Holocene volcanic deposits are present associated with eruptions from the Amboy cinder cone, northwest of the Bristol Dry Lake.
This geological development has resulted in a deep graben (rift-valley) underlying the Bristol and Cadiz dry lakes, flanked by a series of horsts (block mountains). Ancillary faults, perpendicular to the main fault zones, have created sub-grabens and broad basins between the horsts. The horsts are primarily Jurassic granite plutons with isolated areas of Cambrian or Permian sediments on their flanks, notably dolomites and carbonate limestone (karsts). Within the basins, a thick sequence of quaternary alluvium covers an erosional unconformity (an eroded anticline created by Jurassic plutonic intrusion), and localized dolomite, carbonate, and shale are found beneath the alluvium.

aquilogic
32
Review of the Groundwater Hydrology of the Cadiz Project
October 2013
The geologic development has, over time, created a closed hydrologic system. The alluvial basins are flanked by mountains on most sides. Given the arid climate, only brief ephemeral surface water flows occur during major storm events. Surface waters flow down the channels in the alluvium and discharge to the dry lakes, the lowest points in the closed hydrologic system. However, most water enters the system as infiltration in the surrounding mountains (both from rainfall and snow-melt) and, to a much lesser degree, infiltration across the alluvium. This infiltration recharges the groundwater within the basins, and groundwater flows toward the deep graben. Both surface water and groundwater exit the hydrologic system as evaporation at the dry lakes. Over geologic time, this has resulted in a deep saline water body beneath the dry lakes. Given the flow of groundwater into the graben from the surrounding basins, and the density of the saline water, the zone of saline water has been restricted to the graben (i.e. directly beneath the dry lakes), but likely extends many thousands of feet.
3.6 Stratigraphy
The stratigraphy and structures observed in the Fenner Gap and adjacent mountains are typical of the geologic history of the Basin and Range Province. The region exhibits Paleozoic sedimentary craton platform deposits overlying pre-Cambrian igneous and metamorphic cratonal rocks. These rocks were then intruded by Mesozoic age igneous plutonic rocks, and then extended in the Miocene during regional extension. Since the Miocene, the region has been relatively tectonically inactive with the exception of relatively minor right-lateral strike-slip faulting due to the San Andreas Fault System. For the most part, since the Miocene, the dominating geologic processes have involved erosion of the local mountains and sediment infilling of the adjacent basins (Geoscience, 2011a).
The lithology within the Fenner Gap is complex due to historic tectonic activity and varies with distance away from the mountains towards the center of the gap. A generalized lithologic column can be seen in Figure 3.3, and is based on the geologic interpretation presented by Kenney Geoscience (2011). Generally, there is up to 1,000 feet of Tertiary to Quaternary alluvial deposits overlying Archean granitic bedrock. However, depending on the location within the Fenner Gap, there may be up to 1,000 feet of Miocene fanglomerates underlying the alluvial sediments. Underlying the fanglomerates, there may be up to 200 feet of a Jurassic igneous suite, including granite and gneiss. Underlying the Jurassic igneous suite may be up to 100 feet of limestone (Late Paleozoic), and up to 500 feet of Dolomite (Early Paleozoic). Underlying the dolomite and overlying the Archean granite may be up to 200 feet of Lower Cambrian-aged meta-sedimentary deposits, including limestone, shale, siltstone, and quartzite.

aquilogic
33
Review of the Groundwater Hydrology of the Cadiz Project
October 2013
Figure 3.3: Generalized Stratigraphic Column of the Fenner Gap
Geologic Scale
Fenner Gap
Quaternary
Alluvial Sediments (TQal) (up to 1,000 feet)
Tertiary Miocene
Fanglomerates (Mf) (0-1,000 feet)
Middle to Late Jurassic Igneous Suite (Jgr/Jdg/Jgr-Ar)
(0-200 feet)
Late Paleozoic Limestone (Bs)
(0-100 feet)
Early Paleozoic Dolomite (Bk)
(0-500 feet)
Lower Cambrian
Meta-Sedimentary Suite (Ca/Ch/La/Za/Wc)
(0-200 feet) Archean
Granite (Ar)
Note: Not to Scale
3.7 Climate
The eastern Mojave Desert is characterized as an arid desert climate with low annual precipitation, low humidity, and relatively high temperatures. Winters are mild and summers

aquilogic
34
Review of the Groundwater Hydrology of the Cadiz Project
October 2013
are hot, with a relatively large range in daily temperatures. Temperature and precipitation vary greatly with altitude, with higher temperatures and lower precipitation at low altitudes and lower temperatures and higher precipitation at higher altitudes (CH2M Hill, 2010).
3.7.1 Precipitation
Annual average precipitation at Mitchell Caverns, located at an altitude of 4,350 feet above MSL, is 10.47 inches. Amboy is represented by two stations, Amboy – Saltus Number 1, with an elevation of 624 feet above MSL and a long-term annual average precipitation of 3.28 inches (from 1967 through 1988) and Amboy – Saltus Number 2, with an elevation of 595 feet above MSL and long-term annual average precipitation of 2.71 inches (1972 through 1992) (CH2M Hill, 2010).
Isohyet maps prepared using the PRISM model for the period 1971 through 2000 shows average annual precipitation that varies from about 4 inches in Bristol Valley to more than 12 inches in the New York Mountains (see Figure 3.4). Relatively dry conditions prior to the mid-1970s (overall declining trend in the cumulative departure curve) and relatively wet conditions (overall rising trend in the cumulative departure curve) since the mid-1970s is typical of much of southern California (CH2M Hill, 2010).

aquilogic
35
Review of the Groundwater Hydrology of the Cadiz Project
October 2013
Figure 3.4: Precipitation Isohyets for the Watersheds Surrounding the Cadiz Project

aquilogic
36
Review of the Groundwater Hydrology of the Cadiz Project
October 2013
3.7.2 Temperature
Air temperature in the eastern Mojave Desert reaches highs in the summer and lows in the winter. The average winter temperature is between 50 °F and 55 °F, with average daily maximum near 65 °F and average daily minimum near 40 °F. Average daily temperature in the summer months is over 85 °F, with maximum temperatures near 100 °F and occasionally exceeding 120 °F. Average daily minimum temperatures in the summer are around 70 °F, so the range of daily temperatures may exceed 20 °F to 30 °F (CH2M Hill, 2010).
The two weather stations in the area, Amboy and Mitchell Caverns, record air temperature. The minimum monthly temperature at Amboy is reported to be 50.7 °F in December and the maximum monthly temperature is 94.7 °F in July. The minimum monthly temperature at Mitchell Caverns is reported to be 46.3 °F in January and the maximum monthly temperature is 82.1 °F in July. The average annual temperatures at Amboy and Mitchell Caverns are 71.8 °F and 62.6 °F, respectively (CH2M Hill, 2010).
3.8 Surface Water
3.8.1 Intermittent Streams
The Watersheds form a closed drainage system with no surface outflow; all surface water in the Project area drains to Bristol and Cadiz dry lakes. The only outlets for surface water are direct evaporation of surface water, uptake and transpiration by vegetation, infiltration and then evaporation of soil moisture from the unsaturated zone, and direct evaporation from the Dry Lake surfaces (ESA, 2012).
There are no perennial (year-round) streams in the Watersheds. Intermittent streams are distributed throughout the Watersheds. Ephemeral runoff within the Fenner Watershed flows into the Schulyer Wash, the principal drainage in the Fenner Valley Watershed, and then flows through Fenner Gap to either Bristol or Cadiz dry lakes. Ephemeral runoff within the Orange Blossom Wash flows into Bristol Dry Lake. Ephemeral flow in the Bristol and Cadiz Watersheds flows into the Bristol or Cadiz dry lakes, respectively (ESA, 2012).
It should be noted that the surface water catchments within the watersheds may not map directly to the underlying groundwater basins. As noted, the Bristol Watershed can be divided into two surface water catchments separated by a low topographic ridge associated with the Amboy volcanics. However, it is likely that all groundwater in the Bristol Watershed flows to the Bristol Dry Lake. The Lanfair Valley is located to the northwest of the Fenner Watershed. Surface water in the Lanfair Valley appears to flow to the southeast, enters the Ward Valley, and eventually drains to the Danby Dry Lake. However, groundwater in the Lanfair basin likely flows directly south into the eastern portion of the Fenner Watershed, and thence through the Fenner Gap to Cadiz Dry Lake.
aquilogic
37
Review of the Groundwater Hydrology of the Cadiz Project
October 2013
3.8.2 Springs
Some naturally-occurring springs and wet-ground that support denser vegetation are present at higher elevations within the mountain ranges that surround the Watersheds. No springs, wetlands, or phreatophyte vegetation are present in the lower elevations within the intervening basins and washes because the depth to groundwater in the alluvium is too great. Many of the “springs” are supported by pipes or tunnels that have been driven into the subsurface to intercept groundwater and create “guzzlers”. Many of these guzzlers are used by hunters to lure Big Horn Sheep, or were used historically for railroad operations.
The closest naturally occurring spring to the Cadiz Project is the Bonanza Spring located more than 11 miles north of Fenner Gap in the Clipper Mountains (Figure 3.3). Bonanza Spring is at an elevation of about 2,100 feet above MSL, substantially above the adjacent Fenner Valley floor at about 1,350 feet above MSL. More distant springs are found in the upper elevations of the Granite, Marble, Clipper, and Old Woman Mountains. Recent field mapping of the Marble Mountains has revealed numerous ephemeral pools or tinajas fed exclusively by surface run-off and guzzlers (ESA, 2012).
It should be noted that these springs are found at elevations well above groundwater in nearby alluvial sediments. Therefore, they are likely sustained by localized, perched groundwater that mounds behind fault scarps or lower-permeability strata. As such, the springs are not in direct hydraulic communication with groundwater in the alluvium (see Section 6.1).

aquilogic
38
Review of the Groundwater Hydrology of the Cadiz Project
October 2013
Figure 3.5: Springs within the Project Area
aquilogic
39
Review of the Groundwater Hydrology of the Cadiz Project
October 2013
3.9 Land Use
Land use in the area consists primarily of desert conservation open space. There are isolated areas of agriculture, limited chloride mining of the brine from the dry lakes, and localized mining, military use, recreation, railroad, and electrical, gas, and oil utility corridors (ESA, 2012).
3.10 Groundwater Production
Cadiz used, on average, 5,000 to 6,000 acre-foot per year (AFY) of groundwater between 1994 and 2007 for its agricultural operations. This annual usage was reduced beginning in 2007 in connection with the removal of approximately 500 acres of vineyard. Based on the current crop mix, the agricultural operations are using approximately 1800-1900 AFY (ESA, 2012).
Two existing salt mining operations at the Bristol and Cadiz dry lakes involve evaporation of the hyper-saline groundwater from the dry lakes to obtain the remaining salts. One operation uses approximately 500 AFY of the hyper-saline groundwater based upon recorded water extractions, while the other operation uses approximately 250 AFY, for a total of 750 AFY (ESA, 2012).

aquilogic
40
Review of the Groundwater Hydrology of the Cadiz Project
October 2013
4.0 HYDROGEOLOGY OF THE PROJECT AREA
4.1 Hydrologic Inputs
4.1.1 Precipitation
Most of the precipitation in the Eastern Mojave Desert accumulates between November and March. In general, the amount of precipitation increases with increasing elevation, and snow can accumulate at higher elevations (greater than 5,000 feet above MSL). Average annual precipitation ranges from approximately three inches on the Cadiz and Bristol dry lakes (elevations of 545 to 595 feet above MSL) to over 12 inches in the Providence and New York Mountains (elevations over 7,000 feet above MSL). Aquilogic has prepared the table below which summarizes the total volume of precipitation that falls on each of the watersheds:
Table 4.1: Total Volume of Precipitation by Watershed
Watershed Area (sq ft) Precipitation Volume (AFY)
Bristol 22,141,717,000 170,541
Orange Blossom Wash 4,736,693,394 46,232
Fenner (West) 13,700,280,036 173,716
Fenner (East) 16,625,535,879 234,753
Lanfair 7,831,938,617 123,806
Cadiz 16,482,012,982 131,042
Total 81,518,177,907 880,090
4.1.2 Infiltration
Nearly all of the rainfall that falls on the alluvium enters shallow soil moisture storage or flows as run-off in ephemeral rills and streams, only to infiltrate downstream into unsaturated soils. After the rainfall events, most of this water is lost to the system as evapotranspiration and never recharges groundwater. Most of the recharge into the groundwater basins comes from water that has infiltrated in the surrounding mountains, and thence recharges groundwater as fracture-baseflow from bedrock to alluvium, or infiltration of surface water flows at the mountain bedrock-alluvium contact. Thus, the source of most of the groundwater recharge within the Watersheds occurs in the higher elevations since they receive higher volumes of precipitation.
It should be noted that no direct measurements of infiltration have been made at any locations within the Watersheds. Estimates of infiltration, and resulting groundwater recharge, have been based on calculations using other parameter inputs (e.g. rainfall and surface cover).

aquilogic
41
Review of the Groundwater Hydrology of the Cadiz Project
October 2013
4.1.3 Recharge
Several estimates of groundwater recharge have been completed for the project area since 1984. More recently, recharge estimates have been presented by Geoscience Support Services, Inc. (Geoscience; 1999), United States Geological Survey (USGS; 2000), and Lawrence Livermore National Laboratory (LLNL; 2000).
Geoscience (1999) estimated groundwater recharge based on a watershed model that included variables that affect the daily water balance of the watershed, including precipitation, runoff, vegetation interception, infiltration, evapotranspiration, soil moisture, and percolation. Geoscience estimated the total recoverable groundwater for the entire project area (Bristol, Cadiz, and Fenner watersheds) to range between 19,886 and 58,268 AFY. The recharge estimates for the Fenner and Orange Blossom Wash Watersheds range from 14,646 to 37,254 AFY and 1,193 to 4,285 AFY, respectively. This provides an estimate for the combined total recoverable groundwater (Fenner and Orange Blossom Wash) of 15,839 to 41,539 AFY (CH2M Hill, 2010).
The USGS (2000) estimated groundwater recharge based on a modified Maxey-Eakin model of the project area (Bristol, Cadiz, and Fenner Watersheds), which was used to estimate groundwater recharge as a percentage of the average annual precipitation within discrete elevation-precipitation-recharge zones. The model estimated a median groundwater recharge rate of 2,550 to 11,800 AFY, of which 2,070 to 10,343 AFY was estimated for the Fenner Watershed alone (CH2M Hill, 2010).
The LLNL (2000) reviewed the USGS (2000) Maxey-Eakin groundwater recharge estimates and concluded that they underestimated recharge to the Fenner Watershed. Lawrence Livermore National Laboratory (2000) developed a separate Maxey-Eakin model of the Fenner Watershed, which estimated a recharge rate between 7,864 and 29,815 AFY, based on local precipitation (CH2M Hill, 2010).
Additionally, an estimated groundwater recharge value of approximately 32,000 AFY was generated by CH2M Hill (2010) using the model INFIL 3.0 for the model period of 1958 to 2007. The average annual groundwater recharge quantities for the Fenner Watershed, Orange Blossom Wash Watershed, and in total, were estimated using the INFIL 3.0 model at 30,191 AFY, 2,256 AFY, and 32,447 AFY, respectively (CH2M Hill, 2010).
4.2 Groundwater Flow
In the Bristol and Cadiz Watersheds, groundwater flows radially toward the dry lakes from the surrounding hills and mountains. In the Orange Blossom Wash, groundwater flows to the southeast from the Granite Mountains through the wash, and then to the southwest into Bristol Dry Lake. In the Fenner Watershed, groundwater generally flows radially from the surrounding
aquilogic
42
Review of the Groundwater Hydrology of the Cadiz Project
October 2013
mountains to the center of the valley and thence southward. A groundwater divide exists within the watershed. Recharge from the Providence, Granite, Clipper and Marble mountains (the western portion of the watershed) eventually discharges through the Fenner Gap to the Bristol Dry Lake. Recharge from the New York, Old Women and Ship mountains (eastern portion) eventually discharges through the Fenner Gap to the Cadiz Dry Lake.
As noted, it is likely that groundwater from the Lanfair Valley flows into the eastern portion of the Fenner Watershed, and eventually discharges to Cadiz Dry Lake.
4.3 Hydrologic Outflow
4.3.1 Groundwater Pumping
Cadiz currently owns and operates seven full-scale irrigation wells in the Cadiz Valley, including Wells 21 South, 21 North, 22, 27 South, 27 North, 28 and 33. During the period from 1986 to 2009, the total annual amount of groundwater pumped by Cadiz ranged from approximately 1,882 acre-feet in 2009 to 6,689 acre-feet in 1990 with an annual average of 4,602 AFY. In addition, a total of 1,118 acre-feet of groundwater was pumped from Well PW-1 to provide a source of water for the pilot infiltration test conducted during the period between March and September 1999 (Geoscience, 1999). Since 2007, with changes in agricultural operations, the pumping rate has been reduced to between 1,800 and 1,900 AFY.
4.3.2 Dry Lakes
The Bristol and Cadiz dry lake playas are located at the lowest elevations in the Watersheds that surround the Project (discussed previously). All of the watersheds in the project area (including the Bristol and Cadiz Watersheds) are closed; that is, neither surface water nor groundwater discharge to adjacent watersheds. Therefore, the only natural outlet for surface and groundwater is evaporation from the dry lakes.
During sudden spring snow thaws and/or late summer thunderstorms of high intensity, surface water flows to the dry lakes and standing water can occur (CH2M Hill, 2010); however, the standing water rapidly evaporates immediately after such flash flooding events.
The dry lake playas consist of a variety of surface types, including salt crust and soft puffy porous surfaces which are largely devoid of vegetation. Clay and silts are the predominant soil types beneath the surface. Puffy surfaces are believed to be formed from upward groundwater movement in the capillary zone causing salts to precipitate and clays to swell on the surface, resulting in a network of polygons and hummocky relief. This puffy surface is reported to cover more than 60 percent of Bristol Dry Lake (CH2M Hill, 2010).
aquilogic
43
Review of the Groundwater Hydrology of the Cadiz Project
October 2013
4.3.3 Evapotranspiration
Geoscience (2000) developed a range of estimates of evapotranspiration from Bristol and Cadiz dry lakes, using three different methods, which ranged from 11,665 to 105,436 AFY. The upper range of values was based on evapotranspiration estimates at Amboy and Franklin Dry Lake Playa. An energy-balance, eddy-correlation technique was used to estimate evapotranspiration from the playa lake surface, which resulted in evapotranspiration rates of 0.1 to 0.3 centimeters per day (cm/d) (approximately 1.2 to 3.6 feet per year [ft/yr]) (CH2M Hill, 2010; ESA, 2012).
The USGS estimated evapotranspiration for a number of areas in the Death Valley regional flow system, which included estimates for open playas similar to the Bristol and Cadiz dry lakes. The USGS estimated evapotranspiration rates from 0.1 to 0.7 feet/yr. They adjusted these evapotranspiration rates by the estimated long-term average annual precipitation rate (by subtracting the precipitation rate) to get evapotranspiration rates ranging from 0.15 to 0.21 ft/yr. However, the contribution of precipitation to evapotranspiration is uncertain. Given the high rate of evaporation in these arid environments, precipitation may not affect the evapotranspiration rates as estimated from micrometerological measurements. Using a range of 0.1 to 0.7 ft/yr gives a range of evapotranspiration rates of 5,965 to 41,755 AFY for the Bristol and Cadiz dry lakes (CH2M Hill, 2010).
Between May and November 2011, Desert Research Institute (DRI, 2012), conducted an investigation on Bristol and Cadiz dry lakes to determine project-specific evaporation rates during the dry months when precipitation is absent. The investigation estimated an evaporation rate from Bristol Dry Lake of 7,860 AFY and from Cadiz Dry Lake of 23,730 AFY, for a total evaporation rate of 31,590 AFY (CH2M Hill, 2012). According to CH2M Hill (2012), the evaporation rate estimates were determined by extrapolating the measured data to an area over which evaporation was expected to occur, and for a full year based on expected monthly variations, as observed from pan and measured evaporation rates from Amboy and Franklin Dry Lake. The estimated annual evaporation rates calculated by DRI (2012), are considered conservative, as they do not take into account the additional groundwater losses due to agricultural pumping by Cadiz, Inc. (4,600 AFY average production), or due to the salt-mining operations on the dry lakes (~750 AFY) (CH2M Hill, 2012). It should be noted that the evaporation rates are for dry-weather evaporation; that is, groundwater-supported evaporation. They do not include direct evaporation of ponded rainfall or surface water inflows, or evaporation from the resultant shallow soil moisture, immediately after a rainfall event.
4.4 Storage Volume
The volume of groundwater in storage in the alluvium of the Watersheds has been estimated to be between 17 and 34 million acre-feet (AF). However, this storage estimate does not include water contained within the carbonate and fractured portion of the bedrock beneath the

aquilogic
44
Review of the Groundwater Hydrology of the Cadiz Project
October 2013
alluvium. Recent investigations have determined that these units may also store and conduct large volumes of groundwater. In addition, this storage estimate does not include groundwater within the Lanfair Valley, probably between two and four MAF that is likely tributary to the Fenner basin. As such, the estimated volume of groundwater in storage is a conservative estimate, and the actual volume is most likely greater (CH2M Hill, 2010).
4.5 Aquifers
In the project area, the majority of the geologic deposits that store and transmit groundwater (i.e., aquifers) can be divided into the following four units:
Upper alluvial aquifer; Lower alluvial aquifer; Tertiary fanglomerates; and Carbonate bedrock aquifer (consists primarily of Paleozoic limestone).
The alluvial aquifer units and the carbonate bedrock aquifer are in hydraulic continuity with each other. The differentiation is primarily due to stratigraphic differences and the extent of interconnecting secondary porosity with the carbonate unit (Geoscience, 2011a).
4.5.1 Alluvial Aquifer
The alluvial aquifer system is comprised mainly of Quaternary alluvial sediments consisting of stream-deposited sand and gravel with lesser amounts of silt. The thickness of this aquifer in the project area has been interpreted to range from approximately 200 feet towards the flanks of Fenner Gap, to as much as 800 feet, as depicted Kenney (2011). To the west of Fenner Gap, the upper alluvium aquifer is separated from the lower alluvium aquifer system by discontinuous layers of silt and clay. The upper alluvial aquifer is very permeable in places and can yield 3,000 gallons per minute (gpm) or more with less than 20 feet of drawdown.
The lower alluvial aquifer consists of older sediments, including interbedded sand, gravel, silt, and clay of late Tertiary to early Quaternary age. The Cadiz agricultural wells are screened primarily in the lower alluvial aquifer and typically yield 1,000 to 2,000 gpm (Geoscience, 2011a).
4.5.2 Carbonate Aquifer
Carbonate bedrock of Paleozoic age, located beneath the lower alluvial aquifer, contains groundwater and is considered a second main aquifer unit. Groundwater movement and storage in the carbonate bedrock aquifer primarily occurs in secondary porosity. Recent studies performed by CH2M Hill have shown that portions of the carbonate aquifer are highly transmissive (e.g. contain karst features). It is also likely that other carbonate units may also exhibit localized areas of highly-transmissive secondary porosity features (Geoscience, 2011a).

aquilogic
45
Review of the Groundwater Hydrology of the Cadiz Project
October 2013
4.5.3 Granitic Aquifer
Granitic and metamorphic rock forms the subsurface margins of the aquifer system. These basement rocks are generally impermeable but can have significantly increased permeability along fracture zones which are associated with the numerous faults that cross beneath Fenner Gap. Fracture zones in the hanging wall of the fault zones and along the detachment fault, range in thickness from 150 to 400 feet, and occupy a significant portion of the cross-sectional area in the Fenner Gap (Kenney, 2011).
4.6 Hydraulic Properties
The hydraulic properties of the aquifers obtained from recent pumping tests (Geoscience, 2011b) at the Cadiz property indicate that the aquifers are highly transmissive in the vicinity of the test wells (TW-1 and TW-2).
Hydraulic conductivities for the alluvial aquifer in the vicinity of pumping well TW-2, located in the center of the Fenner Gap, ranged from approximately 37 to 150 ft/day. Hydraulic conductivity of the alluvial aquifer system in the vicinity of pumping well PW-1, located in an older alluvial fan northwest of Schulyer Wash was 158 ft/day. Storativities average approximately 0.002, reflecting semi-confined conditions in the alluvial aquifer system (Geoscience, 2011b).
Hydraulic conductivities for the carbonate aquifer in the vicinity of the project area (TW-1), ranged from 602 ft/day to 1,023 ft/day. Storativities were representative of semi-confined (i.e., leaky) aquifer systems. The alluvial aquifer in the vicinity of TW-1 exhibited leakage effects during the pumping tests, suggesting that there may be a hydraulic connection with the overlying alluvial sediments (Geoscience, 2011b).
Hydraulic conductivity of the fractured granite may range from approximately 5 ft/day to 20 ft/day at depth in TW-2. Published values for hydraulic conductivity in fractured granitic rock range from 0.1 ft/day to 40 ft/day (Geoscience, 2011b).
The hydraulic properties obtained from aquifer testing and those used for groundwater modeling are further summarized below in Table 4.2.
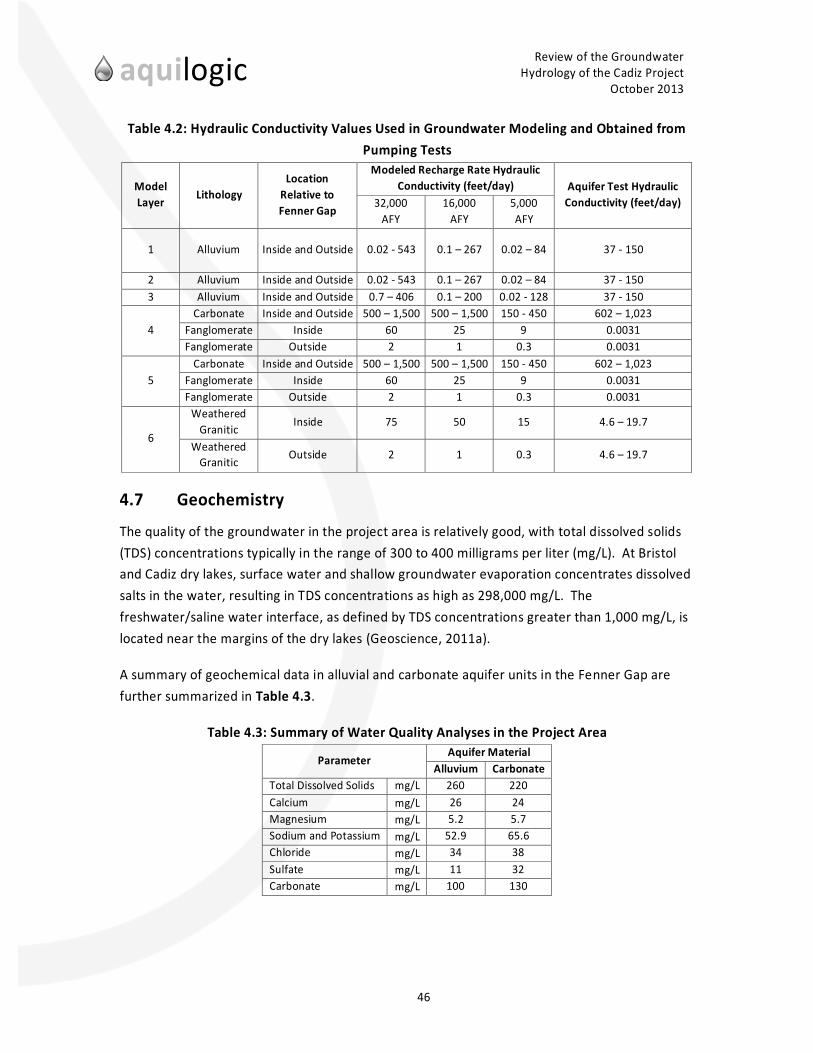
aquilogic
46
Review of the Groundwater Hydrology of the Cadiz Project
October 2013
Table 4.2: Hydraulic Conductivity Values Used in Groundwater Modeling and Obtained from Pumping Tests
Model Layer
Lithology Location
Relative to Fenner Gap
Modeled Recharge Rate Hydraulic Conductivity (feet/day) Aquifer Test Hydraulic
Conductivity (feet/day) 32,000 AFY
16,000 AFY
5,000 AFY
1 Alluvium Inside and Outside 0.02 - 543 0.1 – 267 0.02 – 84 37 - 150
2 Alluvium Inside and Outside 0.02 - 543 0.1 – 267 0.02 – 84 37 - 150 3 Alluvium Inside and Outside 0.7 – 406 0.1 – 200 0.02 - 128 37 - 150
4 Carbonate Inside and Outside 500 – 1,500 500 – 1,500 150 - 450 602 – 1,023
Fanglomerate Inside 60 25 9 0.0031 Fanglomerate Outside 2 1 0.3 0.0031
5 Carbonate Inside and Outside 500 – 1,500 500 – 1,500 150 - 450 602 – 1,023
Fanglomerate Inside 60 25 9 0.0031 Fanglomerate Outside 2 1 0.3 0.0031
6
Weathered Granitic
Inside 75 50 15 4.6 – 19.7
Weathered Granitic
Outside 2 1 0.3 4.6 – 19.7
4.7 Geochemistry
The quality of the groundwater in the project area is relatively good, with total dissolved solids (TDS) concentrations typically in the range of 300 to 400 milligrams per liter (mg/L). At Bristol and Cadiz dry lakes, surface water and shallow groundwater evaporation concentrates dissolved salts in the water, resulting in TDS concentrations as high as 298,000 mg/L. The freshwater/saline water interface, as defined by TDS concentrations greater than 1,000 mg/L, is located near the margins of the dry lakes (Geoscience, 2011a).
A summary of geochemical data in alluvial and carbonate aquifer units in the Fenner Gap are further summarized in Table 4.3.
Table 4.3: Summary of Water Quality Analyses in the Project Area
Parameter Aquifer Material
Alluvium Carbonate Total Dissolved Solids mg/L 260 220 Calcium mg/L 26 24 Magnesium mg/L 5.2 5.7 Sodium and Potassium mg/L 52.9 65.6 Chloride mg/L 34 38 Sulfate mg/L 11 32 Carbonate mg/L 100 130
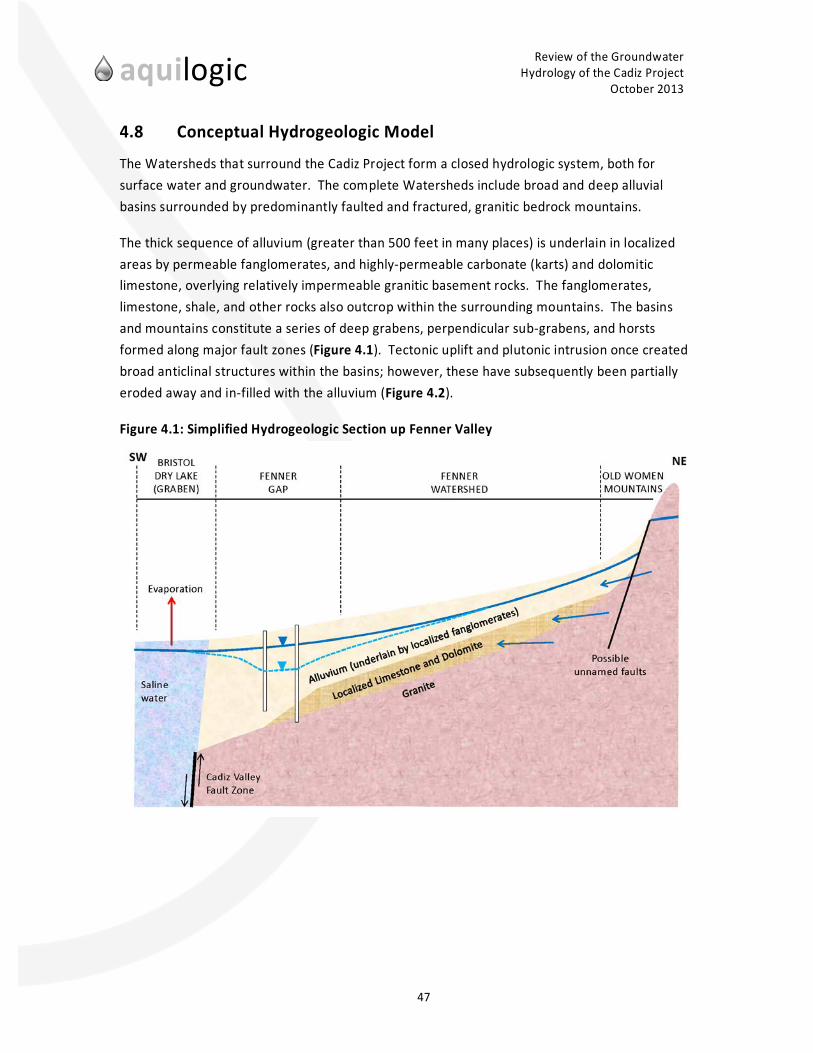
aquilogic
47
Review of the Groundwater Hydrology of the Cadiz Project
October 2013
4.8 Conceptual Hydrogeologic Model
The Watersheds that surround the Cadiz Project form a closed hydrologic system, both for surface water and groundwater. The complete Watersheds include broad and deep alluvial basins surrounded by predominantly faulted and fractured, granitic bedrock mountains.
The thick sequence of alluvium (greater than 500 feet in many places) is underlain in localized areas by permeable fanglomerates, and highly-permeable carbonate (karts) and dolomitic limestone, overlying relatively impermeable granitic basement rocks. The fanglomerates, limestone, shale, and other rocks also outcrop within the surrounding mountains. The basins and mountains constitute a series of deep grabens, perpendicular sub-grabens, and horsts formed along major fault zones (Figure 4.1). Tectonic uplift and plutonic intrusion once created broad anticlinal structures within the basins; however, these have subsequently been partially eroded away and in-filled with the alluvium (Figure 4.2).
Figure 4.1: Simplified Hydrogeologic Section up Fenner Valley

aquilogic
48
Review of the Groundwater Hydrology of the Cadiz Project
October 2013
Figure 4.2: Simplified Hydrogeologic Section across Fenner Gap
Alluvium, fanglomerates, and limestone make up the groundwater basins within the overall watersheds that surround the Cadiz Project. In addition, some areas outside the topographic surface-water catchments yield groundwater to the groundwater basins (e.g. west of the Amboy volcanics, and to the northwest from the Lanfair Valley). As such, groundwater basins do not exactly correlate with the overlying surface water catchments.
Precipitation falls across the area, increasing with elevation, and can be present as snow-pack at higher elevations (approximately greater than 5,000 feet above MSL). Nearly all of the rainfall on the alluvium enters shallow soil moisture storage or flows as run-off in ephemeral rills and streams, only to infiltrate downstream into unsaturated soils. After the rainfall events, most of this water is lost to the system as evapotranspiration and never recharges groundwater. Most of the recharge into the groundwater basins comes from water that has infiltrated in the surrounding mountains, and thence recharges groundwater as fracture-baseflow from bedrock to alluvium, or infiltration of surface water flows at the mountain bedrock-alluvium contact.
Throughout most of the alluvial basins, groundwater is found at depths greater than 100 feet below ground surface. Only at the dry lakes is shallow groundwater encountered. However, at some locations, perched groundwater is present behind fault scarps and above low-permeability strata in the mountains. In these locations, springs can be found or created by drilling or tunneling into saturated rock/sediments. Given their elevation (i.e. more than 900 feet above
aquilogic
49
Review of the Groundwater Hydrology of the Cadiz Project
October 2013
groundwater in the nearby alluvium) and hydrologic origin, these springs are not in direct hydraulic communication with the groundwater in the alluvium (see Section 6.1).
In general, groundwater flows down the alluvial valleys toward the point of lowest hydraulic head within the system – the Bristol and Cadiz dry lakes. Groundwater within the Bristol, Orange Blossom Wash (a sub-basin of the Bristol), and western portion of the Fenner Watersheds flows to Bristol Dry Lake. Groundwater within the eastern portion of the Fenner Watershed, tributary groundwater that enters the Fenner Valley from the Lanfair Valley, and groundwater in the Cadiz Watershed flows to the Cadiz Dry Lake. Given the storage volume of the alluvial basins and the distances between recharge in the mountains and evaporation in the dry lakes, infiltrating precipitation likely takes many hundreds of years to finally leave the system. No groundwater flows into adjacent basins or discharges to surface water that flows into adjacent watersheds, and all groundwater is eventually lost to the system as evaporation at the dry lakes.
Given the geochemical nature of the rocks within which infiltration and recharge occurs, and the filtering effect of the alluvial sediments through which groundwater flows, the groundwater is generally of high quality with low TDS. In addition, the permeability of the alluvial sediments and carbonates allows high yields at groundwater pumping wells.
Groundwater within the Fenner Valley, along with groundwater that enters the Fenner Valley from the Lanfair Valley, eventually flows through the Fenner Gap between the Marble and Ship Mountains. In addition, groundwater in the Orange Blossom Wash flows to the south of the Fenner Gap before flowing to Bristol Dry Lake. All of this groundwater is available to the Cadiz Project. It has been estimated that between 17 and 34 million acre-feet of groundwater storage, and between 5,000 and 32,000 AFY of annual recharge, is available to the Cadiz Project.
Cadiz plans to pump groundwater at proposed well locations within the Fenner Gap. These wells will essentially capture groundwater that currently flows through the Fenner Gap and Orange Blossom Wash to the Bristol and Cadiz dry lakes and is lost as evaporation. The proposed pumping rate will exceed the annual groundwater recharge that is available to the Cadiz Project, and some water will be removed from long-term aquifer storage. After 50 years, pumping will cease and the aquifers will be allowed to recharge for at least 50 years. In addition, Cadiz has plans to import water for storage in the Fenner Watershed to supplement natural recharge. The importation and storage of water will be subject to additional environmental review; therefore, it is beyond the scope of this report.

aquilogic
50
Review of the Groundwater Hydrology of the Cadiz Project
October 2013
5.0 COMPARISON WITH SIMILAR BASINS
The watersheds that surround the Cadiz Project are located far from any major urban center. The size of the watersheds and their potential as sources of groundwater supply are difficult to envision without visiting the area. Therefore, to provide some perspective to stakeholders, and by means of comparison, the following table details the size, storage volume, and groundwater pumping rates for similar groundwater basins in Southern California. The relatively large quantity of groundwater in storage and comparatively much lower extraction rate provides a context for considering the technical criticisms raised by some parties that the Cadiz Project will cause possible adverse impacts.
Table 5.1: Southern California Groundwater Basin Comparison
Groundwater Basin Basin Size
(mi2) Depth of Basin
(feet bgs) Groundwater Storage (AF)
Groundwater Production (AFY)
Fenner, Bristol and Cadiz Watersheds
2,700 >1,000 17,000,000 – 34,000,000
50,000 (proposed)
San Gabriel Valley 255 4,100 10,740,000 269,448 (2001)
Orange County Coastal Plain 350 2,000 37,700,000 259,861 (2010-2011) Chino Basin 240 700 5,325,000 (2000) 161,475 (2000)
San Fernando Valley (Upper Los Angeles River Area [ULARA])
226 900 3,049,000 (1998) 108,500 (1998)
Bunker Hill, Riverside 120 1,000 5,890,300 188,296 (2001) West Coast Basin, Los Angeles 142 2,200 6,500,000 42,068 (2013) Central Basin, Los Angeles 277 2,200 13,800,000 196,261 (2013)
Sources: Department of Water Resources, 2003; 2013a; 2013b.

aquilogic
51
Review of the Groundwater Hydrology of the Cadiz Project
October 2013
6.0 CRITICISMS RAISED WITH RESPECT TO HYDROLOGY
The following are the principal criticisms of the Cadiz Project related to groundwater hydrology raised by certain parties:
1. Possible impact on springs; 2. The degree of land subsidence; and, 3. The extent of saline intrusion into alluvial sediments.
In addition, opponents have also contended that the water balance for the watershed contained in the FEIR overstates the likely recharge rate and that adverse environmental impacts would be increased at a lower recharge rate.
6.1 Impact on Springs
Freshwater “springs” are known to exist in the mountains that surround the alluvial basins in the vicinity of the Cadiz Project. These springs are often located where the alluvial contacts the bedrock and surface materials transition from sediments to rock (see Figure 3.3). The nearest known spring to the Cadiz Project is the Bonanza Spring, located approximately 11 miles to the north on the southeastern flank of the Clipper Mountains.
These springs rarely form standing water and none create a perennial surface stream. In most instances, the springs are areas of damp ground that support denser vegetation. In many instances pipes have been driven into the ground or tunnels excavated into the bedrock to create “guzzlers” that maintain the spring. These guzzlers are used by hunters to lure Big Horn Sheep, or used historically for railroad operations (e.g. Bonanza Spring).
Springs result when the groundwater surface intercepts the land surface and water discharges from the ground. As discussed, in many instances, the groundwater surface may not intercept the ground surface, but is near to the ground surface, and a pipe or tunnel is used to sustain the spring. Whether there is direct surface discharge or pipe/tunnel sustained flow, there are three likely mechanisms that generate springs in the project area:
1. Where groundwater in the alluvium is in direct hydraulic communication (and supports) the spring (Figure 6.1a);
2. Where a fault along the flank of a mountain range forms a partial barrier to groundwater flow and groundwater behind the fault in the bedrock rises above groundwater in the alluvium and intercepts the land surface (Figure 6.1b); and
3. Where a stratigraphic unit of lower permeability (e.g. an aquitard) forms a partial barrier to groundwater flow and groundwater mounds above the aquitard and intercepts the land surface (Figure 6.1c).

aquilogic
52
Review of the Groundwater Hydrology of the Cadiz Project
October 2013
Figure 6.1a: Scenario 1 – Groundwater in Alluvium in Direct Hydraulic Communication with (and Sustaining) Spring
Figure 6.1b: Scenario 2 – Fault Acts as a Partial Groundwater Flow Barrier (Groundwater in Alluvium NOT in Direct Hydraulic Communication with Spring)
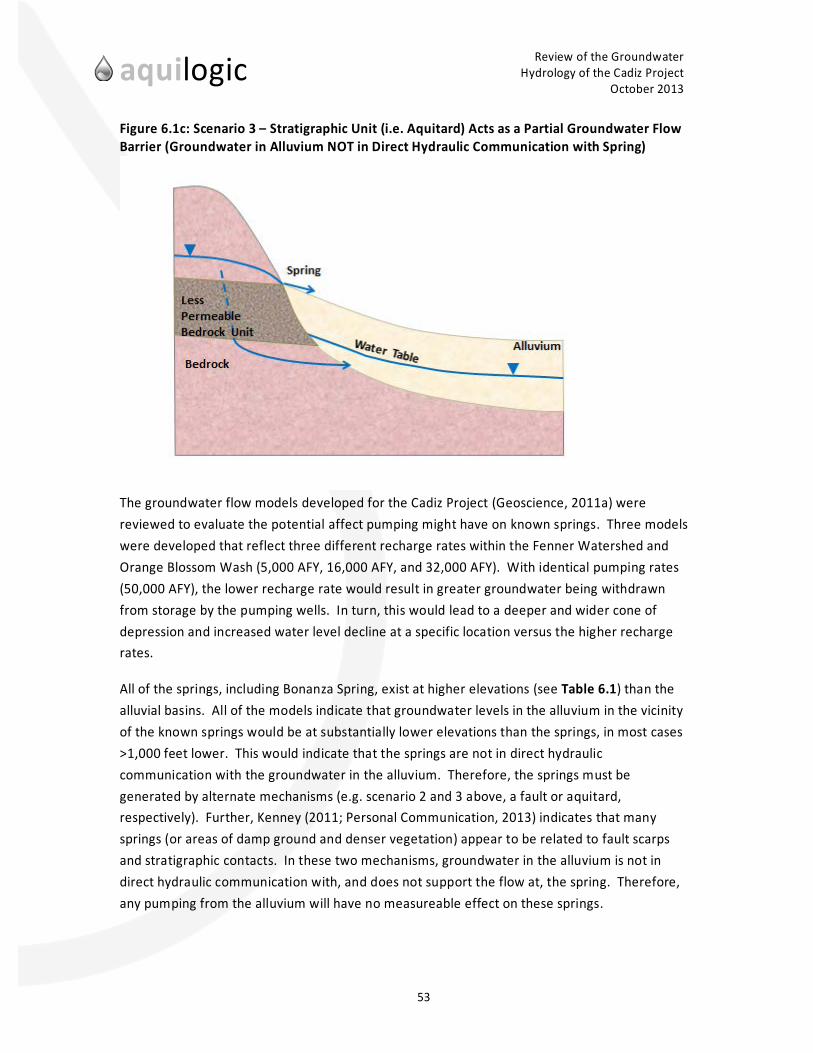
aquilogic
53
Review of the Groundwater Hydrology of the Cadiz Project
October 2013
Figure 6.1c: Scenario 3 – Stratigraphic Unit (i.e. Aquitard) Acts as a Partial Groundwater Flow Barrier (Groundwater in Alluvium NOT in Direct Hydraulic Communication with Spring)
The groundwater flow models developed for the Cadiz Project (Geoscience, 2011a) were reviewed to evaluate the potential affect pumping might have on known springs. Three models were developed that reflect three different recharge rates within the Fenner Watershed and Orange Blossom Wash (5,000 AFY, 16,000 AFY, and 32,000 AFY). With identical pumping rates (50,000 AFY), the lower recharge rate would result in greater groundwater being withdrawn from storage by the pumping wells. In turn, this would lead to a deeper and wider cone of depression and increased water level decline at a specific location versus the higher recharge rates.
All of the springs, including Bonanza Spring, exist at higher elevations (see Table 6.1) than the alluvial basins. All of the models indicate that groundwater levels in the alluvium in the vicinity of the known springs would be at substantially lower elevations than the springs, in most cases >1,000 feet lower. This would indicate that the springs are not in direct hydraulic communication with the groundwater in the alluvium. Therefore, the springs must be generated by alternate mechanisms (e.g. scenario 2 and 3 above, a fault or aquitard, respectively). Further, Kenney (2011; Personal Communication, 2013) indicates that many springs (or areas of damp ground and denser vegetation) appear to be related to fault scarps and stratigraphic contacts. In these two mechanisms, groundwater in the alluvium is not in direct hydraulic communication with, and does not support the flow at, the spring. Therefore, any pumping from the alluvium will have no measureable effect on these springs.

aquilogic
54
Review of the Groundwater Hydrology of the Cadiz Project
October 2013
Table 6.1: Estimated Spring Elevations From Groundwater Modeling
Spring Name
Spring Coordinates (feet) Ground
Surface Elevation
(feet aMSL)
Groundwater Elevation in 5,000 AFY Recharge Scenarios
(feet aMSL)
Separation Between
Groundwater and Spring (feet)
X Y
Bonanza 7341583 2081937 2,100 Pre-Pumping 1,090 1,010
Post-Pumping (50 yrs) 1,087 1,013
Hummingbird 7359165 2106976 2,375 Pre-Pumping 1,450 925
Post-Pumping (50 yrs) 1,450 925
Chuckwalla 7348897 2112708 3,018 Pre-Pumping 1,510 1,508
Post-Pumping (50 yrs) 1,510 1,508
Willow 7409767 2040142 3,888 Pre-Pumping 1,190 2,698
Post-Pumping (50 yrs) 1,190 2,698
Honeymoon 7415055 2057465 3,310 Pre-Pumping 1,290 2,020
Post-Pumping (50 yrs) 1,290 2,020
CH2M Hill (2011) did attempt to modify the calibrated groundwater flow model to create higher groundwater elevations in the bedrock and alluvium in the vicinity of Bonanza Spring. The hydraulic properties had to be modified significantly to create the higher elevations (i.e. beyond what would be considered hydrogeologically reasonable). The effects of pumping on the modified conditions were then assessed. Due to the changes in hydraulic properties needed to create the higher groundwater elevations, and the vertical separation between groundwater in the alluvial basin and the spring, the pumping had no measureable effect on the modified groundwater levels in the vicinity of the spring. Therefore, even if a spring was sustained by groundwater in direct hydraulic communication with the alluvium, pumping would have no measureable effect on such a spring.
Given that most, if not all, springs are not in direct hydraulic communication with groundwater in the alluvial basins, the pumping proposed as part of the Cadiz Project will have no measureable effect on spring flows. Further, even under conditions that would generate a spring in direct hydraulic communication with groundwater in the alluvial basins, the pumping would have no measurable effect on spring flows. Accordingly, we concur that it is not possible for the springs to be impacted by the Cadiz Project.
Despite the fact that is not possible for the Cadiz Project to impact the springs, the FEIR proposes, mitigation actions to address possible reduced spring flows (ESA, 2012). However, reduced spring flows would more likely be the result of climatic conditions (i.e. reduced precipitation) than pumping at the Cadiz Project.

aquilogic
55
Review of the Groundwater Hydrology of the Cadiz Project
October 2013
6.2 Subsidence
Subsidence of the land surface can occur when fluids are removed from the subsurface. Such subsidence has been associated with oil extraction (e.g. Long Beach, California), groundwater pumping (e.g. Central Valley, California, Mexico City), and a combination of the two (e.g. Bakersfield, California). It is this subsidence that is addressed in the FEIR (ESA, 2012) and discussed in more detail below (see Section 6.2.3).
6.2.1 Load Compaction Subsidence
Subsidence can occur as a result of compaction of underlying sediments, notably clays, simply from the weight of building structures, with or without dewatering (e.g. Venice, Italy, New Orleans, Louisiana). As no extensive building structures are proposed as part of the Cadiz Project, and the Project area is underlain by predominantly coarser-grained sediments (sands and gravels), simple load compaction subsidence will not occur.
6.2.2 Carbonate Collapse Subsidence
Subsidence can also occur in areas where a thick sequence of carbonate limestone is overlain by a thin sequence (<50 feet) of alluvium (e.g. Florida). Dissolution of the carbonate limestone can result in catastrophic collapse of a limestone cavern that propagates up through the alluvium to create a sink-hole, where some of the overlying alluvium collapses into the cavern void and is “washed out” by groundwater flow. Alternatively, dewatering of the limestone by groundwater pumping can also lead to cavern collapse and the creation of a sink-hole.
Carbonate limestone (karst) is present beneath localized areas of the Fenner watershed. In general, these limestone units are less than 100 feet thick and overlain by an extensive thickness (500 to 1,000 feet) of Quaternary alluvium. Given their location beneath saturated alluvium, pumping of groundwater from the limestone will not result in dewatering of the rock. Therefore, collapse associated with cavern dewatering will not occur. Pumping of groundwater from the limestone will increase groundwater flows within the rock and could result in increased limestone dissolution. However, even in the event of a cavern collapse, the collapse would be buffered by the thick sequence of alluvium above it. While some surface subsidence might be evident, it would be spread over a large area by dissipation through the overlying alluvium, and no sink-hole would develop.
The depth and width of the subsidence is a function of the volume of cavern collapse and the thickness of the overlying alluvium. If we assume that a cavern 40 feet in diameter and 20 feet high collapses, creating a void of 25,120 ft3, and an additional 25,120 ft3 of alluvium is “washed out” (see Figure 6.2), then 50,240 ft3 of void would need to be in-filled, resulting in some subsidence. If we assume that, conservatively, the void propagates through the alluvium at 1:1 (i.e. one foot laterally for every one foot vertically), and the alluvium is 500 feet thick, then the

aquilogic
56
Review of the Groundwater Hydrology of the Cadiz Project
October 2013
surface expression of the subsidence would be 1,040 feet in diameter (500+500+40 feet). The average depth of the subsidence would be 50,240 ft3 divided by the radius (520 feet) squared and ᴫ (3.1416); that is, equal to 0.059 feet (0.70 inch). However, the subsidence would be highest in the middle and zero at the edges (an inverted cone). Therefore, the maximum subsidence would be 50,240 ft3 x 3, divided by the radius squared and ᴫ; that is, equal to 0.177 feet (2.12 inches).
Figure 6.2: Limestone Subsidence Calculation
With respect to the railroad, the maximum allowable subsidence is 1-inch per 62-foot string of track. The above example would result in 2.12 inches over 520 feet, or ¼ inch per 62-foot string; that is, well within the railroad tolerances.
6.2.3 Groundwater Pumping Subsidence
Subsidence related to groundwater pumping is a function of the following:
The amount of groundwater level drawdown; The clay content of the sediments; and The elastic storage coefficient of the sediments.
Land subsidence due to withdrawal of groundwater is caused by compaction of materials within an aquifer system. When pumping causes the water table to decline below the preconsolidation (pre-pumping) stress level, the effective stress (soil particle intergranular stress) increases and the aquifer material is compacted, releasing water to the aquifer system (Poland, 1984). The amount of subsidence is highly dependent upon the composition of the subsurface materials, where fine-grained clays are more susceptible to compaction and subsidence than the coarser grained sands and gravels.. In the Fenner Valley, the alluvial sediments are largely composed of coarse-grained sands and gravels with relatively few high clay-content zones. Unlike California’s

aquilogic
57
Review of the Groundwater Hydrology of the Cadiz Project
October 2013
Central Valley where thick interbedded sequences of a clay mineral highly susceptible to compaction (montmorillonite) are present, much less subsidence in the Fenner Valley is anticipated due to the thicker sequences of sands and gravels.
We have reviewed the predicted subsidence results from the groundwater flow models developed by Geoscience (Geoscience, 2011a). We have focused on the 5,000 AFY recharge groundwater model, as this would result in the maximum drawdown for 50,000 AFY of pumping.
The sediments contain very little clay content, except beneath the dry lakes, and the range of elastic storage coefficient used in the modeling (0.00001) appears reasonable for the sediments observed. Therefore, we concur with the estimates of subsidence generated from the modeling. That is, maximum subsidence (2.5 to 3.13 feet) would occur beneath Bristol Dry Lake, where clay content is highest. The next highest area of subsidence (2.0 to 2.5 feet) would occur in an area within the Bristol Watershed, where clay is still present, close to the proposed pumping wells (where drawdown is greatest); that is, on Cadiz owned land. These levels of subsidence over the areas predicted are well within the railroad tolerances.
In unconfined aquifers, pumping causes an increase in the intergranular pressure as a result of the loss of buoyancy of solid aquifer particles (sands and gravels) in the zone dewatered by the falling water table. The compression of soil materials (or subsidence) can be estimated by the following (Bouwer, 1977):
𝑆𝑢 =𝑍 ∗ (𝑃𝑖2 − 𝑃𝑖1)
𝐸
Where:
• Su = Compression of the aquifer layer (feet)
• Z =-Thickness of the aquifer layer (feet)
• Pi1 = Intergranular soil pressure prior to pumping (feet)
• Pi2 = Intergranular soil pressure at maximum drawdown (feet)
• E = Modulus of Elasticity of the aquifer materials (pounds per square inch [psi])
Based upon an alluvial aquifer thickness of approximately 1,000 ft and a modulus of elasticity of 21,700 psi (consistent with an aquifer comprised of materials ranging from sands to sands and gravels), the predicted subsidence across a range of drawdowns is presented in Figure 6.3. Where the alluvial sediments are less than 1,000 feet thick, the predicted subsidence is anticipated to be less due to the decreased initial intergranular pressure. These results support the estimates of land subsidence derived from modeling.

aquilogic
58
Review of the Groundwater Hydrology of the Cadiz Project
October 2013
Figure 6.3: Predicted Subsidence Based Upon Drawdown
Accordingly, we agree that the Cadiz Project does not present a present risk of subsidence that would cause harm to any physical structures or the environment.
6.3 Saline Intrusion in Alluvial Sediments
As discussed in earlier sections (see Section 1.3.1), the watersheds that surround the Cadiz Project form a closed hydrologic system, both for surface water and groundwater. That is, precipitation that falls within the watersheds, and subsequently recharges groundwater, does not leave the system via groundwater flow into an adjacent basin and does not discharge to a surface water body that drains to an adjacent basin. All groundwater flows to the point of lowest hydraulic head, the Bristol and Cadiz dry lakes, where it exits the system via evaporation.
Over thousands if not many millions of years, the evaporation of water from the dry lakes has concentrated dissolved minerals in the groundwater beneath the dry lakes. This has created an area of saline groundwater that extends beneath the footprint of the dry lakes and to considerable depths (likely thousands of feet, given the increased density of the saline waters).
The graben structure beneath the dry lakes (see Section 4.3.2) prevents the deep (>1000 feet) lateral movement of saline waters into adjacent watersheds - the Fenner and Orange Blossom Wash Watersheds, and peripheral portions of the Bristol and Cadiz Watersheds. In addition, groundwater from adjacent watersheds flows into the dry lakes preventing the lateral spread of saline waters above a depth of 1,000 feet. A saline-fresh water interface will be present above a
0
0.5
1
1.5
2
2.5
3
3.5
0 50 100 150 200 250 300 350
Pred
icte
d Su
bsid
ence
(fe
et)
Drawdown (feet)

aquilogic
59
Review of the Groundwater Hydrology of the Cadiz Project
October 2013
depth of 1,000 feet. The TDS concentrations across the interface will form a concentration gradient. However, given hydrogeologic conditions, the gradient is likely steep and the interface narrow and distinct. That is, TDS concentrations likely rise from <1000 mg/L to >10,000 mg/L over a very short lateral distance.
There is limited TDS data from monitoring wells along the saline-fresh water interface. In fact, the only TDS data that allows the interface to be delineated is from the rail cycle monitoring wells and Tetra study wells located half way between Amboy and Cadiz. Of note, there is no TDS data between the existing Cadiz agricultural wells (and the proposed location of new pumping wells) and the easterly edge of the Bristol Dry Lake. That is, the location of the interface closest to the proposed Cadiz property can only be estimated. However, given this limitation, the location estimated in the FEIR (ESA, 2012) appears reasonable given the hydrogeologic conditions (~10,000 feet southwest of the Cadiz property). The low pumping rate from the existing agricultural wells (<1,900 AFY) is well below the volume of groundwater flow through the Fenner Gap; thus, this flow of fresh groundwater through the gap would maintain the current interface some distance from the Cadiz Project.
Without groundwater pumping, or with pumping less than the recharge in the Fenner and Orange Blossom Watersheds (water available to the Cadiz Project), the location of saline-fresh water interface will not change much. However, with pumping of groundwater at rates greater than recharge available to the Cadiz Project, the saline-fresh water interface will move toward the pumping well-field. In fact, the Cadiz Project is designed to pull back some freshwater to the southwest of the Fenner Gap that would eventually be lost to the saline zone and evaporation.
The saline-fresh water interface will move toward the pumping wells as the cone of depression (see Section 2.13) created by the pumping extends to the saline zone. In fact, the cone of depression will reverse the groundwater flow direction to the southwest of the Cadiz Project from southwest to northeast; that is, toward the pumping wells. The rate of movement of the interface will be a function of the hydraulic gradient created by the cone of depression, given that other hydraulic parameters, hydraulic conductivity and porosity, are essentially unchanged (see Section 2.11). Close to the pumping wells, near the center of the cone, groundwater flow rates will be significantly increased, as the gradient is very steep. However, toward the edge of the cone of depression (where the interface is present), the gradients would be much lower. Therefore, the rate of movement of the interface toward the Cadiz Project would be very slow.
As an example, if we use the Darcy equation and sediment porosity to determine the average linear velocity (v) of groundwater (i.e. the advective solute transport velocity for any conservative solute dissolved therein):
𝑣 =𝐾 ∗ 𝑖𝑛
aquilogic
60
Review of the Groundwater Hydrology of the Cadiz Project
October 2013
Where, for the alluvial sediments K = 100 feet/day, n = 0.25, and i = 0.0015 (15 feet/10,000 feet), V = 219 feet/year. That is, over 50 years of pumping at 50,000 AFY, the interface will move 10,950 feet. This quick calculation is consistent with the degree of movement calculated in the more robust groundwater flow model.
For some period after pumping ceases, flow toward the Cadiz Project would persist, as groundwater levels recover. However, the rate of movement would be far less than during pumping (and diminishing over time), as the hydraulic gradient will decrease over time as groundwater levels recover. Eventually, the pre-pumping groundwater flow regime would reestablish and the interface would move back toward the Bristol Dry Lake.
The groundwater modeling indicates that the area of maximum movement of the saline-fresh water interface occurs in the area half way between Amboy and Cadiz. The maximum intrusion in this area after 50 years of pumping is 10,400, 9,700, and 6,300 feet for the 32,000, 15,000 and 5,000 AFY models, respectively. After an additional 50 years of recovery, the saline-fresh water interface is located 11,500, 11,100 and 9,200 feet beyond its current location using the three models.
Based upon our review of the groundwater flow models, and calculations of advective solute transport velocity, the representation of the saline-fresh water interface in the alluvium presented in the FEIR (ESA, 2012) appears reasonable. Therefore, under the pumping plan proposed, the well-field would not be impacted by saline waters in the alluvium. In addition, only a small portion of the overall aquifer volume in the Bristol and Cadiz Watersheds would be impacted by the movement of the interface toward the pumping wells. Consequently, we concur that the Cadiz Project does not present a material risk of saline intrusion in the alluvial sediments.
6.4 Water Balance
As discussed, the Watersheds that surround the Cadiz Project (i.e. Bristol, Orange Blossom Wash, Fenner and Cadiz) form a closed hydrologic system, both for surface water and groundwater. The equation of hydraulic continuity (see Section 2.2) states:
Qin = Qout +/- ΔS
Without excess groundwater extraction or artificial recharge, over an extended period of time encompassing variable climatic inputs, the system exists under steady-state conditions; that is, there is no change in storage, and:
Qin = Qout
aquilogic
61
Review of the Groundwater Hydrology of the Cadiz Project
October 2013
Thus, all water entering the system as precipitation must exit the system. Precipitation that falls within the watersheds, and subsequently recharges groundwater, does not leave the system via groundwater flow into an adjacent basin and does not discharge to a surface water body that drains to an adjacent basin. All groundwater flows to the point of lowest hydraulic head, the Bristol and Cadiz dry lakes, where it exits the system via evaporation.
6.4.1 Hydrologic Inflow – Recharge
No direct infiltration (and recharge) measurements have been made in the Watersheds that surround the Cadiz Project. However, a recharge volume for the Fenner and Orange Blossom Wash Watersheds of ~32,000 AFY was calculated by CH2M Hill (2012) using a USGS recharge software program called INFIL 3.0 (USGS, 2008). All of this recharge is available to the pumping proposed as part of the Cadiz Project. Thus, the proposed pumping at 50,000 AFY essentially removes 18,000 AFY from long-term aquifer storage in the system.
The calculation of recharge available to the Cadiz Project has drawn criticism from project opponents, who suggest that the recharge is substantially less (between 5,000 and 16,000 AFY). They cite published reports for other basins within the southwestern USA.
To address the disagreement over recharge to the Fenner and Orange Blossom Wash Watersheds, three groundwater flow models were developed using 5,000, 16,000, and 32,000 AFY of recharge, respectively. As discussed in earlier sections (6.1, 6.2 and 6.3), under any of these recharge rates, no significant adverse impacts from the Cadiz Project are evident:
There would be no measureable effect on springs in the watersheds; Subsidence calculated from the modeling appears correct, and is well within railroad
tolerances; and The modeling does appear to reasonably reflect the likely extent of saline intrusion in the
alluvium, and there would be no impact on the pumping well-field.
However, if the recharge rate available to the Cadiz Project is less than 32,000 AFY, then more groundwater would be removed from long-term aquifer storage to effectuate the proposed conservation of 1.6 MAF of groundwater before it becomes hyper-saline and then evaporates. Project opponents consider the taking of this water an unacceptable level of “aquifer mining” as opposed to “temporary surplus” or “transitional yield”.
6.4.2 Hydrologic Outflow – Evaporation
It is difficult to make direct measurements of recharge for a hydrologic system, and for the Cadiz Project, no direct measurements of infiltration/recharge were taken. However, it is customary to use models to develop recharge estimates, and estimates for this project were made using
aquilogic
62
Review of the Groundwater Hydrology of the Cadiz Project
October 2013
INFIL 3.0, a computer software program development by the USGS (2008). As mentioned, project opponents strongly disagree with these estimates.
In 2012, the DRI conducted an evaporation survey at the Bristol and Cadiz dry lakes (DRI, 2012). This survey used complex micro-weather stations to monitor micro-climatic conditions immediately above the ground surface. From this, the eddy current methodology was used to calculate evaporation rates. The survey included more than 50,000 evaporation measurements. Thus, unlike infiltration/recharge, the empirical data for evaporation (Qout) is very strong. Using the measured evaporation rates, CH2M Hill calculated the following evaporative losses from the two dry lakes:
Bristol Dry Lake – 7,860 AFY Cadiz Dry Lake – 23,730 AFY
It must be stressed that these are not simulated evaporation losses; rather, they are based on actual measurements of evaporation taken in the field. Thus, they should be subject to far less criticism than the recharge estimates, and are much more difficult to refute. Project critics have not offered any explanation as to why this actual data should be ignored.
In addition to the evaporation losses from the hydrologic system, on average, an additional 4,600 AFY has been pumped over the recent years as part of Cadiz agricultural operations. However, given the time frame over which agricultural pumping has occurred, and its distance from the dry lakes, it can be debated whether this is an additional loss beyond the 31,590 AFY of evaporative loss. That is, without this pumping, would additional evaporative losses would have been measured? To be conservative, it has been assumed that this is not an additional loss, and the hydrologic outflow (Qout) from the system is 31,590 AFY.
6.4.3 Water Budget
In his “Comment on the Hydrogeology of the Cadiz Project” (The Hydrodynamics Group, 2012), Dr. Bredehoeft states (p.3): “Water budgets, in desert basins, require that two quantities be estimated: 1) recharge, and 2) discharge. As indicated above, one of the first principles is that the recharge is equal to the discharge in these basins.” Essentially, Dr. Bredehoeft is providing the steady-state equation of hydraulic continuity in words; that is, in reverse, what goes out MUST go in!
While there may be debate about the recharge estimates calculated from the INFIL 3.0 software, it is hard to argue that evaporative losses are not 31,590 AFY. The key question is, “how much of the 31,590 AFY is available to the Cadiz Project?” The Cadiz Project FEIR addresses this issue by using a range of recharge estimates between 5,000 and 32,000 AFY for the purpose of evaluating potential impacts. That is, possible adverse environmental impacts

aquilogic
63
Review of the Groundwater Hydrology of the Cadiz Project
October 2013
were evaluated for recharge rates as low as 5,000 AFY – well below any reasonable estimate of recharge that is tributary to the Cadiz Project.
6.4.4 Effect on Assessment of Impacts
Irrespective of recharge that is tributary to the Project, there are NO significant environmental impacts from the proposed groundwater pumping at the Cadiz Project. To reiterate, aside from the amount of groundwater that is removed from long-term aquifer storage (i.e. the amount beyond the available recharge):
Pumping groundwater at 50,000 AFY from the Cadiz Project, with tributary recharge anywhere between 5,000 and 32,000 AFY, has no measureable effect on the springs;
The groundwater flow models reasonably estimate the likely subsidence associated with this groundwater pumping, and subsidence levels for all recharge amounts evaluated are well within railroad tolerances; and
The movement (i.e. intrusion) of the saline fresh-water interface in the alluvium induced by this pumping is limited for all recharge amounts evaluated, will not impact the proposed well-field, and is reversible, over time.
Further, the only party that could possibly be adversely affected by increased removal of groundwater from long-term storage (lower recharge available to the Project), or even more movement of the saline interface, is Cadiz! With lower rates of recharge tributary to the Project, groundwater level drawdowns would be greater than simulated for 32,000 AFY of recharge. Mitigation measures have been developed that would adjust the proposed pumping program in the event excess drawdown is observed.
We have identified no evidence that would support a recharge rate less than 5,000 AFY. The evaporative loss from the hydrologic system has been quantified at almost 32,000 AFY. Given that, under steady state, “what goes out must go in”, recharge for the watersheds that surround the Cadiz Project must be at least 32,000 AFY (noting that Cadiz has pumped and additional 4,600 AFY on average over recent years).
Perhaps not all of this total recharge may always be available for capture by the Cadiz Project well-field. However, given that most precipitation (and recharge) occurs at the higher elevations that surround the Fenner and Lanfair Valleys and the planned method of operation, the majority of the total recharge is likely available to the project. Therefore, it is reasonable to conclude that recharge available to the Cadiz Project is within the upper quartile of the range considered in the FEIR.

aquilogic
64
Review of the Groundwater Hydrology of the Cadiz Project
October 2013
6.5 Other General Criticisms Raised by Johnson Wright
In a letter dated February 1, 2012 to Mr. Seth Shteir, the California Desert Field Representative of the National Parks Conservation Association, Johnson Wright Inc. (JWI) provided a review of the hydrogeology of the Cadiz Project. In this review several general criticisms of the project were raised, along with numerous specific technical comments. While we not retained to conduct a specific evaluation of the JWI commentary, a few salient points should be made regarding the FEIR and the project area hydrology.
Contrary to JWI’s characterization, the project is not unique. In comparison to other groundwater basins in Southern California (see Section 5), the area of the watersheds and volume of groundwater within the watersheds is larger than most of these other basins (e.g. Orange County Coastal Basin, Los Angeles Central Basin, San Gabriel Valley). Whereas, the volume of water to be pumped as part of the Cadiz project is far less than the groundwater pumped from these other basins. The JWI criticisms raised regarding the springs are comprehensively addressed in Section 6.1. To reiterate, the proposed pumping will have no measureable effect on the springs.
JWI also expresses concerns about impacts to vegetation in the watershed. However, none of the vegetation on the alluvium is supported by groundwater. More than 96% of the rainfall in the watersheds never reaches groundwater, as it is captured by vegetation, temporarily adds to soil moisture in the vadose zone (and available to vegetation), or flows as ephemeral runoff. In addition, as stated above the springs and guzzlers that support areas of vegetation on the mountain flanks are not in hydraulic communication with the groundwater in the alluvium, and the proposed pumping will have no measureable effect on these springs (see Section 6.1).
JWI characterizes the project is “high risk activity”, yet we have been unable to identify any significant impact (i.e. risk) related to groundwater hydrology from the Cadiz Project. It is acknowledged that the proposed pumping will remove long-term storage from the aquifers, and groundwater levels (and storage) will take many decades to recover, if that were an objective. However, the Cadiz Project proposes to save water that would otherwise be lost to evaporation, and this is made possible by the pumping of water from long-term storage. JWI fails to identify any benefit from leaving this groundwater in storage and allowing groundwater to be lost to evaporation at the dry-lakes.
It is true the amount of recharge tributary to the project, and thus, the resulting amount of water removed from storage, is disputed. Therefore, the EIR considered three possible recharge rates (5,000 AFY, 16,000 AFY and 32,000 AFY). No significant impacts were evident at any of these recharge rates. In addition, mitigation measures have been developed to address any potential impact from the project. Consequently, any dispute is accounted for in the impacts analysis. Moreover, the County of San Bernardino has imposed a condition on the Cadiz Project

aquilogic
65
Review of the Groundwater Hydrology of the Cadiz Project
October 2013
that restricts groundwater level drawdown to no more than 80 feet in the first 15 years and no more than 100 feet over 50 years. This condition makes the debate over the recharge rate largely irrelevant. If recharge proves to be lower, then groundwater levels will decline more rapidly and more extensively, and the condition imposed by San Bernardino County will be triggered. Thus, the condition limits and mitigates what JWI characterize as a “high risk activity”, and in fact, removes any such risk.
JWI also raises more specific technical criticisms, such as the model parameters utilized to assess Project impacts. However, without engaging in a detailed technical debate over these specific criticisms, in our opinion the model does appear to reasonably characterize the hydrologic system. As such, it can be used to address possible impacts from the proposed pumping, especially as three separate models were developed for the three possible recharge rates (5,000, 16,000 and 32,000 AFY). It is highly unlikely that modifying the model to address the issues identified would change the results. Notably, with respect to the four specific areas we have been asked to address:
The springs are hydraulically separated from the groundwater in the alluvium - the groundwater aquifers simulated in the model, thus, modifying the model would not change this;
The model does effectively simulate possible pumping-induced subsidence, especially the 5,000 AFY model, and modifying the model would not change this significantly;
The model does effectively simulate the possible saline intrusion that will result from pumping, and modifying the model, notably applying recharge to areas that surround the dry lakes, may change the simulations slightly, but not in any material way; and
The model does effectively simulate the possible change in groundwater levels, and resulting change in groundwater storage, as it considers three possible recharge rates, and modifying the models would not change this. For example, even if recharge were applied to the Bristol and Cadiz watersheds, the likely recharge that is tributary to the Cadiz project would still be well above that simulated in the 5,000 AFY model.

aquilogic
66
Review of the Groundwater Hydrology of the Cadiz Project
October 2013
7.0 CONCLUSIONS
7.1 Springs
It appears that springs in the watersheds that surround the Cadiz Project occur where either: (1) a fault along the flank of a mountain range forms a partial barrier to groundwater flow and groundwater behind the fault in the bedrock rises above groundwater in the alluvium and intercepts the land surface; or (2) a stratigraphic unit of lower permeability (e.g. an aquitard) forms a partial barrier to groundwater flow and groundwater mounds above the aquitard and intercepts the land surface. Thus, the springs are not in direct hydraulic communication with groundwater in the alluvial basins, and the pumping proposed as part of the Cadiz Project will have no measureable effect on spring flows. Accordingly, we concur that it is not possible for the springs to be impacted by the Cadiz Project.
7.2 Subsidence
Subsidence of the land surface can occur when fluids are removed from the subsurface. Such subsidence has been associated with oil extraction (e.g. Long Beach, California), groundwater pumping (e.g. Central Valley, California, Mexico City), and a combination of the two (e.g. Bakersfield, California).
We have reviewed the predicted subsidence results from the groundwater flow models developed by Geoscience (Geoscience, 2011a). The sediments contain very little clay content, except beneath the dry lakes, and the elastic storage coefficient used in the modeling appear reasonable for the sediments observed. We have performed calculations of possible subsidence that confirm the subsidence predicted by the modeling. These levels of subsidence over the areas predicted are well within the railroad tolerances. Accordingly, we agree that the Cadiz Project does not present a present risk of subsidence that would cause harm to any physical structures or the environment.
7.3 Saline Intrusion in Alluvial Sediments
An area of saline groundwater extends beneath the footprint of the dry lakes and to considerable depths (likely thousands of feet, given the increased density of the saline waters). A saline-fresh water interface will be present where “fresh” groundwater contacts this saline water. The location of the saline interface estimated in the FEIR (ESA, 2012) appears reasonable given the hydrogeologic conditions. Without the proposed pumping, the flow of fresh groundwater through the Fenner Gap would maintain the current interface some distance from the Cadiz Project. However, with pumping of groundwater at rates greater than recharge tributary to the Cadiz Project, the saline-fresh water interface will move toward the pumping

aquilogic
67
Review of the Groundwater Hydrology of the Cadiz Project
October 2013
well-field. In fact, the Cadiz Project is designed to pull back some freshwater to the southwest of the Fenner Gap that would eventually be lost to the saline zone and evaporation.
Based upon our review of the groundwater flow models, and calculations of advective solute transport velocity, the representation of the saline-fresh water interface in the alluvium presented in the FEIR (ESA, 2012) appears reasonable. Therefore, under the pumping plan proposed, the well-field would not be impacted by saline waters in the alluvium. Consequently, we concur that the Cadiz Project does not present a material risk of saline intrusion in the alluvial sediments.
7.4 Water Balance
As discussed, the watersheds that surround the Cadiz Project form a closed hydrologic system, both for surface water and groundwater. Thus, all water entering the system as precipitation must exit the system.
In 2012, the Desert Research Institute (DRI) conducted an evaporation survey at the Bristol and Cadiz Dry Lakes (DRI, 2012). This survey included more than 50,000 evaporation measurements. Based upon the DRI estimated evaporation rates, evaporative losses from Bristol and Cadiz Dry Lakes were calculated to be 7,860 AFY and 23,730 AFY, respectively. In addition to the evaporation losses from the hydrologic system, on average, an additional 4,600 AFY has been pumped over the recent years as part of Cadiz agricultural operations.
As stated, Qin = Qout, and in reverse - what goes out, MUST go in! While there may be debate about recharge estimates, it is hard to argue that evaporative losses are not 31,590 AFY. The key question is, “how much of the 31,590 AFY is available to the Cadiz Project?” The Cadiz Project FEIR addresses this issue by using a range of recharge estimates between 5,000 and 32,000 AFY for the purpose of evaluating potential impacts.
The total evaporative loss from the Bristol and Cadiz Dry Lakes has been quantified at 31,590 AFY. Thus, total recharge to the hydrologic system must be at least 31,590 (Qin = Qout). Perhaps not all of this total recharge may always be available for capture by the Cadiz Project well-field. However, given that most precipitation (and recharge) occurs at the higher elevations that surround the Fenner and Lanfair Valleys and the planned method of operation, the majority of the total recharge is likely available to the project. Therefore, it is reasonable to conclude that recharge available to the Cadiz Project is within the upper quartile of the range considered in the FEIR.
Irrespective of recharge that is available to the Project, there are NO significant environmental impacts from the proposed groundwater pumping at the Cadiz Project. To reiterate, aside from the amount of groundwater that is removed from long-term aquifer storage (i.e. the amount beyond the available recharge):

aquilogic
68
Review of the Groundwater Hydrology of the Cadiz Project
October 2013
Pumping groundwater at 50,000 AFY from the Cadiz Project, with available recharge anywhere between 5,000 and 32,000 AFY, has no measureable effect on the springs;
The groundwater flow models reasonably estimate the likely subsidence associated with this groundwater pumping, and subsidence levels for all recharge amounts evaluated are well within railroad tolerances; and
The movement (i.e. intrusion) of the saline fresh-water interface in the alluvium induced by this pumping is limited for all recharge amounts evaluated, will not impact the proposed well-field, and is reversible, over time.
7.5 Summary of Conclusions
To summarize the above:
The criticisms of the Project hydrology have failed to account for the actual field-measured evaporation data, which quantifies that at least 31,000 AFY is being lost to evaporation from the hydrologic system – and what goes out, must go in!
The range of recharge estimates used to assess possible project impacts appears to be reasonable and conservative.
Compared with other actively managed groundwater basins in southern California, the Project proposes a relatively low extraction rate versus the large quantity of water in storage in the tributary watersheds.
Largely due to the hydrogeology of the Project area and the manageable amounts of extraction proposed, we cannot identify any significant impacts from proposed groundwater pumping by the Cadiz Project on springs, subsidence, or saline intrusion in the alluvium. ● The levels of subsidence and saline intrusion presented in the FEIR appear to reasonably
reflect likely conditions, and the proposed pumping will not lead to significant subsidence or saline intrusion.
● Due to hydrologic separation, the pumping will have no effect on the springs. If the recharge available to the Project is lower than anticipated, the only party that would
bear any potential impact, if one were to unexpectedly occur, is Cadiz. The condition imposed on the Cadiz Project by the County of San Bernardino that limits
water-table drawdown will address this issue and serve to negate any potential impacts.

aquilogic
70
Review of the Groundwater Hydrology of the Cadiz Project
October 2013
9.0 REFERENCES
Bouwer, H. (1977). “Land Subsidence and Cracking Due to Ground-Water Depletion” in Ground Water, September-October 1977, Vol. 15, No.5.
CH2M Hill. (2010). Cadiz Groundwater Conservation and Storage Project. July. CH2M Hill. (2011). Assessment of Effects of the Cadiz Groundwater Conservation Recovery and
Storage Project Operations on Springs. August 3. CH2M Hill. (2012). Technical Memorandum, Estimated Evaporation from Bristol and Cadiz Dry
Lakes. May 8. Department of Water Resources. (2003). California’s Groundwater, Bulletin 118, Update 2003.
October. Department of Water Resources. (2013a). Watermaster Service in the West Coast Basin, Los
Angeles County, July 1, 2012 – June 31, 2013. September. Department of Water Resources. (2013b). Watermaster Service in the Central Basin, Los Angeles
County, July 1, 2012 – June 31, 2013. October. Desert Research Institute (DRI). (2012). Quantifying Evaporative Discharge from Bristol and
Cadiz Dry Lakes. March 16. Environmental Science Associates (ESA). (2012). Cadiz Valley Water Conservations, Recovery,
and Storage Project, Environmental Impact Report (SCH No. 2011031002). July. Freeze, R.A. and J. A. Cherry. (1979). Groundwater. Prentice-Hall, Inc., Englewood Cliffs, N.J. Geoscience Support Services, Inc. (Geoscience). (1999). Cadiz Groundwater Storage and Dry-
Year Supply Program, Report 1163. November. Geoscience Support Services, Inc. (Geoscience). (2000). Cadiz Groundwater Storage and Dry-
Year Supply Program – Dry Lake Evapotranspiration Estimates. Letter from Dennis Williams to Tom Freeman, URS Greiner Woodward-Clyde. March 9, 2000.
Geoscience Support Services, Inc. (Geoscience). (2011a). Cadiz Groundwater Modeling and Impact Analysis. September 1.
Geoscience Support Services, Inc. (Geoscience). (2011b). Technical Memorandum, Geohydrologic Assessment of the Fenner Gap Area. September 1.
Geoscience Support Services, Inc. (Geoscience). (2011c). Technical Memorandum, Supplemental Assessment of Pumping Required for the Cadiz Groundwater Conservation, Storage, and Recovery Project. September 20.
Johnson Wright, Inc. (JWI). 2012. Cadiz Groundwater Project, Hydrogeologic Review of Draft Environmental Impact Report. February 1.
Kenney GeoScience (Kenney). (2011). Geologic Structural Evaluation of the Fenner Gap Region Located Between the Southern Marble Mountains and Ship Mountains, San Bernardino County, California. August 31.
Kenney Geoscience (Kenney). (2013). Personal Communication. September 23, 2013.
aquilogic
71
Review of the Groundwater Hydrology of the Cadiz Project
October 2013
Lawrence Livermore National Laboratory (LLNL). (2000). A Calibrated Maxey-Eakin Curve for the Fenner Basin of the Eastern Mojave Desert, California. UCRL-ID-139030. Prepared by M.L. Davisson and T.P. Rose. May 15.
Poland, J.F. (1984). UNESCO Guidebook to Studies of Land Subsidence due to Ground-Water Withdrawal.
The Hydrodynamics Group. (2012). Comments on the Hydrogeology of Proposed Cadiz Project. March 4.
United States Geological Survey (USGS). (1983). Basic Ground-Water Hydrology. Water-Supply Paper 2220.
United States Geological Survey (USGS). (1996). National Water Summary on Wetland Resources, Wetland hdrology, water quality,a nd associated functions. Water Supply Paper 2425).
United States Geological Survey (USGS). (2000). Review of the Cadiz Groundwater Storage and Dry-Year Supply Program Draft Environmental Planning Technical Report, Groundwater Resources, Volumes I and II. Memorandum from James F. Devine to Molly S. Brady, Field Manager, Bureau of Land Management, Needles, California. February 23, 2000.
United States Geological Survey (USGS). (2008). Documentation of Computer Program INFIL3.0 – A Distributed-Parameter Watershed Model to Estimate Net Infiltration Below the Root Zone. Scientific Investigations Report 2008-5006.

aquilogic
Review of the Groundwater Hydrology of the Cadiz Project
October 2013
APPENDICES

aquilogic
Review of the Groundwater Hydrology of the Cadiz Project
October 2013
APPENDIX A ANTHONY BROWN’S CURRICULUM VITAE

aquilogic, Inc. environment ● water ● strategy
1
245 Fischer Avenue, Suite D‐2Costa Mesa, CA 92626, USA
Tel. +1.714.770.8040 Web: www.aquilogic.com
CURRICULUM VITAE July 2013
Anthony Brown CEO and Principal Hydrologist
mobile: +1.949.939.7160 email: [email protected]
Disciplines
Hydrology, Hydrogeology, Water Resources, Water Quality, Water Supply, Drinking Water Treatment, Contaminant Source Identification, Contaminant Fate and Transport, Soil and Groundwater Remediation, Environmental Liability Management, Legal and Regulatory Strategy. Education M.Sc. Engineering Hydrology, Imperial College London, 1989 D.I.C. Postgraduate diploma in Civil Engineering, Imperial College London, 1988 B.A. Geography, King's College London, 1985 Professional Experience
Anthony is a versatile and proficient environmental professional with over 20 years of experience in hydrology, hydrogeology, water quality, fate and transport of contaminants, groundwater remediation, regulatory strategy, water resources evaluation, and water supply engineering. He has conducted and managed numerous hazardous waste site investigations, including sites with multiple potentially responsible parties (PRPs), complex hydrogeology and fate and transport, fractured rock, multiple contaminants, and co‐mingled plumes. This work has included detailed Remedial Investigation (RI) or Phase II characterization studies, groundwater flow and solute transport modeling, Preliminary Endangerment Assessments, Human Health Risk Assessments, and remedial feasibility studies (FS), remedial system design and implementation. He has also used environmental economic analysis to support remedial decision‐making. He has been involved in the design, testing and permitting of drinking water treatment systems for impaired (contaminated) water sources. In addition, Anthony has also conducted liability assessments for the acquisition of major property portfolios. Anthony has provided expert services to many prominent environmental law firms, the California Attorney General’s Office, the New Jersey Attorney General’s Office, the Orange County District Attorney’s Office, the Sacramento County District Attorney’s Office, and numerous City Attorneys’ Offices. Through his work for water utilities impacted by gasoline constituents (e.g. MTBE, TBA
aquilogic Curriculum Vitae: Anthony Brown
July 2013
2
and 1,2‐DCA), chlorinated solvents (e.g. PCE, TCE, 1,1,1‐TCA), solvent stabilizers (e.g. 1,4‐dioxane), chlorofluorocarbons (e.g. Freon 11, 12 and 113), 1,2,3‐TCP, the rocket propellants perchlorate and NDMA, and hexavalent chromium and other metals, Anthony has become a recognized expert in the fate, transport, and remediation of these compounds, and the protection of source waters from contamination by such recalcitrant chemicals. Amongst other technical areas of expertise, he has also provided expert advice related to the environmental impact of oil field contaminants and their mitigation, and the source identification and mitigation of bacteria and fecal contamination in marine waters. Through his extensive experience on “high‐profile” projects, Anthony has developed an excellent working relationship with private and public sector clients, Federal, State and local elected officials and government agency staff, the legal community, professional organizations, non‐profit environmental organizations, and his colleagues in the environmental and water resources professions. He has also briefed White House staff, federal, State and local elected officials and regulators, independent commissions, professional groups, academic institutions, and the news media (including CBS 60 Minutes, National Public Radio [NPR] and local newspapers) on the impact of fuel oxygenates, chlorinated solvents, rocket propellants, hexavalent chromium, and bacteria on water quality. In addition to his teaching experience, Anthony has prepared over 2000 written project reports, and has presented and published numerous articles on a variety of environmental and water resources issues. Anthony has also briefed Federal, State and local elected officials and agency staff on the impact of fuel oxygenates, chlorinated solvents, rocket propellants, metals, oil field activities, and bacteria on water quality, and has appeared on National and Local news shows. Beyond his US experience, Anthony has worked on projects in the United Kingdom, Ireland, Canada, Mexico, Costa Rica, Columbia, Ecuador, Yemen, Egypt and Nepal. Expert Consulting and Witness Services
New Jersey Department of Environmental Protection (NJDEP) vs. Sunoco et al (State‐wide
assessment of impact and damages associated with MTBE and TBA releases in New Jersey) – US Federal Court, Southern District of New York (deposition, trial pending);
Orange County Water District (OCWD) vs. Sabic Innovative Plastics et al (Chlorinated solvent, 1,4‐dioxane and perchlorate contamination of groundwater resources from various sites in Orange County, California) – California Superior Court, Orange County (deposition, trial pending);

aquilogic Curriculum Vitae: Anthony Brown
July 2013
3
Commonwealth of Puerto Rico vs. ExxonMobil et al (Territory‐wide assessment of impact and damages associated with MTBE releases in New Jersey) – US Federal Court, Southern District of New York (deposition pending);
Orange County Water District (OCWD) vs. Unocal et al (MTBE and TBA contamination of groundwater resources from service station sites in Orange County, California) – US Federal Court, Southern District of New York (deposition, trial pending);
Southern California Water Company vs. Aerojet General Corp. (TCE, perchlorate and NDMA contamination of drinking water supplies in Rancho Cordova, California) – California Superior Court, Sacramento District (deposition, settled);
The City of Stockton Redevelopment Agency (RDA) vs. Conoco‐Phillips et al (petroleum hydrocarbon contamination at former oil terminals) – California Superior Court (deposition, settled);
PK Investments vs. Barry Avenue Plating (hexavalent chromium and solvent contamination of soil and groundwater) ‐ California Superior Court, Los Angeles District (deposition, settled);
The City of Modesto vs. Vulcan Chemical et al (perchloroethylene [PCE] contamination of drinking water wells and groundwater resources in Stanislaus County, California) – California Superior Court, San Francisco District (deposition, trial testimony);
City of Santa Monica, California vs. Shell et al (MTBE contamination of drinking water supplies) – California Superior Court, Orange County District (deposition, settled);
State of California vs. Joint Underwriters (perchlorate and solvent contamination at the Stringfellow Acid Waste disposal pits in Glen Avon) – California Superior Court (deposition);
Community of Broad Creek, North Carolina vs. BP Amoco et al (MTBE, benzene and 1,2‐DCA contamination of private water supply wells) – North Carolina Superior Court (deposition);
South Tahoe Public Utility District, California vs. ARCO et al (MTBE contamination of drinking water supplies) ‐ California Superior Court, San Francisco (deposition, trial testimony);
Private well owners in 18 reformulated gasoline (RFG) states vs. various oil companies (class action related to MTBE) ‐ US Federal Court, New York District (deposition, class certification hearing);
Individual plaintiffs vs. Lockheed Corporation (TCE and perchlorate contamination of drinking water supplies in Redlands, California) – California Superior Court, Los Angeles District (deposition, settled);
City of Norwalk vs. Five Point U‐Serve et al (1.2‐DCA contamination of a municipal drinking water well) – California Superior Court (deposition, case dismissed);
Forest City Corp. vs. Prudential Real Estate (PCE contamination of soil and groundwater) – California Superior Court, Los Angeles District (deposition, trial testimony);
Consolidated Electrical Distributors (CED) vs. Hebdon Electronics et al (chlorinated solvent contamination in fractured granite) ‐ California Superior Court, North San Diego District (deposition, trial testimony);

aquilogic Curriculum Vitae: Anthony Brown
July 2013
4
Southern California Water Company vs. various parties (water rights petition and adjudication for the American River, Sacramento, California) – State Water Resources Control Board, Sacramento.
The City of Santa Monica, California vs. ExxonMobil Corporation (MTBE contamination of drinking water supplies) – California Superior Court (designated, settled);
The town of Glenville, California vs. various parties (MTBE contamination of drinking water supplies in Kern County, California) ‐ California Superior Court (designated, settled);
Great Oaks Water Company vs. Chevron and Tosco (MTBE contamination of drinking water supplies in San Jose, California) ‐ California Superior Court (designated, settled);
Orange County District Attorney’s Office vs. ARCO et al (Underground Storage Tank [UST] violations, and MTBE contamination of soil and groundwater) ‐ California Superior Court (designated, settled);
Cambria Community Services District (CCSD) vs. Chevron et al (MTBE impact to drinking water supplies) in San Luis Obispo County, California ‐ California Superior Court (designated, settled);
Los Osos Community Services District (CCSD) vs. Chevron et al (MTBE impact to drinking water supplies) in San Luis Obispo County, California ‐ California Superior Court (designated, settled);
The town of East Alton, Illinois vs. various parties (MTBE contamination of drinking water supplies) – Illinois Superior Court, Jefferson County (designated, settled);
The City of Dinuba vs. Tosco et al (MTBE contamination of groundwater resources) ‐ California Superior Court (designated, settled);
Stella Stephens vs. Bazz‐Houston et al (chlorinated solvent contamination at an active metal finishing facility in Garden Grove, California) ‐ California Superior Court (designated, settled);
Communities for a Better Environment (CBE) vs. Chrome Crankshaft (hexavalent chromium and TCE contamination beneath a chrome plating facility and adjacent school) ‐ California Superior Court (designated, settled);
California Attorney General’s Office vs. Unocal (Natural Resource Damage Assessment [NRDA] at a former oil field in the central coast of California) ‐ California Superior Court (designated, settled);
Phillips Petroleum Corporation vs. private property owner (contamination from a former oil well in Signal Hill, California) ‐ California Superior Court (designated, settled);
Mobil Oil Corporation vs. private property owner (contamination from a former bulk fuel plant in the Bay Delta area) – California Superior Court (designated, settled); and
Mobil Oil Corporation vs. terminal operator (contamination from a former bulk fuel plant in Monterey area) – California Superior Court (designated, settled).

aquilogic Curriculum Vitae: Anthony Brown
July 2013
5
General Project Experience
Anthony has acted as the Principal in Charge, Project Manager, Quality Assurance (QA) Manager and/or Principal Review for the following ongoing or recently completed projects: Petroleum Hydrocarbons
Assessment of the Effectiveness of Site Investigation and Remediation Activities, Investigation of Off‐Site Groundwater Contamination, and Development of Remedial Programs (and Costs) at “Bellwether” Trial Sites ‐ Orange County Water District
Evaluation of Contaminant Conditions and Prior Site Investigation and Remediation Activity, Implementation of Off‐site Investigations, and Development of Remedial Programs and Associated Costs at Trial Sites in Puerto Rico – Commonwealth of Puerto Rico
Assessment of Site Investigation and Remediation Activities, Investigation of Off‐Site Groundwater Contamination, and Development of Remedial Programs (and Costs) at Trial Sites – New Jersey Department of Environmental Protection (NJDEP)
Development of a Remediation Approach and Costs for Soil and Groundwater Contamination at Two Former Petroleum Terminals – Stockton Redevelopment Agency
Assessment of the Nature of Contamination and the Costs to Address this Contamination at a Former Municipal Landfill in San Diego County – Confidential Client
Evaluation of Contaminant Sources, and the Fate and Transport of MTBE, 1,2‐DCA and Benzene to Numerous Private Water Supply Wells in the Community of Broad Creek, North Carolina
Assessment of the Effectiveness of Site Investigation and Remediation Activities at ARCO and Thrifty Service Stations Throughout Orange County ‐ Orange County District Attorney’s Office
Evaluation of Contaminant Sources, Fate, Transport and Impact of MTBE and TBA to Public Water Supplies, and the Costs to Treat these Contaminants, in the town of East Alton, Illinois
Court Appointed Consultant to Develop Site Investigation Programs at 35 Thrifty Service Stations in Orange County
Evaluation of Sources of MTBE Threatening Public Water Supplies in the town of Dinuba, California
Impact and Mitigation of Oil Field Contaminants at the Belmont Learning Center – Los Angeles Unified School District (LAUSD) ‐ Belmont Commission
Investigation, PRP Identification, Remediation and Restoration of Municipal Well Fields Impacted by Methyl‐tertiary Butyl Ether (MTBE) Contamination – City of Santa Monica (Charnock Well Field), South Lake Tahoe Public Utility District (STPUD), Santa Clara Valley Water District (SCVWD), Great Oaks Water Company
Oversight of Oil Company Investigation and Remediation Programs in Honolulu Harbor, Hawaii – US Environmental Protection Agency (USEPA)
aquilogic Curriculum Vitae: Anthony Brown
July 2013
6
Assessment of Oil Field Contaminants in Relation to High Incidences of Leukemia and non‐Hodgkins Lymphoma at a High School in Southern California – Confidential Client
Evaluation of Fuel Releases and Their Impact upon Groundwater Resources at Service Stations, Bulk Plants, Fuel Terminals and Refineries Throughout California – Confidential Client
Complete Restoration of Municipal Water Supply Wells Contaminated with MTBE – City of Santa Monica (Arcadia Well Field) and ExxonMobil Corporation
Preliminary Environmental Assessment (PEA) at the Hull Middle School ‐ located on a former oil field and landfill ‐ Torrance Unified School District (TUSD), California
Oversight of Investigation and Remediation Activities for a MTBE Release at a Service Station and the Potential Impact on a City’s Water Distribution System – City of Oxnard, California
Assessment of MTBE and TBA Contamination of Drinking Water Wells from Releases at Gasoline Stations – Town of East Alton, Illinois
Investigation of MTBE Contamination of Water Supply Wells and Other Petroleum Hydrocarbon Contamination at a Marine Fueling Depot in Catalina – Southern California Edison
Impact of MTBE Releases at Service Stations and a Bulk Fuel Terminal on Drinking Water Wells and Groundwater Resources ‐ City of Dinuba, California
Identification of UST Compliance Penalties and Contamination of Soil and Groundwater by MTBE and Other Petroleum Products at Gasoline Service Stations ‐ Orange County District Attorney (OCDA), California
Oversight of a Court‐ordered Plume Delineation Program at Gasoline Service Stations in Orange County, California – OCDA, California
Oversight and Investigation of Remediation of MTBE Contamination Impacting Drinking Water Supplies in the Towns of Cambria and Los Osos/Baywood Park, California – Cambria Community Services District (CCSD), Los Osos Community Services district (LOCSD), Cal‐cities Water Company
Assessment of the Impact of an MTBE Release on Water Supply Wells, Sewers and a Wastewater Treatment Plant – City of Morro Bay, California
Investigation and Remediation of an MTBE Release in the Immediate Vicinity of a Drinking Water Supply Well ‐ City of Cerritos, California
Assessment of the Impact of Petroleum Hydrocarbon Contamination from a Wolverine Pipeline Release in Jackson, Michigan – Private Property Owner
Investigation of Fuel Oil LNAPL and Hexavalent Chromium Contamination at a Former Clay Products Manufacturing Facility in Fremont, California – Mission Clay Products
Assessment of the Impact of MTBE Releases on Water Supply Wells, and Oversight of Responsible Party (RP) Investigation and Remediation Activities ‐ Soquel Creek Water District, California

aquilogic Curriculum Vitae: Anthony Brown
July 2013
7
MTBE Contamination of Private Drinking Water Supplies and Development of Water Supply Treatment and Replacement Alternatives – Glenville, California
Assessment of the Impact of MTBE on Drinking Water Supply Wells in Santa Clara County, California – Great Oaks Water Company (GOWC)
Assessment of Data Gaps and Research Needs Regarding MTBE Impact to Water Resources – UK Environment Agency
Investigation and Mitigation of the Impact of Oil Field Contaminants on a Large Apartment Complex in Marina del Rey, Los Angeles, California – Confidential Client
Investigation and Remediation of Methane and Hydrogen Sulfide as Part of the Redevelopment of a Former Oil Field in Carson, California ‐ Dominguez Energy/Carson Companies
Assessment of Methane and Petroleum Hydrocarbon Contamination at a Former Oil Field in Santa Fe Springs, California – General Petroleum
Natural Resource Damage Assessment (NRDA) at the Guadalupe Oil Field, California ‐ State of California (Department of Fish and Game [DFG], Oil Spill Prevention and Response [OSPR], Attorney General and Regional Water Quality Control Board [RWQCB])
Assessment of the Impact of Oil Field Activities on Surface Water and Groundwater Resources in the Central Coast of California – State of California
Groundwater Investigation and Remediation at Four Petroleum Terminals in Wilmington, Carson, and San Pedro, California ‐ GATX
Research into Technologies for Treatment of MTBE in Water ‐ Association of California Water Agencies (ACWA) / Western States Petroleum Association (WSPA) / Oxygenated Fuels Association (OFA)
Characterization and Remediation of a Hydrocarbon Release (including MTBE) from a Refined Product Pipeline in Fractured Bedrock in Illinois – Shell
Investigation and Remediation of Petroleum Hydrocarbon Contamination Beneath a City Maintenance Yard and City Bus Yard – City of Santa Monica, California
Investigation and Remediation of a Gasoline Release (including MTBE) in Fractured Bedrock Resulting From a Catastrophic Tank Failure – Intrawest Ski Resorts, California
Assessment of LNAPL, Aromatic Hydrocarbon, and Chlorinated Solvent Contamination Beneath a Former Waste Disposal Facility in Santa Fe Springs, California – Confidential Client
Investigation of Soil and Groundwater Contamination at a Fueling Facility at a Municipal Airport – City of Santa Monica, California
Pipeline Leak Investigation and Remedial Design ‐ Mobil Pipeline, Ft. Tejon, California Investigation of a Petroleum Release in Fractured Bedrock ‐ Chevron, Julian, California Contribution of Multiple Sources to Groundwater Contamination – Mobil Oil Corporation, La
Palma, California Forensic Assessment of a Gasoline Release – Mobil Oil Corporation, Santa Monica, California Investigation of a Diesel Fuel Release – General Petroleum, Point Hueneme, California

aquilogic Curriculum Vitae: Anthony Brown
July 2013
8
Service Station Investigations and Remediation (> 60 sites) ‐ Mobil Oil Corporation, World Oil, Los Angeles County Metropolitan Transportation Authority (LACMTA), and Others
Assessment of a Crude Release from a Former Pipeline ‐ Mobil Oil, Gorman, California Remediation of 2,000,000 gallon (7,560 m3) LNAPL Spill ‐ Gulf Strachan Gas Plant, Alberta Chlorinated Hydrocarbons
Assessment of the Effectiveness of Site Investigation and Remediation Activities, Investigation of Off‐Site Groundwater Contamination, and Development of Remedial Programs (and Costs) at Solvent “Source Sites” in the South Basin Groundwater Protection Project (SBGPP) ‐ Orange County Water District
Project Management Consultant (PMC) for the Hazardous Substances Account Act (HSAA) Program (i.e. State‐CERCLA) as part of the SBGPP – Orange County Water District
Assessment of Conceptual Hydrogeology and the Sources of 1,2‐DCA and PCE Contamination of a Large Public Water Supply Well – Confidential Client
Investigation and Remediation of Chlorinated Solvent Contamination in Soil and Groundwater Beneath a Metal Finishing Facility in Inglewood, California – Bodycote Hinterliter and Joseph Collins Estate.
Investigation and Remediation of Soil and Groundwater Contamination at a Former Wood Treating Facility – Port of Los Angeles
Assessment of the Nature of PCE Releases from Dry Cleaning Facilities, the Impact Upon Groundwater Resources, and the Cost of Remediation – City of Modesto, California
Investigation of Chlorinated Solvent Contamination in Soil, Groundwater and Drinking Water Supplies Beneath Various Facilities in Lodi, California – Confidential Client
Investigation of TCE and Hexavalent Chromium Contamination at the Suva School in Montebello, California – Communities for a Better Environment
Remediation of Chlorinated Solvents, Including Vinyl Chloride, in Soil and Groundwater Beneath a Former Aerospace Facility in West Los Angeles, California – Playa Vista Capital
Assessment of Chlorinated Solvent and Hexavalent Chromium Contamination at an Active Metal Finishing Facility in the City of Garden Grove, California – Confidential Client
Investigation and Remediation of Hexavalent Chromium and TCE Contamination at an Active Plating Facility in West Los Angeles – confidential client
Contamination of Drinking Water Supplies by TCE and Perchlorate from an Aerospace Manufacturing Facility in Redlands, California – Individual Plaintiffs
Investigation and Remediation of Hexavalent Chromium, TCE, and Gasoline LNAPL Contamination at an Active Plating Facility in Santa Fe Springs, California – Confidential Client
Investigation and Remediation of Hexavalent Chrome and TCE Contamination at the Los Angeles Academy (formerly Jefferson) Middle School, Los Angeles, California – Jefferson Site PRP Group
aquilogic Curriculum Vitae: Anthony Brown
July 2013
9
Evaluation of Groundwater and Contaminant Conditions at an Active Municipal Landfill in Los Angeles County, California – Browning Ferris Industries (BFI)
Investigation of Chlorinated Solvent Contamination in Groundwater Beneath a Municipal Airport – City of Santa Monica, California
Resource Conservation and Recovery Act (RCRA) Facility Assessment and Closure for a Large Aerospace Facility in Hawthorne, California – Northrop Grumman Corporation
Characterization of Complex Hydrogeology and Contaminant Fate and Transport (with Poly‐chlorinated Biphenyls [PCBs] and Chlorinated Solvents) in Karstic Bedrock at a Site on the National Priority List (NPL) in Missouri – MEW PRP Steering Committee
Design of a Groundwater Remediation Program for Chlorinated Solvent, Perchlorate and Other Contaminants Utilizing Existing Drinking Water Wells – San Gabriel Valley Water Company (SGVWC)
Investigation of a Chlorinated Solvent Release in Fractured Bedrock – Consolidated Electrical Distributors, San Diego, California
Contamination of Drinking Water Supplies by TCE from an Aerospace Manufacturing Facility in Redlands, California – Individual Plaintiffs
Investigation of a Chlorinated Solvent Release at an Active Chemical Terminal ‐ GATX, San Pedro, California
Technical and Regulatory Assistance, and RP Oversight and Review, Chlorinated Solvent Contamination Beneath a Former Aerospace Facility – City of Burbank, California
Investigation and Remedial Design for a Chlorinated Solvent Release at an Active Machine Shop – Mighty USA, Los Angeles, California
Remediation of Chlorinated Solvents in Groundwater as Part of a Rail Freight Transfer Terminal Development ‐ Port of Los Angeles, California
Remedial Evaluation of PCE Contamination at a Former Scientific Instruments Manufacturing Facility – Forest City, Irvine, California
Evaluation of a Chlorinated Solvent Release at a Dry Cleaners ‐ Los Angeles City Attorney, West Los Angeles, California
Assessment of a Chlorinated Solvent Release from Former Dry Cleaners – DeLoretto Plaza, Santa Barbara, California
Characterization and Remediation of LNAPL at an Active Chemical Refinery ‐ ICI, Teeside, UK
Perchlorate
Assessment of the Effectiveness of Site Investigation and Remediation Activities, Investigation of Off‐Site Groundwater Contamination, and Development of Remedial Programs (and Costs) at Perchlorate Release Sites in the South Basin Groundwater Protection Project (SBGPP) ‐ Orange County Water District
Hydrogeologic Investigation, Source Identification, Water Supply Well Impact Assessment, and Drinking Water Treatment for Perchlorate – City of Morgan Hill, California

aquilogic Curriculum Vitae: Anthony Brown
July 2013
10
Evaluation of the Fate and Transport of Perchlorate and NDMA Contamination and its Impact on Water Supplies in Rancho Cordova, California – Southern California Water Company
Hydrogeologic Investigation, Water Supply Well Impact Assessment, Regulatory Assistance, and Responsible Party (RP) Oversight for Perchlorate Contamination – City of Gilroy, California
Regulatory and Technical Assistance, RP Oversight and Review, Water Resource Impact Assessment for Perchlorate Contamination – City of Santa Clarita, California
Design of a Groundwater Remediation Program for Chlorinated Solvent, Perchlorate and Other Contaminants Utilizing Existing Drinking Water Wells – San Gabriel Valley Water Company (SGVWC), San Gabriel Valley Superfund Site, California
Evaluation of the Off‐site Migration of Perchlorate and TCE Contamination from a Rocket Testing Facility in Simi Hills, California – City of Calabasas, County of Los Angeles
Investigation of Potential Perchlorate Source Sites, Source Contribution, Contaminant Pathway Assessment, and Drinking Water Treatment – Fontana Water Company, West Valley Water District, Fontana, California
Evaluation of Previous Environmental Investigations, Contaminant Transport and Remediation Options for Perchlorate and Solvent Contamination at the Stringfellow Acid Waste Disposal Pits in Glen Avon, California – Joint Underwriters
Hexavalent Chromium
Investigation and Remediation of Hexavalent Chrome and TCE Contamination at the Los Angeles Academy (formerly Jefferson) Middle School, Los Angeles – Jefferson Site PRP Group
Investigation and Remediation of Hexavalent Chromium and TCE Contamination at an Active Plating Facility in West Los Angeles – Confidential Client
Hydrogeologic Investigation of Hexavalent Chromium Contamination in the Northern Area of the Central Basin in Los Angeles County – Water Replenishment (WRD)
Investigation of TCE and Hexavalent Chrome Contamination at the Suva School in Montebello, California – Communities for a Better Environment
Investigation of Fuel Oil LNAPL and Hexavalent Chromium Contamination at a Former Clay Products Manufacturing Facility in Fremont, California – Mission Clay Products
Investigation and Remediation of Hexavalent Chromium, TCE, and Gasoline LNAPL Contamination at an Active Plating Facility in Santa Fe Springs California – Confidential Client
Other Projects
Evaluation of Groundwater Conditions and Quality, and the Degree of Hydraulic Connection Between Groundwater Basins, as Part of a Water Rights Dispute – Confidential Client
Negotiation of Private Agreements Between Water Utilities and RPs – City of Santa Monica, STPUD, City of Morro Bay, SGVWC, GOWC, City of Oxnard, OCDA
Evaluation of Power Plant Intake and Outfall Structures on Fecal Coliform Plume Dynamics and Resulting Beach Closures, Huntington Beach, California – California Energy Commission
aquilogic Curriculum Vitae: Anthony Brown
July 2013
11
Investigation of Bacteria and Fecal Contamination in Groundwater Beneath the Downtown Area of Huntington Beach, California – City of Huntington Beach
Investigation of the Source(s) and Transport of Enterococcus and Fecal Bacteria to the Near Shore Waters of Huntington Beach, California – City of Huntington Beach, County of Orange, Orange County Sanitation District (OCSD)
Characterization and Remediation, Former Town Gas Sites ‐ British Gas Properties, U.K. Development of Guidelines for Source Water Assessment Programs ‐ State of California Aquifer Characterization, Contaminant Assessment, Slurry Wall Design and Installation, Soil
Excavation and Water Treatment System Design ‐ Port of Los Angeles, California Professional History
aquilogic, Inc., CEO and Principal Hydrologist, 2011 to present. exp, Executive Vice‐President, Chief Business Development Officer, 2010 to 2011 WorleyParsons, Senior VP, Strategy & Development, 2008 to 2010. WorleyParsons Komex, Regional Director, U.S. Operations, 2006 to 2008. Komex Environmental Ltd., Chief Executive Officer, Principal Shareholder, Director, 1999 to 2005. KomexH2O ScienceInc., President and Principal Hydrologist, 1992 to 1999. Remedial Action Corporation, Project Manager and Geohydrologist, 1989 to 1992. Lanco Engineering, Project Manager, 1985 to 1987, and 1988. Royal Geographical Society, Kosi Hills Resource Conservation Project, Nepal: Project Director, 1983 to 1985
Teaching
Anthony has recently taught the following classes: Environmental Aspects of Soil Engineering and Geology ‐ a ten week course at the University
of California, Irvine; Site Characterization and Remediation of Environmental Pollutants ‐ two lectures as part of
the course at Imperial College London; Methyl Tertiary Butyl Ether: Implications for European Groundwater ‐ a one day seminar for
the UK Environment Agency (UKEA); Successful Remediation Strategies – a two day course for the NGWA; Understanding Environmental Contamination in Real Estate, and one day class for the
International Right‐of‐Way Association (IRWA); Project Development and the Environmental Process, a one day class for the IRWA; Environmental Awareness, a one day class for the IRWA; and Regional Fuels Management Workshop, a two‐day workshop for the US Environmental
Protection Agency (USEPA).
aquilogic Curriculum Vitae: Anthony Brown
July 2013
12
Publications
In addition to his teaching experience, Anthony has prepared over 1000 written project reports, and has written, presented and published many articles regarding the following: Contamination of groundwater and drinking water supplies by fuel oxygenates, chlorinated
solvents, rocket propellants, and metals Contaminant fate and transport in fractured or heterogeneous media The impact of oil field activities on the environment Source water assessment and protection Public health and toxicology Risk analysis and assessment Environmental economics General water resources and environmental issues The following is a list of publications and presentations: M. Hagemann, A. Brown, and J. Klein, 2002. An Estimate of Costs to Address MTBE Releases
from Underground Storage Tanks and to Treat Drinking Water Supplies Impacted by MTBE. NGWA, Conference on MTBE: Assessment, Remediation, and Public Policy, Orange, CA. June 2002
M. Hagemann, A. Brown, and J. Klein, 2002. From Tank to Tap: A Chronology of MTBE in Groundwater. NGWA, Conference on Litigation Ethics, and Public Awareness, Washington, D.C., August 2002
Major, W., A. Brown, S. Roberts, L. Paprocki, and A. Jones, 2001. The Effects of Leaking Sanitary Sewer Infrastructure on Groundwater and Near Shore Ocean Water Quality in Huntington Beach, California. California Shore and Beach Preservation Association and California Coastal Coalition – Restoring The Beach: Science, Policy and Funding Conference. San Diego, California, November 8‐10, 2001.
Ross, S.D., A. Gray, and A.Brown, 2001. Remediation of Ether Oxygenates at Drinking Water Supplies and Release Sites. Can‐Am 6th Annual Conference of National Groundwater Association Banff, Alberta, Canada. July 2001.
Gray, A.L. and A. Brown, 2000. The Fate, Transport, and Remediation of Tertiary‐Butyl‐Alcohol (TBA) in Ground Water. Proceedings of the NGWA/API 2000 Petroleum Hydrocarbons and Organic Chemicals in Groundwater: Prevention, Detection, and Remediation. Anaheim, November 14‐17, 2000.
Hardisty, P.E., J. Dottridge and A. Brown, 2000. MTBE in Ground Water in the United Kingdom and Europe. Proceedings of the NGWA/API 2000 Petroleum Hydrocarbons and Organic
aquilogic Curriculum Vitae: Anthony Brown
July 2013
13
Chemicals in Groundwater: Prevention, Detection, and Remediation. Anaheim, November 14‐17, 2000.
Brown, A., B. Eisen, W. Major, and A. Zawadzki, 2000. Geophysical, Hydrogeological and Sediment Investigations of Bacterial Contamination in Huntington Beach, California. California Shore and Beach Preservation Association – Preserving Coastal Environments Conference. Monterey, California, November 2‐4, 2000.
Hardisty, P.E., G.M. Hall, A. Brown and H.S. Wheater, 2000. Natural Attenuation of MTBE in Fractured Media. 2nd National Conference on Natural Attenuation in Contaminated Land and Groundwater. Sheffield, U.K., June 2000.
Brown, A., 2000. Treatment of Drinking Water Impacted with MTBE. Mealey’s MTBE Conference. Marina del Rey, California. May 11‐12, 2000.
Brown, A., 2000. Other Fuel Oxygenates in Groundwater. Mealey’s MTBE Conference. Marina del Rey, California. May 11‐12, 2000.
Brown, A., 2000. The Fate, Transport and Remediation of TBA in Groundwater. Mealey’s MTBE Conference. Marina del Rey, California. May 11‐12, 2000.
Brown, A., 2000. MTBE Contamination of the City of Santa Monica Water Supply: Recap. Mealey’s MTBE Conference. Marina del Rey, California. May 11‐12, 2000.
Mooder, R.B., M.D. Trudell, and A. Brown, 2000. A Theoretical Analysis of MTBE Leaching from Reformulated Gasoline in Contact with Groundwater. American Chemical Society, Div. of Environmental Chemistry, 219th ACS National Meeting. San Francisco, March 26‐30, 2000.
Trudell, M.R., K.D. Mitchell, R.B. Mooder, and A. Brown, 2000. Modeling MTBE Transport for Evaluation of Migration Pathways in Groundwater. American Chemical Society, Div. of Environmental Chemistry, 219th ACS National Meeting. San Francisco, March 26‐30, 2000.
Brown, A., 1999. How LUST Policy Lead to the Current MTBE Problem. Submitted for the Government Conference on the Environment. Anaheim, CA. August 1999.
Trudell, M.R., K.D. Mitchell, R.B. Mooder and, A. Brown, 1999. Modeling MTBE transport for evaluation of migration pathway scenarios. In proceedings, 6th International Petroleum Environmental Conference, Houston TX, November 16‐19, 1999. Integrated Petroleum Environmental Consortium, University of Tulsa, OK.
Gray, A.L., A. Brown, R.A. Rodriguez, 1999. Treatment of a Groundwater Impacted with MTBE By‐Products. In proceedings, 6th International Petroleum Environmental Conference, Houston TX, November 16‐19, 1999. Integrated Petroleum Environmental Consortium, University of Tulsa, OK.
Gray, A.L., A. Brown, M.M. Nainan, and R.A. Rodriguez, 1999. Restoring a Public Drinking Water Supply Contaminated with MTBE. In proceedings, 6th International Petroleum Environmental Conference, Houston TX, November 16‐19, 1999. Integrated Petroleum Environmental Consortium, University of Tulsa, OK.
Ausburn M.P., A. Brown, D. A. Reid and S.D. Ross, 1999. Environmental Aspects of Crude Oil Releases to the Subsurface. In proceedings, 6th International Petroleum Environmental

aquilogic Curriculum Vitae: Anthony Brown
July 2013
14
Conference, Houston TX, November 16‐19, 1999. Integrated Petroleum Environmental Consortium, University of Tulsa, OK.
Hardisty, P.E., A. Brown, and H. Wheater, 1999. Using Economic Analysis to Support Remedial Goal Setting and Remediation Technology Selection. In proceedings, 6th International Petroleum Environmental Conference, Houston TX, November 16‐19, 1999. Integrated Petroleum Environmental Consortium, University of Tulsa, OK.
Brown, A., and J.J. Clark, 1999. MTBE: Air Today, Gone Tomorrow! California Environmental Law and Remediation Reporter. Argent Communications Group. Foresthill, CA. Volume 9 (2): pp 21 ‐ 30.
Brown, A., P.E. Hardisty, and H. Wheater, 1999. The Impact of Fuel Oxygenates on Water Resources. A one‐day course for the UK Environment Agency. London, UK. June 1999
Brown, A., K.D. Mitchell, C. Mendoza and M.R. Trudell, 1999. Modeling MTBE transport and remediation strategies for contaminated municipal wells. Battelle In Situ and On‐Site Bioremediation, Fifth International Symposium, San Diego, CA. April 19‐22, 1999.
Brown, A., 1999. LUST Policy and Its Part in the MTBE Problem. USEPA National Underground Storage Tank Conference. Daytona Beach, FL. March 15‐17, 1999.
Brown, A., T.E. Browne and R.A. Rodriguez, 1999. Restoration Program for MTBE Contamination of the City of Santa Monica Arcadia Well Field. Ninth Annual Conference on Soil and Groundwater Contamination, Oxnard, CA. March 1999.
Brown, A., 1999. Moderator of a Panel Session ‐ Judging Oil Spill Response Performance: The Challenge of Competing Perspectives. International Oil Spill Conference. Seattle, WA. March 8‐11, 1999.
Brown, A., 1999. MTBE: Asleep at the Wheel! Editorial in the Newsletter of the Los Angeles County Bar Association, Environmental Section. February 1999.
Brown, A., J.S. Devinny, T.E. Browne and R.A. Rodriguez, 1998. Restoration of a Public Drinking Water Supply Impacted by Methyl tertiary Butyl Ether (MTBE) Contamination. Proceedings of the NGWA/API 1998 Petroleum Hydrocarbons and Organic Chemicals in Groundwater: Prevention, Detection, and Remediation, November 11‐13, 1998, Houston, TX.
Brown, A., 1998. Petroleum and the Environment: A Consultants Perspective. USEPA Regional Fuels Management Workshop, November 3‐4, 1998, Shell Beach, CA.
Brown, A., 1998. How Much Does Remediation Really Cost? Presented at the Southern California Chapter of the Appraisal Institute, Summer Seminar Spectacular: Damages, Diminution and Mitigation. Anaheim, California, August 13, 1998.
Brown, A., J.S. Devinny, A.L. Gray and R.A. Rodriguez, 1998. A Review of Potential Technologies for the Remediation of Methyl tertiary Butyl Ether (MTBE) In Groundwater. International Petroleum and the Environment Conference, Albuquerque, NM. October 1998.
Brown, A., A.L. Gray, and T.E. Browne, 1998. Remediation of MTBE at Leaking Underground Storage Tank (LUST) Sites. The UST Clean‐up Fund Conference, Austin, TX. June 22, 1998.
aquilogic Curriculum Vitae: Anthony Brown
July 2013
15
Brown, A., J.R.C. Farrow, R.A. Rodriguez, and B.J. Johnson, 1998. Methyl tertiary Butyl Ether (MTBE) Contamination of the City of Santa Monica Drinking Water Supply: An Update. Proceedings of the National Ground Water Association (NGWA) Southwest Focused Conference: MTBE and Perchlorate, June 3‐5, 1998, Anaheim, California.
Patterson, G, B. Groveman, J. Lawrence, and A. Brown, 1998. The Legal Implications, Claims, and Courses of Action for Water Purveyors Impacted by MTBE and Perchlorate. Proceedings of the NGWA Southwest Focused Ground Water Conference: Discussing the Issue of MTBE and Perchlorate in Ground Water. June 3‐4, 1998, Anaheim, California.
Clark, J.J., A. Brown, And R.A. Rodriguez, 1998. The Public Health Implications of MTBE and Perchlorate in Water: Risk Management Decisions for Water Purveyors. Proceedings of the NGWA Southwest Focused Ground Water Conference: Discussing the Issue of MTBE and Perchlorate in Ground Water. June 3‐4, 1998, Anaheim, California.
Brown, A., J.S. Devinny, M.K. Davis, T.E. Browne, And R.A. Rodriguez, 1997. A Review of Potential Technologies for the Treatment of Methyl tertiary Butyl Ether (MTBE) in Drinking Water. Proceedings of the NGWA/API 1997 Petroleum Hydrocarbons and Organic Chemicals in Groundwater: Prevention, Detection, and Remediation, November 12‐14, 1997, Houston, TX.
Brown, A., J.R.C. Farrow, R.A. Rodriguez, B.J. Johnson And A.J. Bellomo, 1997. Methyl tertiary Butyl Ether (MTBE) Contamination of the City of Santa Monica Drinking Water Supply. Proceedings of the National Groundwater (NGWA) and American Petroleum Institute (API) 1997 Petroleum Hydrocarbons and Organic Chemicals in Groundwater: Prevention, Detection, and Remediation, November 12‐14, 1996, Houston, Texas.
Brown, A., J.S. Devinny, M.K. Davis, T.E. Browne, And R.A. Rodriguez, 1997. A Review of Treatment Technologies for Methyl tertiary Butyl Ether (MTBE) in Drinking Water. Proceedings of the American Chemical Society (ACS) Conference on Chemistry and Spectroscopy, October 1997, Irvine, California.
Brown, A., J.S. Devinny, T.E. Browne and D. Chitwood, 1997. A Review of Alternative Technologies for the Removal of MTBE from Drinking Water. Association of California Water Agencies (ACWA) Workshop on MTBE, March 13, 1997, Ontario Airport Hilton, California.
Brown, A., 1997. Methyl tertiary Butyl Ether (MTBE) in Groundwater and its Impact on the City of Santa Monica Drinking Water Supply. California Groundwater Resource Association (GRA), January 22, 1997, Wyndham Garden Hotel, Costa Mesa, California.
Gray, A.L., A. Brown, B.J. Moore and T.E. Browne, 1996. Respiration Testing for Bioventing and Biosparging Remediation of Petroleum Contaminated Soil and Groundwater. NGWA Outdoor Action Conference, Las Vegas, NV, May, 1996.
Brown, A. and P.E. Hardisty, 1996. Use of Technical and Economic Analyses for Optimizing Technology Selection and Remedial Design: Examples from Hydrocarbon Contaminated Sites. Sixth West Coast Conference on Contaminated Soils and Groundwater, AEHS, March 1996.
Farrow, J.R.C., A. Brown, W. Burgess, R.E. Payne, 1995. High Vacuum Soil Vapor Extraction as a Means of Enhancing Contaminant Mass Recovery from Groundwater Zones of Low

aquilogic Curriculum Vitae: Anthony Brown
July 2013
16
Transmissivity. Accepted for Proceedings of the Petroleum Hydrocarbons and Organic Chemicals in Groundwater, API/NGWA Conference. Houston, TX. November, 1995.
Ausburn, M.P., A. Brown, M. Brewster, and P. Caloz, 1995. Use of Borehole Terrain Conductivity Logging to Delineate Multiple Ground Water Bearing Zones and Map Alluvial Fan Facies. California Groundwater Resource Association (GRA), Annual Conference, November, 1995, Costa Mesa, California.
Hardisty, P.E., S.D. Ross, F.B. Claridge and A. Brown, 1995. Technical and Economic Analysis of Remedial Techniques for LNAPL in Fractured Rock. International Association of Hydrogeologists (IAH), October, 1995, Solutions 95 Conference, Calgary, Canada.
Croft, R.G., A. Brown, P. Johnson, and J. Armstrong, 1994. Tracer Gas Use in Soil Vapor Extraction and Air Sparge Pilot Tests: Case Studies. HMRCI Superfund XV Conf. Proceedings, Washington D.C, November, 1994.
Bauman, P.B., M. Brewster and A. Brown, 1994. Borehole Logging as an Aid to Hydrogeologic Characterization of Leaking Underground Storage Tank (LUST) Sites. Proceedings from the National Groundwater Association (NGWA), 8th National Outdoor Action Conference and Exposition, Minneapolis, Minnesota. May, 1994.
Bauman, P.B., A. Brown, M. Brewster and M. Lockhart, 1994. The use of Borehole Geophysics in the Characterization of Both Vadose and Saturated Zone Lithologies at LUST Sites. Proceedings from the USEPA Technology Transfer at LUST Sites Conference, Urbana, Illinois. May, 1994.
Bauman, P.B., J. Sallomy, A. Brown and M. Brewster, 1994. Unconventional Applications of Terrain Conductivity Logging to Groundwater Investigations. Proceedings of the Symposium on the Application of Geophysics at Environmental and Engineering Projects (SAGEEP), Boston, Massachusetts, 1994.
Brown, A., R.E. Payne and P. Perlwitz, 1993. Air Sparge Pilot Testing at a Site Contaminated with Gasoline. Proceedings of the Petroleum Hydrocarbons and Organic Chemicals in Groundwater: Prevention, Detection, and Restoration. API/NGWA Conference, Houston, Texas. November 1993.
Brown, A., 1991. Air Permeability Testing for Vapor Extraction. Conference Proceedings; Petroleum Hydrocarbon Contaminated Soil, San Diego, California. March 1991.
Wheater, H., B. Beck, A. Brown and S. Langan, 1991. The Hydrological Response of the Allt a' Mharcaidh Catchment, Inferences from Experimental Plots. Journal of Hydrology, Vol. 123; pp 163‐1990.
Anthony has also briefed the following on the impact of fuel oxygenates, chlorinated solvents, rocket propellants, metals, oil field activities, and bacteria on water quality: U.S. Environmental Protection Agency (USEPA) staff (Region IX and headquarters), including
Assistant Administrators White House Officials
aquilogic Curriculum Vitae: Anthony Brown
July 2013
17
US Senators and Representative State Senators and Assembly Members State regulators Local officials (Mayors, council and board members, City attorneys, etc.) Independent Commissions Professional bodies (ABA, ACS, ACWA, AEHS, AGWA, NGWA, GRA, etc.) Academic institutions and many other organizations