review of state and industry spill data - us epa · number of hydraulic fracturing related- spills,...
TRANSCRIPT
EPA/601/R-14/001 l May 2015 l www.epa.gov/hfstudy
Review of State and Industry Spill Data: Characterization of Hydraulic Fracturing-Related Spills

Characterization of Hydraulic Fracturing-Related Spills May 2015
[This page intentionally left blank.]
ii

Characterization of Hydraulic Fracturing-Related Spills May 2015
Review of State and Industry Spill Data: Characterization of Hydraulic Fracturing-Related Spills
U.S. Environmental Protection Agency Office of Research and Development
Washington, DC
May 2015 EPA/601/R-14/001
iii
Characterization of Hydraulic Fracturing-Related Spills May 2015
Disclaimer This document has been reviewed in accordance with U.S. Environmental Protection Agency policy
and approved for publication. Mention of trade names or commercial products does not constitute endorsement or recommendation for use.
Preferred Citation: U.S. Environmental Protection Agency. 2015. Review of State and Industry Spill Data: Characterization of Hydraulic Fracturing-Related Spills. Office of Research and Development, Washington, DC. EPA/601/R-14/001.
iv

Characterization of Hydraulic Fracturing-Related Spills May 2015
Table of Contents Disclaimer..................................................................................................................................................... iv
Table of Contents .......................................................................................................................................... v
List of Tables ............................................................................................................................................... vii
List of Figures ............................................................................................................................................. viii
Preface ......................................................................................................................................................... ix
Authors and Contributors ............................................................................................................................. x
Acknowledgements ....................................................................................................................................... x
Executive Summary ....................................................................................................................................... 1
1. Objective .................................................................................................................................................. 3
2. Introduction ............................................................................................................................................. 3
3. Methods ................................................................................................................................................... 5
3.1. Data Sources ................................................................................................................................. 5 3.2. Search Methods ............................................................................................................................ 7 3.3. Data Compilation and Analysis ..................................................................................................... 8 3.4. Quality Assurance and Quality Control ......................................................................................... 9
4. Results: Spill Characterization .................................................................................................................. 9
4.1. Volumes Spilled ........................................................................................................................... 11 4.2. Spilled Materials.......................................................................................................................... 13 4.3. Spill Sources ................................................................................................................................ 15 4.4. Spill Causes .................................................................................................................................. 16 4.5. Environmental Receptors............................................................................................................ 19
5. Results: Containment and Response ..................................................................................................... 21
5.1. Containment ............................................................................................................................... 21 5.2. Response ..................................................................................................................................... 23
6. Discussion ............................................................................................................................................... 24
6.1. Study Limitations ........................................................................................................................ 26 7. Conclusions ............................................................................................................................................ 27
References .................................................................................................................................................. 28
Appendix A: Standardization of Spill Characteristics .................................................................................. 32
A.1. Volumes ...................................................................................................................................... 32 A.2. Spilled Materials.......................................................................................................................... 33 A.3. Spill Sources ................................................................................................................................ 33 A.4. Spill Causes .................................................................................................................................. 33 A.5. Environmental Receptors............................................................................................................ 33
Appendix B: Hydraulic Fracturing-Related Spills Table ............................................................................... 34
v

Characterization of Hydraulic Fracturing-Related Spills May 2015
Glossary ....................................................................................................................................................... 35
Glossary References ................................................................................................................................ 36
vi

Characterization of Hydraulic Fracturing-Related Spills May 2015
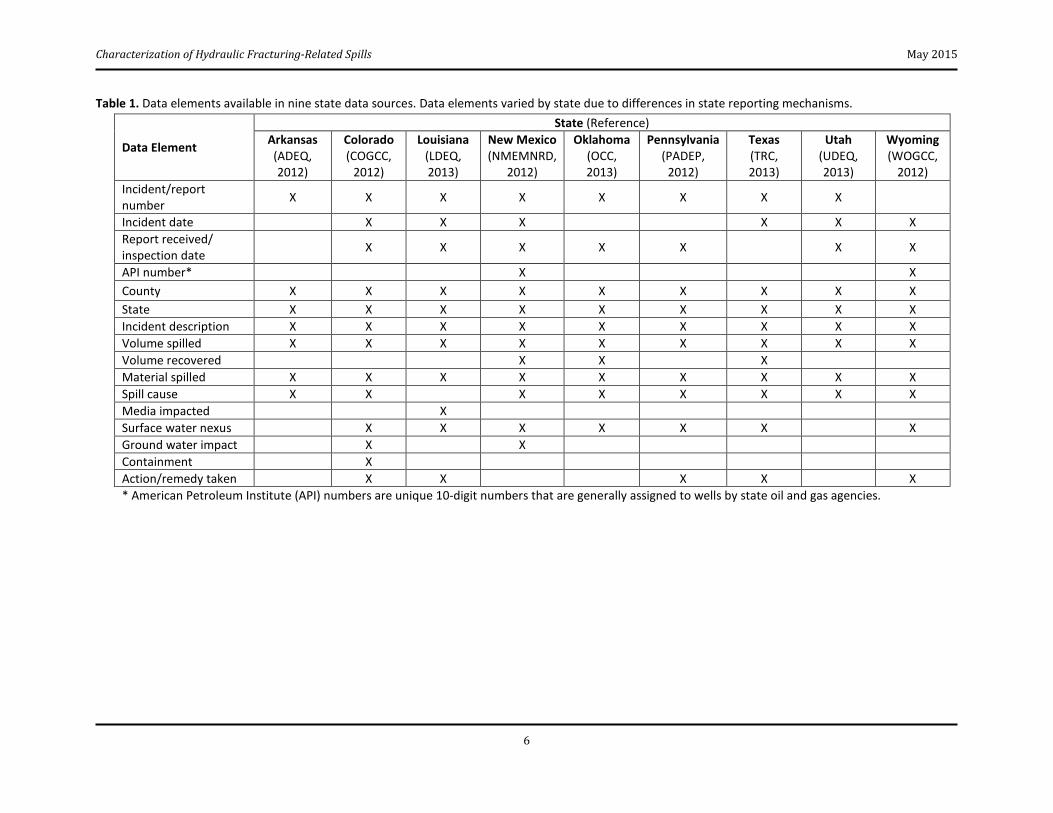
List of Tables Table 1. Data elements available in nine state data sources ..................................................................... 6
Table 2. Number and percentage of hydraulic fracturing-related spills identified from state and industry data sources used in this study by state ...................................................................... 10
Table 3. Definitions and examples of spilled materials ............................................................................ 14
Table 4. Number of hydraulic fracturing related-spills, total reported volume spilled, and reported volume per spill by material type ............................................................................................... 14
Table 5. Definitions and examples of spill sources................................................................................... 16
Table 6. Number of hydraulic fracturing-related spills, total reported volume spilled, and reported volume per spill by source type .................................................................................................. 16
Table 7. Definitions and examples of spill causes .................................................................................... 17
Table 8. Number of hydraulic fracturing-related spills, total reported volume spilled, and reported volume per spill by cause type ................................................................................................... 18
Table 9. Number of hydraulic fracturing-related spills, total reported volume spilled, and reported volume per spill by environmental receptor .............................................................................. 20
Table 10. Examples of breaches of berms and dikes, as described in records from hydraulic fracturing-related spills............................................................................................................... 22
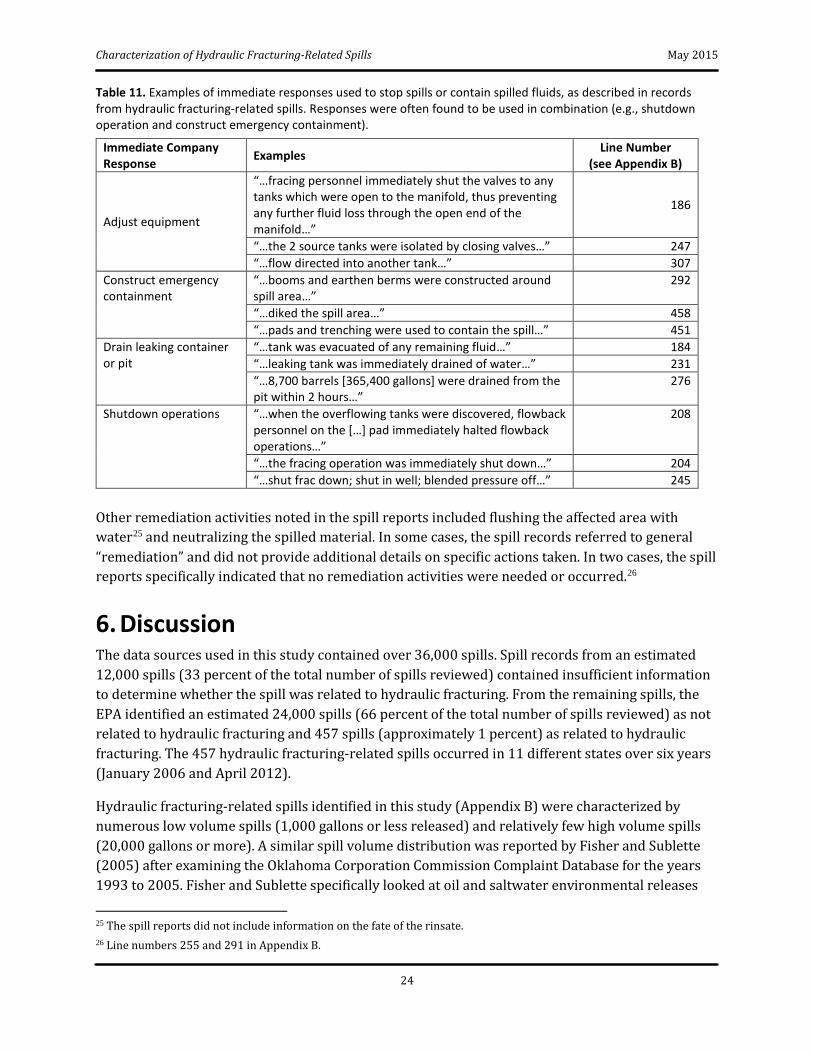
Table 11. Examples of immediate responses used to stop spills or contain spilled fluids, as described in records from hydraulic fracturing-related spills ..................................................................... 24
Table A1. Categorization method for reported volumes of spilled materials ............................................ 32
Table A2. Categorization method for environmental receptors ................................................................ 33
vii

Characterization of Hydraulic Fracturing-Related Spills May 2015
List of Figures Figure 1. Percent of reviewed spills determined to be related or unrelated to hydraulic fracturing ....... 10
Figure 2. Availability of reported information in records from hydraulic fracturing-related spills for each spill characteristic assessed ............................................................................................... 11
Figure 3. Distribution of reported hydraulic fracturing-related spills by reported volume spilled ........... 12
Figure 4. Percent distribution of fluid fate by total reported volume for hydraulic fracturing-related spills ............................................................................................................................................ 13
Figure 5. Summary of materials spilled by (a) number of hydraulic fracturing-related spills and (b) total reported volume spilled ............................................................................................... 15
Figure 6. Summary of spill sources by (a) number of hydraulic fracturing-related spills and (b) total reported volume spilled ............................................................................................... 17
Figure 7. Summary of spill causes by (a) number of hydraulic fracturing-related spills and (b) total reported volume spilled ............................................................................................... 18
Figure 8. Number of hydraulic fracturing-related spills in which spilled fluids reached or did not reach surface water, ground water, or soil ................................................................................ 20
viii

Characterization of Hydraulic Fracturing-Related Spills May 2015
Preface The U.S. Environmental Protection Agency (EPA) is conducting a study of the potential impacts of hydraulic fracturing for oil and gas on drinking water resources. This study was initiated in Fiscal Year 2010 when Congress urged the EPA to examine the relationship between hydraulic fracturing and drinking water resources in the United States. In response, the EPA developed a research plan (Plan to Study the Potential Impacts of Hydraulic Fracturing on Drinking Water Resources) that was reviewed by the agency’s Science Advisory Board (SAB) and issued in 2011. A progress report on the study (Study of the Potential Impacts of Hydraulic Fracturing on Drinking Water Resources: Progress Report), detailing the EPA’s research approaches and next steps, was released in late 2012 and was followed by a consultation with individual experts convened under the auspices of the SAB.
The EPA’s study includes the development of several research projects, extensive review of the literature and technical input from state, industry, and non-governmental organizations as well as the public and other stakeholders. A series of technical roundtables and in-depth technical workshops were held to help address specific research questions and to inform the work of the study. The study is designed to address research questions posed for each stage of the hydraulic fracturing water cycle:
• Water Acquisition: What are the possible impacts of large volume water withdrawals fromground and surface waters on drinking water resources?
• Chemical Mixing: What are the possible impacts of surface spills of hydraulic fracturing fluids onor near well pads on drinking water resources?
• Well Injection: What are the possible impacts of the injection and fracturing process on drinkingwater resources?
• Flowback and Produced Water: What are the possible impacts of surface spills of flowback andproduced water on or near well pads on drinking water resources?
• Wastewater Treatment and Waste Disposal: What are the possible impacts of inadequatetreatment of hydraulic fracturing wastewaters on drinking water resources?
This report, Review of State and Industry Spill Data: Characterization of Hydraulic Fracturing-Related Spills, is the product of one of the research projects conducted as part of the EPA’s study. It has undergone independent, external peer review in accordance with agency policy and all of the peer review comments received were considered in the report’s development.
The EPA’s study will contribute to the understanding of the potential impacts of hydraulic fracturing activities for oil and gas on drinking water resources and the factors that may influence those impacts. The study will help facilitate and inform dialogue among interested stakeholders, including Congress, other Federal agencies, states, tribal government, the international community, industry, non-governmental organizations, academia, and the general public.
ix
Characterization of Hydraulic Fracturing-Related Spills May 2015
Authors and Contributors Susan Burden, PhD, US EPA
Maryam A. Cluff, MS, Student Services Contractor for the US EPA, under contract EP-13-H-000438
Leigh E. DeHaven, MS, US EPA
Cindy Roberts, MS, US EPA
Susan L. Sharkey, MA, US EPA
Alison Singer, MA, Student Services Contractor for the US EPA, under contract EP-13-H-000474
Acknowledgements The EPA would like to acknowledge all of the organizations and individuals that provided data and information used for this study, including Kendra Zamzow (AAAS Policy Fellow). The agency would also like to acknowledge Claudia Meza-Cuadra (Student Services Contractor, under contract EP-13-H-000054), Matt Richards (US EPA), and Stephen Watkins (US EPA) for their efforts in the development of this report. An independent, external peer review of this report was conducted through the Eastern Research Group, Inc., under contract EP-C-12-021. The contractors’ role did not include establishing agency policy.
x
Characterization of Hydraulic Fracturing-Related Spills May 2015
Executive Summary Advances in hydraulic fracturing and horizontal drilling technologies have led to increased oil and gas exploration and production activity in different regions of the United States. Hydraulic fracturing is a technique used to enable or enhance the production of hydrocarbons from underground rock formations. It involves the injection of hydraulic fracturing fluids (typically a mixture of water, proppant, and chemical additives) under pressures great enough to fracture the targeted hydrocarbon-bearing formations. The volumes and chemical compositions of hydraulic fracturing fluids and flowback fluids (i.e., fluids that return to the surface after hydraulic fracturing) managed on oil and gas production well pads have led to concerns about potential human health and environmental impacts from surface spills of these fluids. The objective of this study was to characterize hydraulic fracturing-related spills that may reach surface or ground water resources using spill reports obtained from selected state and industry data sources.
Data gathered from selected state and industry data sources were used to characterize hydraulic fracturing-related spills with respect to volumes and materials spilled, sources and causes of spills, environmental receptors, and spill containment and response activities. For the purposes of the study, hydraulic fracturing-related spills were defined as those occurring on or near the well pad before or during the mixing and injection of hydraulic fracturing fluids or during the post-injection recovery of fluids. Because the main focus of this study was to characterize hydraulic fracturing-related spills on the well pad that may reach surface or ground water resources, the following topics were not included: transportation-related spills, drilling mud spills, and spills associated with disposal through underground injection control wells.
Data on spills that occurred between January 2006 and April 2012 were obtained from nine states with online spill databases or other data sources, nine hydraulic fracturing service companies, and nine oil and gas production well operators. The data sources used in this study contained over 36,000 spills. Spill records from an estimated 12,000 spills (33 percent of the total number of spills reviewed) contained insufficient information to determine whether the spill was related to hydraulic fracturing. Of the spills with sufficient information, the EPA identified an estimated 24,000 spills (66 percent) as not related to hydraulic fracturing and 457 spills (approximately 1 percent) as related to hydraulic fracturing. The 457 hydraulic fracturing-related spills occurred in 11 different states over the period of time studied.
For the 457 hydraulic fracturing-related spills included in the study, the most commonly reported information obtained from state and industry data sources was the type of material spilled (reported in 97 percent of the hydraulic fracturing-related spills), followed by the volume spilled and then the source and cause of the spill. In approximately 90 percent of the hydraulic fracturing-related spills, information was available on whether or not spilled fluids reached at least one environmental receptor (surface water, ground water, and/or soil). The EPA did not determine whether spilled fluids affected the quality of surface or ground water resources.
The hydraulic fracturing-related spills were characterized by numerous low volume spills (up to 1,000 gallons) and relatively few high volume spills (greater than 20,000 gallons). The most common material spilled was flowback and produced water, and the most common source of spills
1

Characterization of Hydraulic Fracturing-Related Spills May 2015
was storage units. More spills were caused by human error than any other cause. There were 300 spills (66 percent of the 457 spills included in this study) in which spilled fluids reached at least one environmental receptor. Twenty-four of these spills reached multiple environmental receptors. Soil was the most commonly reported environmental receptor, with spilled fluids reaching soil in over half (64 percent) of all hydraulic fracturing-related spills. Spilled fluids were reported to have reached surface water in 32 hydraulic fracturing-related spills (7 percent); the median volume per spill for these spills was 3,500 gallons, and volumes per spill ranged from 90 gallons (5th percentile) to 45,000 gallons (95th percentile). There was one spill in which spilled fluids were reported to have reached ground water (0.2 percent). Spilled fluids were reported as not reaching surface or ground water in 186 spills (41 percent).
The spills characterized in this study were likely a subset of the total number of hydraulic fracturing-related spills that occurred in the United States between January 2006 and April 2012. Although spill data were obtained from nine states that are among the top oil and gas producing states in the country, similar data from other oil and gas producing states were not included. The state data sources used in this study may not have included all spills related to hydraulic fracturing because some spills may not have met the spill reporting requirements that were in place at the time of the spill. Additionally, some reported spills may not have been identified as related to hydraulic fracturing due to insufficient information in the data sources. The quantitative characterization of hydraulic fracturing-related spills presented in this report (e.g., the percentages in the paragraph above) may have been different if more hydraulic fracturing-related spills could have been identified from the data sources used in this study.
This report presents the results of a broad review of state and industry spill data from 457 hydraulic fracturing-related spills. Data from these spills were used to characterize volumes and materials spilled, spill sources and causes, and environmental receptors. There were several key findings. Spills related to hydraulic fracturing were most often characterized by numerous, low volume events (up to 1,000 gallons) and relatively few high volume events (greater than 20,000 gallons). The most common material spilled was flowback and produced water, and the most common source of spills was storage units. More spills were caused by human error than any other cause. Over half of the spills associated with hydraulic fracturing reached an environmental receptor, with 33 instances of spilled fluids reaching surface or ground water resources. These results, as well as other information on spill characteristics and containment and response activities, provide important insights into the nature of hydraulic fracturing-related spills in several key states with hydraulic fracturing.
2
Characterization of Hydraulic Fracturing-Related Spills May 2015
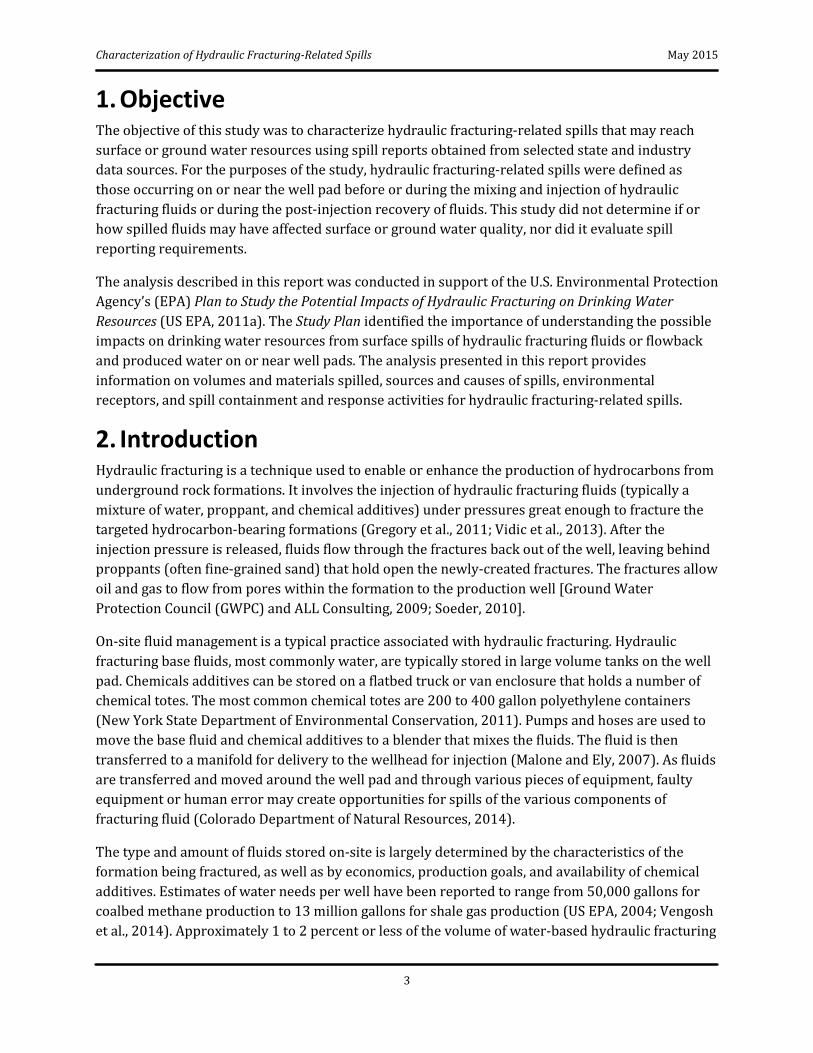
1. ObjectiveThe objective of this study was to characterize hydraulic fracturing-related spills that may reach surface or ground water resources using spill reports obtained from selected state and industry data sources. For the purposes of the study, hydraulic fracturing-related spills were defined as those occurring on or near the well pad before or during the mixing and injection of hydraulic fracturing fluids or during the post-injection recovery of fluids. This study did not determine if or how spilled fluids may have affected surface or ground water quality, nor did it evaluate spill reporting requirements.
The analysis described in this report was conducted in support of the U.S. Environmental Protection Agency’s (EPA) Plan to Study the Potential Impacts of Hydraulic Fracturing on Drinking Water Resources (US EPA, 2011a). The Study Plan identified the importance of understanding the possible impacts on drinking water resources from surface spills of hydraulic fracturing fluids or flowback and produced water on or near well pads. The analysis presented in this report provides information on volumes and materials spilled, sources and causes of spills, environmental receptors, and spill containment and response activities for hydraulic fracturing-related spills.
2. IntroductionHydraulic fracturing is a technique used to enable or enhance the production of hydrocarbons from underground rock formations. It involves the injection of hydraulic fracturing fluids (typically a mixture of water, proppant, and chemical additives) under pressures great enough to fracture the targeted hydrocarbon-bearing formations (Gregory et al., 2011; Vidic et al., 2013). After the injection pressure is released, fluids flow through the fractures back out of the well, leaving behind proppants (often fine-grained sand) that hold open the newly-created fractures. The fractures allow oil and gas to flow from pores within the formation to the production well [Ground Water Protection Council (GWPC) and ALL Consulting, 2009; Soeder, 2010].
On-site fluid management is a typical practice associated with hydraulic fracturing. Hydraulic fracturing base fluids, most commonly water, are typically stored in large volume tanks on the well pad. Chemicals additives can be stored on a flatbed truck or van enclosure that holds a number of chemical totes. The most common chemical totes are 200 to 400 gallon polyethylene containers (New York State Department of Environmental Conservation, 2011). Pumps and hoses are used to move the base fluid and chemical additives to a blender that mixes the fluids. The fluid is then transferred to a manifold for delivery to the wellhead for injection (Malone and Ely, 2007). As fluids are transferred and moved around the well pad and through various pieces of equipment, faulty equipment or human error may create opportunities for spills of the various components of fracturing fluid (Colorado Department of Natural Resources, 2014).
The type and amount of fluids stored on-site is largely determined by the characteristics of the formation being fractured, as well as by economics, production goals, and availability of chemical additives. Estimates of water needs per well have been reported to range from 50,000 gallons for coalbed methane production to 13 million gallons for shale gas production (US EPA, 2004; Vengosh et al., 2014). Approximately 1 to 2 percent or less of the volume of water-based hydraulic fracturing
3

Characterization of Hydraulic Fracturing-Related Spills May 2015
fluid is composed of chemical additives (GWPC and ALL Consulting, 2009; Lee et al., 2011; US EPA, 2015), which suggests that approximately 500 to 260,000 gallons or less of chemical additives may be brought on-site for hydraulic fracturing. Chemical additives can be composed of one or more chemicals and can be used in hydraulic fracturing fluids as acids, friction reducers, surfactants, scale inhibitors, iron control agents, corrosion inhibitors, and biocides (Arthur et al., 2009; Gregory et al., 2011; GWPC and ALL Consulting, 2009; US EPA, 2015).
When the pressure applied during hydraulic fracturing is released, fluid flows back from the well. The initial fluid that returns to the surface is often called “flowback.” Fluid that flows from the well along with oil and gas during the production phase is often referred to as “produced water.” Flowback and produced water are stored at the well pad before disposal or reuse. Typical storage facilities include closed containers and open air impoundments (GWPC, 2009). Leaks and spills of flowback and produced water may occur on the well pad due to human error, equipment failure, or well blowouts (Colorado Department of Natural Resources, 2014).
The volume and chemical composition of fluids that return to the surface after the rock is fractured can vary widely. Between 10 and 70 percent of injected fluid comes back up the well as flowback (GWPC and ALL Consulting, 2009; US EPA, 2011b). General compositions and on-site volumes of flowback fluids vary among targeted formation types (e.g., shale versus sandstone) (Alley et al., 2011) and within formations of the same type (e.g., southwest versus northwest Marcellus Shale) (Barbot et al., 2013). Flowback fluids are typically, but not always, characterized as highly saline (Blauch et al., 2009; Neff et al., 2011) and often contain major anions and cations, metals, and naturally occurring radionuclides (Chapman et al., 2012; Rowan et al., 2011). Flowback fluids may also contain organic chemicals from injected fluids, formation waters, and formation solids (Orem et al., 2007; Sirivedhin and Dallbauman, 2004; Strong et al., 2014).
Concerns have been raised about potential human health and environmental impacts associated with surface spills of fluids managed on oil and gas production well pads (Rozell and Reaven, 2012; Stringfellow et al., 2014; Vengosh et al., 2014). In particular, spilled fluids associated with hydraulic fracturing may flow into nearby surface waters or infiltrate into ground water and alter water quality (Olmstead et al., 2013; Stringfellow et al., 2014; Vengosh et al., 2014). For example, Papoulias and Velasco (2013) demonstrated that hydraulic fracturing fluid spilled into surface water likely contributed to the distress and death of Blackside Dace fish in Kentucky by lowering the pH and increasing the conductivity of the stream. Using data from post-spill sampling reports in Colorado, Gross et al. (2013) identified concentrations of benzene, toluene, ethylbenzene, and xylene in ground water samples collected in response to operator-reported spills. Gross and colleagues attributed the presence of these compounds in ground water to numerous hydraulic fracturing-related spills.
To better understand spills associated with hydraulic fracturing, this study used data from selected state and industry data sources to characterize hydraulic fracturing-relakted spills. Information on hydraulic fracturing-related spills was analyzed with respect to volumes and materials spilled, sources and causes of spills, environmental receptors, and containment and response activities.
4

Characterization of Hydraulic Fracturing-Related Spills May 2015
3. Methods3.1. Data Sources Data used in this study were obtained from both state and industry data sources.1 States often maintain spill databases or spill records that are designed to track inspection results, complaints, and/or violations. These spills can be associated with a wide variety of activities, including, but not limited to, hydraulic fracturing. Incidents found in state data sources are typically self-reported or can be identified through citizen complaints and routine inspections by state officials.
States were selected based on the number of oil and gas wells that were reported by nine oil and gas service companies to have been hydraulically fractured between approximately September 2009 and September 2010 (US EPA, 2012).2 The EPA used the service company information to identify the ten states with the most hydraulic fracturing activity reported during that time period: Arkansas, Colorado, Louisiana, New Mexico, North Dakota, Oklahoma, Pennsylvania, Texas, Utah, and Wyoming. State spill data sources were identified for all states except North Dakota.3 Online, publicly accessible spill databases were identified for Arkansas, Colorado, New Mexico, and Pennsylvania. Offline, publicly accessible spill data were obtained from Louisiana, Oklahoma, Texas, Utah, and Wyoming. The state spill data sources varied in accessibility, searchability, and the types of information available. Table 1 summarizes the data elements (e.g., volume spilled, spill cause) available for each state data source.
Industry data were obtained from responses to information requests that were sent to nine hydraulic fracturing service companies4 and nine oil and gas well operators5 in September 2010 and August 2011, respectively (US EPA, 2010, 2011c).6 Although the service companies were not specifically asked for information on spills, some companies provided information relevant for this report. The EPA asked the well operators for spill reports associated with 350 well identifiers corresponding to wells that were reported to have been hydraulically fractured between approximately September 2009 and September 2010. Some of the industry data were submitted as confidential business information under the Toxic Substances Control Act. The EPA worked with
1 Information on spills can also be obtained from the U.S. Coast Guard’s National Response Center. The National Response Center records information on oil spills, chemical releases, and maritime security incidents. Data sources maintained by states were considered more appropriate for this study. 2 The nine hydraulic fracturing service companies included: BJ Services Company; Complete Production Services, Inc.; Halliburton Energy Services, Inc.; Key Energy Services; Patterson-UTI Energy; RPC, Inc.; Schlumberger Technology Corporation; Superior Well Services; and Weatherford International. The companies reflected a range of company sizes and geographic diversity (US EPA, 2011a, 2012). 3 No central database from North Dakota was available at the time of this research. The North Dakota Department of Health now records and makes reports available at www.ndhealth.gov/EHS/Spills/. 4 See footnote 2. 5 The nine oil and gas operators included: Clayton Williams Energy, Inc.; ConocoPhillips; EQT Corporation; Hogback Exploration, Inc.; Laramie Energy II, LLC; MDS Energy, Ltd.; Noble Energy, Inc.; SandRidge Exploration and Production, LLC; and Williams Production Company, LLC. The operators had wells in diverse geographic areas and were chosen to reflect a range of company sizes (US EPA, 2012). 6 The Paperwork Reduction Act of 1995 limits the number of information requests to nine entities per set of queries, unless pre-approved by the Office of Management and Budget.
5
Characterization of Hydraulic Fracturing-Related Spills May 2015
Table 1. Data elements available in nine state data sources. Data elements varied by state due to differences in state reporting mechanisms.
Data Element
State (Reference) Arkansas (ADEQ, 2012)
Colorado (COGCC,
2012)
Louisiana (LDEQ, 2013)
New Mexico (NMEMNRD,
2012)
Oklahoma (OCC, 2013)
Pennsylvania (PADEP,
2012)
Texas (TRC, 2013)
Utah (UDEQ, 2013)
Wyoming (WOGCC,
2012) Incident/report number X X X X X X X X
Incident date X X X X X X Report received/ inspection date X X X X X X X
API number* X X County X X X X X X X X X State X X X X X X X X X Incident description X X X X X X X X X Volume spilled X X X X X X X X X Volume recovered X X X Material spilled X X X X X X X X X Spill cause X X X X X X X X Media impacted X Surface water nexus X X X X X X X Ground water impact X X Containment X Action/remedy taken X X X X X * American Petroleum Institute (API) numbers are unique 10-digit numbers that are generally assigned to wells by state oil and gas agencies.
6

Characterization of Hydraulic Fracturing-Related Spills May 2015
the service companies and well operators to summarize and present the data used in this report in a way that protects their claims of confidentiality.
3.2. Search Methods Data sources were initially searched to identify spills that occurred between January 1, 2006, and April 30, 2012. This timeframe encompassed a period of rapid increase in hydraulic fracturing across the United States (US Government Accountability Office, 2014).
Each data source was searched separately because of differences among data sources. Data sources were searched using a combination of available filters (e.g., material spilled), keywords, and line-by-line reviews, depending on the searchability of each data source. Keywords included, but were not limited to: “hydraulic fracturing,” “frac,” “flowback,” “guar gum,” “glycol,” “quartz,” “hydrochloric acid,” and some names of companies known to conduct hydraulic fracturing activities. The list of keywords was revised as each data source was searched. Keyword searches also depended on the available search methods because some data sources used fixed terms for certain fields. For example, the New Mexico Oil and Conservation Division Spills Database had fixed terms for the “spill material” field that included “gelled brine (frac fluid)” and “produced water,” but not “flowback.”
Incident descriptions of all spills within the study timeframe and identified through filters, keyword searches, and line-by-line reviews were reviewed to determine whether the spill was related to hydraulic fracturing and occurred on or near the well pad.7 Spills were identified as related to hydraulic fracturing if the incident description indicated that the spill occurred immediately before or during mixing and injection of hydraulic fracturing fluids, or during flowback. Hydraulic fracturing-related spills were generally identified through the use of “hydraulic fracturing,” “fracking,” or “flowback” in incident descriptions. Spills were also identified as related to hydraulic fracturing if chemical additives identified in the reports were specific to hydraulic fracturing activities (e.g., crosslinkers or gelling agents).
After identifying hydraulic fracturing-related spills within the study’s scope, each state, service company, and well operator was given a list of spills compiled from its own data. Each data owner reviewed the data and provided further information where possible, including identifying spills that had been incorrectly designated as being related to hydraulic fracturing. These spills were removed and not included in any analyses.
Search Limitations. Searching individual state data sources by keywords has limitations. While common spelling variations were applied for various keywords (e.g., “frac,” “frack,” and “frak”), incidents could have been missed if a word was incorrectly spelled within the data source (e.g., “glycal” instead of “glycol”). Additionally, a more expansive list of keywords may have identified additional spills that could have been related to hydraulic fracturing.
7 Because the main focus of this study was to characterize hydraulic fracturing-related spills on the well pad that may reach surface or ground water resources, the following topics were not included: transportation-related spills, drilling mud spills, and spills associated with disposal through underground injection control wells.
7

Characterization of Hydraulic Fracturing-Related Spills May 2015
3.3. Data Compilation and Analysis Hydraulic fracturing-related spill data obtained from the state and industry data sources were compiled into a single table that contained information on both the spill (e.g., spill cause, spilled material, and volume) and spill containment and response. Cells in the table were populated using the original data from state and industry sources. Data were generally pulled from the relevant field in the data source records. However, differences in state reporting mechanisms left data gaps for some information used in this report, including volumes of spilled and recovered fluids, spill causes, and environmental receptors. These data gaps were filled with information from the incident descriptions where possible. In some cases, the same spill was entered multiple times in a single data source or was found in both industry and state data sources. In these instances, information from each entry was combined into a single entry, and the duplicate entries were removed.8 When a spill was reported in both a state and an industry data source, the EPA did not find discrepancies between the industry-provided data and the state data source; rather, the industry-provided data supplemented information from the state data source.
Each data source characterized spills in a different way and provided slightly different information (Table 1). Therefore, data related to hydraulic fracturing-related spills were standardized prior to analysis. Section 4 and Appendix A provide information about the standardization of volumes, materials spilled, sources, causes, and environmental receptors (i.e., the environmental media reached by a spill, such as surface water, ground water, and/or soil). Appendix B contains the standardized hydraulic fracturing-related spill table.
Analyses were performed on the data included in Appendix B to characterize hydraulic fracturing-related spills according to volumes and materials spilled, sources and causes of spills, and environmental receptors (Section 4). The number of spills associated with a given characteristic, as well as total and per spill reported volumes, were determined. Median, 5th percentile, and 95th percentile per spill volumes were calculated from information provided in 370 spill records (81 percent of the hydraulic fracturing-related spills); the remaining spill records did not contain volume information. Calculated volumes were rounded to one significant figure if less than 100 gallons, or to two significant figures if greater than or equal to 100 gallons. Volumes reported in the spill records included discrete values (e.g., 100 gallons), ranges (e.g., 50 to 100 gallons), and upper or lower bounds (e.g., less 100 gallons).9 The reported or calculated volumes in this report should be considered to be estimates. Some spill volumes, for example, were extrapolated from a storage container with a known volume, but the precise amount of material that spilled out of the storage container was not known. While spills from storage containers were more likely to be quantified, spills from other sources (e.g., lines or hoses) were more uncertain because the volume associated with those sources was likely to be unknown.
Information related to spill containment and response was reviewed and summarized to provide additional context on fluid and spill management (Section 5).
8 Spills identified in both state and industry data sources are listed by the state data source in Appendix B. 9 Appendix A describes how each of these entries were treated during the development of the table included in Appendix B.
8

Characterization of Hydraulic Fracturing-Related Spills May 2015
3.4. Quality Assurance and Quality Control The EPA does not make any claims as to the quality or accuracy of the data gathered from the state and industry data sources used in this study. Quality assurance and quality control measures were used to ensure that the analyses performed were properly conducted and that the data used in this report accurately represent the original data obtained from state and industry data sources.
Data from each state source were evaluated by a single reviewer to identify spills potentially related to hydraulic fracturing. Those spills categorized as “related to hydraulic fracturing” were then reviewed by a small group of additional reviewers. For each spill, the group of reviewers reached a consensus about whether the spill could be identified as related to hydraulic fracturing based on the information provided in the spill reports. As noted in Section 3.2, all data owners were offered an opportunity to review their data and provide updated or additional information, including identifying spills incorrectly designated as related to hydraulic fracturing. Approximately six percent of the spills were identified by the data owners as unrelated to hydraulic fracturing and were subsequently removed from Appendix B.
Each field of Appendix B was standardized by a single reviewer. A second individual conducted a complete review of the standardization. Any differences were resolved by both reviewers looking at the original data. Lastly, the final, standardized data were compared with the original data and any discrepancies were addressed. States and companies were also provided a draft of the categorization methods for comment; their comments were considered during the development of the table used for analysis (Appendix B).
Additional quality assurance information on this project can be found in the Quality Assurance Project Plan for Hydraulic Fracturing Surface Spills Data Analysis, which was approved on August 2, 2012, and was later updated on September 9, 2013 (US EPA, 2013). The project underwent a technical systems audit by the designated EPA Quality Assurance Manager on August 27, 2012, and no corrective actions were identified.
4. Results: Spill CharacterizationThe EPA reviewed an estimated 36,000 spills that were reported in the state and industry data sources during the study’s timeframe. Roughly 66 percent of the spills were determined to be not related to hydraulic fracturing (Figure 1), and approximately 1 percent (457) of the spills were identified as being related to hydraulic fracturing. Information available for an estimated 33 percent of the approximately 36,000 spills reviewed was insufficient to determine whether or not the spill was associated with hydraulic fracturing.
The 457 hydraulic fracturing-related spills in this analysis occurred in 11 states (Table 2) over six years.10 State data sources identified a total of 394 hydraulic fracturing-related spills, and industry sources identified 63 additional spills related to hydraulic fracturing. Data provided by industry
10 The reported number of hydraulic fracturing-related spills per year increased from approximately 27 spills in 2006 to 110 spills in 2011. The increase over this timeframe could have been related to an increase in hydraulic fracturing as well as changes in state reporting requirements and industry reporting trends.
9

Characterization of Hydraulic Fracturing-Related Spills May 2015
Figure 1. Percent of reviewed spills determined to be related and unrelated to hydraulic fracturing. State and industry data sources reported an estimated 36,000 spills between January 2006 and April 2012. Spills identified as related to hydraulic fracturing occurred on or near the well pad and were related to either the mixing or injection of hydraulic fracturing fluids or the management of flowback (i.e., fluids returned to the surface after hydraulic fracturing). Information available for roughly 33 percent of the approximately 36,000 spills was insufficient to determine whether or not the spill was associated with hydraulic fracturing; these spills are categorized as “unknown.”
Table 2. Number and percentage of hydraulic fracturing-related spills identified from state and industry data sources used in this study by state. Spills in West Virginia and North Dakota were identified only through industry-provided data.
State Number (Percent) of Hydraulic Fracturing-Related Spills
Colorado 174 (38%) Pennsylvania 87 (19%) Oklahoma 55 (12%) Arkansas 39 (9%) Texas 36 (8%) Louisiana 34 (7%) New Mexico 14 (3%) Wyoming 9 (2%) Utah 4 (1%) West Virginia 3 (1%) North Dakota 2 (0.4%) Total 457 (100%)
included hydraulic fracturing-related spills in two states: North Dakota (two spills) and West Virginia (three spills). Spills occurring in Colorado made up the largest proportion (38 percent) of spills included in Appendix B, with the most spills per county reported in Garfield County and Weld County. The data for Colorado do not necessarily indicate that this state had more hydraulic fracturing-related spills than other states. Rather, spill reports from the Colorado Oil and Gas
10
Characterization of Hydraulic Fracturing-Related Spills May 2015
Information System were the most detailed spill reports from among the state data sources used in this analysis and generally provided more of the information needed to determine whether a spill was related to hydraulic fracturing (Table 1). Because of the preponderance of Colorado data, the results presented below are more representative of hydraulic fracturing-related spills that were identified from the Colorado Oil and Gas Information System than of spills identified from other state and industry data sources.
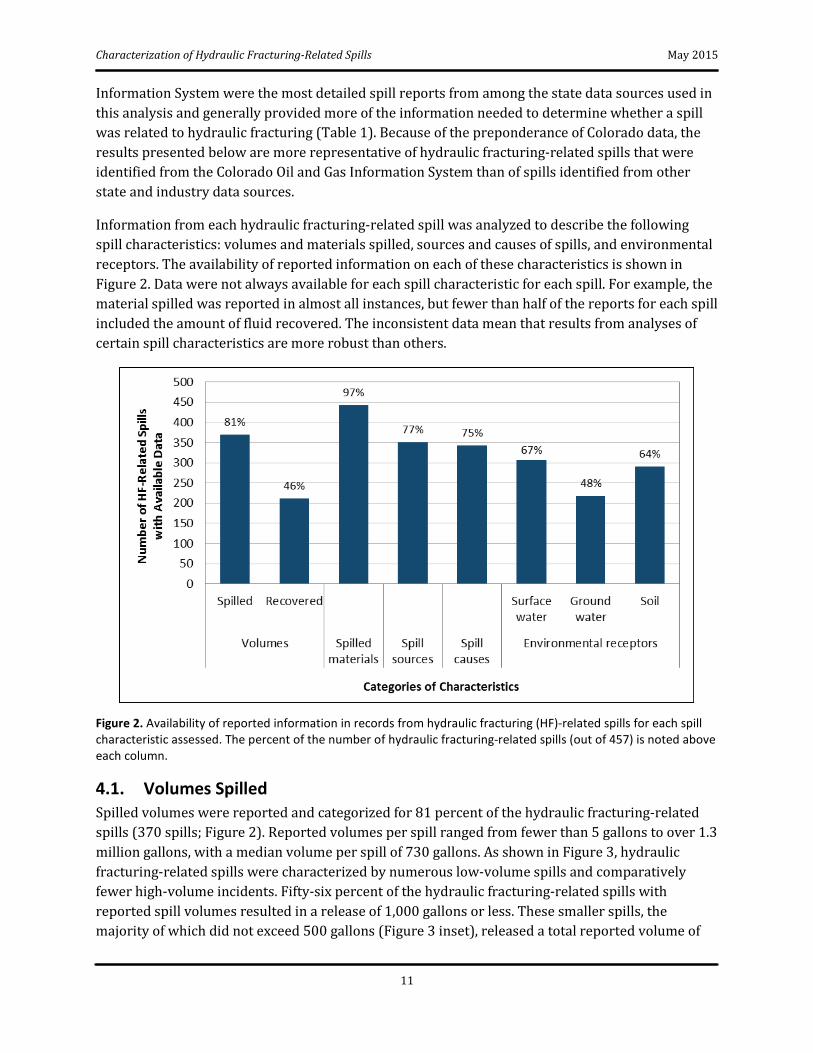
Information from each hydraulic fracturing-related spill was analyzed to describe the following spill characteristics: volumes and materials spilled, sources and causes of spills, and environmental receptors. The availability of reported information on each of these characteristics is shown in Figure 2. Data were not always available for each spill characteristic for each spill. For example, the material spilled was reported in almost all instances, but fewer than half of the reports for each spill included the amount of fluid recovered. The inconsistent data mean that results from analyses of certain spill characteristics are more robust than others.
Figure 2. Availability of reported information in records from hydraulic fracturing (HF)-related spills for each spill characteristic assessed. The percent of the number of hydraulic fracturing-related spills (out of 457) is noted above each column.
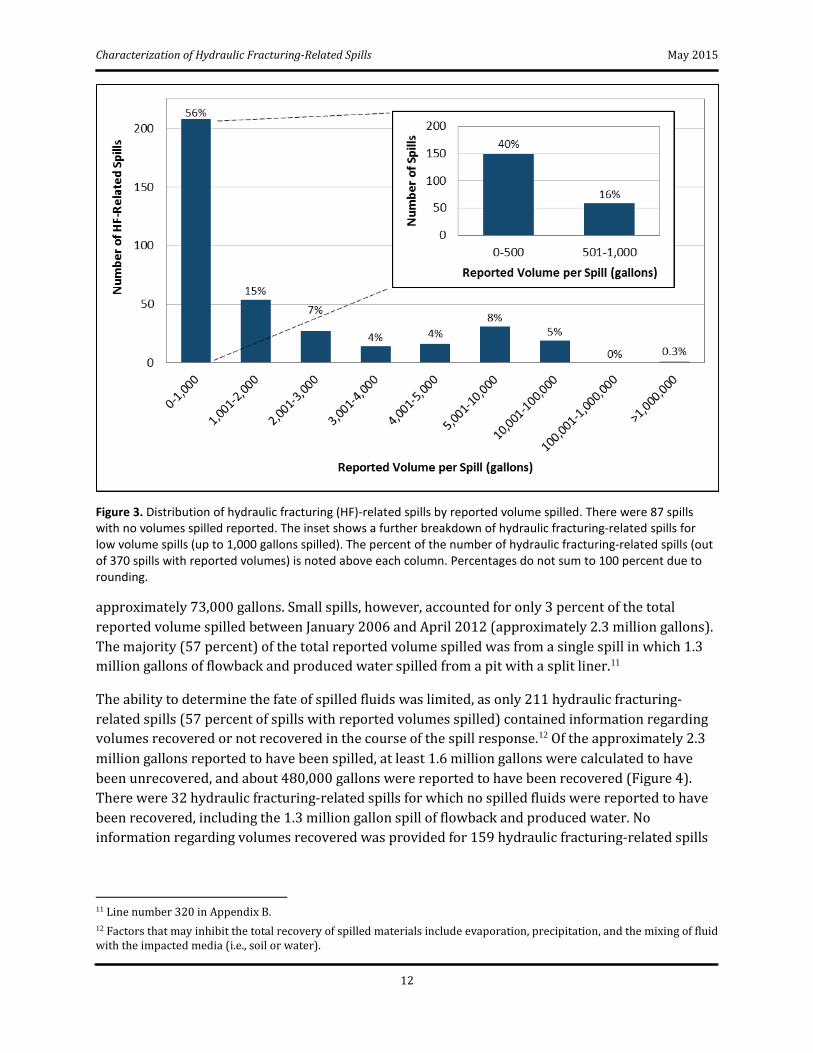
4.1. Volumes Spilled Spilled volumes were reported and categorized for 81 percent of the hydraulic fracturing-related spills (370 spills; Figure 2). Reported volumes per spill ranged from fewer than 5 gallons to over 1.3 million gallons, with a median volume per spill of 730 gallons. As shown in Figure 3, hydraulic fracturing-related spills were characterized by numerous low-volume spills and comparatively fewer high-volume incidents. Fifty-six percent of the hydraulic fracturing-related spills with reported spill volumes resulted in a release of 1,000 gallons or less. These smaller spills, the majority of which did not exceed 500 gallons (Figure 3 inset), released a total reported volume of
11
Characterization of Hydraulic Fracturing-Related Spills May 2015
Figure 3. Distribution of hydraulic fracturing (HF)-related spills by reported volume spilled. There were 87 spills with no volumes spilled reported. The inset shows a further breakdown of hydraulic fracturing-related spills for low volume spills (up to 1,000 gallons spilled). The percent of the number of hydraulic fracturing-related spills (out of 370 spills with reported volumes) is noted above each column. Percentages do not sum to 100 percent due to rounding.
approximately 73,000 gallons. Small spills, however, accounted for only 3 percent of the total reported volume spilled between January 2006 and April 2012 (approximately 2.3 million gallons). The majority (57 percent) of the total reported volume spilled was from a single spill in which 1.3 million gallons of flowback and produced water spilled from a pit with a split liner.11
The ability to determine the fate of spilled fluids was limited, as only 211 hydraulic fracturing-related spills (57 percent of spills with reported volumes spilled) contained information regarding volumes recovered or not recovered in the course of the spill response.12 Of the approximately 2.3 million gallons reported to have been spilled, at least 1.6 million gallons were calculated to have been unrecovered, and about 480,000 gallons were reported to have been recovered (Figure 4). There were 32 hydraulic fracturing-related spills for which no spilled fluids were reported to have been recovered, including the 1.3 million gallon spill of flowback and produced water. No information regarding volumes recovered was provided for 159 hydraulic fracturing-related spills
11 Line number 320 in Appendix B. 12 Factors that may inhibit the total recovery of spilled materials include evaporation, precipitation, and the mixing of fluid with the impacted media (i.e., soil or water).
12

Characterization of Hydraulic Fracturing-Related Spills May 2015
Figure 4. Percent distribution of fluid fate by total reported volume for hydraulic fracturing-related spills. Volumes spilled were reported for 370 hydraulic fracturing-related spills, and 211 spill records contained information on volumes recovered. “Unknown” volumes were determined from spill records in which the volume spilled was reported, but no information was included about volumes recovered. “Unrecovered” volumes were calculated from data provided in the spill records for volumes spilled and volumes recovered. In some cases, reported recovered volumes were larger than reported spilled volumes. Therefore, the sum of unrecovered, recovered, and unknown fluid fate volumes is greater than the total volume spilled.
Fluid Fate Total Reported
Volume (gallons) Unrecovered 1,600,000 Recovered 480,000 Unknown 250,000 Total Spilled 2,300,000
in which a spilled volume was reported. The fate of approximately 250,000 gallons from these spills without recovery information was therefore unknown.
4.2. Spilled Materials Materials spilled were identified and categorized for 97 percent of hydraulic fracturing-related spills (443 spills; Figure 2). The types of spilled materials reported in the state and industry data sources, along with definitions and examples, are shown in Table 3. Table 4 summarizes spilled materials by number of spills, total reported volume spilled, median reported volume per spill, and the 5th and 95th percentile reported volume per spill for each material type. The percent distribution of the number of hydraulic fracturing-related spills and the total reported volume spilled by material type are presented in Figure 5.
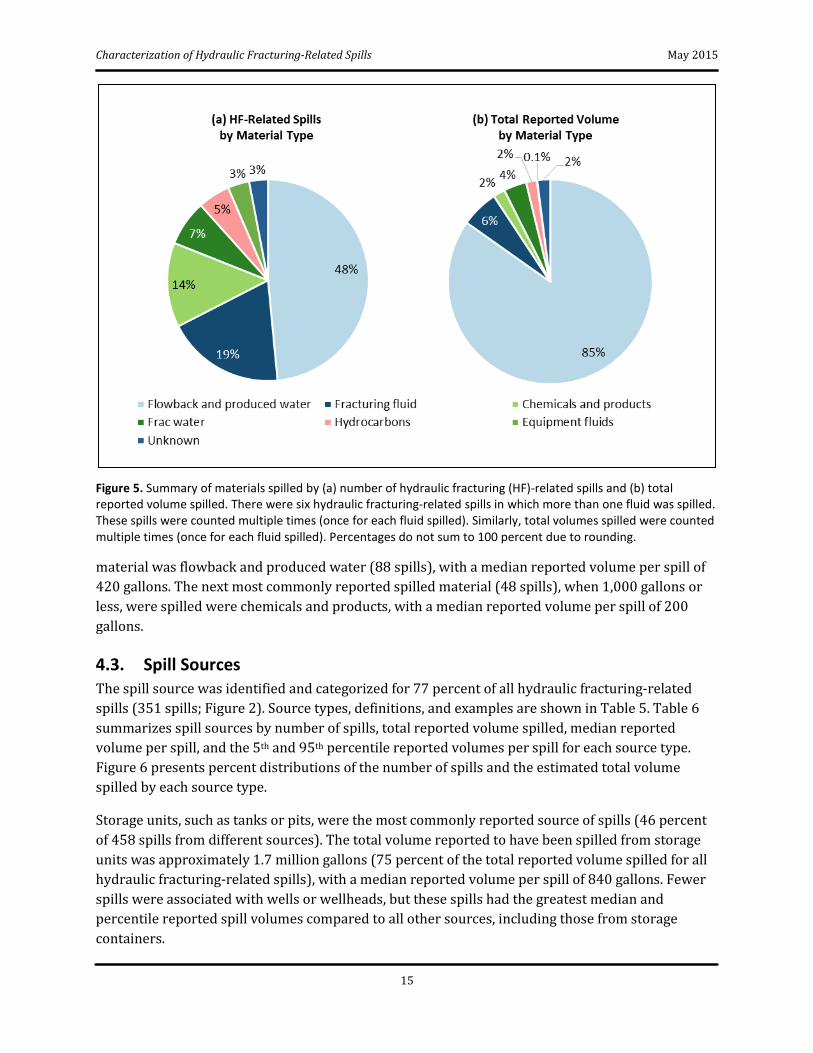
Table 4 and Figure 5 show that flowback and produced water was the most common type of fluid reported to have been spilled (48 percent of 464 spills of different materials). Flowback and produced water also accounted for the largest total volume of spilled material (85 percent), with approximately 2 million gallons reported to have been spilled. Much of the estimated total volume spilled of flowback and produced water was from 13 spills, each over 10,000 gallons and totaling approximately 1.7 million gallons. There were 88 reported spills of fracturing fluid, with a median reported volume per spill of 820 gallons and a total of approximately 140,000 gallons of fluid reported to have been spilled. The 34 spills of frac water involved some of the largest hydraulic fracturing-related spills, as evidenced by high median (1,800 gallons) and 95th percentile (11,000 gallons) reported volumes per spill.
13

Characterization of Hydraulic Fracturing-Related Spills May 2015
Table 3. Definitions and examples of spilled materials. Material Type Definition Examples Flowback and produced water
Fluids that return after the pressure applied during hydraulic fracturing is released
Flowback, flowback containing oil, produced water, produced water containing condensate, saltwater
Fracturing fluid Fluid injected downhole Frac sand, frac fluid (containing gel), frac fluid (containing WFR-55LA, WBK-143L, BIO5000), frac fluid with diesel* (containing HCl, clay, stabilizer, diesel, friction reducer), KCl water
Chemicals and products
On-site materials used in hydraulic fracturing fluids
Acid, KCl,† biocide (diluted), friction reducer, scale inhibitor, cross-linker (BC-200UC), WGA15, gel
Frac water§ Water used in hydraulic fracturing operations; may be recycled, treated, or untreated
Treated frac water, untreated frac water
Hydrocarbons Petroleum-related fluids released through hydraulic fracturing operations
Diesel, oil, petroleum, condensate, gas well liquid
Equipment fluids Fluids from on-site equipment involved in hydraulic fracturing activities
Antifreeze, hydraulic fluid, diesel
Unknown Unknown which fluid type was spilled; not reported
Unknown
* “Diesel” is included in both “fracturing fluid” and “equipment fluids” categories. “Frac fluid with diesel” was considered a fracturing fluid, whereas “diesel” was placed under equipment fluids if it was related to on-site equipment. † “KCl” is included in both “chemicals and products” and “fracturing fluid” categories. “KCl” was considered a chemical, whereas “KCl water” was considered a fracturing fluid. § Unlike fracturing fluid, frac water may not include individual chemicals and/or chemical products, whereas fracturingfluid is expected to contain individual chemicals and/or chemical products.
Table 4. Number of hydraulic fracturing related-spills, total reported volume spilled, and reported volume per spill by material type. The number of spills sums to 464, as six incidents reported multiple fluids spilled; each material type was counted as a separate spill.
Reported Volume per Spill (gallons)
Material Type Number of Spills
Total Reported Volume Spilled
(gallons)
5th Percentile Median 95th
Percentile
Flowback and produced water 225 2,000,000 40 990 14,000 Fracturing fluid 88 140,000 80 820 8,400 Chemicals and products 63 44,000 20 230 4,200 Frac water 34 85,000 350 1,800 11,000 Hydrocarbons 24 40,000 10 710 6,300 Equipment fluids 16 1,400 20 60 280 Unknown 14 48,000 210 1,500 17,000
The least commonly reported spilled materials were fluids from on-site equipment and hydrocarbons, such as diesel and petroleum. Equipment fluid spills were typically low-volume (all less than 1,000 gallons). Spills of hydrocarbons were larger and similar in magnitude to spills of chemicals and products, as shown by the median and percentile reported volumes per spill.
As shown in Figure 3, most hydraulic fracturing-related spills (56 percent) resulted in a release of 1,000 gallons or less. For spills of 1,000 gallons or less, the most commonly reported spilled
14
Characterization of Hydraulic Fracturing-Related Spills May 2015
Figure 5. Summary of materials spilled by (a) number of hydraulic fracturing (HF)-related spills and (b) total reported volume spilled. There were six hydraulic fracturing-related spills in which more than one fluid was spilled. These spills were counted multiple times (once for each fluid spilled). Similarly, total volumes spilled were counted multiple times (once for each fluid spilled). Percentages do not sum to 100 percent due to rounding.
material was flowback and produced water (88 spills), with a median reported volume per spill of 420 gallons. The next most commonly reported spilled material (48 spills), when 1,000 gallons or less, were spilled were chemicals and products, with a median reported volume per spill of 200 gallons.
4.3. Spill Sources The spill source was identified and categorized for 77 percent of all hydraulic fracturing-related spills (351 spills; Figure 2). Source types, definitions, and examples are shown in Table 5. Table 6 summarizes spill sources by number of spills, total reported volume spilled, median reported volume per spill, and the 5th and 95th percentile reported volumes per spill for each source type. Figure 6 presents percent distributions of the number of spills and the estimated total volume spilled by each source type.
Storage units, such as tanks or pits, were the most commonly reported source of spills (46 percent of 458 spills from different sources). The total volume reported to have been spilled from storage units was approximately 1.7 million gallons (75 percent of the total reported volume spilled for all hydraulic fracturing-related spills), with a median reported volume per spill of 840 gallons. Fewer spills were associated with wells or wellheads, but these spills had the greatest median and percentile reported spill volumes compared to all other sources, including those from storage containers.
15

Characterization of Hydraulic Fracturing-Related Spills May 2015
Table 5. Definitions and examples of spill sources. Source Type Definition Examples Storage Containers or structures that physically
hold fluids Pit, tank, tote, trailer
Equipment On-site machinery used in hydraulic fracturing operations
Blender, manifold, pump
Hose or line Connections that join on-site equipment and storage
Chemical transfer, flowback line, water transfer line, water transfer between pads
Well or wellhead Structural component of the well at the surface
Well, wellhead
Unknown Unknown sources; not reported Unknown, blank field
Table 6. Number of hydraulic fracturing-related spills, total reported volume spilled, and reported volume per spill by source type. The number of spills sums to 458, as one incident reported multiple spill sources; each source type was counted as a separate spill.
Reported Volume per Spill (gallons)
Source Type Number of Spills
Total Reported Volume Spilled
(gallons)
5th Percentile Median 95th
Percentile
Storage 210 1,700,000 80 840 8,400 Equipment 61 56,000 20 300 4,400 Hose or line 59 210,000 80 1,300 15,000 Well or wellhead 22 210,000 220 6,300 47,000 Unknown 106 100,000 7 420 7,100
Relatively small volume hydraulic fracturing-related spills (less than or equal to 1,000 gallons spilled) occurred most often (98 spills) from storage units, with a median reported volume per spill of 420 gallons. Note that containers (e.g., totes and tanks) often hold small volumes compared to pits, which limits the maximum volume of fluid that can be spilled. Pieces of equipment were the next most commonly reported source (47 spills) for small volume spills. The median reported volume per spill for relatively small volume equipment spills was 175 gallons.
4.4. Spill Causes The causes of hydraulic fracturing-related spills could be determined and categorized for 75 percent of the spills (343 spills; Figure 2). Definitions and examples of each cause type are provided in Table 7. Table 8 summarizes spill causes by number of spills, total reported volume spilled, median reported volume per spill, and 5th and 95th percentile reported volumes per spill for each cause type. Figure 7 presents the percent distribution of the number of spills and the total reported volume spilled by cause type for the 457 hydraulic fracturing-related spills.
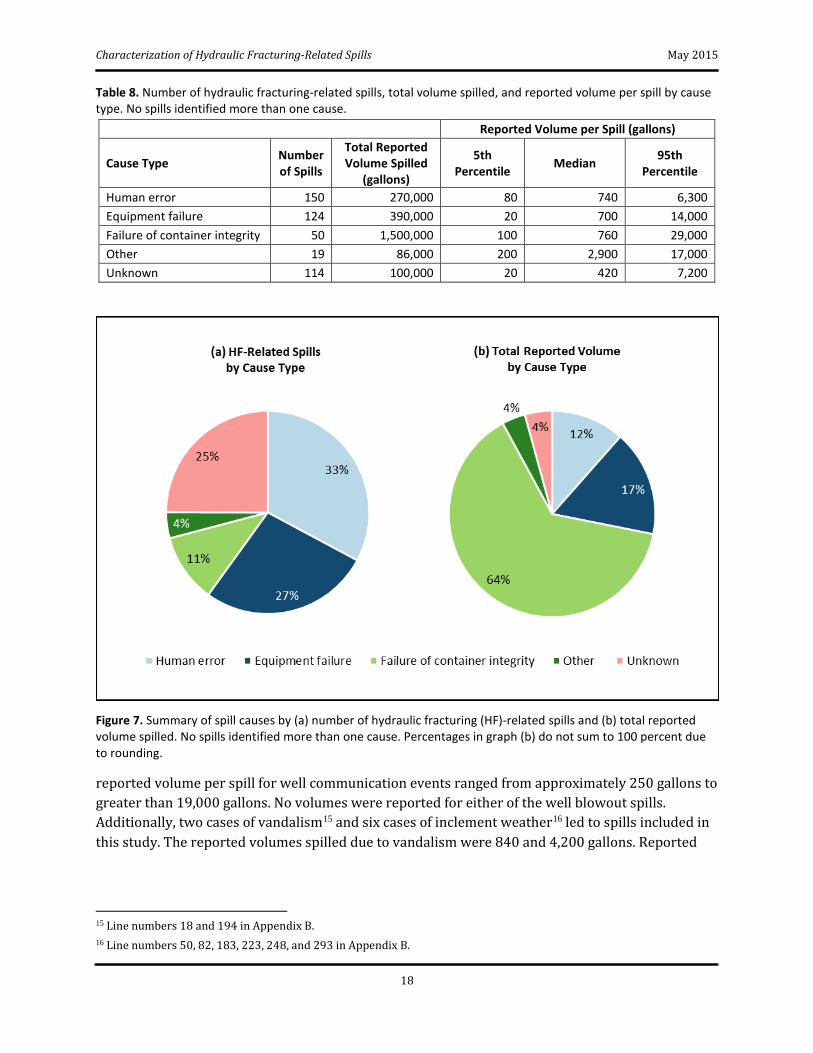
Among the spills for which the cause was reported, the most common causes were human error (33 percent of 457 spills) and equipment failure (27 percent). Spills caused by a failure of container integrity (e.g., holes or seal failures in storage units), which was the cause identified for 11 percent of spills, were generally associated with larger spill volumes. The total reported volume spilled for these spills was approximately 1.5 million gallons, compared to the combined total volume of approximately 660,000 gallons reported for spills caused by human error and equipment failure.
16

Characterization of Hydraulic Fracturing-Related Spills May 2015
Figure 6. Summary of spill sources by (a) number of hydraulic fracturing (HF)-related spills and (b) total reported volume spilled. There was one spill in which more than one source was identified. This instance was counted multiple times (once for each source). Similarly, the total volume spilled for this spill was counted multiple times (once for each source). Percentages in graph (b) do not sum to 100 percent due to rounding.
Table 7. Definitions and examples of spill causes. Cause Type Definition Examples Human error Human error as listed by the state or
determined to be the root spill cause Valve left open, miscommunication, failure to monitor or equalize tanks
Equipment failure Equipment failure as listed by the state or determined to be the root spill cause
Blowout preventer failure, corrosion or washout, valve failed
Failure of container integrity
Holes, leaks, and seal failures in storage units
Hole, leak, seal failure
Other Assorted causes of spills Blowout, weather, vandalism, well communication
Unknown Unknown or unspecified cause; not reported
Unknown, not specified, unanticipated flowback
Appendix B includes hydraulic fracturing-related spills that were caused by two well blowouts13 and ten well communication events,14 which were included in the “Other” or “Equipment failure” categories. Well blowouts and well communication events can both lead to high volume spills. The
13 Line numbers 326 and 339 in Appendix B. 14 Line numbers 163, 236, 265, 271, 286, 287, 375, 376, 377, and 380 in Appendix B.
17
Characterization of Hydraulic Fracturing-Related Spills May 2015
Table 8. Number of hydraulic fracturing-related spills, total volume spilled, and reported volume per spill by cause type. No spills identified more than one cause.
Reported Volume per Spill (gallons)
Cause Type Number of Spills
Total Reported Volume Spilled
(gallons)
5th Percentile Median 95th
Percentile
Human error 150 270,000 80 740 6,300 Equipment failure 124 390,000 20 700 14,000 Failure of container integrity 50 1,500,000 100 760 29,000 Other 19 86,000 200 2,900 17,000 Unknown 114 100,000 20 420 7,200
Figure 7. Summary of spill causes by (a) number of hydraulic fracturing (HF)-related spills and (b) total reported volume spilled. No spills identified more than one cause. Percentages in graph (b) do not sum to 100 percent due to rounding.
reported volume per spill for well communication events ranged from approximately 250 gallons to greater than 19,000 gallons. No volumes were reported for either of the well blowout spills. Additionally, two cases of vandalism15 and six cases of inclement weather16 led to spills included in this study. The reported volumes spilled due to vandalism were 840 and 4,200 gallons. Reported
15 Line numbers 18 and 194 in Appendix B. 16 Line numbers 50, 82, 183, 223, 248, and 293 in Appendix B.
18
Characterization of Hydraulic Fracturing-Related Spills May 2015
volumes spilled due to weather spills ranged from 60 to 16,000 gallons per spill; these spills were usually caused by freezing conditions that led to frozen valves and ruptured lines.
Small volume hydraulic fracturing-related spills (1,000 gallons or less of fluid released) were most commonly caused by human error (78 spills). The median reported volume per spill from human error was 420 gallons. Sixty-eight spills were caused by equipment failure, which was the second most frequent cause of small volume spills. The median reported volume per spill due to equipment failure was 270 gallons.
4.5. Environmental Receptors Environmental receptors are the environmental media reached by spilled fluids. Three types of environmental receptors were considered for this analysis: surface water, ground water, and soil. These environmental receptors are of particular interest when considering potential impacts to drinking water resources from hydraulic fracturing-related spills. Soil was included because spilled fluids may infiltrate soil and percolate into ground water (Bodvarsson et al., 2000; Schwarzenbach et al., 2002; US EPA, 1996). Surface and ground water resources could be currently used as drinking water resources or may provide drinking water in the future. The EPA did not determine whether any surface or ground water environmental receptors currently serve as drinking water resources.
Appendix B includes 411 spills (approximately 90 percent of the total number of hydraulic fracturing-related spills) for which information regarding whether or not the spilled fluid reached an environmental receptor was available. Information about whether or not spilled fluids reached any of these environmental receptors was not available for 46 spills. Figure 8 shows the number of hydraulic fracturing-related spills in which spilled fluids reached surface water, ground water, or soil. Also shown in Figure 8 is the number of times spilled fluids were reported as not reaching an environmental receptor or when it could not be determined if any environmental receptor was reached from the available data.
There were no spills in which spilled fluids were reported as not reaching any of the three environmental receptors. In 186 spills, spilled fluids were reported as not reaching surface or ground water. Of these 186 spills, spilled fluids were reported to have reached soil in 107 spills. It was unknown whether spilled fluids reached soil or were contained in the other 79 spills.
There were 300 hydraulic fracturing-related spills (approximately 65 percent of the total number of hydraulic fracturing-related spills) in which spilled fluids reached at least one environmental receptor; 24 of these reached multiple environmental receptors. Soil was the most commonly reported environmental receptor, with spilled fluids reaching soil in over half of all spills in Appendix B. The median reported volume per spill for these spills was 630 gallons (Table 9). Spilled fluids reached surface water in 32 hydraulic fracturing-related spills (approximately 7 percent of all hydraulic fracturing-related spills); the median reported volume per spill was 3,500 gallons. There was one spill in which spilled fluids reached ground water (0.2 percent of spills). The spill that
19

Characterization of Hydraulic Fracturing-Related Spills May 2015
Figure 8. Number of hydraulic fracturing (HF)-related spills in which spilled fluids reached (yes) or did not reach (no) surface water, ground water, or soil. “Unknown” refers to hydraulic fracturing related spills for which environmental receptors were specified as unknown or not were identified.
Table 9. Number of hydraulic fracturing-related spills, total reported volume spilled, and reported volume per spill by environmental receptor. There were 300 hydraulic fracturing-related spills that reached environmental receptors. Twenty-four of these 300 spills reached both soil and surface water receptors and were counted as having reached two separate receptors. Therefore, the number of receptors reached sums to 324. “NA” indicates “not applicable.”
Reported Volume per Spill (gallons)
Environmental Receptor Number of Spills
Total Reported Volume Spilled
(gallons)
5th Percentile Median 95th
Percentile
Soil 291 540,000 30 630 8,400 Surface water 32 200,000 90 3,500 45,000 Ground water 1 130 NA NA NA
reached ground water occurred when 130 gallons of flowback and produced water were released under a well pad due to an unknown cause.17
Data sources used for this study did not generally contain water quality monitoring results. Therefore, the EPA did not determine whether or how spilled fluids affected ground or surface water resources. Additionally, it may take a long time for spilled fluids to reach ground water (Bodvarsson et al., 2000; Glass et al., 2005). Some of the data sources in this study did not contain long-term monitoring information.
17 Line number 363 in Appendix B.
20

Characterization of Hydraulic Fracturing-Related Spills May 2015
5. Results: Containment and ResponseFluid containment and spill response affect the path of spilled fluids and are important to understand when assessing the potential for impacts to drinking water resources. Approximately 25 percent of the spill records associated with hydraulic fracturing-related spills included information on containment systems, while approximately 60 percent described response activities. This section summarizes containment and response activities intended to prevent impacts to drinking water resources once a spill has occurred.
5.1. Containment Containment systems are used to hold fluids or to stop the flow of spilled fluids. They can include primary, secondary, and emergency containment systems. Primary containment systems are the storage units, such as tanks or pits, in which fluids are intentionally kept. Pre-planned secondary containment systems, such as liners and berms, are installed before a spill occurs and are intended to contain spilled fluids until they can be cleaned up. Emergency containment systems are often temporary and are not in place before a spill occurs, but rather are implemented in response to a spill. The most common types of containment systems mentioned in the hydraulic fracturing-related spill records included pre-planned secondary or emergency systems such as berms, booms, dikes, liners, and pits.
Secondary containment systems surround primary containment systems and are generally intended to provide temporary containment of any spilled fluids until appropriate actions are taken to stop the spill and remove the fluid. Due to the limited information on pre-planned secondary containment in the hydraulic fracturing-related spill records, it was not possible to evaluate the extent to which the measures taken to contain spills were effective. In some cases, “effectiveness” appeared to be determined by whether the spilled fluid was contained on the site or within the pre-planned secondary containment unit. For example, a spill record from Pennsylvania noted that an unspecified volume of “frac fluid spilled before going downhole” and “no evidence of any fluid leaving containment was observed.”18 Another record from Wyoming was more specific: 1,260 gallons of produced water spilled around a tank and was contained in a berm. The spill record also noted that a “small portion soaked into [the] ground.”19 This indicated that the containment did not completely prevent spilled fluids from reaching an environmental receptor.
In at least two instances in Colorado, the pre-planned secondary containment systems appeared to be successful at both preventing fluid migration off-site and preventing spilled fluid from entering soil or water through the use of a liner. The first incident report, in 2010, described a tank overflow resulting in the release of 420 gallons of flowback fluid. The report stated:
18 Line number 360 in Appendix B. 19 Line number 388 in Appendix B.
21
Characterization of Hydraulic Fracturing-Related Spills May 2015
The entire release was contained within the lined containment cell the upright tanks are located in. None of the fluids were recovered because the lined containment, as it is constructed, allows any fluids to migrate back into the frac pit.20
A similar incident occurred in 2011. In this case, a tank overflow resulted in a release of 3,990 gallons of flowback fluid. The report for this case noted that:
The entire release was contained within the lined containment around the upright tanks. Due to the design of the secondary containment, the flowback water flowed back into the frac pit. No fluids migrated off the location.21
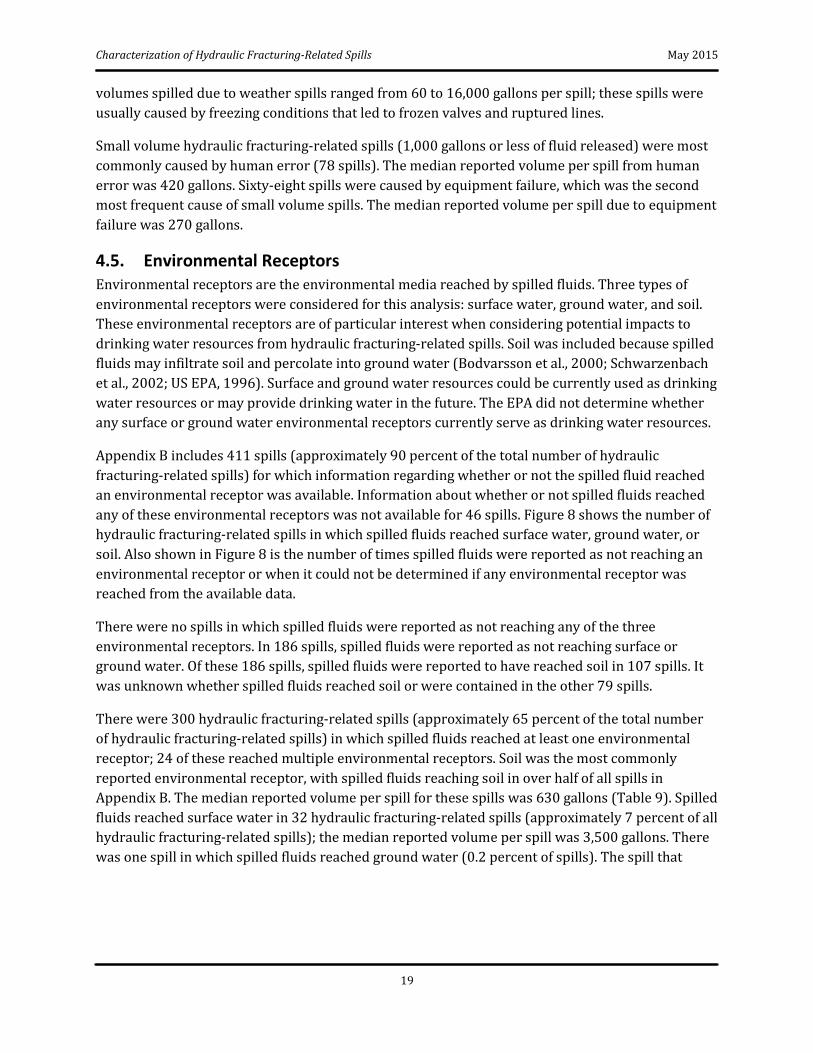
There were instances in which the hydraulic fracturing-related spill reports noted that the pre-planned secondary containment systems were breached. Breaches of berms and dikes were most commonly reported. Examples of these types of incidents are provided in Table 10. Leaks from pre-planned secondary containment systems were also reported. Causes of pre-planned secondary containment failures were generally not specified in the data sources used in this study.
Table 10. Examples of breaches of berms and dikes, as described in records from hydraulic fracturing-related spills.
Incident Description Reported Volume Spilled (gallons)
Line Number (Appendix B)
“…flowed out onto the frac pad and eventually breached the perimeter berm on the south side…”
11,130 81
“…tank overflowed during flowback operations, filled the bermed containment area, ran over the top of the berm and onto the pad…”
4,200 192
“…because of a weakness in the berm, some of the water flowed under the berm and onto a farmer’s field…”
1,470 165
“…the frac pit breached the berm and overflowed…”
1,050 170
“…the existing dirt retention dike behind the tanks was not consolidated dirt, large rocks are mixed in with the dirt. The water from the overflow channeled through the rocks…”
630 154
Several instances of emergency containment systems were described in the hydraulic fracturing-related spill records. Berm or dike construction and boom deployment were the most commonly reported types of emergency containment systems. Ditches or pits were also reported to have been dug in order to capture the spilled fluid. For example, a 2011 spill report from Colorado indicated that a “frac head failed on the wellhead during a frac operation, releasing approximately 200 barrels [8,400 gallons] of slick frac water.”22 The spilled fluid was reported to have been contained in emergency ditches and “did not migrate off-site.” In another instance in Colorado, 294 gallons of
20 Line number 90 in Appendix B. 21 Line number 57 in Appendix B. 22 Line number 75 in Appendix B.
22

Characterization of Hydraulic Fracturing-Related Spills May 2015
flowback and produced water leaked from a failed weld on a flowback tank.23 Consequently, “a dike and berm [were] constructed around [the flowback] tank” to contain the release. Similar to secondary containment reports, it was often unclear if emergency containments systems successfully prevented an impact to environmental media.
Absorbent materials were reported to have been used to contain spilled fluids. In general, it appears that absorbent materials were used when the estimated spill volumes were relatively small (10 to 200 gallons) and the spilled materials were individual chemicals or chemical products (e.g., scale inhibitors) rather than wastewater (i.e., flowback and produced water).
5.2. Response Approximately 60 percent of spill records for spills identified as having been associated with hydraulic fracturing contained information about company responses, state responses, or both. The summary below focuses on the actions taken to clean up spilled fluids, which ranged from immediate actions to stop the spill and contain the spilled fluid to longer term actions to remediate the affected area.
The immediate responses to spills were varied, as shown in Table 11. In general, it was reported that actions were first taken to stop the spill (e.g., shut down operations, adjust equipment, or drain a leaking container) and then to contain the spilled fluid (e.g., construct emergency containment). In some situations, spills were discovered after fluids had been released from the primary containment unit (e.g., a tank). In these cases, it appeared that the focus of the immediate response was to contain the spilled fluid, if possible.
After a spill is stopped and contained, the response shifts to remediation. For this analysis, “remediation” was considered to be any action taken in response to the spill, including removal of contaminated material. The most commonly reported remediation activity, mentioned in approximately half of the hydraulic fracturing-related spill records, was removal of either the spilled fluid and/or affected media (typically soil). In the spill records, removal included excavation of contaminated soil and use of absorbent material and/or vacuum trucks to remove the spilled fluid. Removal activities were found to occur in various combinations. For example, a spill of approximately 4,200 gallons of acid was cleaned up by first spreading soda ash to neutralize the acid and then removing the affected soil.24
In general, a higher percentage of fluid volume was recovered for spills of up to 1,000 gallons. At the other extreme, the report of the spill of 1.3 million gallons indicated that no fluids were recovered. In some cases the volume recovered exceeded the volume spilled, because the spilled fluid mixed with water or soil due to precipitation spills (i.e., rain or snow).
23 Line number 49 in Appendix B. 24 Line number 258 in Appendix B.
23
Characterization of Hydraulic Fracturing-Related Spills May 2015
Table 11. Examples of immediate responses used to stop spills or contain spilled fluids, as described in records from hydraulic fracturing-related spills. Responses were often found to be used in combination (e.g., shutdown operation and construct emergency containment).
Other remediation activities noted in the spill reports included flushing the affected area with water25 and neutralizing the spilled material. In some cases, the spill records referred to general “remediation” and did not provide additional details on specific actions taken. In two cases, the spill reports specifically indicated that no remediation activities were needed or occurred.26
6. DiscussionThe data sources used in this study contained over 36,000 spills. Spill records from an estimated 12,000 spills (33 percent of the total number of spills reviewed) contained insufficient information to determine whether the spill was related to hydraulic fracturing. From the remaining spills, the EPA identified an estimated 24,000 spills (66 percent of the total number of spills reviewed) as not related to hydraulic fracturing and 457 spills (approximately 1 percent) as related to hydraulic fracturing. The 457 hydraulic fracturing-related spills occurred in 11 different states over six years (January 2006 and April 2012).
Hydraulic fracturing-related spills identified in this study (Appendix B) were characterized by numerous low volume spills (1,000 gallons or less released) and relatively few high volume spills (20,000 gallons or more). A similar spill volume distribution was reported by Fisher and Sublette (2005) after examining the Oklahoma Corporation Commission Complaint Database for the years 1993 to 2005. Fisher and Sublette specifically looked at oil and saltwater environmental releases
25 The spill reports did not include information on the fate of the rinsate. 26 Line numbers 255 and 291 in Appendix B.
Immediate Company Response Examples Line Number
(see Appendix B)
Adjust equipment
“…fracing personnel immediately shut the valves to any tanks which were open to the manifold, thus preventing any further fluid loss through the open end of the manifold…”
186
“…the 2 source tanks were isolated by closing valves…” 247 “…flow directed into another tank…” 307
Construct emergency containment
“…booms and earthen berms were constructed around spill area…”
292
“…diked the spill area…” 458 “…pads and trenching were used to contain the spill…” 451
Drain leaking container or pit
“…tank was evacuated of any remaining fluid…” 184 “…leaking tank was immediately drained of water…” 231 “…8,700 barrels [365,400 gallons] were drained from the pit within 2 hours…”
276
Shutdown operations “…when the overflowing tanks were discovered, flowback personnel on the […] pad immediately halted flowback operations…”
208
“…the fracing operation was immediately shut down…” 204 “…shut frac down; shut in well; blended pressure off…” 245
24

Characterization of Hydraulic Fracturing-Related Spills May 2015
during oil and gas operations and found that the spilled fluid volumes were predominantly below 500 gallons for oil spills and 1,700 gallons for saltwater spills, with few releases exceeding 21,000 gallons. A recent study of spills reported to the Colorado Oil and Gas Conservation Commission found that the most common spill volume was between 462 and 2,100 gallons (11 to 55 barrels), followed by spills between 84 and 420 gallons (2 to 10 barrels) (Colorado Department of Natural Resources, 2014).
This report describes hydraulic fracturing-related spills in terms of the following characteristics: volumes and materials spilled, sources and causes of spills, and environmental receptors. As discussed below, combinations of spill characteristics (e.g., materials spilled and source) can be used to identify common spill scenarios.
Among the entire dataset of 457 hydraulic fracturing-related spills, the most common spill scenario found was spills of flowback and produced water due to human error (19 percent), with a median reported volume per spill of 1,000 gallons. Fourteen percent of all spills were of flowback and produced water due to human error at storage units, with a median reported volume per spill of 840 gallons. An example of this spill scenario is the 8,400 gallons of flowback reported to have spilled when a valve on a flowback tank was accidentally left open.27
Spill records from 370 hydraulic fracturing-related spills contained information on volumes of fluid spilled. Fifty-six percent of these spills reported spilled volumes of 1,000 gallons or less, which suggests that most reported hydraulic fracturing-related spills were relatively low volume. Spill scenarios identified for these low-volume spills were similar to spill scenarios observed for the entire dataset. Eighteen percent of low-volume spills were spills of flowback and produced water due to human error, with a median reported volume per spill of 460 gallons. Fourteen percent of low-volume spills were spills of flowback and produced water due to human error at storage units, with an estimated median reported volume per spill of 550 gallons.
Large volume spills from well blowouts and well communication events have recently been reported by the media (Atkin, 2014; Vaidyanathan, 2013). Similar types of spills were identified as part of this study. For example, a spill in Oklahoma occurred when “fracing story #5 communicated with story #2,” leading to over 13,000 gallons of oil being released.28 In another instance, failure of blowout prevention equipment caused a well in Pennsylvania to discharge natural gas and flowback for 18 hours before it was contained.29 These types of spills represented a small proportion of the hydraulic fracturing-related spills in Appendix B: two spills were caused by well blowouts30 and ten spills were caused by well communication.31
Large and small volumes of spilled fluids were reported to have reached at least one environmental receptor (i.e., surface water, ground water, or soil) in 300 spills. In 24 instances, spilled fluids were reported to have reached more than one environmental receptor. Soil was the most predominant
27 Line number 390 in Appendix B. 28 Line number 286 in Appendix B. 29 Line number 326 in Appendix B. 30 Line numbers 326 and 339 in Appendix B. 31 Line numbers 163, 236, 265, 271, 286, 287, 375, 376, 377, and 380 in Appendix B.
25

Characterization of Hydraulic Fracturing-Related Spills May 2015
environmental receptor (291 instances), with a median reported volume per spill of 630 gallons. Thirty-two instances of spilled fluids reaching surface water (median reported volume per spill 3,500 gallons) and one instance of spilled fluids reaching ground water (130 gallons) were identified.
The extent to which spilled fluids affected the geochemistry and ecology of surface or ground water systems was not addressed in this analysis. Effects to surface and ground water resources depend on the site conditions, environmental conditions, chemical properties, and the volume of spilled fluids (Schwarzenbach et al., 2002). For example, a small volume spill of an environmentally harmful chemical into a small stream may have a more serious impact on the water resource than a large volume spill of an environmentally benign chemical. Additionally, spill containment and response efforts can affect the path of spilled fluids and are important to understand when determining the potential for spilled fluids to affect surface and ground water resources.
6.1. Study Limitations The objective of this study was to characterize hydraulic fracturing-related spills that may reach surface or ground water resources using spill reports obtained from selected state and industry data sources. Although spill data were obtained from nine states that are among the top oil and gas producing states in the country (US Energy Information Administration, 2012, 2014), similar data from other oil and gas producing states were not included.
The 457 spills used to characterize hydraulic fracturing-related spills were likely a subset of the total number of hydraulic fracturing-related spills that could have been identified from the state and industry data sources. State and federal reporting requirements determine which spills, and what information about each spill, are recorded in state data sources. A review of the 63 hydraulic fracturing-related spills recorded in industry data sources, but not found in state data sources, offered insights into why some hydraulic fracturing-related spills may not have been recorded in state data sources. In some instances, it appeared that the spill volume or spilled material may not have met the state reporting requirements in place at the time of the spill. Consequently, some hydraulic fracturing-related spills may not have been included in the state data sources. In the case of industry data sources, the EPA did not evaluate company practices or policies with respect to the documentation of hydraulic fracturing-related spills.
Additionally, some reported spills may not have been identified as related to hydraulic fracturing due to insufficient information in the data sources. Incident descriptions, which were often used in this study to identify hydraulic fracturing-related spills, varied in detail from state to state, and within states from incident to incident. There were also inconsistencies in terminology among incident descriptions, making it difficult to distinguish hydraulic fracturing-related spills from spills related to other oil and gas activities. Missing or inconsistent information in some data sources likely led to spills not being identified as related to hydraulic fracturing (Commonwealth of Pennsylvania, 2014).
The quantitative characterization of hydraulic fracturing-related spills presented in Section 4 may have been different if more hydraulic fracturing-related spills could have been identified from the data sources used in this study.
26

Characterization of Hydraulic Fracturing-Related Spills May 2015
7. ConclusionsThis report presents the results of a broad review of state and industry spill data from 457 hydraulic fracturing-related spills. Data from these spills were used to characterize volumes and materials spilled, spill sources and causes, and environmental receptors. There were several key findings. Spills related to hydraulic fracturing were most often characterized by numerous, low volume events (up to 1,000 gallons) and relatively few high volume events (greater than 20,000 gallons). The most common material spilled was flowback and produced water, and the most common source of spills was storage units. More spills were caused by human error than any other cause. Over half of the spills associated with hydraulic fracturing reached an environmental receptor, with 33 instances of spilled fluids reaching surface or ground water resources. These results, as well as other information on spill characteristics and containment and response activities, provide important insights into the nature of hydraulic fracturing-related spills in several key states with hydraulic fracturing.
27
Characterization of Hydraulic Fracturing-Related Spills May 2015
References Alley, B., Beebe, A., Rodgers, J., and Castle, J.W. 2011. Chemical and Physical Characterization of Produced Waters from Conventional and Unconventional Fossil Fuel Resources. Chemosphere 85:74-82.
Arkansas Department of Environmental Quality (ADEQ). 2012. Complaints and Inspections Database. Available at http://www.adeq.state.ar.us/home/pdssql/complaints_inspections.aspx. Accessed December 7, 2012.
Arthur, J., Bohm, B., Coughlin, B.J., Layne, M., and Cornue, D. 2009. Evaluating the Environmental Implications of Hydraulic Fracturing in Shale Gas Reservoirs. SPE Americas Environmental and Safety Conference, San Antonio, Texas, March 23-25, 2009. Society of Petroleum Engineers.
Atkin, E. 2014. Fracking Well Blowout Causes Oil and Chemical Wastewater Spill in North Dakota. Climate Progress, February 18, 2014. Available at http://thinkprogress.org/climate/2014/02/17/ 3299221/north-dakota-blowout/. Accessed May 21, 2014.
Barbot, E., Vidic, N.S., Gregory, K.B., and Vidic, R.D. 2013. Spatial and Temporal Correlation of Water Quality Parameters of Produced Waters from Devonian-Age Shale Following Hydraulic Fracturing. Environmental Science & Technology 47:2562-2569.
Blauch, M.E., Myers, R.R., Moore, T.R., and Lipinski, B.A. 2009. Marcellus Shale Post-Frac Flowback Waters: Where is All the Salt Coming From and What are the Implications? SPE Eastern Regional Meeting, Charleston, West Virginia, September 23-25, 2009. Society of Petroleum Engineers.
Bodvarsson, G., Finsterle, S., Liu, H.H., Oldenburg, C.M., Pruess, K., Sonnenthal, E., and Wu, Y.-S. 2000. Flow and Transport Modeling of the Vadose Zone. Chapter 5. In Looney, B.B., and Falta, R.W., editors, Vadose Zone: Science and Technology Solutions. Battelle Press, Columbus, Ohio.
Chapman, E.C., Capo, R.C., Stewart, B.W., Kirby, C.S., Hammack, R.W., Schroeder, K.T., and Edenborn, H.M. 2012. Geochemical and Strontium Isotope Characterization of Produced Waters from Marcellus Shale Natural Gas Extraction. Environmental Science & Technology 46:3545-3553.
Colorado Department of Natural Resources, Oil and Gas Conservation Commission. 2014. Risk-Based Inspections: Strategies to Address Environmental Risk Associated with Oil and Gas Operations. Colorado Oil and Gas Conservation Commission. Publication number: OGCC-2014-PROJECT #7948 pages.
Colorado Oil and Gas Conservation Commission (COGCC). 2012. Colorado Oil and Gas Information System. Available at http://cogcc.state.co.us/data.html#/cogis. Accessed May 24, 2012.
Commonwealth of Pennsylvania, Department of the Auditor General. 2014. DEP's Performance in Monitoring Potential Impacts to Water Quality from Shale Gas Development, 2009-2012.
Fisher, J.B., and Sublette, K.L. 2005. Environmental Releases from Exploration and Production Operations in Oklahoma: Type, Volume, Causes, and Prevention. Environmental Geosciences 12:89-99.
Glass, R.J., Brainard, J.R., and Jim Yeh, T.-C. 2005. Infiltration in Unsaturated Layered Fluvial Deposits at Rio Bravo: Macroscopic Anistropy and Heterogeneous Transport. Vadose Zone Journal 4:22-31.
28
Characterization of Hydraulic Fracturing-Related Spills May 2015
Gregory, K.B., Vidic, R.D., and Dzombak, D.A. 2011. Water Management Challenges Associated with the Production of Shale Gas by Hydraulic Fracturing. Elements 7:181-186.
Gross, S.A., Avens, H.J., Banducci, A.M., Sahmel, J., Panko, J.M., and Tvermoes, B.E. 2013. Analysis of BTEX Groundwater Concentrations from Surface Spills Associated with Hydraulic Fracturing Operations. Journal of the Air and Waste Management Association 63:424-432.
Ground Water Protection Council (GWPC). 2009. State Oil and Natural Gas Regulations Designed to Protect Water Resources. Ground Water Protection Council for US Department of Energy, National Energy Technology Laboratory. Available at http://www.gwpc.org/sites/default/files/ state_oil_and_gas_regulations_designed_to_protect_water_resources_0.pdf. Accessed September 16, 2014.
GWPC and ALL Consulting. 2009. Modern Shale Gas Development in the United States: A Primer. Ground Water Protection Council and ALL Consulting for US Department of Energy. Available at http://energy.gov/fe/downloads/modern-shale-gas-development-united-states-primer. Accessed June 18, 2014.
Lee, D., Herman, J., Elsworth, D., Kim, H., and Lee, H. 2011. A Critical Evaluation of Unconventional Gas Recovery from the Marcellus Shale, Northeastern United States. K S C E Journal of Civil Engineering 15:67-687.
Louisiana Department of Environmental Quality (LDEQ). 2013. Personal communication, M. Molieri. January 3, 2013.
Malone, M., and Ely, J.W. 2007. Execution of Hydraulic Fracturing Treatments. Chapter 9. In Economides, M.J., and Martin, T., editors, Modern Fracturing: Enhancing Natural Gas Production. Energy Tribune Publishing, Inc., Houston, Texas.
Neff, J., Lee, K., and DeBlois, E.M. 2011. Produced Water: Overview of Composition, Fates, and Effects. In Lee, K., and Neff, J., editors, Produced Water: Environmental Risks and Advances in Mitigation Technologies. Springer, Duxbury, MA.
New Mexico Energy, Minerals, and Natural Resources Department (NMEMNRD). 2012. Oil Conservation Division Permitting, Spill Search. Available at https://wwwapps.emnrd.state.nm.us/ ocd/ocdpermitting//Data/Incidents/Spills.aspx. Accessed May 17, 2012.
New York State Department of Environmental Conservation. 2011. Supplemental Generic Environmental Impact Statement on the Oil, Gas, and Solution Mining Regulatory Program (revised draft): Well Permit Issuance for Horizontal Drilling and High-Volume Hydraulic Fracturing to Develop the Marcellus Shale and Other Low-Permeability Gas Reservoirs. Available at http://www.dec.ny.gov/energy/75370.html. Accessed July 30, 2014.
Oklahoma Corporation Commission (OCC). 2013. Personal communication, Baker, T. April 11, 2013.
Olmstead, S.M., Muehlenbachs, L.A., Shih, J.-S., Chu, Z., and Krupnick, A.J. 2013. Shale Gas Development Impacts on Surface Water Quality in Pennsylvania. Proceedings of the National Academy of Sciences 110:4962-4967.
Orem, W.H., Tatu, C.A., Lerch, H.E., Rice, C.A., Bartos, T.T., Bates, A.L., Tewalt, S., and Corum, M.D. 2007. Organic Compounds in Produced Waters from Coalbed Natural Gas Wells in the Powder River Basin, Wyoming, USA. Applied Geochemistry 22:2240-2256.
29
Characterization of Hydraulic Fracturing-Related Spills May 2015
Papoulias, D.M., and Velasco, A.L. 2013. Histopathological Analysis of Fish from Acorn Fork Creek, Kentucky, Exposed to Hydraulic Fracturing Fluid Releases. Southeastern Naturalist 12:92-111.
Pennsylvania Department of Environmental Protection (PADEP). 2012. Oil and Gas Compliance Report Database. Available at http://www.depreportingservices.state.pa.us/ReportServer/Pages/ ReportViewer.aspx?/Oil_Gas/OG_Compliance. Accessed April 20, 2012.
Rowan, E.L., Engle, M.A., Kirby, C.S., Kraemer, T.F. 2011. Radium Content of Oil- and Gas-Field Produced Waters in the Northern Appalachian Basin (USA)—Summary and Discussion of Data: US Geological Survey Scientific Investigations Report. Available at http://pubs.usgs.gov/sir/2011/ 5135/pdf/sir2011-5135.pdf. Accessed May 21, 2014.
Rozell, D.J., and Reaven, S.J. 2012. Water Pollution Risk Associated with Natural Gas Extraction from the Marcellus Shale. Risk Analysis 32:1382-1393.
Schwarzenbach, R.P., Gschwend, P.M., and Imboden, D.M. 2002. Environmental Organic Chemistry. 2nd edition. John Wiley & Sons, Hobeken, New Jersey.
Sirivedhin, T., and Dallbauman, L. 2004. Organic Matrix in Produced Water from the Osage-Skiatook Petroleum Environmental Research Site, Osage County, Oklahoma. Chemosphere 57:463-469.
Soeder, D.J. 2010. The Marcellus Shale: Resources and Reservations. Eos 91:277-278.
Stringfellow, W.T., Domen, J.K., Camarillo, M.K., Sandelin, W.L., and Borglin, S. 2014. Physical, Chemical, and Biological Characteristics of Compounds used in Hydraulic Fracturing. Journal of Hazardous Materials 275:37-54.
Strong, L.C., Gould, T., Kasinkas, L., Sadowsky, M.J., Aksan, A., and Wackett, L.P. 2014. Biodegradation in Waters from Hydraulic Fracturing: Chemistry, Microbiology, and Engineering. Journal of Environmental Engineering 140:B4013001.
Texas Railroad Commission (TRC). 2013. Personal communication, Pope, P. July 8, 2013.
US Energy Information Administration. 2012. Rankings: Natural Gas Marketed Production, 2012. Available at http://www.eia.gov/state/rankings/?sid=US#/series/47. Accessed July 30, 2014.
US Energy Information Administration. 2014. Rankings: Crude Oil Production, April 2014. Available at http://www.eia.gov/state/rankings/?sid=US#/series/46. Accessed July 30, 2014.
US Environmental Protection Agency (US EPA). 1996. Soil Screening Guidance: Technical Background Document. Available at http://www.epa.gov/superfund/health/conmedia/ soil/toc.htm. Accessed September 16, 2014.
US EPA. 2004. Evaluation of Impacts to Underground Sources of Drinking Water by Hydraulic Fracturing of Coalbed Methane Reservoirs Study. EPA/816/R-04/003. Available at http://water.epa.gov/type/groundwater/uic/class2/hydraulicfracturing/ wells_coalbedmethanestudy.cfm. Accessed July 30, 2014.
US EPA. 2010. Information Request Letter Sent to Nine Hydraulic Fracturing Service Companies. Available at http://www2.epa.gov/sites/production/files/documents/ september_2010_request_letter.pdf. Accessed May 21, 2014.
30

Characterization of Hydraulic Fracturing-Related Spills May 2015
US EPA. 2011a. Plan to Study the Potential Impacts of Hydraulic Fracturing on Drinking Water Resources. EPA/600/R-11/122. Available at http://www2.epa.gov/sites/production/files/ documents/hf_study_plan_110211_final_508.pdf. Accessed July 30, 2014.
US EPA. 2011b. Proceedings of the Technical Workshops for the Hydraulic Fracturing Study: Water Resources Management. EPA/600/R-11/048. Available at http://www2.epa.gov/sites/production/ files/documents/HF_Workshop_4_Proceedings_FINAL_508.pdf. Accessed September 16, 2014.
US EPA. 2011c. Information Request Letter Sent to Nine Oil and Gas Operators. Available at http://www2.epa.gov/sites/production/files/documents/August_2011_request_letter.pdf. Accessed May 21, 2014.
US EPA. 2012. Study of the Potential Impacts of Hydraulic Fracturing on Drinking Water Resources: Progress Report. EPA 601/R-12/011. Available at http://www2.epa.gov/hfstudy/study-potential-impacts-hydraulic-fracturing-drinking-water-resources-progress-report-0. Accessed May 21, 2014.
US EPA. 2013. Quality Assurance Project Plan for Hydraulic Fracturing Surface Spills Data Analysis. Available at http://www2.epa.gov/sites/production/files/documents/hf-spills-analysis-qapp.pdf. Accessed May 21, 2014.
US EPA. 2015. Analysis of Hydraulic Fracturing Fluid Data from the FracFocus Chemical Disclosure Registry 1.0. EPA/601/R-14/003. Available at http://www2.epa.gov/hfstudy/epa-analysis-fracfocus-1-data. Accessed April 8, 2015.
US Government Accountability Office. 2014. Oil and Gas: Updated Guidance, Increased Coordination, and Comprehensive Data Could Improve BLM's Management and Oversight. Available at http://www.gao.gov/products/GAO-14-238. Accessed June 18, 2014.
Utah Department of Environmental Quality (UDEQ). 2013. Personal communication, Zucker, M. July 2, 2013.
Vaidyanathan, G. 2013. Hydraulic Fracturing: When Two Wells Meet, Spills Can Often Follow. EnergyWire, August 5, 2013. Available at http://www.eenews.net/energywire/stories/ 1059985587. Accessed May 21, 2014.
Vengosh, A., Jackson, R.B., Warner, N., Darrah, T.H., and Kondash, A. 2014. A Critical Review of the Risks to Water Resources from Unconventional Shale Gas Development and Hydraulic Fracturing in the United States. Environmental Science & Technology 48:8334-8348.
Vidic, R.D., Brantley, S.L., Vandenbossche, J.M., Yoxtheimer, D., and Abad, J.D. 2013. Impact of Shale Gas Development on Regional Water Quality. Science 340:1235009-1-9.
Wyoming Oil and Gas Conservation Commission (WOGCC). 2012. Personal communication, Kropatsch, T. December 21, 2012.
31
Characterization of Hydraulic Fracturing-Related Spills May 2015
Appendix A: Standardization of Spill Characteristics Data on spills in each data source were recorded in a different way and provided slightly different information (Table 1). Therefore, these data were standardized prior to analysis. Information regarding the identification of hydraulic fracturing-related spills and the standardization of volumes, materials spilled, sources, causes, and environmental receptors (i.e., the environmental media reached by a spill, such as surface water, ground water, and soil) is provided in this appendix. Appendix B contains the standardized spill table.
As shown in Table 1, state data sources often contained information in specific data fields (e.g., volume spilled and material spilled). The state data sources also included incident descriptions that provided additional information about the spill. When available, data in specific data fields were used to develop Appendix B. If a specific data field was not available in the state data source or was not populated, relevant information from the incident description was used to develop Appendix B.
A.1. Volumes Depending on the data source, volumes were reported for the amount spilled, amount recovered, and amount lost; all volumes were converted to gallons. In instances where two different volumes were reported (e.g., if a state data source and an industry data source reported different volumes for the same spill), the volume contained in the more detailed spill report was chosen. Table A1 summarizes the categorization of volumes.
Table A1. Categorization method for reported volumes of spilled materials. Volume Category Definition Any numerical value Discrete volume (e.g., 5 gallons)
Volume range (e.g., 5-10 gallons) < or > discrete volume (e.g., <10 gallons) Split volumes (e.g., 5 gallons flowback and 10 gallons HCl)
Unknown No volumes reported Quantitative volume not specified “Unknown” in original database
When provided with a volume range, the mean was calculated to use as a discrete number for the volume spilled (e.g., a 10-20 gallon spill was treated as a 15 gallon spill). When a volume greater than or less than a discrete number was indicated, the number itself was used as the spill volume for analysis (e.g., reported volumes of >5 gallons or <5 gallons were both treated as 5 gallons).
As described in Section 3.3, spilled volumes should be considered to be estimates. Recovered volumes should similarly be considered estimates. Spilled volumes and recovered volumes were used to calculate the net loss of spilled material. Some spill reports indicated that the volume recovered exceeded the volume spilled due to precipitation or mixing spills. In these cases, the net loss was assumed to be zero gallons.
32

Characterization of Hydraulic Fracturing-Related Spills May 2015
A.2. Spilled Materials Spilled materials were assigned to the broad categories listed in Table 3. Some materials identified in the spill reports were not unique to hydraulic fracturing (e.g., produced water). In these cases, spills were only added to Appendix B if other hydraulic fracturing-specific terminology (e.g., frac, hydraulic fracturing) was identified in the spill report.
A.3. Spill Sources Spill sources were assigned to the broad categories listed in Table 5 based on where spilled fluids originated. In general, spills must have occurred on a well pad during the hydraulic fracturing treatment or during flowback to be included in Appendix B.
A.4. Spill Causes Spill causes were assigned to the broad categories listed in Table 7.
A.5. Environmental Receptors Environmental receptors included soil, surface water, and ground water. Table A2 summarizes the categories developed for this analysis and their descriptions. A spill could be assigned to more than one category if it reached multiple environmental receptors.
Table A2. Categorization method for environmental receptors. Category Description Surface Water Surface water (e.g., creek, lake, pond, river, wetland) Ground Water Spill report specifically indicated ground water was
reached Soil References to soil (e.g., crops, ditch, forest, pasture,
ground, vegetation) Unknown Unspecified whether fluids reached an environmental
receptor
When spilled materials were reported to have reached the well pad, an “unknown” environmental receptor was assigned, because it was often unclear whether the well pad was lined or not. A lined well pad may have prevented fluids from reaching soil, but an unlined well pad may not have prevented fluids from leaching into soil and possibly ground water. Additionally, secondary containment measures did not exclude the possibility of fluids reaching environmental receptors, and in cases where the secondary containment was earthen, soil was identified as the environmental receptor.
When surface water was reported as the environmental receptor, the specific type of surface water body (e.g., stream, river, wetland, pond) was identified, if sufficient information was provided. Dry ditches and drainage were not considered water bodies, because they were constructed for erosion and sediment control during site development. Standing water, or water collected in on-site pools, was considered a type of surface water receptor, because spilled materials mixed with these standing waters required site removal and/or treatment comparable to other surface water receptors.
33

Characterization of Hydraulic Fracturing-Related Spills May 2015
Appendix B: Hydraulic Fracturing-Related Spills Table [See accompanying Microsoft Excel file.]
34

Characterization of Hydraulic Fracturing-Related Spills May 2015
Glossary Aquifer: An underground geological formation, or group of formations, containing water. A source of ground water for wells and springs. (ref 5)
Blowout: An uncontrolled flow of formation fluids from a well. (ref 4)
Blowout preventer: A large valve at the top of a well that may be closed if the drilling crew loses control of formation fluids. (ref 4)
Condensate: A natural gas liquid with lower vapor pressure than natural gasoline or liquefied petroleum gas. It is mainly composed of propane, butane, pentane, and heavier hydrocarbon fractions. (ref 4)
Drinking water resource: Any body of water, ground or surface, that could currently, or in the future, serve as a source of drinking water for public or private water supplies. (ref 6)
Flowback: After the hydraulic fracturing procedure is completed and pressure is released, the direction of fluid flow reverses, and fluids flow up the wellbore to the surface. The fluids that return to the surface are commonly referred to as “flowback.” (ref 2)
Formation: A geological formation is a body of earth material with distinctive and characteristic properties and a degree of homogeneity in its physical properties. (ref 5)
Ground water: Water found below the surface of the land, usually in porous rock formations. Ground water is the source of water found in wells and springs and is frequently used for drinking. (ref 5)
Hydraulic fracturing: A stimulation technique used to increase production of oil and gas. Hydraulic fracturing involves the injection of fluids under pressures great enough to fracture the oil and gas production formations. (ref 6)
Hydraulic fracturing fluid: Specially engineered fluids that generally contain water, proppants, and chemical additives. Hydraulic fracturing fluids are pumped under high pressure into the well to create and hold open fractures in the formation. (ref 3)
Natural gas: A naturally occurring mixture of hydrocarbon and non-hydrocarbon gases that is highly compressible and expansible. Methane is the chief constituent of most natural gas, with lesser amounts of ethane, propane, butane, and pentane. (ref 4)
Produced water: Formation fluids, and possibly fracturing fluids, that are produced from the hydrocarbon-bearing formation. Sometimes the term produced water is used synonymously with flowback.
Proppant: Sized particles (e.g., sand) mixed with fracturing fluid to hold fractures open after a hydraulic fracturing treatment. (ref 4)
35
Characterization of Hydraulic Fracturing-Related Spills May 2015
Quality assurance / quality control: A system of procedures, checks, audits, and corrective actions to ensure that all technical, operational, monitoring, and reporting activities are of high quality. (ref 5)
Service company: A company that assists well operators by providing specialty services, including hydraulic fracturing.
Surface water: All water naturally open to the atmosphere (rivers, lakes, reservoirs, ponds, streams, impoundments, seas, estuaries, etc.). (ref 5)
Well communication: Spills reported in the data sources as being caused by well communication refer to spills on the surface that occur when pressure applied during hydraulic fracturing activities at one well affects the production and collection of fluids at a nearby or offset well.
Well operator: A company that operates oil and gas production wells.
Glossary References 1. GWPC and ALL Consulting. 2009. Modern Shale Gas Development in the US: A Primer. Ground
Water Protection Council and ALL Consulting for US Department of Energy. Available athttp://energy.gov/fe/downloads/modern-shale-gas-development-united-states-primer.Accessed September 16, 2014.
2. New York State Department of Environmental Conservation. 2011. Supplemental GenericEnvironmental Impact Statement on the Oil, Gas, and Solution Mining Regulatory Program(revised draft). Well permit Issuance for Horizontal Drilling and High-Volume HydraulicFracturing to Develop the Marcellus Shale and Other Low-Permeability Gas Reservoirs.Available at http://www.dec.ny.gov/energy/75370.html. Accessed July 30, 2014.
3. Oil and Gas Mineral Services. 2010. Oil and Gas Terminology. Available athttp://www.mineralweb.com/library/oil-and-gas-terms/. Accessed May 8, 2015.
4. Schlumberger. 2015. Oilfield Glossary. Available at http://www.glossary.oilfield.slb.com/.Accessed May 8, 2015.
5. US EPA. 2006. Terminology Services: Terms and Acronyms. Available at http://iaspub.epa.gov/sor_internet/registry/termreg/searchandretrieve/termsandacronyms/search.do. AccessedMay 8, 2015.
6. US EPA. 2011. Plan to Study the Potential Impacts of Hydraulic Fracturing on Drinking WaterResources. EPA/600/R-11/122. Available at http://www2.epa.gov/sites/production/files/documents/hf_study_plan_110211_final_508.pdf. Accessed July 30, 2014.
36

Characterization of Hydraulic Fracturing-Related Spills May 2015
[This page intentionally left blank.]
37

Office of Research and Development (8101R) Washington, DC 20460 Official Business Penalty for Private Use $300
PRESORTED STANDARD POSTAGE & FEES PAID
EPA PERMIT NO. G-35
EPA/601/R-14/001 l May 2015 l www.epa.gov/hfstudy