review of international marine protected area seabed
TRANSCRIPT

JNCC Report No. 460
Review of international Marine Protected Area seabed monitoring and assessment of ‘good practice’ to inform
application within UK waters
A report prepared for JNCC by: Parry, M.†, Tierney, M.†, Wood, L.†, Stanwell-Smith, D.†, Northen, K.‡, Abdulla, A.†,
Corrigan, C.†, Gassner, P.†, Fletcher, L.†
†The UNEP World Conservation Monitoring Centre ‡Sea-Scope Marine Environmental Consultants
May 2012
©JNCC, Peterborough 2012
ISSN 0963 8091

For further information please contact: Joint Nature Conservation Committee Monkstone House City Road Peterborough, UK PE1 1JY This report should be cited as: Parry, M., Tierney, M., Wood, L., Stanwell-Smith, D., Northen, K., Abdulla, A., Corrigan, C., Gassner, P. & Fletcher, L. 2012. Review of international Marine Protected Area seabed monitoring and assessment of ‘good practice’ to inform application within UK waters. JNCC Report No. 460

Acknowledgments
UNEP-WCMC wishes to thank the members of the Steering and Correspondance Groups that were established for this project, for their time and valuable input to various discussions held on components of this study; and for comments on draft versions of this report. These groups included representatives from JNCC, Natural England, Scottish Natural Heritage, the Countryside Council for Wales and the Northern Ireland Environment Agency. UNEP-WCMC would also like to thank all those who provided additional information on and insight to the design and implementation of the monitoring programmes that were reviewed in this project.

Executive Summary
The UK is committed to establishing an ecologically coherent network of Marine Protected Areas (MPAs) by 2012. Such a network will contribute to UK marine conservation efforts and fulfil national, European and international legislative obligations. The assessment and interpretation of data collected as part of MPA network monitoring programmes is central to informing adaptive management and reporting. UK Statutory Nature Conservation Bodies intend to develop an integrated system of monitoring for all inshore and offshore MPAs under various designations; however, there is conjecture over what is considered to constitute a good monitoring framework and previous studies have highlighted potential failings in programme design. In response to this, the Joint Nature Conservation Committee (JNCC) commissioned the UNEP-World Conservation Monitoring Centre (UNEP-WCMC) to develop recommendations for good practice in monitoring and assessment of seabed habitats which can be applied to both inshore and offshore MPAs. Good practice recommendations were developed by undertaking a review of current marine conservation legislation and by examining good practice and lessons learnt from case study MPA monitoring programmes from around the globe. This report presents the principle results of this project.
The review of conservation obligations revealed a number of international, European and UK marine instruments have conservation goals directly related to seabed habitats which the UK is obligated to report against. The scope and reporting requirements of each instrument understandably differs, but this does present particular challenges when designing monitoring programmes to meet all goals. Despite this, it was possible to identify common parameters which could be used to monitor and assess seabed habitats in MPAs against these goals. These parameters and the instruments they relate to were taken into consideration when developing the good practice guidelines.
Eleven MPA monitoring programmes from around the globe were selected for review. General characteristics (e.g. location, size, management authority, objectives) and methods (e.g. programme design and implementation, reporting and data use) were compared and assessed to establish guidelines to inform recommendations of good practice. To ensure relevance to the UK, case studies were prioritised for selection by whether monitoring occurred in waters similar to those around the UK mainland or UK Overseas Territories, whether monitoring was conducted in offshore MPAs, and whether seabed habitats and their associated communities were monitored. Size, location, seabed habitats present, methods used and parameters monitored varied substantially amongst the selected case studies. This provided a broad basis upon which to develop good practice guidelines.
Ensuring effective and adaptive management of MPAs requires effective long-term monitoring. However this is resource intensive and often grossly under-funded. It is therefore inevitable that trade-offs and compromises to programme design will have to be made. The good practice guidelines developed here are intended to provide pragmatic advice on how to maximise resource efficiency and uptake of lessons learned (i.e. minimise risk of ‘bad practice’). The UKs broader conservation obligations under various legislative marine instruments were also taken into consideration. Good practice recommendations were developed based on an inductive review of the 11 case studies, assessing their strengths, challenges and applicability to the UK for nine key monitoring programme elements (costs, management use, objectives, assessment, survey design, parameters, survey techniques, data management, and reporting and dissemination). The good practice recommendations should be considered as an iterative, step-wise process. The nine monitoring programme elements have been presented in a logical flow that starts by defining the overall financial constraints and clarifying the ‘end goal’ of the monitoring programme, and then works backwards to describe contributory elements. The choices made about the

elements at each step should consider what is needed to support the end-goal, and resource constraints.
Key good practices recommendations based on lessons learned from existing MPA network monitoring programmes include: • avoid spreading resources too thinly by defining budget up front, starting with the end-
point and working backwards, revisiting budgetary requirements at each step; • apply the SMART concept to objective setting and ensure the monitoring programme is
developed to enable assessment against these objectives throughout the planning process;
• maximise standardisation of monitoring between MPAs, from high-level objectives through to survey techniques, for example by using a master parameter list from which to select parameters to monitor in all MPAs. Although this approach may lose some flexibility at the site level, the gains in comparability and interoperability, as well as enabling network level assessment are substantial;
• conduct a sensitivity analysis to inform survey design and prioritise survey design and sampling effort on collecting data that can be used to detect change to inform management action within the timeframe of the management plan.
• assessments should focus on comparing trends and status in MPAs with a reference condition using appropriate robust statistical analyses and expert opinion.
• resource constraints on survey design is likely to limit the types of analyses used, and experimental comparison to find statistically significant differences between sites will probably only be possible for ad hoc surveys;
• ensure results can be interpreted and used by non-experts; • define data and metadata standards from the beginning and ensure that they are upheld.
The recommendations will help to guide the development of a monitoring programme for the UK (particularly for offshore waters) which successfully assesses the contribution of MPAs to marine conservation goals. They will also help to inform the collection of data required for the UK to meet various legislative and reporting requirements.

Abbreviations/Acronyms
AIMS Australian Institute of Marine Science AMAs Arctic Marine Areas ANOVA Analysis of Variance ASSIs Areas of Special Scientific Interest ASTI Arctic Species Trends Index BACI Before After Control Impact BAP Biodiversity Action Plans BfN German Federal Agency for Nature Conservation CAFF Conservation of Arctic Flora and Fauna CBD Convention On Biological Diversity CBMP Circumpolar Biodiversity Monitoring Program CCAMLR
Convention on the Conservation of Antarctic Marine Living Resources
CCW Countryside Council for Wales CONANP Comisión Nacional de Áreas Naturales Protegidas CTI-CFF Coral Triangle Initiative on Coral Reefs, Fisheries, and Food
Security DCA Detrended Correspondence Analysis Defra Department for Environment, Food and Rural Affairs DFG California Department of Fish and Game EUNIS European Nature Information System FAO Food and Agricultural Organization FECs Focal Ecosystem Components FGC California Fish and Game Commission FOCI Features of Conservation Importance GES Good Environmental Status GLMs General Linear Models ICRAN International Coral Reef Action Network IUCN International Union for the Conservation of Nature JNCC Joint Nature Conservation Committee LMEs Linear Mixed Effect models LTMP Long Term Monitoring Programme MBRS Mesoamerican Barrier Reef Systems MCMP Marine Community Monitoring Program MCZs Marine Conservation Zones MLPA Marine Life Protection Act MNR Marine Nature Reserves MPA Marine Protected Area MRA Mesoamerican Reef Alliance MRMP Marine Parks and Reserves Authority MSFD Marine Strategy Framework Directive NAFO Northwest Atlantic Fisheries Organisation NAMPAN North American Marine Protected Areas Network NOAA National Oceanic & Atmospheric Administration

OSPAR Oslo Paris Convention (now OSPAR Convention) PISCO Partnership for Interdiscplinary Studies of Coastal Oceans QA Qualtiy Assurance QC Quality Control RAMPAO Regional Network of Marine Protected Areas in West Africa ROVs Remotely Operated Vehicles RPoA Regional Plan of Action SACs Special Areas of Conservation SAON Sustaining Arctic Observation Networks SCA Strenths, Challenges, Applicability analysis SIMPER Similarity of Percentages sMPA Scottish Marine Protected Areas SNCB Statutory Nature Conservation Bodies SPAs Special Protection Areas SSSIs Sites of Special Scientific Interest SWOT Strengths, Weaknesses, Opportunities, Threats analysis UK BAP UK Biodiversity Action Plan UNGA United Nations General Assembly VMEs Vulnerable Marine Ecosystems WAMSI Western Australian Marine Science Institution WFD Water Framework Directive

Contents 1 Introduction .................................................................................................................... 1
1.1 Background and rationale ................................................................................................ 1
1.2 Objectives ........................................................................................................................ 2
1.3 Summary of approach ..................................................................................................... 3
2 Methods and Results ..................................................................................................... 4
2.1 Stage 1: Refining objectives ............................................................................................ 4
2.1.1 Overview ........................................................................................................... 4
2.1.2 Review of marine conservation obligations in marine legislation ...................... 4
2.1.3 Critical review of the Addison (2011) report .................................................... 10
2.2 Stage 2: Implementation of the review .......................................................................... 15
2.2.1 Overview ......................................................................................................... 15
2.2.2 Information collected for each case study ....................................................... 15
2.2.3 Review of case studies .................................................................................... 16
2.3 Stage 3: Development of ‘good practice’ guidelines ...................................................... 24
2.3.1 Overview ......................................................................................................... 24
2.3.2 Methodology .................................................................................................... 24
2.3.3 Good practice .................................................................................................. 25
3 Conclusions and Recommendations ......................................................................... 48
4 References ................................................................................................................... 51
5 Appendices .................................................................................................................. 59
Appendix 1 Summary of the UK’s obligations under each International, European or UK policy ..................................................................................................................................... 59
Appendix 2 Summary of assessment of potential case studies to identify how each could help to address the gaps identified in the Addison (2011) report .......................................... 66
Appendix 3 Factsheets containing basic information on each case study not selected for full review .................................................................................................................................... 69
Appendix 4 Factsheets containing information on each case study reviewed ..................... 88
Appendix 5 Examples of good practice derived from the case studies reviewed .............. 133
Appendix 6 Supplementary Electronic Material ................................................................. 144

1
1 Introduction
1.1 Background and rationale
An important component of the UK marine conservation effort is delivered through marine protected areas (MPAs), and as such there is a need to monitor their effectiveness in delivering conservation goals. The UK is signatory to a number of international agreements that aim to establish an ‘ecologically coherent network of MPAs’ by 2012 (JNCC 2010). Currently, the UK MPA network includes Sites/Areas of Special Scientific Interest (SSSIs/ASSIs), Special Areas of Conservation (SACs), Special Protection Areas (SPAs), Ramsar sites and Marine Nature Reserves (MNRs). In England and Wales, a new type of MPA has been designated, called Marine Conservation Zones (MCZs), which will also form part of the network (JNCC 2012). Likewise Scotland will also introduce a series of new Nature Conservation, Demostration and Research, and Historic MPAs (SNH 2012); and in Northern Ireland, the proposed Marine Bill to the Northern Ireland Assembly includes provisions for MCZs in Northern Ireland’s territorial waters (DOE 2010).
The Marine Biodiversity Monitoring Research and Development Programme led by the Joint Nature Conservation Committee (JNCC) and involving all the UK Statutory Nature Conservation Bodies (SNCBs)1, aims to recommend an integrated system of monitoring for both Marine Protected Areas (MPAs) and the wider environment to meet the requirements of the Marine Strategy Framework Directive (MSFD) and other drivers. Within the wider Programme there is a project to focus on monitoring of MPAs which aims to establish long term monitoring programmes for the offshore MPAs, to ensure the conservation objectives of each site are being met, and to consider whether any additional monitoring is required to enable assessment of the contribution of the MPA network to marine conservation.
A number of international, European and UK marine policies require reporting on how marine conservation goals are being met. For example, the Marine Strategy Framework Directive (MSFD) requires Member States to prepare marine strategies to manage their seas to achieve or maintain Good Environmental Status (GES) by 2020. Requirements include the establishment of a monitoring programme to measure progress towards GES by July 2014. The European Habitats Directive (92/43/ECC) requires that Member States undertake surveillance of habitats (as listed in Annex I) and species (as listed in Annex II) and report on the results every six years. Although there is no explicit requirement in the European Birds Directive (79/409/EEC) to survey/monitor birds, the intent of the Directive could not be achieved without adequate information on conservation status, pressures etc. of birds. Reporting under the Birds Directive is now also on a six-year cycle. Both the Marine and Coastal Access Act 2009, which covers England and Wales, and the Marine (Scotland) Act 2010 require regular, six-year reporting of the extent to which conservation objectives for MCZs and sMPAs have been achieved.
The Marine and Coastal Access Act 2009 and the Marine (Scotland) Act 2010 also both state that conservation sites in the UK marine area must form a network which meets the following objectives:
• that the network contributes to the conservation or improvement of the marine environment in the UK marine area;
• that the features which are protected by the sites comprised in the network represent the range of features present in the UK marine area; and
1 The SNCBs comprise JNCC, the Countryside Council for Wales (CCW) ,Natural England, the Northern Ireland Environment Agency (NIEA) and Scottish Natural Heritage (SNH).
2
• that the designation of sites comprised in the network reflects the fact that the conservation of a feature may require the designation of more than one site.
A crucial step in the management and reporting cycle is the assessment and interpretation of data collected during monitoring programmes. To this end, it is essential that monitoring programmes are designed in such a fashion that appropriate data is collected, and that they are carried out in the most cost and time efficient manner.
Some monitoring already takes place for existing inshore (0-12 nautical miles) sites by the SNCBs but no regular monitoring is currently taking place offshore, and new national MPAs being designated in the next few years, both inshore and offshore, will require monitoring.
1.2 Objectives
This primary objective of this project is to:
• develop recommendations for good practice in monitoring and assessment of seabed habitats which can be applied to both inshore and offshore MPAs, based on a review of the experiences gained from existing and developing programmes globally, along with expert opinion.
The project only covers seabed habitats and not other potential components of an MPA monitoring programme such as pelagic habitats and associated communities, human activities, or socio-ecomonic and governance factors.
Recommendations will be developed for the following elements which are considered to contribute to a competent monitoring programme:
• costs • objectives • management use • assessment and analysis • survey design • parameters monitored • survey techniques • data management • dissemination and reporting
These recommendations will help to:
1. Guide the development of a monitoring programme for the UK (particularly for offshore waters) which successfully assesses the contribution of MPAs to marine conservation goals; and
2. Help to inform the collection of data required for the UK to meet various legislative and reporting requirements.
Specifically, this project will build upon the report by Addison (2011) prepared for JNCC which evaluated 11 key long-term MPA monitoring programmes against a ‘good monitoring framework’.

3
1.3 Summary of approach
This project was conducted in three consecutive stages:
1. Refining Objectives – whereby conservation goals under international agreements, EU directives and UK legislation and policy drivers relative to the UK were reviewed to identify related reporting requirements. From this, gaps in the Addison (2011) report were identified, which lead to the establishment of a revised set of criteria for selecting case studies to be considered;
2. Implementation of the Review – consisting of an extended review of existing and developing monitoring programmes; followed by
3. Development of ‘Good Practice’ Guidelines - the compilation of recommendations for good practice for MPA seabed monitoring and assessment in UK waters based on a modified ‘Strengths, Weaknesses, Opportunities, Threats’ (SWOT) analysis.
The results from each stage of the project informed the process of the next. To preserve this logical flow, the detailed methodology plus the results from each stage are presented sequentially (Sections 2.1-2.3). The overall ‘good practice’ recommendations are presented in Section 3. Factsheets containing information on each monitoring programme that was reviewed are presented as a set in Appendix 4. This information has also been compiled into a single electronic database (Microsoft Excel spreadsheet), as well as the resultsof the modified SWOT analysis performed on each individual case study. These databases are available for download from the JNCC website (http://jncc.defra.gov.uk/page-2132 - see JNCC Report No. 460).

4
2 Methods and Results
2.1 Stage 1: Refining objectives
2.1.1 Overview
In Stage 1, three exercises were undertaken:
1. A review of conservation goals and obligations under international agreements, EU directives and UK legislation and policy drivers that is relative to the UK. This was done to identify reporting requirements and inform a widening of Addison’s (2011) original report.
2. Review and identification of major gaps in the Addison (2011) report; and 3. Based on i) and ii), establish a revised set of criteria for selecting case studies to be
considered in Stage 2.
2.1.2 Review of marine conservation obligations in marine legislation
In order to ensure MPA monitoring programmes provide useful data to meet reporting requirements and effectively assess whether conservation goals are being met, a review of the UK’s main marine conservation obligations under various instruments was carried out. Note, the review conducted here was relatively succinct due to time constraints, and to avoid overlap of effort with work being carried out by the JNCC Marine Ecosystem Assessment and Advice Programme which includes an internal review and analysis of the assessment frameworks stipulated within national and international marine biodiversity obligations. The broader and more detailed results from the JNCC review will be available in 2012.
The review for this report covered: • key international initiatives and EU Directives, as well as UK legislation and policy drivers
(10 in total); • conservation goals specific to MPAs, and • wider conservation goals which could be assessed by monitoring inside and outside
MPAs.
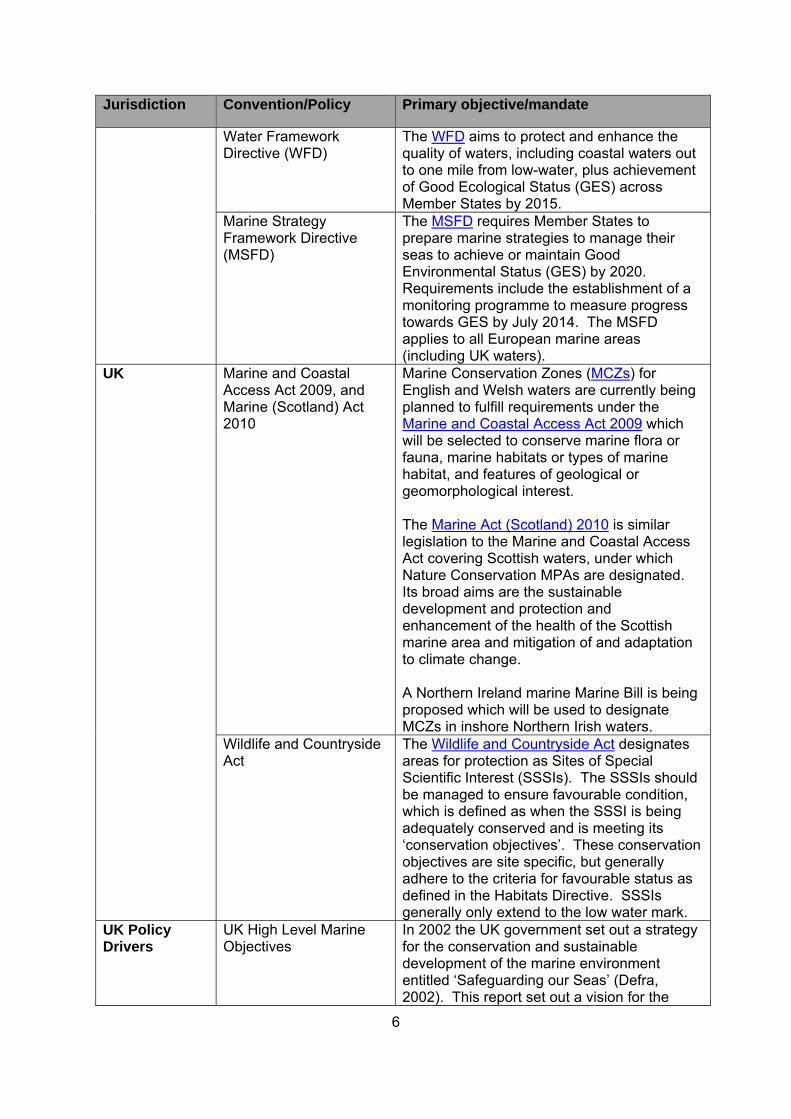
In line with the scope of this project specified by JNCC, the review only considered conservation goals relevant to seabed habitats, therefore excluding those relating to species, pelagic ecosystems, human activities and other socio-economic factors. Each international, European or UK policy reviewed, and their primary objective or mandate is presented in Table 2.1. A summary of the UK’s obligations under each is outlined in Appendix 1.

5
Table 2.1 Relevant International, European and UK marine policies reviewed. Jurisdiction Convention/Policy Primary objective/mandate
International Convention on Biological Diversity (CBD)
The CBD promotes the conservation of biological diversity, the sustainable use of its components and the fair and equitable sharing of the benefits arising out of the utilization of genetic resources.
Ramsar Convention The Ramsar Convention aims to promote the conservation of wetlands by calling on Member States to select Wetlands of International Importance on account of their international significance in terms of ecology, botany, zoology, limnology or hydrology, and maintain their ecological character.
Oslo Paris Convention (OSPAR)
The OSPAR Convention is the legal instrument guiding international cooperation on the protection of the marine environment of the North-East Atlantic region. The Convention requires Member States to ‘take all possible steps to prevent and eliminate pollution and shall take the necessary measures to protect the maritime area against the adverse effects of human activities so as to safeguard human health and to conserve marine ecosystems and, when practicable, restore marine areas which have been adversely affected’.
United Nations General Assembly (UNGA) Resolutions 61/105 and 64/72
UNGA Resolution 61/105 and 64/72 address improvements to the management of fisheries which aim to promote the conservation of vulnerable marine ecosystems (VMEs) which provide habitat for fish. These Resolutions aim to ‘ensure the long-term conservation, management and sustainable use of the relevant fish stocks and to prevent significant adverse impacts on vulnerable marine ecosystem’.
European Habitats and Bird Directives
The Habitats and Birds Directives focus on the conservation of listed habitats and species, which is achieved through the designation of Special Areas of Conservation (SACs) for the Habitats Directive or, for the Birds Directive, Special Protected Areas (SPAs). The broad conservation objective stated is for parties to ‘ensure the restoration or maintenance of natural habitats and species of Community interest at a favourable conservation status’.
6
Jurisdiction Convention/Policy Primary objective/mandate
Water Framework Directive (WFD)
The WFD aims to protect and enhance the quality of waters, including coastal waters out to one mile from low-water, plus achievement of Good Ecological Status (GES) across Member States by 2015.
Marine Strategy Framework Directive (MSFD)
The MSFD requires Member States to prepare marine strategies to manage their seas to achieve or maintain Good Environmental Status (GES) by 2020. Requirements include the establishment of a monitoring programme to measure progress towards GES by July 2014. The MSFD applies to all European marine areas (including UK waters).
UK Marine and Coastal Access Act 2009, and Marine (Scotland) Act 2010
Marine Conservation Zones (MCZs) for English and Welsh waters are currently being planned to fulfill requirements under the Marine and Coastal Access Act 2009 which will be selected to conserve marine flora or fauna, marine habitats or types of marine habitat, and features of geological or geomorphological interest. The Marine Act (Scotland) 2010 is similar legislation to the Marine and Coastal Access Act covering Scottish waters, under which Nature Conservation MPAs are designated. Its broad aims are the sustainable development and protection and enhancement of the health of the Scottish marine area and mitigation of and adaptation to climate change. A Northern Ireland marine Marine Bill is being proposed which will be used to designate MCZs in inshore Northern Irish waters.
Wildlife and Countryside Act
The Wildlife and Countryside Act designates areas for protection as Sites of Special Scientific Interest (SSSIs). The SSSIs should be managed to ensure favourable condition, which is defined as when the SSSI is being adequately conserved and is meeting its ‘conservation objectives’. These conservation objectives are site specific, but generally adhere to the criteria for favourable status as defined in the Habitats Directive. SSSIs generally only extend to the low water mark.
UK Policy Drivers
UK High Level Marine Objectives
In 2002 the UK government set out a strategy for the conservation and sustainable development of the marine environment entitled ‘Safeguarding our Seas’ (Defra, 2002). This report set out a vision for the

7
Jurisdiction Convention/Policy Primary objective/mandate
future of the marine environment: “Our vision for the marine environment is clean, healthy, safe, productive and biologically diverse oceans and seas. Within one generation we want to have made a real difference”. Based on this statement, the UK Government compiled the UK’s high level objectives which were divided into five sustainable development principles. The objectives listed under the ‘Living within environmental limits’ principle refer to biodiversity:
• Biodiversity is protected, conserved and where appropriate recovered and loss has been halted.
• Healthy marine and coastal habitats occur across their natural range and are able to support strong, biodiverse biological communities and the functioning of healthy, resilient and adaptable marine ecosystems.
• Our oceans support viable populations of representative, rare, vulnerable, and valued species.
Throughout the review, parameters which could be used to monitor and assess the status of the conservation objectives identified were also noted. These are summarised in Table 2.2 which shows which parameters are relevant to the conservation objectives under each initiative. The parameters listed in the table are based on the wording in the relative directives, conventions and legislation, which overlap in places and are at different levels of detail. A more thorough review is needed to provide an exhaustive list of parameters which could potentially be used to report on different initiatives, which was not possible within the time frame of this project. The review and necessary parameters identified were taken into consideration during the review phase of Stage 1 and Stage 2, and the development of good practice guidelines in Stage 3.

Table 2.2 Summary of parameters which address conservation goals under the conservation initiatives relevant to the UK and seabed habitats.
International Conventions European policies UK legislation
UK policy drivers
Convention
on Biological Diversity
Ramsar Convention
OSPAR Convention
UNGA Resolutions 61/105, 64/72
Habitats Directive
Birds Directive
Water Framework
Directive
Marine Strategy
Framework Directive
Marine and Coastal Act
Marine Act (Scotland)
Wildlife and Countryside
Act
High level marine
objectives
Distribution
Habitat range
Biotope distribution
Extent
Habitat extent
Extent of habitat used by threatened species
Extent of biogenic substrate
Extent of seabed significantly affected by human activities
Condition
Ecosystem/ biotope /community structure
Ecosystem functioning/ environmental processes
Abundance of typical species
Abundance of threatened species
Diversity
Species Richness
Physical hydrological and chemical conditions
Abundance of non-indigenous species
Proportion of selected species at the top of food webs
Abundance of endemic species
Productivity
Sediment character
Topography

9
International Conventions European policies UK legislation
UK policy drivers
Convention
on Biological Diversity
Ramsar Convention
OSPAR Convention
UNGA Resolutions 61/105, 64/72
Habitats Directive
Birds Directive
Water Framework
Directive
Marine Strategy
Framework Directive
Marine and Coastal Act
Marine Act (Scotland)
Wildlife and Countryside
Act
High level marine
objectives
Environmental Quality (water, sediments, biota)
Environmental quality
Concentration of contaminants
Individual or groups of species indicative of condition/ change
Presence of particularly sensitive and/or tolerant species
Proportion of opportunistic to sensitive species

10
2.1.3 Critical review of the Addison (2011) report
i) Key findings presented in Addison (2011)
In response to growing criticism that MPA monitoring programmes were inappropriately designed, the review undertaken by Addison (2011) for JNCC evaluated 11 key long-term MPA monitoring programmes from around the world against a ‘good monitoring framework’.2 The study aimed to identify major shortcomings of MPA monitoring and ‘lessons learnt’ which could help improve the scientific credibility and success of current and upcoming marine monitoring programmes. In the ensuing report Addison (2011) concluded that:
• all monitoring programmes evaluated failed to adequately link their objectives to those of the MPA;
• MPA monitoring programmes should draw more heavily on lessons learned about monitoring design and data collection from the field of environmental impact assessment (EIA), given the similarities between the two;
• relevant statistical analyses are used by MPA monitoring programmes, but greater consideration needs to be given to statistical inference;
• the results of MPA monitoring are not being communicated effectively to all relevant audiences, in particular decision makers;
• many MPA monitoring programmes are undertaken and funded independently of the agencies responsible for managing the MPAs. This disconnect can influence research objectives and ultimately management of the MPA; and
• some MPAs are subject to complex jurisdiction arrangements which can impact on the success of a monitoring programme.
ii) Gaps identified in Addison (2011) report
Although the Addison (2011) report does provide a basis for examining what could be considered ‘good practice’ for monitoring and assessment of MPAs and MPA networks, its primary emphasis was to examine statistical analytical approaches used in marine monitoring programmes. The relatively strict selection criteria used by Addison (2011) (see Table 2.3) may have also limited the conclusions drawn about what constitutes good practice. To fully understand good practice in MPA monitoring and to be able to apply this to both inshore and offshore regions of the UK, the following aspects were considered as also being necessary to address in an extended review, and consequently informed new selection criteria:
• Conservation objectives within obligations - good practice should result in a monitoring programme which provides fit for purpose data that is relevant for the UK’s reporting requirements as identified in Section 2.1.2; therefore, existing UK MPA monitoring programmes need to be reviewed to ensure they incorporate the conservation objectives stipulated under different marine legislation that relates to the UK.
• Offshore monitoring - monitoring in offshore, as well as inshore, MPAs needs to be reviewed so that the development of new UK MPA monitoring plans incorporate strategies for assessing the effectiveness of the entire MPA network.
• Monitored parameters and indicators – MPAs can be designated to protect the marine environment in a particular region as a whole, not just for the specific species or features it contains. Therefore the process by which MPA programmes monitor biological indicators (e.g. species diversity, abundance and/or condition), as well as other important
2 The four key steps of a good monitoring framework as outlined in Addison (2011; adapted from Lindenmeyer & Likens, 2010) are: 1) key questions are defined; 2) the monitoring programme is carefully designed; 3) appropriate statistical analysis and data presentation is used; 4) results are interpreted and reported regularly.

11
indicators of marine health and ecosystem functioning (e.g. water quality), should be assessed. This will also assist with meeting reporting obligations.
• Reporting language – well developed MPA monitoring programmes that are reported in a language other than English may provide insight relevant to establishing UK MPA monitoring plans. Therefore these should also be considered if possible (i.e. by using research staff that are multi-lingual and/or investing in translation services, however this will have financial implications).
• Guidance from other processes – the lessons learned from other environmental monitoring processes could provide valuable insight into good practice which could be applied to MPA monitoring.
• New and developing MPA programmes – although new and developing MPA programmes may not be fully functional, the techniques they propose to employ can still be considered in terms of what constitutes good practice alongside more established programmes.
• Data Sources – credible information can be collected from well-managed citizen science3 monitoring programmes and should be considered a legitimate source for assessing good practice.
• Effectiveness of MPA for conserving seabed habitats – how a monitoring programme is designed to ensure it can answer three key questions: current state, cause of change, and effect of interventions should be considered.
iii) Selection criteria
Based on the above, it became evident that additional MPA monitoring programmes would need to be reviewed so that more comprehensive recommendations about what constitutes ‘good practice’ could be made. In order to select the most relevant case studies to review, the criteria used by Addison (2011) were revised and a number of the criteria relaxed. The revised criteria are presented in Table 2.3, alongside the original criteria used by Addison (2011) for comparison.
3 Citizen science refers to research collaborations between scientists and volunteers particularly (but not exclusively) to expand opportunities for scientific data collection and to provide access to scientific information for community members. Volunteers, many of whom may have no specific scientific training, may perform or manage research-related tasks such as observation, measurement, or computation.

12
Table 2.3 Revised criteria for selecting MPA monitoring programmes to review for ‘good practice’. (Note: revised names or new criteria categories are shown in parenthesis).
Criteria Original (Addison, 2011) criteria
Revised criteria
Marine Protected Area
Monitoring programmes must be associated with an MPA. Monitoring occurs within (and also possibly outside of) an MPA (or network of MPAs). The primary goal of the monitoring programme must be to evaluate the effect of protection of the MPA.
Case studies will be associated with an MPA, but other monitoring programmes will also be reviewed. The monitoring programme does not have to state the goal of evaluating the effect of protection.
Biological (Indicators)
Marine biological units are monitored (not smaller scales such as genetics or larger scales such as mapping habitats). The biological monitoring must also focus on multiple species (i.e. biological communities, not just a single species). Monitoring also must involve the visual census of species and not estimates of species abundance based on fisheries catch data.
Indicators used to monitor the MPA can be biological, physical or chemical. Biological indicators, such as species abundance can be based on any means of census including visual counts and fisheries data. The focus will be on the monitoring of seabed habitats, and their associated species. Monitoring using habitat mapping will also be considered, as habitat extent and range are often listed as indicators for conservation obligations.
Long-term (Longevity)
Monitoring is ‘long-term’. For the purposes of this review, long-term monitoring is considered to span at least five years.
Monitoring can be ‘long’ (i.e. >5 years) or ‘short’ (i.e. <5 years) term, with monitoring events or reporting cycles of any length. New or developing programmes will be considered as this is a growing field.
Current (State of monitoring)
Monitoring is current and there must be evidence that there is an intention to continue the monitoring programme into the future. Only recent monitoring reports/papers have been used to review each of the case studies (data and publication from 2006 onwards) in order to reflect the current approaches to monitoring (rather than historic and possibly out-dated approaches)
Monitoring does not have to be current. Reports do not have to have been published after 2006; the relevance of approaches will be considered in the review.
Scientific (Data sources)
Monitoring is conducted by scientists with academic institutions, government agencies or other organisations (i.e. community group monitoring with the primary aim of community engagement).
Monitoring can be conducted by scientists from academic institutions, government and non-government agencies or other organisations, including citizen science groups.

13
Criteria Original (Addison, 2011) criteria
Revised criteria
English Language (Reporting language)
This review is limited to reports/papers which are written in English.
Reports or publications can be presented in any widely spoken language which WCMC can get translated internally.
(Management category)
-
MPA monitoring programmes include those undertaken in any MPA management category – i.e. areas where all activities are banned (e.g. reference areas, marine reserves or ‘no-take’ zones; areas where activities are managed through management plans (these could include permanent fisheries closures but not temporary closures, spatial plans, licensing and specific MPA legislation etc.); or networks of MPAs.
(Location)
-
MPA monitoring programmes can be conducted in inshore (≤12 nautical miles from the coast), offshore (≥12 nautical miles from the coast), or joint onshore/offshore MPAs.
(Relevant to UK) -
Monitoring is conducted in areas similar or relevant to either UK domestic waters or UK Overseas Territories.
Relaxing the criteria could potentially result in a large number of candidate case studies to review. Therefore case studies were prioritized for selection by those which met all of the following: • programme has specified conservation objectives; • monitoring is conducted in waters relevant to UK domestic waters (i.e. primarily
temperate waters) or UK Overseas Territories; • monitoring may include offshore areas; • both biological and non-biological indicators are monitored; • seabed habitats and their associated communities are monitored (monitoring is not
limited to fisheries); and • MPA may be part of a network. Using the revised criteria expanded the pool of case studies that could be considered for review. In particular, case studies which would not have been considered using the criteria in Addison (2011), but which may provide valuable insight into ‘good practice’, included those where: • the reporting language is not English; • it is a new or developing programme; and • data is collected by citizen scientists, not just trained scientists. Based on the revised set of criteria, 35 case studies were selected as potential candidates for review. Each new case study, plus those reviewed by Addison (2011) underwent a preliminary assessment to identify how each could help to address the gaps identified in Section 2.1.3.2 (Appendix 2). Using this assessment, and the format outlined above for prioritizing case studies, 11 programmes were selected as suitable for further review (Table 2.4). The geographic location of where each of these programmes has, does or will take place is depicted in Figure 2.1. The remaining 24 case studies were rejected either because

14
they would have led to over representation of studies from particular regions or systems (e.g. southern hemisphere temperate waters, or tropical systems), or because preliminary investigations revealed that available information on the programmes was limited and/or not relevant. ‘Fact-sheets’ containing basic information (e.g. MPA location, size, objectives, management authority, plus details on the status and objectives of the associated monitoring programme) on each of the rejected case studies (excluding those reviewed by Addison (2011)) are provided in Appendix 3. Table 2.4 Name, location and category of the case studies selected for review. No. Name and location Code Category
1 Long Term Monitoring Program, Great Barrier Reef Marine Park; Queensland, Australia
GB Single MPA
2 The Gully MPA; Scotian Shelf, Canada GU Single
MPA
3 Ecosystem Monitoring, Tasmania‘s Marine Reserves, Tasmania; Australia
TA MPA Network
4 Danish NOVANA national monitoring programme, which includes monitoring Natura 2000 sites; Denmark
DA MPA Network
5 German EEZ Natura 2000 Network; German North Sea and Baltic Sea
GE MPA Network
6 Marine Life Protection Act (MLPA) MPA Network – PISCO; Central Coast California
CC MPA Network
7 Marine Life Protection Act (MLPA) MPA Network – PISCO; North Central Coast California
NC MPA Network
8 Arctic Marine Areas; Arctic AM MPA
Network
9 Welsh Special Areas of Conservation; Wales, UK WA MPA
Network
10 MAREANO mapping programme; Norwegian and Barents Seas, including Sularevet, Iverryggen and Rostrevet MPAs
NO Baseline Survey
11 NEREIDA NAFO Potential Vulnerable Marine Ecosystems; Flemish Cap, Northwest Atlantic
NE Baseline Survey

15
Figure 2.1 Location of MPAs and monitoring programmes reviewed in each case study. AM: Arctic Marine Areas; CC: Central Coast California, Marine Life Protection Act (MLPA) MPA Network; DA: Danish Natura 2000 sites; GB: Great Barrier Reef Marine Park; GE: German Natura 2000 Network; GU: The Gully MPA; NC: North Central Coast California, Marine Life Protection Act (MLPA) MPA Network; NE: NEREIDA NAFO Potential Vulnerable Marine Ecosystems; NO: Norwegian MAREANO mapping programme; TA: Tasmania‘s Marine Reserves; WA: Welsh Special Areas of Conservation.
2.2 Stage 2: Implementation of the review
2.2.1 Overview
In Stage 2 the main aim was to review the selected case studies to identify the methods used for monitoring MPAs and MPA Networks. The results of this review would then be used to identify ‘good practice’ and compared against other, established guidelines to inform recommendations in the last stage of the project.
2.2.2 Information collected for each case study
The eleven selected case studies (Table 2.4) were split into three categories for review:
1. Monitoring programmes conducted in a single MPA (Case studies 1-2) 2. Monitoring programmes conducted in or proposed for a MPA network (Case studies 3-9) 3. General baseline surveys. These may not have been designed for MPAs specifically, but
do incorporate methods/protocols that may be applicable to consider as ‘good practice’ for MPA monitoring (Case studies 10-11).
Information was then compiled into a database to enable comparison of monitoring approaches. For ease of collation and comparison, the type of information collected on each case study was categorised and considered under four sub-headings:
1. MPA Description: includes general information about the MPA where monitoring takes place, such the name of the MPA, location, objectives of the MPA, when designated, relevant management authority, size and type of habitat in the MPA.

16
2. Monitoring Programme Details: includes general information about the monitoring programme, such as the name of the monitoring programme, who is responsible for conducting the monitoring, start/end dates, monitoring objectives and contact details of key personnel.
3. Design and Implementation: includes information on the programme design (spatial and temporal), parameters monitored and type of data collected, and cost.
4. Reporting and Use of Data: includes information on statistical analysis used, reporting characteristics and how the information generated from the programme is used – particularly whether it informs management or to indicate if management is working.
The database is available electronically4; the salient points from each case-study have been extracted and compiled into individual ‘fact-sheets’ which are presented in Appendix 4.
2.2.3 Review of case studies
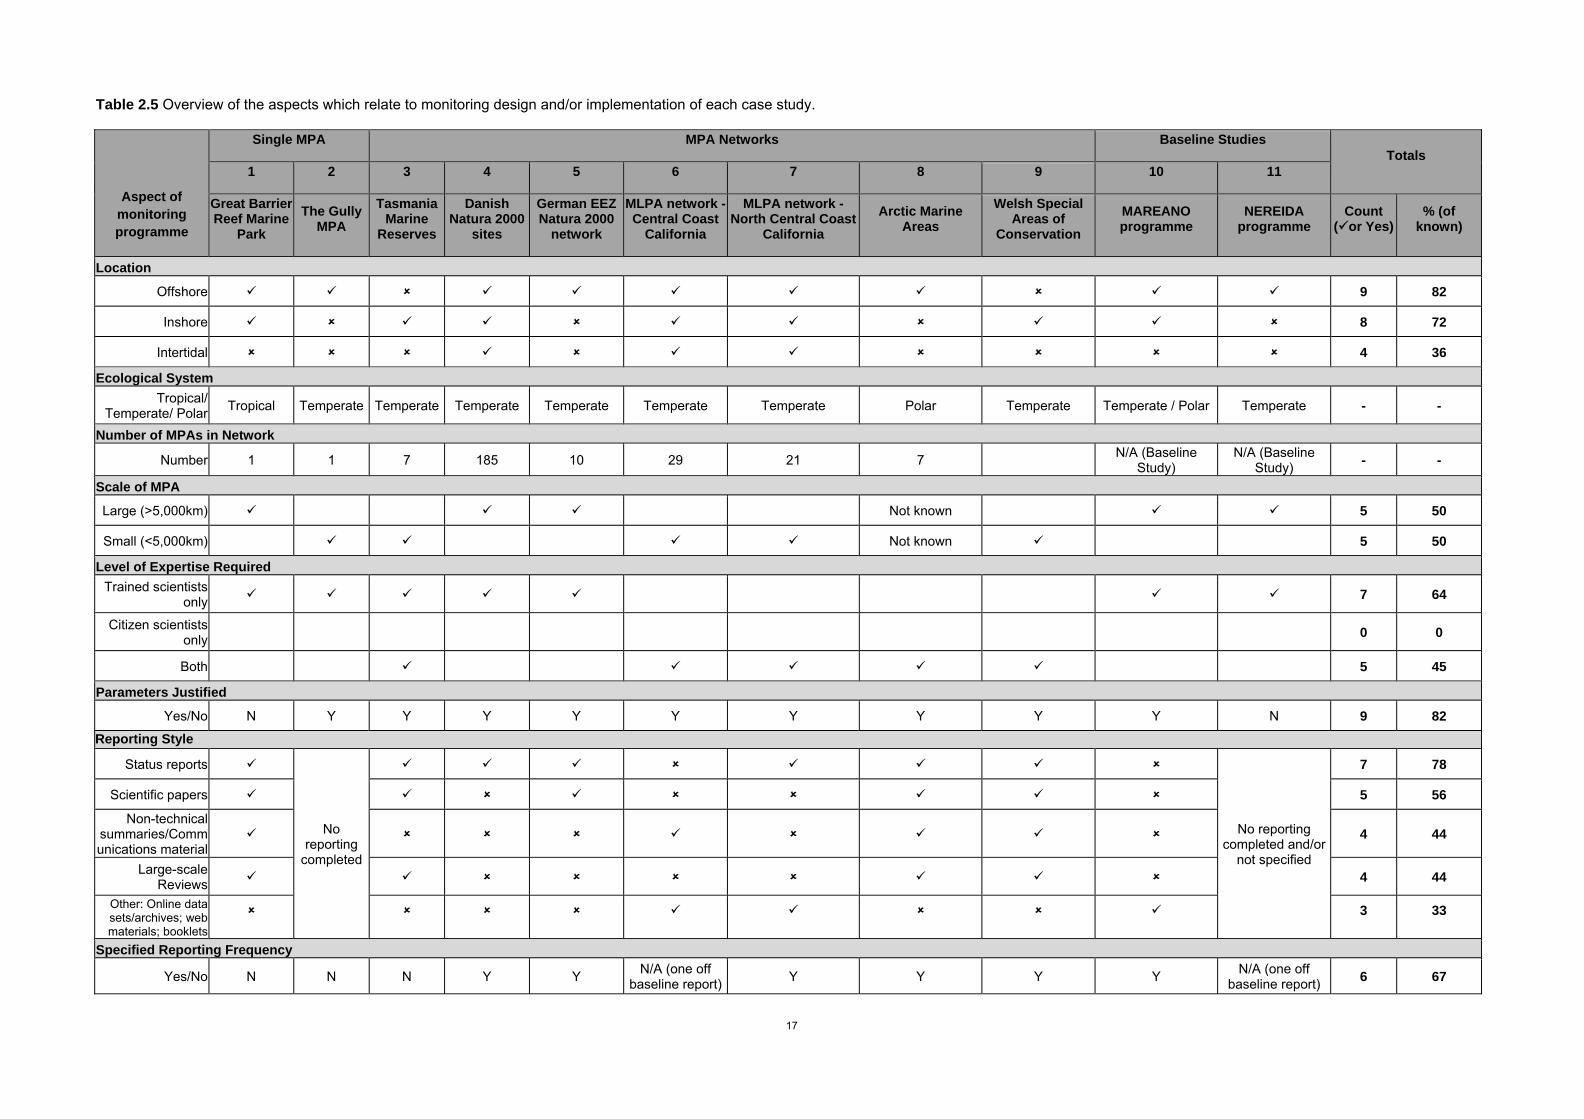
iv) General characteristics of monitoring programmes
A basic, overarching summary of the different aspects which relate to monitoring design or implementation of each case study is presented in Table 2.5. Almost half (45%) of the case studies reviewed incorporated or monitored both offshore and inshore habitats, with 36% also monitoring inter-tidal habitats. The majority of case studies were based in temperate regions, although both tropical and polar systems were also represented, therefore incorporating the range of systems where UK-regulated MPAs are or may be designated. The number of MPAs in a network varied, ranging from one through to 185. Spatial scale of the MPA networds was also varied, with half covering an area >5,000 km2 and half operating in MPAs of <5,000 km2. In regards to programme design, the majority (82%) of case studies provided some justification for the parameters that were selected for monitoring. Many (64%) required a high degree of expertise (i.e. qualified and experienced scientists/field researchers or specialized equipment). Five case studies (45%) considered using non-professional personnel (i.e. citizen scientists).
A varied approach to reporting and reporting frequency is taken between programmes. Most (78%) produce status reports, and between 38%-56% also produce one or all of the following: scientific papers, non-technical summaries/communications materials, or contribute to larger reviews. Three case studies provide online data-sets or other materials such as booklets/leafets on the programme. Many (67%) have a set reporting cycle ranging between 1-5 years, depending on the type of report being produced.
4 The database is available for download from the JNCC website: http://jncc.defra.gov.uk/page-2132 - see JNCC Report No. 460
17
Table 2.5 Overview of the aspects which relate to monitoring design and/or implementation of each case study.
Aspect of monitoring programme
Single MPA MPA Networks Baseline Studies Totals
1 2 3 4 5 6 7 8 9 10 11
Great Barrier Reef Marine
Park
The Gully MPA
Tasmania Marine
Reserves
Danish Natura 2000
sites
German EEZ Natura 2000
network
MLPA network -Central Coast
California
MLPA network - North Central Coast
California
Arctic Marine Areas
Welsh Special Areas of
Conservation
MAREANO programme
NEREIDA programme
Count (or Yes)
% (of known)
Location
Offshore 9 82
Inshore 8 72
Intertidal 4 36
Ecological System
Tropical/ Temperate/ Polar
Tropical Temperate Temperate Temperate Temperate Temperate Temperate Polar Temperate Temperate / Polar Temperate - -
Number of MPAs in Network
Number 1 1 7 185 10 29 21 7 N/A (Baseline
Study) N/A (Baseline
Study) - -
Scale of MPA
Large (>5,000km)
Not known 5 50
Small (<5,000km) Not known 5 50
Level of Expertise Required
Trained scientists only
7 64
Citizen scientists only
0 0
Both 5 45
Parameters Justified
Yes/No N Y Y Y Y Y Y Y Y Y N 9 82
Reporting Style
Status reports
No reporting
completed
No reporting completed and/or
not specified
7 78
Scientific papers 5 56
Non-technical summaries/Communications material
4 44
Large-scale Reviews
4 44
Other: Online data sets/archives; web materials; booklets
3 33
Specified Reporting Frequency
Yes/No N N N Y Y N/A (one off
baseline report)Y Y Y Y
N/A (one off baseline report)
6 67

18
v) MPA and monitoring programme objectives
One of the conclusions in Addison (2011) was that MPAs and monitoring programmes either fail to state their objectives, or if they are stated, then monitoring programmes generally failed to link their objectives to those of the MPA. As Addison (2011) states, this disconnect can lead to a lack of clarity about what a monitoring programme is actually measuring and to be indicative of, thereby reducing its relevance to management or policy decisions. To see if this was the case amongst the new case studies reviewed, we tabulated whether objectives are specified for each MPA or monitoring programme, and how they related to each other (Table 2.6).
All case studies except one (Case Study No. 4) specified both the objectives of the MPA and the objectives of the monitoring programme. Most (83%) monitoring objectives related back to the objectives of the MPA (which primarily had conservation of the marine environment or marine resources at their core). The majority of programmes aimed to track change in species and habitats over time (82%) and between locations (100%) within the MPA; a smaller proporation (45%) compare sites within an MPA to those outside it, and only two case studies specified targets that the monitoring programme is aiming to detect. It appears that all but one programme is designed with the intention that the results can be used to inform mangment of the MPA. Less than half (45%) are designed to indicate if management strategies with the MPA are working, and, where applicable, there is high evidence that results have been used (86% of cases).

19
Table 2.6 MPA and monitoring programme objectives.
Single MPA MPA Networks Baseline Studies Totals
1 2 3 4 5 6 7 8 9 10 11
Great Barrier Reef Marine Park
The Gully MPA
Tasmania Marine
Reserves
Danish Natura
2000 sites
German EEZ Natura 2000
network
MLPA network - Central Coast
California
MLPA network - North Central
Coast California
Arctic Marine Areas
Welsh Special Areas of
Conservation
MAREANO programme
NEREIDA programme
Count (or Yes)
% (of known)
MPA Objectives Specified
Yes/No Y Y Y N Y Y Y Y Y N/A (Baseline
Study)
N/A (Baseline
Study) 8 89
Monitoring/Survey Objectives Specified
Yes/No Y Y Y Y Y Y Y Y Y Y Y 10 100
Purpose of MPA/Monitoring Programme to Assess Long-term
temporal changes 9 82
Spatial differences 11 100
Differences between inside
and outside MPA 5 50
Do MPA and Monitoring Objectives relate to each other
Yes/No Y Y N
N/A (no MPA
objectives set
Y N/A (Only
baseline survey completed)
N/A (Only baseline survey
completed) Y Y
N/A (Baseline survey)
N/A (Baseline survey)
5 83
Targets Specified
Yes/No N N N Y N N Y N N N N 2 18
Is Design of Programme to Inform Managment?
Yes/No Y Y Y Y Y Y Y Y N Y Y 10 91
Is Design of Programme to Indicate if Managment Works?
Yes/No N Y Y Y Y N Y N Y N N 4 45
Is there Evidence that Results Used?
Yes/No Y N/A – In develop
ment Y Y Y Y
N/A – In development
Y N Y N/A – In
development 7 86

20
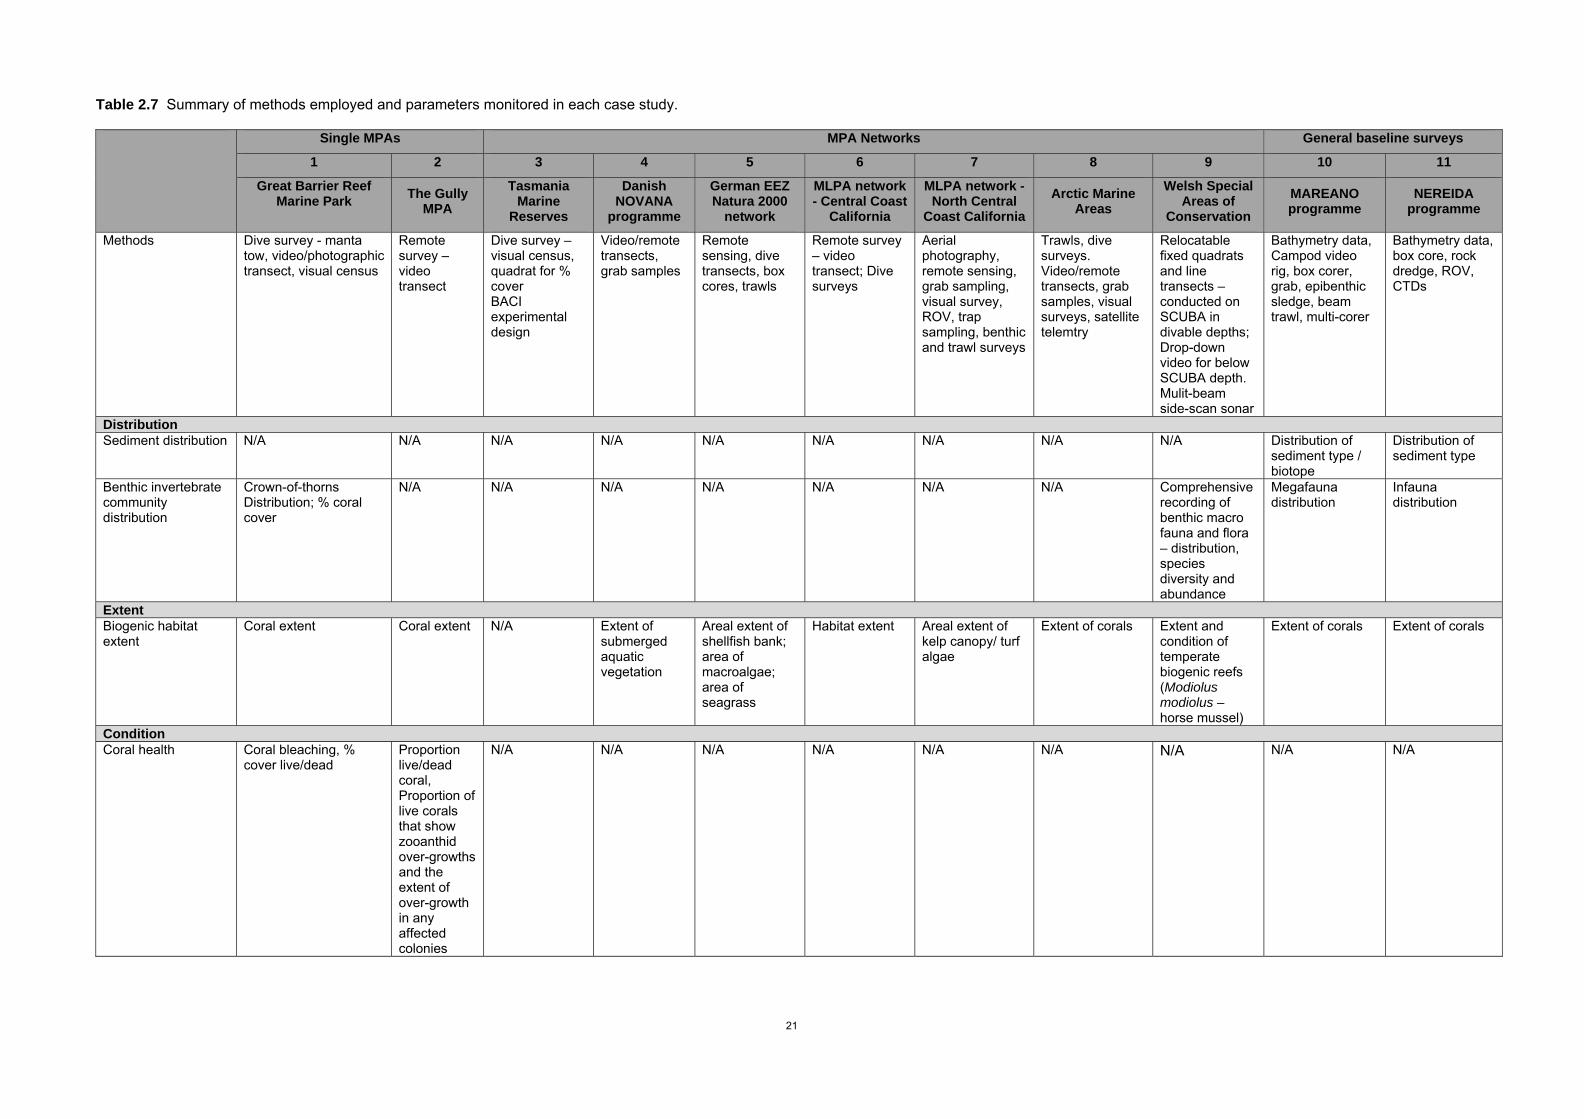
vi) Parameters monitored
Table 2.7 is a matrix of the parameters monitored in each case study along with the methods used in each case study. It is evident a that wide range of methods have been employed and/or proposed for monitoring seabed habitats of MPAs. Dive surveys are regularly used for shallow (<30m) depths, which are more often in inshore MPAs, while remote techniques and grab samples are used for depths >30m (generally offshore regions).
Parameters could be broadly categorized into those that could be used to monitor the Distribution, Extent or Condition of the seabed habitat. Although the habitat type and/or species monitored varied between MPAs, as would be expected, the parameters measured are relatively similar across all programmes.
21
Table 2.7 Summary of methods employed and parameters monitored in each case study. Single MPAs MPA Networks General baseline surveys
1 2 3 4 5 6 7 8 9 10 11
Great Barrier Reef Marine Park
The Gully MPA
Tasmania Marine
Reserves
Danish NOVANA
programme
German EEZ Natura 2000
network
MLPA network - Central Coast
California
MLPA network - North Central
Coast California
Arctic Marine Areas
Welsh Special Areas of
Conservation
MAREANO programme
NEREIDA programme
Methods Dive survey - manta tow, video/photographic transect, visual census
Remote survey – video transect
Dive survey – visual census, quadrat for % cover BACI experimental design
Video/remote transects, grab samples
Remote sensing, dive transects, box cores, trawls
Remote survey – video transect; Dive surveys
Aerial photography, remote sensing, grab sampling, visual survey, ROV, trap sampling, benthic and trawl surveys
Trawls, dive surveys. Video/remote transects, grab samples, visual surveys, satellite telemtry
Relocatable fixed quadrats and line transects – conducted on SCUBA in divable depths; Drop-down video for below SCUBA depth. Mulit-beam side-scan sonar
Bathymetry data, Campod video rig, box corer, grab, epibenthic sledge, beam trawl, multi-corer
Bathymetry data, box core, rock dredge, ROV, CTDs
Distribution Sediment distribution N/A N/A N/A N/A N/A N/A N/A N/A N/A Distribution of
sediment type / biotope
Distribution of sediment type
Benthic invertebrate community distribution
Crown-of-thorns Distribution; % coral cover
N/A N/A N/A N/A N/A N/A N/A Comprehensive recording of benthic macro fauna and flora – distribution, species diversity and abundance
Megafauna distribution
Infauna distribution
Extent Biogenic habitat extent
Coral extent Coral extent N/A Extent of submerged aquatic vegetation
Areal extent of shellfish bank; area of macroalgae; area of seagrass
Habitat extent Areal extent of kelp canopy/ turf algae
Extent of corals Extent and condition of temperate biogenic reefs (Modiolus modiolus – horse mussel)
Extent of corals Extent of corals
Condition Coral health Coral bleaching, %
cover live/dead Proportion live/dead coral, Proportion of live corals that show zooanthid over-growths and the extent of over-growth in any affected colonies
N/A N/A N/A N/A N/A N/A N/A N/A N/A

22
Single MPAs MPA Networks General baseline surveys
1 2 3 4 5 6 7 8 9 10 11
Great Barrier Reef Marine Park
The Gully MPA
Tasmania Marine
Reserves
Danish NOVANA
programme
German EEZ Natura 2000
network
MLPA network - Central Coast
California
MLPA network - North Central
Coast California
Arctic Marine Areas
Welsh Special Areas of
Conservation
MAREANO programme
NEREIDA programme
Biogenic habitat coverage
% cover macroalgae N/A % cover macroalgae
N/A Coverage (percentage of the total area of a shellfish bank occupied by shellfish beds)
N/A Cover of sessile structure forming invertebrates
N/A Extent and condition of temperate biogenic reefs (Modiolus modiolus – horse mussel); proportion live cover, plus epifaunal analysis
N/A N/A
Biogenic habitat structure/composition
Coral species composition/abundance (Reef fish species composition/ abundance)
Coral density and size structure by species, Coral diversity
N/A N/A Stocking density (percentage of the shellfish beds occupied by shellfish) Biomass (living weight) Abundance Length-frequency distribution (age structure); Macroalgae species inventory and abundance
N/A Density of hydrocorals, density of sessile structure forming invertebrates
Macroalgae Abundance Biomass (wet weight) Species composition Barcoding, other genomics
Proportion live cover of Modiolus modulus biogenic reefs Spat collection Period core samples taken for genetic profiling Side-scan sonar used to determine dynamic shift of reef movement; also used to assess trawl damage
N/A Concentration of sponges
Benthic invertebrate community composition
% cover sessile benthic organisms
N/A Megafaunal (>20mm length) invertebrate census
Abundance, species composition, biomass benthic invertebrates
Abundance, species composition, biomass benthic invertebrates (from samples), counts of easily identifiable macrofauna
Invertebrate species composition
Cover of encrusting invertebrates
Benthic meio-, macro- and megafauna: Abundance Biomass Species composition Barcoding, other Genomics, Diversity indices
Macro-faunal community structure determined – species diversity and abundance Sponge morphotypic diversity used as proxy for species diversity where appropriate
Mega/macrofauna composition
Infauna composition

23
Single MPAs MPA Networks General baseline surveys
1 2 3 4 5 6 7 8 9 10 11
Great Barrier Reef Marine Park
The Gully MPA
Tasmania Marine
Reserves
Danish NOVANA
programme
German EEZ Natura 2000
network
MLPA network - Central Coast
California
MLPA network - North Central
Coast California
Arctic Marine Areas
Welsh Special Areas of
Conservation
MAREANO programme
NEREIDA programme
Biological indicator species
Giant clams, crown of thorns starfish, Drupella spp. (gastropods)
N/A N/A N/A N/A N/A Red/purple sea urchin, owl limpet, ochre sea star, clam, sand crab abundance & size frequency; density of rock, sheep and box crabs
N/A Indicator taxa used where approrpriate. e.g. site specific sponges (proxy for species diversity on limestone reefs); Parazonathus axinellae (anemone used for edge of range assessment); Laminera spp. (kelp, used as proxy for water clarity). Periodic sampling of fish population distribution on reefs – diversity and abundance
N/A N/A
Sediment composition
N/A N/A N/A N/A Sediment grain size distribution Sediment structure Sediment type Sediment volume Substrate of the river and sea bed
N/A N/A N/A N/A Sediment composition; organic content
Sediment composition; organic content

24
2.3 Stage 3: Development of ‘good practice’ guidelines
2.3.1 Overview
This section provides good practice guidelines for monitoring MPAs and MPA networks in the UK. These guidelines are based on the strengths and challenges of monitoring programmes reviewed in 11 case studies from around the world, during Stage 2 of the project. This information was then evaluated for applicability to a UK context. In particular, the goal was to establish if the monitoring approach used would enable the acquisition of data required for reporting on UK conservation obligations, identified in project Stage 1. Only those aspects of the case studies’ monitoring programmes which were relevant to seabed habitats were assessed. Of the 11 case studies, five were MPA networks where monitoring is currently undertaken, two were an MPA network where monitoring is proposed, two were individual MPAs, and two were baseline surveys undertaken to inform future management or monitoring. The network examples were generally groups of MPAs which together are described as a network. Very few examples exist of comprehensive MPA networks designed from the outset to function as a network and where monitoring is undertaken to assess network functioning. This is a major gap in the current literature and body of knowledge, given the objectives of the UK MPA network. As an interim measure, the good practice guidelines presented here have been developed to emphasise consistency of monitoring between individual MPAs, to increase the likelihood of comparability both between individual sites and across an entire network. 2.3.2 Methodology
An inductive approach5 was undertaken using case studies to inform good practice recommendations. Firstly, a list of important elements that need to be considered when planning a monitoring programme was identified in consultation with JNCC. This list covers all areas addressed in the Addison (2011) review, although the wording and grouping differs and there are some additional elements which were considered. The monitoring programme elements reviewed: 1. Costs how costs are considered in the planning process 2. Objectives how they were developed, what they cover 3. Management use how results of monitoring inform management 4. Assessment and Analysis format and frequency of data analyses 5. Survey design monitoring stations, sampling intensity and frequency,
design 6. Parameters biological/abiotic parameters, seabed habitats 7. Survey techniques methods used, who conducted the monitoring 8. Dissemination and Reporting reporting of monitoring results, communication strategy 9. Data management data storage, accessibility, quality assessment/control In each case study, the monitoring programme was reviewed according to these elements, using a modified SWOT framework. This ensured a standardised approach to the review. SWOT analysis is a strategic planning method used to evaluate the Strengths, Weaknesses, Opportunities and Threats involved in a project by identifying the internal factors (strengths and weaknesses) and external factors (opportunities and threats) that are favourable and 5 Inductive reasoning moves from specific observations to broader generalisations and theories – i.e. using examples to understand general rules.

25
unfavourable to achieving a set objective. In this study, (S)trengths were reviewed, however, it was more constructive and appropriate to consider (W)eaknesses and (T)hreats together as (C)hallenges, since no monitoring approach reviewed was justified the label ‘weak’, but instead had some associated challenges and limiting factors to consider. Similarly, (O)pportunities were amended to the (A)pplicability of the monitoring approach to the UK offshore MPA network context. The framework is referred to throughout this report as ‘SCA analysis’. The SCA analysis was undertaken on each case study individually, and then results were combined in a single table, organised by the nine elements of the monitoring programme. The full results of the SCA analysis are presented in spreadsheet form, which is available from JNCC6. Recommendations for good practice for UK MPAs and MPA networks were distilled from the synthesis table of Strengths, Challenges and Applicability. 2.3.3 Good practice
Good practice recommendations are presented here for each of the nine monitoring programme elements, based on a synthesis across the case studies. The nine elements have been presented in a logical flow; starting by defining the overall financial constraints that limit the options for the monitoring programme. Please consider the remaining eight elements as part of a logical, stepwise planning process, starting with the ‘end goal’ of the monitoring programme - i.e. what it is ultimately trying to achieve. The approach taken at each step will depend on decisions in all preceding steps. Working backwards from the desired end-point enables constant verification that the choices made at each step will support the end-goal. Although total cost is considered as an up-front constraint, the resources available need to be reviewed at each step to ensure the intended approach taken is feasible. The proposed logical flow is depicted in Figure 2.2. We identified two primary options for how the monitoring programme is used to inform MPA management, which affects the choice of approach for each Monitoring Programme Element: 1. The programme is used to monitor trends and status against a reference condition.
This could be a reference site outside the MPA or a past baseline condition at a stated point in time; or
2. It is used to make a statistically robust experimental comparison between areas with different management protocols – e.g. zones within an MPA where permitted activities differ, or a comparison of areas inside and outside the MPA.
Recommendations are provided for both monitoring trends and status, and experimental comparison for each of the Monitoring Programme Elements. Although an ideal monitoring programme would be designed to enable both of these types of analysis, budgetary limitations may only allow for one of these options to be undertaken. Under the assumption of limited resources, the primary recommendation is to focus on monitoring trends and status, but incorporate key parameters into the overall monitoring programme that will enable experimental comparison when resources permit. An overview of the recommendations for each of the Monitoring Programme Elements, and how they differ between the two types of survey, is displayed in Table 2.8. Detailed
6 The database is available for download from the JNCC website: http://jncc.defra.gov.uk/page-2132 - see JNCC Report No. 460.
26
recommendations for each separate Monitoring Programme Element are provided in Sections 2.3.3.1 – 2.3.3.9. Each good practice recommendation includes: i) A short description of the recommended approach; ii) References to relevant sections of the SCA analysis, and list of case studies which
informed the recommended approach (further details supplied in Appendix 5); and iii) Shortfalls or lessons learned.
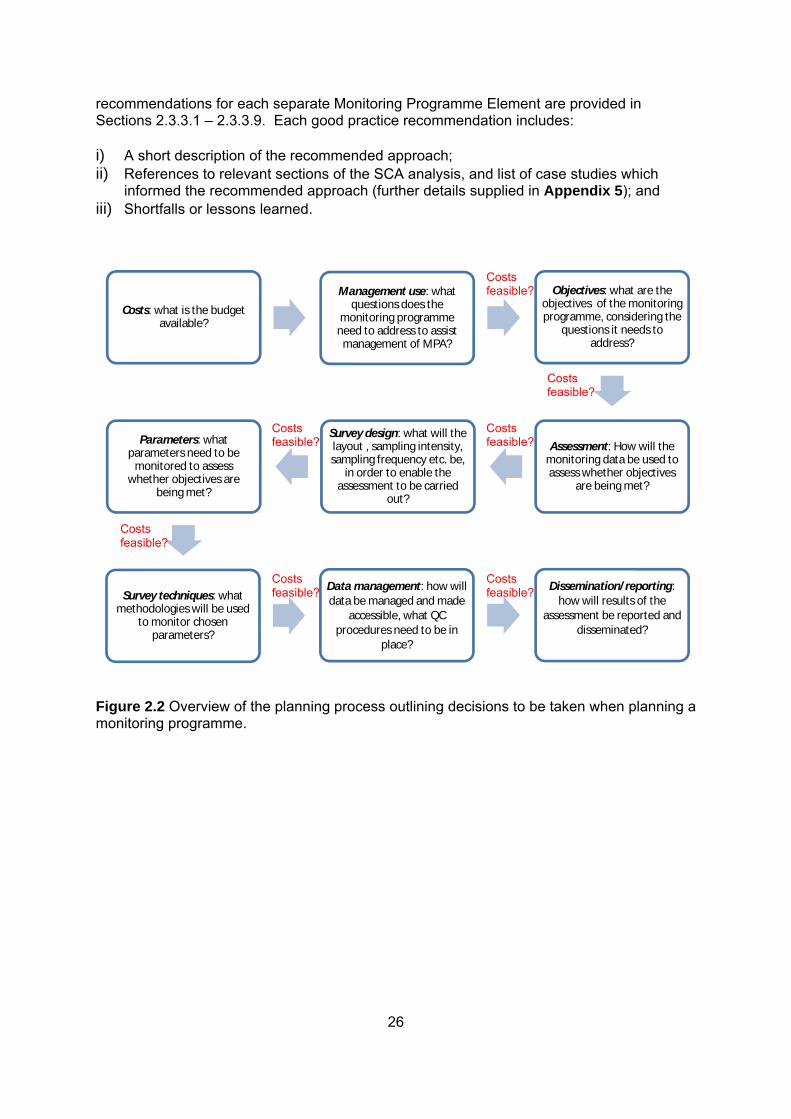
Figure 2.2 Overview of the planning process outlining decisions to be taken when planning a monitoring programme.
Costs: what is the budget available?
Management use: what questions does the
monitoring programme need to address to assist
management of MPA?
Objectives: what are the objectives of the monitoring programme, considering the
questions it needs to address?
Assessment: How will the monitoring data be used to assess whether objectives
are being met?
Survey design: what will the layout , sampling intensity, sampling frequency etc. be,
in order to enable the assessment to be carried
out?
Parameters: what parameters need to be
monitored to assess whether objectives are
being met?
Survey techniques: what methodologies will be used
to monitor chosen parameters?
Data management: how will data be managed and made
accessible, what QC procedures need to be in
place?
Dissemination/reporting: how will results of the
assessment be reported and disseminated?
Costs feasible?
Costs feasible?
Costs feasible?
Costs feasible?
Costs feasible?
Costs feasible?
Costs feasible?

27
Table 2.8 Summary of recommendations for different types of survey undertaken at different time frames. Type of survey Trends/ status Experimental comparisons
Management use
Assess whether state of benthic habitats within MPA are improving.
Compare to reference conditions (conditions at reference location outside MPA or from appropriate baseline).
Link between management regime and response can be inferred without explicit testing
Assess management effectiveness within the MPA by comparing managed and unmanaged areas.
Survey design Adequate coverage of all habitats within MPA. Reference site(s) for all habitats selected if required.
Number of stations required based on a sensitivity analysis.
Stations selected using a random stratified approach. Ideally, equal number of locations inside /outside of MPA, or in different zones. In general, a greater number of locations required per habitat compared with that required to assess trends/status.
Number of stations required based on a sensitivity analysis.
Assessment Look at temporal trends in parameters and compare current state with reference condition. Standardised assessment across network will allow comparison and overall assessment.
Simple statistical analysis of trends possible but not complex statistical comparisons between sites; expert opinion could also be utilised.
Assess if there is a statistically significant difference between stations inside and outside MPA; or between zones.
Consider assumptions/limitations of statistical analyses used.
Objectives Linked to management use: e.g. ‘monitor how trends in the extent of biogenic habitats within MPA differ from reference state’
Linked to management use: e.g. ‘assess the effectiveness of MPA management in preventing a reduction in the extent of biogenic habitat’

28
Type of survey Trends/ status Experimental comparisons
Parameters ‘Core’
• Habitat extent (estimate) • Habitat cover (percentage) • Proportion of live habitat-
forming species • Composition of dominant
habitat-forming species • Percentage cover /
abundance of focal epifaunal species
• Presence / absence of threatened species
• Infaunal community composition, abundance, and biomass
• Density / size structure of focal species
• Presence / absence of non-indigenous species
‘Additional’
• Aerial extent of habitats Percent cover / abundance of each threatened species
• Diversity / species richness of epifauna
• Abundance of non-indigenous species
• Larval dispersal
Selected parameters which can show a response to management e.g. Vulnerable habitat extent/condition in fisheries closure vs. outside MPA, infaunal community where sewage outflow is being managed vs. outside MPA
Methodology (shallow water; <30m)
In-situ visual SCUBA survey, plus epifaunal sampling
Grab sampling (where infaunal monitoring required)
Relevant methodologies listed for trends/status design

29
Type of survey Trends/ status Experimental comparisons
Methodology (deep water; >30m)
For ‘core’ parameters:
Underwater video photography towed transects plus stills, or ROV if resources allow for photography and epifaunal sampling
Grab sampling (where infaunal monitoring required)
For ‘additional’ parameters:
Remote sensing using side scan sonar/ bathymetry for habitat mapping Additional sampling methods for benthic fauna - epibenthic sledge, trawl Zooplankton sampling and population genetics
Relevant methodologies listed for trends/status design

30
2.3.3.1 Monitoring programme element #1: costs
The total budget that is available to those executing MPA monitoring will always be a limiting factor on the scope of a monitoring programme. The potential costs of various monitoring options needs to be defined in advance in order to select the best option using the available resources. If total budget is not known, the monitoring programme should be developed in a prioritised, modular way, to identify ‘minimum’ required components and costs, with additional optional modules that could be added if funds become available. Monitoring by its long term nature and desire to be consistent is particularly influenced by the stochastic variability the often encountered short-term funding of environmental monitoring. Some examples of the variation in costs for different programmes and are provided in Appendix 5. These provide context as to what the total budget for a monitoring programme might be in person days and/or monetary value. Note, budget availability impacts the approach taken for all remaining Monitoring Programme Elements, and cost implications will be considered in the following recommendations for each.
2.3.3.2 Monitoring programme element #2: MPA / MPA network objectives
A nested hierarchy of objectives is recommended. Objective-setting processes should be designed so that they enable a monitoring programme with targets and indicators that fulfil SMART principles (Specific, Measurable, Achievable, Realistic, Timebound) (Wood 2011). Three broad levels to the hierarchy are recommended: 1. Broad MPA network objectives 2. MPA-specific objectives 3. Monitoring programme objectives. A summary showing example suggestions for each level of objective is provided in Figure 2.3. These examples are given only to demonstrate the recommended approach to objective setting; they should not be considered to represent definitive wording. At the top level of the hierarchy are broad MPA network objectives to guide conservation management across the entire MPA network, based on conservation, assessment, and reporting obligations. All national, European, and international obligations should be reviewed and then prioritised according to their relative importance, compatibility, and the resource requirements associated with establishing an appropriate monitoring programme7. Some consideration of the scope of the monitoring programme is required; it could focus on obligations specific to MPAs, or incorporate broader obligations which apply to the whole of the UK waters (see Table 2.2 for details). Opportunities to link MPA and MPA network monitoring to broader environmental monitoring (e.g. Marine Strategy Framework Directive) should be identified and included if there is added value for money to be attained by doing so. MPA network objectives should include reference to the overall functioning of the network. Various sets of criteria have already been developed to guide MPA network design to ensure maximum benefits to conservation. For example, the Natural England/JNCC ecological network guidance for the MCZ project (Natural England/JNCC 2010) lists seven principles to consider in network design, of which appropriate representation, replication, adequacy, viability and connectivity could be potentially assessed through monitoring. A review of
7 JNCC is currently undertaking a review of all the UK’s conservation obligations; these will be presented in a separate report, due for release in 2012. The report could be examined to ensure objectives are adequate.

31
national and regional networks identified the key aspects covered by different sets of criteria as adequacy, representativity, resilience and connectivity (UNEP-WCMC 2008). The MPA network criteria listed in Annex II of CBD decision from COP-9 were representativity, connectivity, replicated ecological features and adequate and viable sites (UNEP/CBD/COP/DEC/IX/20). At the second level in the hierarchy, broad MPA network objectives should be refined into ‘SMARTer’, MPA-specific objectives. Objective-setting across MPAs with a given network should be standardised, to enable consistent monitoring programmes between sites, interoperability of datasets, and scaling up of assessments and reporting. As part of the MCZ project, Natural England and JNCC have developed detailed guidance for regional workshops to follow on setting conservation objectives which describe the desired ecological/geological state (quality) of a ‘feature’8 in order to standardise objective-setting across the UK (Natural England/JNCC 2010). This guidance provides a standard template for conservation objectives for each ‘feature’ (see information box in Appendix 1, Section A1.3.1). The template conservation objective is generally in accordance with the SMART principles; it is Specific as attributes and parameters to be managed are specified, it is largely Measurable as progress towards a ‘favourable condition’, which is itself defined, can be monitored, and it is Timebound as it is specified that this should be ‘achieved by 2020 and maintained thereafter’. However, it is difficult to assess how Achievable and Realistic the objectives are as they focus on achieving a biological response. An objective which depends on a level of biological response is not necessarily realistic, due to the level of uncertainties associated with demonstrating a causative relationship between management action and biological response. It may therefore also not be achievable to assume it is possible to achieve favourable condition within the given timeframe. The JNCC conservation objective template is most appropriate for developing MPA network objectives. MPA-specific objectives should focus on what is achievable and realistic within the scope of MPA management. SMART MPA-specific objectives should relate to managing threats, as specific management actions can be devised far more easily to regulate these directly. The Natural England/JNCC conservation objective template could be adapted to enable this, by focusing on protecting habitats from specified human impacts, in order to promote ‘favourable condition’. This template could then be used to set MPA-specific objectives, which would be similar across all MPAs, but different threats and ‘features’ would apply (see example suggestion in Figure 2.3). A standard list of defined ‘features’, human activities and parameters should be produced, as well as standard definitions for vocabularies used. At the third level, monitoring programme objectives are required to outline what the monitoring programme should do in order to assess whether MPA-specific objectives have been met (example suggestion provided in Figure 2.3). Under the scope of the current project, suggested monitoring programme objectives are limited to seabed habitat monitoring, and do not consider other ‘features’. The monitoring programme objectives could take the form of a series of questions which need to be answered. The SMART principles still apply so the questions asked should be Specific, Measurable, Realistic and Achievable, and answered within a specified timeframe. These questions should include asking the status and trends of parameters and how parameters have responded to management measures. Questions should also ideally aim to address whether MPA network objectives regarding the effectiveness of the MPA network as whole are being met. Knowledge is still developing as to how best to monitor network functioning, and
8 A habitat, a species, a geological formation or a geomorphological process for which MCZs are designated.

32
consideration should be given as to the feasibility of assessing whether these network criteria are being met when setting monitoring objectives.
Figure 2.3 Diagram showing the objective hierarchy. Example ‘objectives’ are presented. Case studies which informed the development of recommended approach • Case Study 1: Great Barrier Reef Marine Park • Case Study 2: Gully MPA • Case Study 4: Danish NOVANA programme Detailed examples of approaches taken by the case studies which informed the recommended approach are provided in Appendix 5. For relevant sections of the SCA analysis see Rows 3 to 7 in the supplementary electronic Excel spreadsheet. See Appendix 4 for case study fact sheets. Examples of lessons learned (‘pitfalls’) • Many case studies set objectives, but the monitoring programme is not designed to
determine if all of them are being met. This most frequently relates to objectives regarding socio-economic factors which are rarely assessed. Objectives should not be included if they do not adhere to SMART principles, i.e. if it is not achievable/realistic to monitor whether they are being met in a set time frame.
• Setting threshold values for biological parameters would substantially improve MPA management as they could be used to trigger a management response if the lower threshold is exceeded. Threshold values would also simplify assessment of whether ‘favourable condition’ is achieved. However, it can be difficult to set appropriate targets and an inappropriate threshold could result in inaccurate assessments of status, in turn
MPA network
•Protection and conservation of the marine environment in a network of MPAs which ensures representativity, replication, adequacy, viability and connectivity
•[All / Selected] national, regional and international conservation obligations are met
MPA-specific
•[Eliminate / reduce / maintain impact of] [insert human activities] on [insert name of feature] by [insert date], with the aim of achieving favourable condition, such that the [insert parameter(s)] representative of the [feature] in the biogeographic region are all [maintained or recovered].
•Use this template to define objectives for each MPA inserting words where necessary. One objective written per feature present in MPA.
Seabed habitat monitoring
•Every [x] [years / months / within timeframe of management plan], monitor the trends and status of [insert seabed habitats] in order to answer: •are habitats at favourable condition, and what are the trends in condition?•how do MPA management measures affect habitats?•does the MPA network ensure representativity, replication, adequacy, viability and connectivity, [other network features]?

33
causing the implementation of an incorrect management response. For example, a target was originally set for the Lundy MCZ of the proportion of Laminaria hyperborea to L. ochroleuca within the kelp forest community. This target resulted in the feature being regarded as unfavourable in a following monitoring survey, but authors of the survey report call into question the validity of this target (Irving 2011).
• Many MPA programmes have conflicting objectives, particularly between socio-economic and conservation objectives, which complicates setting management priorities.
2.3.3.3 Monitoring programme element #3: management use
The process of planning a monitoring programme needs to be guided by how the data will ultimately be used to inform MPA management. Monitoring data could be used to assess the effects of management actions in the MPA, and whether objectives are being met, in two main ways: 1. Review data on trends and status to predict whether parameters have improved in areas
where threats are managed, and then relationships would be inferred by looking at spatial trends and using expert judgement.
2. Use statistical analyses to assess where managed areas are significantly different from unmanaged areas.
Ideally both approaches are possible, but in reality resource constraints are likely to limit the choice to one or the other. The implications of which option is selected on type of assessment or analysis possible, survey design and parameters are explored in the following sections. The intended use of monitoring data will guide the scope of the programme. Seabed habitat monitoring can be used to assess progress towards achieving favourable status; however, additional monitoring of human activities is needed to fully address whether MPAs are successful at protecting habitats from human impacts, which is outside the scope of this project. The MPA-specific objectives (see Element 2) would be met if MPAs effectively managed human activities as planned. The status and trends of seabed habitats would indicate if meeting these objectives resulted in the desired biological response. The MPA network management cycle should be every six years so it is aligned with other relevant network-wide assessment cycles, such as the MSFD and WFD. At the MPA level, the monitoring cycle should be sufficiently frequent to enable change to be detected within the timeframe of the management plan. Results for each MPA should be reviewed after each monitoring event. Although it is unlikely that management will change dramatically within the timeframe of a given management cycle, monitoring within that timeframe will enable a proactive response if a dramatic change is observed in a particular parameter. This process does not have to be part of an official network-wide reporting exercise, but purely undertaken to assist management. Results for each monitoring cycle could then be collated for a network-wide assessment and reporting exercise every six years. In order for a monitoring programme to provide value for money it is vital that results are used as part of an adaptive management cycle in which lessons learnt are used to inform and improve management. Results should be used to assess whether management zones are in the best area to cover sensitive habitats and to inform the design of the network. The monitoring plan should also be revised based on results, with the objectives, survey design, parameters and survey techniques altered if it is apparent that they are not appropriate.

34
A thorough assessment of MPA effectiveness includes addressing socio-economic factors in addition to biological parameters9. There are a number of tools available, such as the IUCN ‘How is your MPA doing’ guidelines (Pomeroy et al 2004), however, it is unlikely that resources will allow a complete assessment such as this, and an assessment may have to focus on select parameters. Developing a monitoring programme to enable a complete management effectiveness assessment is beyond the scope of this project, as many aspects are not considered, in particular the economic and governance aspects. The seabed habitat monitoring programme developed should be checked for compatibility with a broader management effectiveness assessment if one is desired. Case studies which informed the development of recommended approach • Case Study 1: Great Barrier Reef Marine Park • Case Study 11: NEREIDA programme Detailed examples of approaches taken by the case studies which informed the recommended approach are provided in Appendix 5. For relevant sections of the SCA analysis see rows 9 to 14 in the supplementary electronic Excel spreadsheet. See Appendix 4 for case study fact sheets. Examples of lessons learned (‘pitfalls’) • Frequently, especially for offshore sites, national monitoring is used purely to fulfil
reporting requirements and results are not used to guide management, thereby limiting the value of spending resources on monitoring.
• Ad hoc scientific surveys are sometimes undertaken by academics but results are not then made available to relevant authorities in charge of management.
2.3.3.4 Monitoring programme element #4: assessment and analysis
Planning A sensitivity (power) analysis should be conducted as part of planning process. Sensitivity analyses enable cost-benefit tradeoffs to be examined between the risk of committing Type I10 or Type II11 errors, desired magnitudes of anticipated change to be detected (effect size) and sampling regime (e.g. sample size). Hence a monitoring programme can then be designed to meet its objectives with acceptable levels of power, within the means of available resources. Sensitivity analyses require an estimate of variability in the system. This can be estimated from baseline surveys (if available) or from studies in similar systems. Post-hoc sensitivity analyses are recommended for programmes already in place to enable similar cost-benefit trade-offs to be assessed and the monitoring programme amended if necessary. If objectives are related to minimising impacts on a system, the costs of both types of errors needs to be evaluated (Di Stefano 2003, Fairweather 1991, Underwood 1993). Quantifying and balancing these costs can be complicated and is more often a political exercise rather than a statistical one. Results of sensitivity analyses will influence decisions made for spatial survey design, and temporal scale (see Element 5). Decisions on survey design effect which analyses can be performed on monitoring data, so it is best to work backwards and decide what kind of analysis is required for an assessment and then select the appropriate survey design bearing in mind the results of the sensitivity analysis. These decisions may have to be revised as the requirements of statistically robust tests can render the survey unfeasible within a limited budget (see Element 5 for further discussion). We have identified two main types of assessment available: reviewing simple patterns in trends and status compared to a 9 Defra have commissioned a report for 2012 which will assess management effectiveness of European Marine Areas in England, which could potentially be adopted for all MPAs. 10 The probability of rejecting the null hypothesis when it is true – i.e. when it is mistakenly concluded that there is an effect. 11 The probability of not rejecting the null hypothesis when it is false – i.e. when an effect goes undetected.

35
reference condition to imply relationships with management, or making experimental comparisons between areas using robust statistical analyses to test for significant differences. The second approach allows results to be analysed to find cause and effect relationships between management actions and response in biological parameters, and more complex relationships involving multiple parameters can be explored. Further details on these two approaches are provided below. Assessment of status and trends Ultimately, monitoring data will be used to detect trends in MPAs or MPA networks through time and space, and assessed against known impacts or management/mitigation actions. To track and assess trends through time, it is recommended that indices – such as species diversity, species richness, habitat extent – are used or developed from parameters that are monitored (see Element 6 for further discussion on selection of parameters). The state of the MPA can then be inferred by assessing whether these indices show increasing or decreasing trends. Such indices can also be compared to a baseline or reference site to determine if there has been change over time, or between locations. This will require statistical tests such as correlation analysis or linear mixed effect models (LMEs) to determine if there has been significant change, or it could be assessed by reviewing patterns and inferring relationships using expert judgement. Assessing trends and status using expert judgement is sufficient to meet reporting obligations including for: Article 17 of the Habitats Directive, Biodiversity Action Plans (BAP) for the CBD, the WFD, the MSFD, Marine and Coastal Act and Marine Act Scotland, and the Wildlife and Countryside Act. Status can be judged against a reference condition (e.g. Habitats Directive), targets or thresholds set for certain parameters (e.g. MSFD), or simply gauged using expert judgement (e.g. recent reporting for UK marine BAPs). Reporting using the UK’s Common Standards Monitoring also only requires the assessment of status and trends against a reference condition. Assessment of experimental comparisons Assessment of areas within an MPA with different management regimes, or comparing sites inside an MPA to those outside of it need to be carefully planned in advance to ensure sufficient and appropriate data is collected for subsequent analysis. The implications of selecting this type of assessment on survey design are discussed further in Element 5. During the analysis stage, a variety of statistical tests can be used. For example, Analysis of Variance (ANOVA), General Linear Models (GLMs) and LMEs can be utilised to test for differences between areas. Cluster analysis, multi-dimensional scaling (MDS) or similarity of percentage variance (SIMPER) can be used to test for statistical differences in community structure. De-trended component analysis (DCA) can be used to identify species groups, followed by supervised GIS classification to map biotopes. Network assessment Network-wide assessments should be undertaken on a six-yearly cycle to coincide with the reporting timeframes of most major national and international Directives and legislation relevant to the UK (e.g. the Marine and Coastal Access Act, the Marine Act Scotland, Article 17 of the Habitats Directive, the WFD, and the upcoming MSFD). It is recommended that results from across the network are standardised to facilitate simple and straightforward comparisons. In all instances, whether assessing status and trends, differences between sites, or conditions across the network as a whole, data quality and the level of certainty associated with it, needs to be made explicit.

36
Case studies which informed the development of recommended approach • Case Study 1:Great Barrier Reef Marine Park • Case Study 5: German Natura 2000 monitoring • Case Study 7:North Central Coast California • Case Study 8: Arctic Marine Areas Detailed examples of approaches taken by the case studies which informed the recommended approach are provided in Appendix 5. For relevant sections of the SCA analysis see rows 16 to 31 in the supplementary electronic Excel spreadsheet. See Appendix 4 for case study fact sheets. Examples of lessons learned (“pitfalls”) • Failure to conduct sensitivity analysis to identify appropriate sampling size, intensity, and
frequency can make detecting change difficult or impossible, meaning that resources spent on monitoring are wasted. This is particularly important to prevent the failure of detecting Type II errors, which can result in serious long-term and potentially irreversible damage.
• Data that cannot be easily interpreted will rarely be used by decision makers, so planning out the desired key messages of an assessment report is important.
• ‘Overfitting’ the statistical test to the data available. If the number of replicates surveyed are insufficient for a test then it is unlikely to result in any statistically robust results, particularly in a heterogeneous environment where numerous environmental factors, other than management measures, will influence results. For example, the report of monitoring in Jurien Bay, Tasmania (Edgar et al 2009) concluded ‘the lack of overlap in reef communities between sanctuary zones and scientific reference zones complicated analysis of effects of restrictions on fishing that were enacted in these two zone types…very few observable ecological changes associated with new fishing restrictions were identified’ (see Assessment and Analysis section in Appendix 5 for details).
2.3.3.5 Monitoring programme element #5: survey design
Spatial design An appropriate survey design should be based on: 1. The SMART objectives of the monitoring programme (cascading up to SMART MPA and
MPA network objectives); 2. How results will be used to inform management, and 3. The type of analysis selected for developing assessments (see Elements 2-4). Regardless of the type of survey design chosen, it should ensure: a) representative coverage of the range of features found in the MPA; b) replication of each seabed habitat present relative to the size of the feature; and c) adequate coverage of other potential sources of seabed variation within the MPA such as depth. The survey design should have fixed sampling locations where all parameters are monitored, rather than monitoring different parameters at different locations as part of separate monitoring programmes. The latter option may save resources by ‘piggy-backing’ onto other monitoring programmes but consistency and comparability would be lost. An integrated monitoring programme with fixed sampling locations would reduce the total vessel time needed and also allow a more holistic view of the state of the ecosystem at selected locations. Ideally the survey design will allow experimental comparison of trends and status of all parameters between locations inside the MPA and reference locations outside the MPA. Survey design should also allow a comparison of different management zones. However, the results of the sensitivity analysis undertaken (see Element 4) is likely to indicate that the

37
survey design necessary to perform an experimental comparison is unfeasible as the number of monitoring locations or events required to run tests with sufficient power exceeds what is possible within the available budget. In scenarios of resource limitation, resources should be focused on monitoring trends and status only. This is because there are substantial costs to meeting the requirements to ensure a statistically robust experimental comparison. It is very difficult, if not impossible, to reduce to a ‘compromise’ solution that maintains statistical robustness and conduct an experimental comparison within a realistic budget. For example, reducing the number of monitoring locations might lower the costs, but the types of statistical analyses possible would quickly become very limited, and relationships between management and biological response could only be inferred, largely undermining the purpose of taking that sampling approach. Case studies indicate that the experimental comparison approach is generally only attempted for scientific studies focused on a limited number of parameters in a single MPA or small area. The high level of replication required for statistically robust experimental comparisons means it is rarely attempted for large scale or national programmes. Large scale programmes generally assess status and trends within the MPA. Differences in parameters between managed and unmanaged areas can be reviewed to infer whether management is successful without validating assumptions with statistically robust tests. Survey design for a UK wide monitoring programme should predominantly focus on status and trends monitoring, but a small number of parameters which would show a response to key management actions (e.g. no take zones) could be monitored in addition as ad hoc investigations using experimental comparison. Further details on survey design for each of these two approaches is provided below. i) Experimental comparisons – impact of management on ecosystem condition The survey design for monitoring the effects of MPA management needs to be considered carefully. Statistically valid survey designs require randomization in the location of “control” and “treatment” sites (e.g. by stratified random sampling), along with replication in either or both kinds of sites (Kenchington 2010). To undertake this approach to selecting monitoring location, habitats could be divided into units of the same size, and a set number of units selected at random for monitoring. A number of replicates would be positioned randomly within each unit. The number of replicates should be adequate, based on results of a sensitivity analysis. The same number of replicates should be taken in each MPA to allow comparison. The “control” site needs to be selected carefully to ensure there are no major ecological differences to the “treatment” site within the MPA. The “control” site could be an area which is ecologically similar, but where no management of threats is being undertaken. Alternatively, it could be a reference area which is considered an example of ‘good’ status or baseline conditions where threats are absent. For new MPAs, such as the proposed MCZs, monitoring should begin prior to management measures being put in place. This would allow the use of a Before, After, Control, Impact (BACI) assessment (Green 1979), or a beyond-BACI assessment (Underwood 1992) which compares one or more impacted sites with multiple control sites before and after impact has occurred. ii) Trends and status Trends and status monitoring is designed to assess change in ecosystem condition over time compared to a defined reference condition. This will enable assessment of broad ecosystem change within the MPA or network, in response to cumulative impacts, and may be useful for broader reporting obligations, e.g. to the MSFD. There are no limitations on the

38
location or number stations, but there are a number of considerations to ensure an effective survey design within a limited budget. Where existing monitoring is taking place the survey design should be reviewed for applicability to the proposed approach, and where possible stations retained to generate long time series data. Stations should be located in the full range of habitat types within the MPA to ensure representative sampling, and a minimum of two sites for each habitat should be surveyed to ensure adequate levels of replication. The accuracy of any assessment will increase with number of replicates, so there should be as many as the budget allows. Any spatial gaps or unrepresented habitats should be filled with additional new stations, and if existing stations are in decline, they should be replaced with new ones. Where resources are limited, sampling stations should be prioritised in, a) sensitive habitats which are vulnerable to identified current or future threats, and b) habitats that require monitoring to meet conservation obligations. Monitoring status requires a reference condition to be defined. This could be a target value for certain parameters, a baseline state from past monitoring within the MPA, or a reference location outside of the MPA. Temporal scale It is recommended that an assessment on the UK networks as a whole (see Element 4) should be undertaken every six years, thereby mapping on to reporting obligations of the majority of regional initiatives and UK legislation. There is a four year reporting cycle for BAP habitats to the CBD which will have to be undertaken separately. The UK wide assessment will utilise monitoring data collected within the reporting cycle period; ideally this would comprise six years of annual monitoring, but if resources are limited fewer monitoring cycles could be possible, with a minimum of one every six years. Several monitoring events should occur within each six year assessment and reporting cycle, as data for several points in time is required to establish trends. The frequency of monitoring should be decided based on the results of a sensitivity analysis (see Element 4), to ensure monitoring is at an appropriate frequency to detect change. Repeating monitoring cycles as regularly as possible will enable decision makers to react quickly to adapt management based on findings (see Element 2). Biannual monitoring is ideal to show seasonal changes, but no case studies were able to maintain this long term and it is unlikely to be feasible with limited resources. Considering these factors it is recommended that monitoring is undertaken every 1-3 years, considering the results of a sensitivity analysis. Some parameters may be particularly costly to survey, and may not be able to be monitored every monitoring event (see Element 8 for further discussion). In this case they should be monitored as frequently as possible, or as necessary to detect change. Case studies which informed the development of recommended approach • Case Study 1: Great Barrier Reef Marine Park • Case Study 6: Central Coast California • Case Study 8: Arctic Marine Areas. Detailed examples of approaches taken by the case studies which informed the recommended approach are provided in Appendix 5. For relevant sections of the SCA analysis see rows 33 to 50 in the supplementary electronic Excel spreadsheet. See Appendix 4 for case study fact sheets. Examples of lessons learned (‘pitfalls’) • Monitoring different parameters in different locations during separate surveys. Should be
avoided. However it appears that many programmes do combine the results of multiple monitoring surveys that focus on different parameters, e.g. as proposed for Arctic Marine
39
Areas. The primary shortfalls of this approach are patchiness of data in space and time, inconsistency of measurements, and variation in survey methodology.
• Setting up statistically invalid experimental comparisons and potentially wasting limited resources. The choice needs to be made to invest fully in a statistically robust approach (and bear the costs of doing so), or to not undertake such comparative monitoring, and instead focus utilising resources on conducting robust baseline and trends monitoring at fixed sites.
• Experimental comparisons are not appropriate if parameters selected are proven to show a response to management – e.g. as stated in the background paper for the Gully MPA monitoring programme, the difference in abundance estimates between areas inside and outside of an MPA is unlikely to be recorded for mobile species with ranges larger than the MPA (Kenchington 2010).
• A review of MPA effectiveness research undertaken throughout the Mediterranean (Fraschetti et al 2002) found that effectiveness had rarely been demonstrated due to lack of appropriate sampling designs. Field investigations were generally confounded by ecological differences between sites, lack of reserve and site replication, and lack of knowledge of biota before reserve establishment. This shows that a complex survey design is required for experimental monitoring, and this should not be attempted unless survey design requirements can be met as analyses will not produce useful results.
2.3.3.6 Monitoring programme element #6: parameters
Across an MPA network, it is reasonable to assume that subsets of MPAs will share subsets of habitats. The parameters selected to monitor these habitats within MPAs and across the network should therefore be standardised, to ensure monitoring is comparable between MPAs and across the network or networks. A standardised and prioritised ‘master list’ of possible parameters to choose to monitor in any given MPA should be compiled. Having established SMART objectives, the parameter selection process should be easier, more targeted, and more likely to generate comparable, scalable, and meaningful assessments of change. The master parameters list should be devised to ensure that all possible objectives can be assessed. Parameters should each have clear definitions, with units for measurement, and recommended monitoring methodology. The process to define the master parameter list will need to be an iterative one, considering both the full complement of possible MPA and network objectives, priorities for reporting and assessment, and anticipated resources for monitoring. It is reasonable to expect the parameter list to grow over time, although this should be avoided if possible to maintain comparability of datasets through time. A well-prioritised selection of parameters will enable the establishment of a targeted and consistent monitoring programme. In order to develop the master parameter list, a list of all predominant habitats present across the entire MPA network should be compiled, based on standard definitions12. The reporting sheets for the MSFD will provide definitions of predominant habitats types based on European Nature Information System (EUNIS) classifications; these definitions are recommended for use to streamline MPA monitoring with MSFD. The MCZ ecological network guidance (Natural England/JNCC 2010), uses EUNIS level III classifications for predominant, or ‘broad-scale’ habitats, which do not match exactly with the MSFD classifications.
12 The UK’s Common Standards Monitoring JNCC 2004. Common Standards Monitoring Guidance. Joint Nature Conservation Committee. Peterborough, UK. [online]. Available from: [Accessed. should be used as a basis for compiling a master parameter list. These standards currently contain specific guidelines which cover inshore habitats listed in the Habitats Directive, and should be expanded to include the full range of features occurring in UK waters, including those offshore. It should also be noted that the categorisation of predominant habitats differs slightly from the MSFD categories.
40
Monitoring could occur at the level of predominant habitats, or alternatively important sub-habitats within them. There are numerous lists of important habitats to be conserved and monitored such as the Habitats Directive Annex I habitats, BAP habitats under the CBD and OPSAR threatened and declining habitats. MCZ guidance (Natural England/JNCC 2010) defines a list of ‘Features of Conservation Importance’ (FOCI) which include habitats covered by various lists. Monitoring could occur at the level of these FOCI, although habitats not included in this list would then be avoided in the monitoring programme. Once the list of predominant habitats, or important sub-habitats, has been compiled, the key ‘attributes’ of each should be assigned. Attributes are ‘characteristics of a feature that describe its condition, either directly or indirectly’ (JNCC 2004). For each key attribute, parameters should then be designed to assess whether or not the objective of interest is being met. It is reasonable to assume that more than one parameter may be required in the master list for a given attribute. Some parameters may also involve the selection of focal species to be used as indicators for key attributes which are difficult to monitor as a whole, e.g. monitoring changes in trophic structure. The master parameter list should also specify focal species for each habitat, to ensure comparability of monitoring between sites; these focal species should be common across all UK MPAs. Key considerations in selecting focal species include: important ecological role, fast or slow response to protection (i.e. recovery rates), life history characteristics. Table 2.9 provides some examples of attributes and parameters which could be selected to meet reporting requirements. The table shows which parameters are relevant for monitoring predominant habitats (MSFD classification) and sub-habitats (MCZ FOCI). Parameters are divided by those considered feasible for a regular ‘core’ monitoring programme, and more aspirational parameters that would provide more accurate information and could be monitored less frequently whenever resources permit. This suggested list is not exhaustive, and further parameters may need to be added following a full review of conservation obligations. Additional parameters would be needed to fulfil all seabed monitoring requirements under OSPAR, WFD, and MSFD that do not focus on habitats, such as the concentration of contaminants in sediments and biota. Parameters for monitoring the water column and associated species could also be incorporated into an MPA monitoring programme to fulfil other requirements.

41
Table 2.9 Summary of suggested attributes and parameters.
Relevant predominant
habitats*
Relevant FOCI†
Attribute Parameter Relevant UK reporting
requirement‡ Suggested parameters for core monitoring programme All 1-4, 6-9,
12,14,16-17
Biogenic sub-habitat (for each present)
Habitat extent (estimate) a – d, g - j Habitat percentage cover a – d, g - j Proportion of habitat-forming species live or dead
a – d, g - j
Composition of dominant habitat-forming species
a – d, g - j
Percentage cover / abundance of focal epifaunal species
a – d, g - j
All 5, 10-11, 13, 15, 18-22
Non-biogenic sub-habitat (for each present)
Habitat extent (estimate) a – d, g - j Habitat percentage cover a – d, g - j Percentage cover / abundance of focal epifaunal species
a – d, g - j
All All Threatened species
Presence / absence of threatened species
a, c, d, e, g
2, 5, 6, 7, 10, 11, 12, 14, 16, 17
13, 15, 18, 21, 22
Ecosystem structure
Infaunal community composition, abundance, and biomass
b, d, f, h, i, j
All All Density / size structure of focal species
b, d, f, g, h, i, j
Presence / absence of non-indigenous species
b, g
Additional parameters for monitoring when resources available 13 2, 5, 6, 7, 10, 11, 12, 14, 16, 17
1-4, 6-9, 12,14,16-17
Biogenic sub-habitat (for each present)
Areal habitat extent a – d, g - j
All 5, 10-11, 13, 15, 18-22
Non-biogenic sub-habitat (for each present)
Areal habitat extent a – d, g - j
All All Threatened species
Percent cover / abundance of each threatened species
a, c, d, e, g
All All Ecosystem structure
Diversity / species richness of epifauna
a, g, h, i
All 13, 15, 18, 21,22
Diversity / species richness of all benthic fauna including infauna
a, g, h, i
All All Abundance of non-indigenous species
b, g
All All Network functioning
Larval dispersal a, c,
13 Parameters are listed as additional if the survey methodology required is very costly.

42
* List of predominant habitats † List habitat features of conservation interest (FOCI)14
‡ List of initiatives with relevant reporting obligations
1. Littoral sediment 2. Shallow sublittoral rock
and biogenic reef 3. Shallow sublittoral coarse
sediment 4. Shallow sublittoral sand 5. Shallow sublittoral mud 6. Shallow sublittoral mixed
sediment 7. Shelf sublittoral rock and
biogenic reef 8. Shelf sublittoral coarse
sediment 9. Shelf sublittoral sand 10. Shelf sublittoral mud 11. Shelf sublittoral mixed
sediment 12. Upper bathyal rock and
biogenic reef 13. Upper bathyal sediment 14. Lower bathyal rock and
biogenic reef 15. Lower bathyal sediment 16. Abyssal rock and biogenic
reef 17. Abyssal sediment
1. Blue mussel beds 2. Cold-water coral reefs 3. Coral gardens 4. Deep-sea sponge aggregations 5. Estuarine rocky habitats 6. File shell beds 7. Fragile sponge and anthozoan
communities 8. Honeycomb worm reefs 9. Horse mussel beds 10. Intertidal underboulder
communities 11. Littoral chalk communities 12. Maerl beds 13. Mud habitats in deep water 14. Native oyster beds 15. Peat and clay exposures 16. Ross worm reefs 17. Seagrass beds 18. Sea pen and burrowing
megafauna communities 19. Sheltered muddy gravels 20. Subtidal chalk 21. Subtidal sands and gravels 22. Tide swept channels
a) Convention on Biological Diversity
b) Ramsar Convention c) OSPAR Convention d) Habitats Directive e) Birds Directive f) Water Framework Directive g) Marine Strategy Framework
Directive h) Marine and Coastal Act i) Marine Act (Scotland) j) Wildlife and Countryside Act
The parameter choice will depend on the objectives of the monitoring programme and how results will be used to inform management (see Elements 2 and 3). Any parameters, including all those listed in Table 2.9, could potentially be selected to monitor the status and trends of various attributes within the MPA, although these should be prioritised according to those which are necessary to meet reporting obligations for MPAs (see Table 2.2). Parameters necessary to meet broader reporting requirements for the entire UK waters, such as the MSFD, could be included in an MPA monitoring programme if resources allow. The parameters selected for each MPA will depend on the management measures in place (e.g. a parameter sensitive to bottom trawling is only relevant in an MPA where restrictions on bottom trawling are in place). The parameters monitored to make an experimental comparison between managed and unmanaged areas will be a subset comprising those which show a specific response to the management in place within an appropriate timeframe. All parameters listed in Table 2.9 could potentially be used to assess management effectiveness, but the habitat or focal species chosen should be known to respond to management measures in place. This subset would be monitored following a specific survey design in order to allow experimental comparison (see Element 5); it may be that they are monitored in a small number of stations as part of regular ‘status and trends’ monitoring, and more intensively at some locations as part of an ad hoc experimental comparison.
14 Taken from Marine Conservation Zone Project Ecological Guidance NATURAL ENGLAND/JNCC 2010. Marine Conservation Zone Project: ecological network guidance. Natural England/JNCC. [online]. Available from: http://www.naturalengland.org.uk/Images/100608_ENG_v10_tcm6-17607.pdf [Accessed 26/01/12].

43
Case studies which informed the development of recommended approach • Case Study2: Gully MPA, • Case Study 5: German Natura 2000 monitoring, • Case Study 7: North Central Coast California, • Case Study 8: Arctic Marine Areas. Detailed examples of approaches taken by the case studies which informed the recommended approach are provided in Appendix 5. For relevant sections of the SCA analysis see rows 33 to 81 in the supplementary electronic Excel spreadsheet. See Appendix 4 for case study fact sheets.
2.3.3.7 Monitoring programme element #7: survey techniques
Methodology The sampling methodology should be appropriate to the habitat. All sediments can be monitored by video photography. Box core or grab sampling of infauna can be undertaken only for soft sediments. Epifaunal samples can be taken on hard substrates by hand or using Remotely Operated Vehicles (ROVs) to aid identification. Where invasive methods are employed, video should be conducted first to check for sensitive habitats or obstructions. Costs have a significant bearing on which method is used, and whether or not a parameter can be surveyed. In Table 2.9, some parameters were listed as ‘additional’ because the survey methodology required is very time consuming and costly. For example, surveying the entire areal extent of habitats requires many boat days, highly trained staff, expensive equipment and significant time for data analysis. When planning which parameters to select, all inherent costs (equipment, running costs, staff days for monitoring and data interpretation) and survey options should be reviewed to ensure they are feasible within the available budget. Conducting both grab sampling and video/visual survey will increase survey days, so the relative benefit of conducting sampling to the increased costs should be considered. The analysis of samples can require more than three times the days as video analysis (see example in Table A5.1.1). Different methodologies are possible at different depths; recommended methods for both shallow and deep water are provided below and summarised in Table 2.10. Costs are described from low to very high to provide a ballpark estimate of relative resource requirements, however, note, these should be assessed in detail during the planning process. The estimates consider costs for undertaking monitoring and processing samples/data. i) Shallow water only (<30m) Dive surveys should be utilised for regular monitoring of all habitats, with samples taken for identification of fauna. If resources permit, divers should use video cameras to record transects and take still photographs to record findings for detailed interpretation at a later date, and aid subsequent comparisons. Dive survey methods used should be standardised, e.g. distance of search around transect. Transects should be the same length, and time taken measured. ii) Deep water only (>30m) Underwater survey techniques such as acoustic bathymetry or side scan sonar should be used to get a more accurate measure of areal extent of habitats. Remote underwater video photography should be undertaken for all habitats. ROVs are most ideal, as they are easily manoeuvrable around different features, but costs are likely to

44
be prohibitive. ROVs could also be used to take samples of certain epifauna for identification. An underwater video camera towed by boat is a more feasible technique with limited resources. Methodology should be standardised, such as towing at a consistent speed, and a set transect length. For video photography, both remotely and by divers, transects should be conducted with the same number of digital stills taken at regular intervals to aid faunal identification and estimate percentage cover. iii) Shallow and deep water Benthic sampling should be undertaken to survey infauna in soft sediments in both shallow and deep water, although the size of required vessels may vary. Benthic sampling is necessary if the objectives require a more complete view of total biodiversity, or monitoring of infaunal response to identified threats. Box cores or grabs could be used as standard for infaunal sampling; each of these have associated strengths and weaknesses but equipment selected should be consistent throughout the monitoring. The same number of replicates should be taken at each sampling location, and samples processed in the same way, following standard good practice (ICES 2004, JNCC 2001). Grab and box core sampling is biased towards certain infaunal components of the benthic community. For detailed surveys, a combination of techniques is recommended to get a complete census of all benthic biodiversity, such as epibenthic sledge and trawl surveys. Monitoring of larval dispersal to assess connectivity of networks requires sampling of zooplankton, and population genetic techniques. Table 2.10 Summary of recommended methodology for suggested parameter and associated cost estimate. Parameter Deep water (>30m) Shallow water (<30m)
Methodology Cost Methodology Cost Habitat extent (estimate) Remote video
transect moderate Dive survey video
transect low
Habitat percentage cover Remote video transect and stills
moderate Dive survey video transect and stills
low
Proportion of habitat-forming species live or dead
Remote video transect and stills
moderate Dive survey video transect and stills
low
Composition of dominant habitat-forming species
Remote video transect and stills
moderate Dive survey video transect and stills, epifaunal samples
low
Percentage cover / abundance of focal epifaunal species
Remote video transect and stills
moderate Dive survey video transect and stills, epifaunal samples
low
Presence / absence of threatened species
Remote video transect and stills
moderate Dive survey video transect and stills, epifaunal samples
low
Infaunal community composition, abundance, and biomass
Grab sampling/ box core
moderate - high
Dive survey hand cores
low - moderate
Density / size structure of focal species
Remote video transect and stills
moderate Dive survey video transect and stills, epifaunal samples
low
Presence / absence of non-indigenous species
Remote video transect and stills
moderate Dive survey video transect and stills, epifaunal samples
low
Areal habitat extent Side scan sonar/bathymetry
very high Remote sensing of aerial photographs where possible
moderate

45
Percent cover / abundance of each threatened species
ROV high Intensive dive survey video transect and stills
moderate
Diversity / species richness of epifauna
ROV high Intensive dive survey video transect and stills
moderate
Diversity / species richness of all benthic fauna including infauna
Grab sampling, box core, epibenthic sledge and trawl
high Dive survey hand cores
moderate - high
Abundance of non-indigenous species
ROV high Intensive dive survey video transect and stills
high
Larval dispersal Zooplankton sampling, population genetic techniques, ecological modelling
high Zooplankton sampling, population genetic techniques, ecological modelling
high
Who is responsible for conducting monitoring The majority of case studies used only trained scientists for dive surveys contributing to longer-term, established monitoring programmes rather than one off studies. It can be inferred from this that the efforts involved in training and Quality Control (QC) exceeds the benefits of having a larger survey team and involving the local community. Trained scientists are required for offshore surveys as they require offshore safety training and experience with using specialised equipment. Volunteers, such as those coordinated by Seasearch could be utilised for shallow water dive surveys (and shore search for inshore), although they should receive training and be led by scientists; detailed QC procedures would be required. Some case studies utilised volunteers for their surveys, but these volunteers were well trained and generally had previous experience of undertaking similar surveys. Consequently, it is recommended that only well qualified volunteers are selected; the costs of training and assessing volunteers’ abilities could potentially be covered by Seasearch. The use of volunteers would allow a greater number of surveys to be conducted, thus increasing the coverage and statistical robustness of the monitoring, and help to engage the local community. Certain parameters which are easy to measure and involve limited species identification could be selected for volunteers to monitor, with others undertaken by trained scientists. Marine biology students from selected universities could potentially assist with nearshore monitoring if given adequate training, or utilise data for further investigation. Collaborations with universities would provide expert knowledge for monitoring programme design, and data interpretation. Case studies which informed the development of recommended approach • Case Study 5: German Natura 2000 monitoring • Case Study 6: Central Coast California • Case Study 8: Arctic Marine Areas • Case Study 10: MAREANO programme Detailed examples of approaches taken by the case studies which informed the recommended approach are provided in Appendix 5. For relevant sections of the SCA analysis see rows 82 to 97 in the supplementary electronic Excel spreadsheet. See Appendix 4 for case study fact sheets.

46
Examples of lessons learned (‘pitfalls’) • Using volunteers for long-term monitoring programmes requires investment in training
and continuity to maximise consistency of monitoring and quality of data. These costs should not be underestimated. A core budget for monitoring capacity should not be reduced on the assumption that it can be replaced by volunteers.
• Some survey techniques cause bias in the section of the benthic community which are sampled, e.g. grabs sample infauna but not sessile epifauna (Jørgensen et al 2011).
• Remote sensing may be used at certain times of the year to monitor the total extent of seagrass habitats in shallow, clear water. However, this requires very high resolution imagery, which is expensive to purchase and costly to process and validate. Furthermore, the viability of this approach is limited by water turbidity and depth in the UK, for both seagrass and other habitats.
2.3.3.8 Monitoring programme element #8: dissemination and reporting
Recommended approach Monitoring updates and results should be summarised online in a newsletter regularly for stakeholders, local communities and other interested parties to view. Brief non-technical status reports for each MPA should published as each cycle of monitoring is completed for the responsible authorities to use to guide management. Progress reports should be produced to assess if the monitoring is on schedule and within budget. UK network wide assessments undertaken every six years should be reported in a detailed scientific report, and as a non-technical summary. Results should be published online so they are accessible to all interested parties, distributed to all the relevant authorities, and publicised as much as possible. Results of assessments will feed into specific reports needed to meet legal obligations at set reporting cycles (e.g. every four years for CBD BAP habitats, every six years for the Habitats Directive). All reports should be peer reviewed to ensure scientific credibility and facilitate the sharing of ideas and lessons learnt. Scientific findings can also be published in peer reviewed journals by any students using monitoring data, although this may be outside the remit of an official monitoring programme. Approaches such as a colour scale or grading system can be used to visualise and communicate results. This will match the approach used by most Directives and legislation, whereby diagrams are constructed to represent status (often colour-coded) and trends (often depicted by arrows or shape). Assessments for the UK could show the current status of the habitat, gauged against a baseline or reference condition, together with whether there is an increasing, decreasing or static trend. For this to be possible, parameters monitored for each habitat must be assessed together to establish overall status. This can be achieved using expert judgement, or specific indices could be developed to combine parameters. Network assessments should also include some analysis of the effectiveness of the network as a whole, but looking at the relative representation of habitats, replication of habitats within MPAs, and connectivity between MPAs. Case studies which informed the development of recommended approach • Case Study 1: Great Barrier Reef Marine Park • Case Study 5: German Natura 2000 monitoring • Case Study 7: North Central Coast California • Case Study 8: Arctic Marine Areas Detailed examples of approaches taken by the case studies which informed the recommended approach are provided in Appendix 5. For relevant sections of the SCA

47
analysis see rows 99 to 105 in the supplementary electronic Excel spreadsheet. See Appendix 4 for case study fact sheets. Examples of lessons learned (‘pitfalls’)
• Not producing easily digestible synthesis reports can undermine the value of the monitoring by it not being accessible to decision-makers or the wider public.
2.3.3.9 Monitoring programme element #9: data management
Data storage and access All monitoring data should be spatially explicit, and have associated metadata according to geospatial metadata standard. Monitoring data and metadata should be stored in an online central database to ensure consistency in the data submitted, avoid duplication of data reporting, facilitate quality control across all datasets, and promote data sharing. The database could be part of a web-based information system which also allows data providers to submit and validate data automatically, and view, query and download data in a map and assessment tool. The system could be password controlled to allow only certain data providers to submit data. Web services could be provided to allow data to be transferred and utilised by other initiatives. INSPIRE data specifications should be monitored and implemented as they are finalised by the required dates. JNCC could take advantage of existing infrastructure that exists for the NBN Gateway. What functionality needs to be provided by the information system depends on the intended management use, which assessments are undertaken and how information should be disseminated (see Elements 3, 4 and 8). Case studies which informed the development of recommended approach • Case Study 1: Great Barrier Reef • Case Study 6: Central Coast California • Case Study 8: Arctic Marine Areas • Case Study 10: MAREANO programme Detailed examples of approaches taken by the case studies which informed the recommended approach are provided in Appendix 5. For relevant sections of the SCA analysis see rows 107 to 110 in the supplementary electronic Excel spreadsheet. See Appendix 4 for case study fact sheets. Examples of lessons learned (‘pitfalls’)
• If the results of assessments are only found in reports they cannot be easily reused and specific metadata may not be available.

48
3 Conclusions and Recommendations
Effective long-term monitoring is a resource-intensive and usually under-funded activity. Yet, it is critical to ensuring effective and adaptive management. Trade-offs and compromise are inevitable. The good practice guidelines presented in this report are thus intended to provide pragmatic advice on how to maximise resource efficiency and uptake of lessons learned (i.e. minimising risk of ‘bad practice’). These guidelines are for a seabed monitoring programme for MPAs across all UK waters and the UK MPA network. They were developed using an inductive approach, reviewing existing monitoring programmes in 11 case studies from around the world. Five of these were MPA networks where monitoring is being undertaken, two were for MPA networks where monitoring is proposed, two were individual MPAs, and two were baseline surveys undertaken to inform future management or monitoring. Review and analysis of the case studies were undertaken according a Strengths, Challenges, and Applicability framework, that was adapted from standard SWOT analyses. The review was structured around nine key monitoring programme elements identified in collaboration with JNCC. Good practice was developed based on the review and analyses of these case studies, taking into consideration the UK’s broader conservation obligations under various national, regional and international initiatives. The good practice recommendations should be considered as a step-wise planning process. The nine elements have been presented in a logical flow that starts by defining the overall financial constraints and clarifying the ‘end goal’ of the monitoring programme, and then works backwards to describe contributory elements. The choices made about the elements at each step should consider what is needed to support the end-goal. To assist cross-referencing to the main text, conclusions below are numbered in line with the numbered elements in the good practice recommendations. 1. For each element various approaches should be weighed up whilst considering
constraints in the resources available. Cost considerations should take into account the resources needed for all activities related to monitoring fieldwork, as well as those for processing and interpreting samples and data, report writing, data management, quality control, dissemination, and review and adaptation of the monitoring and management process.
2. Given the context of resource limitation, we have focused the guidelines on identifying
synergies, opportunities for economies of scale, and maximising resource efficiency while minimising loss of rigour. This should be facilitated from the outset by using the SMART (Specific, Measurable, Achievable, Realistic, and Time-bound) framework to develop a nested hierarchy of MPA network and MPA objectives. The SMART framework is an excellent tool to focus the attention on developing objectives with clear definitions and minimal ambiguity of interpretation. Taking this approach will enable a cascade of pragmatism through the entire monitoring programme design process.
High-level MPA network objectives should also take broader UK, EU, and international conservation, assessment, and reporting obligations into account, to maximise economies of scale and synergy with other monitoring programmes. MPA-specific objectives should be threat-focused, and objectives between MPAs within a given network should be standardised (even if they are not identical) to enable greater comparability of sites.
3. Ultimately, monitoring results are used to feed into management plans for designated
MPAs, and possibly surrounding waters. Monitoring data and assessment results need

49
to be presented in such a way that informed decisions on how management protocols (e.g. MPA boundaries or activities permitted in an MPA or MPA zone) need to be amended in response to monitoring outcomes, can be made by potential non-experts in the field.
An adaptive management cycle, aligned with the long-term monitoring objectives of the whole MPA network should be implemented to adapt monitoring and assessment based on lessons learned. Such ‘management effectiveness’ could be accessed using comprehensive and proven approaches such as the ‘How is your MPA doing’ guidelines developed by IUCN, although there are likely to be financial constraints on the scope of this assessment. To ensure effective and holistic management, information on the status and trends generated by seabed monitoring programmes will need to be matched with information on human activities in, and utilisation of the MPA, as well as incorporating other socio-economic factors.
4. Effective monitoring programmes undertake monitoring events on a temporal scale
sufficient to detect change against a reference baseline. Sensitivity analysis will allow cost-benefit tradeoffs to be examined between the risk of committing Type I or Type II errors, desired magnitudes of anticipated change to be detected and sampling regime, which can then be used to design a monitoring programme that meets its objectives with acceptable levels of power, within the means of available resources, and ensuring that it is aligned with reporting requirements. Ideally sensitivity analyses are conducted prior to the commencement of monitoring, but can also be done retrospectively and monitoring programmes adjusted accordingly.
The generic objective of all monitoring programmes is to detect change through time and space, and assess this against known impacts or management/mitigation actions. Hence, comprehensive, statistically valid and robust analyses of monitoring data are necessary. It is resource intensive, both in terms of acquiring sufficient data and conducting the necessary analytical processes, to meet the requirements of tests which allow an experimental comparison between sites. Therefore, it may be more cost-effective to focus on assessment techniques on robust trend analyses to test for changes over time, which meet the priorities of reporting obligations. Selection or development of indices used to track or assess change need to be usable for making management decisions, and may include proxy measures. The level of data quality and uncertainty/confidence associated with it needs to be made explicit so that it can be judged against what is considered acceptable. What is deemed acceptable is primarily dictated by socio-political decisions and not necessarily based on science alone.
5. The survey design should consider the requirements of the intended assessments and
results of a sensitivity analysis. The design should ensure representative coverage of the range of features present in the MPA, and adequate representation and replication of habitats. If the reference condition used to assess status will be judged by conditions at reference locations, these should be as ecologically similar as possible to the sites surveyed within the MPA.
6. Consistency of monitoring between sites and interoperability of datasets are critical to
ensuring scaling up of assessments and reporting at the network level and beyond. This can be achieved by developing a ‘master list’ of possible parameters to choose from when defining the monitoring programme for a particular MPA. Each should have clear definitions, units of measurements, and monitoring methodology. Parameters should link back to the MPA and MPA network objectives to ensure that the parameter is well suited to assessing progress against an objective. In this way, all MPAs that share a particular objective can be monitored in a consistent and comparable manner.

50
Flexibility and strong prioritisation will be required to select a parameter set for a given MPA. This prioritisation should consider the available budget, the ‘added value’ of the parameter for measuring fulfilment of objectives, and its transferability to other reporting processes, such as MSFD.
7. Survey methods should be standardised across all sites, and as cost-effective as
possible, particularly for regular and repeat monitoring. 8. Reporting should be prioritised against set reporting obligations. Reports should be
peer-reviewed to ensure scientific creditability. Progress reports are a useful tool for self assessment, review and adaptation of monitoring programmes. It is also important to provide updated information to stake-holders, funders and other interested parties. This can be achieved by compiling and circulating regular newsletters on monitoring activities and results.
9. Effective data management of the records generated by monitoring programmes is
essential for successful, efficient assessment. A central database for each MPA or MPA network, together with accompanying, standardised metadata records should be generated. These should be designed to enable approved data providers to input data directly. A series of checks should be included in the data entry process to ensure data quality, validity and consistency. Subsequent tools for viewing, querying and downloading data for assessment purposes should be developed, and consideration given to data sharing across initiatives.
In conclusion, key lessons learned in existing MPA network monitoring programmes include: • avoid spreading resources too thinly by defining budget up front, starting with the end-
point and working backwards, revisiting budgetary requirements at each step;
• apply the SMART concept to objective setting and ensure the monitoring programme is developed to enable assessment against these objectives throughout the planning process;
• maximise standardisation of monitoring between MPAs, from high-level objectives through to survey techniques, for example by using a master parameter list from which to select parameters to monitor in all MPAs. Although this approach may lose some flexibility at the site level, the gains in comparability and interoperability, as well as enabling network level assessment are substantial;
• conduct a sensitivity analysis to inform survey design and prioritise survey design and sampling effort on collecting data that can be used to detect change to inform management action within the timeframe of the management plan.
• assessments should focus on comparing trends and status in MPAs with a reference condition using appropriate robust statistical analyses and expert opinion.
• resource constraints on survey design is likely to limit the types of analyses used, and experimental comparison to find statistically significant differences between sites will probably only be possible for ad hoc surveys;
• ensure results can be interpreted and used by non-experts; and
• define data and metadata standards from the beginning and ensure that they are upheld.
51
4 References
ADDISON, P. 2011. The application of a good monitoring framework to marine biological monitoring: a global review of long-term Marine protected Area monitoring programmes. Volume 1. A report prepared for the Joint Nature Conservation Committee. Joint Nature Conservation Committee 455. ANDERSEN, J. H., MARIAGER, S. & ÆRTEBJERG, G. 2004. Tekniske anvisninger for marin overvågning (in Danish). National Environmental Research Institute. [online]. Available from: [Accessed. ARCTIC COUNCIL 2012. The Arctic Council [online]. Available from: http://www.arctic-council.org/index.php/en/ [Accessed 04/01/12]. ASHCRAFT, S., HRBACEK, K., MACINTYRE, K. & NASLUND, B. 2010. Guide to the North- Central California Marine Protected Areas: Alder Creek to Pigeon Point. Californian Department of Fish and Game (DFG). [online]. Available from: http://www.dfg.ca.gov/mlpa/pdfs/nccmpas/nccmpas_guide.pdf [Accessed 05/01/12]. AUSTRALIAN GOVERNMENT 2011a. Map of the Great Barrier Reef Marine Park.Canberra, Australia. [online]. Available from: http://www.reefhq.com.au/__data/assets/pdf_file/0009/18783/SDC2004120620Sept200420 General20Reference.pdf [Accessed 03/01/12]. AUSTRALIAN GOVERNMENT 2011b. Great Barrier Reef Marine Park Act No. 85 of 1975. Canberra, Australia. [online]. Available from: http://www.comlaw.gov.au/Details/C2010C00166 [Accessed 03/01/12]. BABCOCK, R., SHEARS, N., ALCALA, A., BARRETT, N., EDGAR, G., LAFFERTY, K., MCCLANAHAN, T. & RUSS, G. 2010. Decadal trends in marine reserves reveal differential rates of change in direct and indirect effects. Proceedings of the National Academy of Sciences of the United States of America, 107, 18256-18261. BARRETT, N., BUXTON, C. & EDGAR, G. 2009. Changes in invertebrate and macroalgal populations in Tasmanian marine reserves in the decade following protection. Journal of Experimental Marine Biology and Ecology, 370, 104-119. BARRETT, N., EDGAR, G., BUXTON, C. & HADDON, M. 2007. Changes in fish assemblages following 10 years of protection in Tasmanian marine protected areas. Journal of Experimental Marine Biology and Ecology, 345, 141-157. BARRETT, N., EDGAR, G. & POLACHECK, A. 2006. Ecosystem monitoring – The Kent Group. baseline surveys of the subtidal reef biota of the Kent Group Marine Nature Reserve 2004-2006. Tasmanian Aquiculture Fisheries Institute Internal Report. BFN (German Federal Agency for Nature Conservation). 2011a. Habitat Mare [online]. Available from: http://www.bfn.de/habitatmare/en/habitat-mare.php [Accessed 04/01/12]. BFN (German Federal Agency for Nature Conservation). 2011b. Map of German Natura 2000 sites [online]. Available from: http://www.bfn.de/habitatmare/en/monitoring-programm.php [Accessed 04/01/12].

52
BSH (Bundesamt für Seeschifffahrt und Hydrographie). 2010. Monitoring Specifications (in German and English). Länder-Messprogramm für die Meeresumwelt von Nord- und Ostsee (BLMP). [online]. Available from: www.blmp-online.de/Seiten/Monitoringhandbuch.htm [Accessed 04/01/12]. CANADIAN GOVERNMENT. 2011. Oceans Act [online]. Available from: http://lawslois.justice.gc.ca/PDF/O-2.4.pdf [Accessed 03/01/12]. CARR, M., MALONE, D., LONHART, S. & SELBIE, H. 2010. Monitoring MPAs by SCUBA in waters off Central California. 2007/8 results of PISCO baseline monitoring surveys. PISCO, USA. CCAMLR (Convention on the Conservation of Antarctic Marine Living Resources). 2011. Report of the thirtieth meeting of the Commission (Advance Copy). Convention on the Conservation of Antarctic Marine Living Resources. [online]. Available from: http://www.ccamlr.org/pu/e/e_pubs/cr/drt.htm [Accessed 11/01/12]. CCAMLR (Convention on the Conservation of Antarctic Marine Living Resources). 2010. Report of the twenty-ninth meeting of the Commission. Convention on the Conservation of Antarctic Marine Living Resources. [online]. Available from: http://www.ccamlr.org/pu/e/e_pubs/cr/drt.htm [Accessed 11/01/12]. CCAMLR (Convention on the Conservation of Antarctic Marine Living Resources). 2009. Report of the twenty-eigth meeting of the Commission. Convention on the Conservation of Antarctic Marine Living Resources. [online]. Available from: http://www.ccamlr.org/pu/e/e_pubs/cr/drt.htm [Accessed 11/01/12]. CEC (Commission for Environmental Cooperation). 2011. A guide to ecological scorecards for marine protected areas in North America. [online]. Available from: http://www.cec.org/Storage/98/9685_Marine_scorecard_en.pdf [Accessed 10/01/12]. COGSWELL, A., KENCHINGTON, T., LIRETTE, C., MACISAAC, K., BEST, M., BEAZLEY, L. & VICKERS, J. 2009. The current state of knowledge concerning the distribution of coral in the maritime provinces. Department of Fisheries and Oceans Canada Canadian Technical Report of Fisheries and Aquatic Sciences 2855. [online]. Available from: http://ecovector.com/Publications/Gully%20Can%20Tech%20Rep_2002.pdf [Accessed 03/01/12].
DEFRA (Department for Environment Food and Rural Affairs). 2002. Safeguarding our Seas. Defra. [online]. Available from: http://archive.defra.gov.uk/environment/marine/documents/marine_stewardship.pdf [Accessed 04/01/12]. DFG (California Department of Fish and Game). 2010. North Central Coast MPAs. California Department of Fish and Game. [online]. Available from: http://www.dfg.ca.gov/mlpa/pdfs/mpamaps/nccmpas.pdf [Accessed 26/01/12]. DFO (Department of Fisheries and Oceans). 2010. Gully Marine Protected Area Monitoring Indicators, Protocols and Strategies. Department of Fisheries and Oceans Canada Canadian Science Advisory Secretariat Science Advisory Report 2010/066. [online]. Available from: http://www2.mar.dfo-mpo.gc.ca/science/rap/internet/SAR_2010_066_E.pdf [Accessed 04/01/12].

53
DI STEFANO, J. 2003. How much power is enough? Against the development of an arbitrary convention for statistical power calculations. Functional Ecology, 17, 707-709. DOE (Northern Ireland Department of the Environment). 2010. A Northern Ireland Marine Bill - policy proposals. Consultation Document. Northern Ireland Department of the Environment. [online]. Available from: http://www.doeni.gov.uk/consultation_northern_ireland_marine_bill_-_policy_proposals.pdf [Accessed 05/01/12]. DPIWE (Department of Primary Industries Water and Environment). 2012. Maps of Tasmanian Marine Reserves [online]. Available from: http://www.dpiw.tas.gov.au/internnsf/WebPages/KMEE63B3R6?open#Marine NatureReserves [Accessed 03/01/12]. DPIWE (Department of Primary Industries Water and Environment). 2000. Tasmanian Marine Protected Areas Strategy. Hobart, Australia. [online]. Available from: http://www.dpiw.tas.gov.au/inter,nsf/Attachments/BHAN-5498CT?open [Accessed 03/01/12]. EDGAR, G., BARRETT, N., CRANE, K. & BANCROFT, K. 2009. Ecosystem monitoring of subtidal reefs in different management zones of the Jurien Bay Marine Park 1999-2007. Tasmanian Aquaculture and Fisheries Institute, University of Tasmania. Hobart, Australia. ENGLISH, S., WILKINSON, C. & BAKER, V. 1997. Survey manual for tropical marine resources. 2nd Edition. Townsville, Australia: Australian Institute of Marine Sciences. EUROPEAN COMMISSION. 2009. Directive 2009/147/EC of the European Parliment and The Council of 30 November 2009 on the conservation of wild birds (codified version). Official Journal of the European Union, L 20/7, 19. [online]. Available from: http://eur-lex.europa.eu/LexUriServ/LexUriServ.do?uri=OJ:L:2010:020:0007:0025:EN:PDF [Accessed 04/12/11]. EUROPEAN COMMISSION. 1992. Council Directive 92/43/EEC 21 May 1992 on the conservation of natural habitats and of wild fauna and flora (codified version). Official Journal of the European Union, L 206/7, 44. [online]. Available from: http://eur-lex.europa.eu/LexUriServ/LexUriServ.do?uri=OJ:L:1992:206:0007:0050:EN:PDF [Accessed 04/12/11]. FAIRWEATHER, P. G. 1991. Statistical power and design requirements for environmental monitoring. Australian Journal of Marine and Freshwater Research, 42, 555-567. FISH AND GAME COMMISSION. 2008. Map of Central California Protected Areas. Marine Life Protection Act Inititive. [online]. Available from: http://www.dfg.ca.gov/mlpa/ccmpas_list.asp [Accessed 05/12/11]. FRASCHETTI, S., TERLIZZI, A., MICHELI, F., BENEDETTI-CECCHI, L. & BOERO, F. 2002. Marine Protected Areas in the Mediterranean Sea: objectives, effectiveness and monitoring. Marine Ecology, 23, 190-200. GBRMPA (Great Barrier Reef Marine Park Authority). 2011. Great Barrier Reef Marine Park Authority [online]. Available from: http://www.gbrmpa.gov.au/ [Accessed 03/01/12]. GBRMPA (Great Barrier Reef Marine Park Authority). 2009. Great Barrier Reef outlookreport

54
2009: in brief. Great Barrier Reef Marine Park Authority. [online]. Available from:http://www.gbrmpa.gov.au/ [Accessed 5/12/11]. GILL, M., CRANE, K., HINDRUM, R., ARNEBERG, P., BYSVEEN, I., DENISENKO, N., GOFMAN, V., GRANT-FRIEDMAN, A., GUDMUNDSSON, G., HOPCROFT, R., IKEN, K., LABANSEN, A., LIUBINA, O., MELNIKOV, I., MOORE, S., REIST, J., SIRENKO, B., STOW, J., UGARTE, F., VONGRAVEN, D. & WATKINS, J. 2011. Arctic Marine Biodiversity Monitoring Plan (CBMP-Marine Plan). CAFF International Secretariat CAFF Monitoring Series Report No. 3. [online]. Available from: http://caffportal.arcticportal.org/images/nuuk_deliverables/Monitoring/M3_Marine [Accessed05/12/11]. GREEN, R. 1979. Sampling design and statistical methods for environmental biologists. (eds). Wiley-Interscience. HANSEN, L. R. 2010. Monitoring marine habitats in Denmark. Nature Division, Danish Ministry of the Environment. [online]. Available from: http://www.slu.se/Global/externwebben/centrumbildningarprojekt/artdatabanken/Dokument/ ferenser/Monitoring%20marine%20habitats/LoneReerso%20Hansen_Meeting%20sp-2010 %20DK-What-to-monitor.pdf [Accessed 05/12/11]. ICES. 2004. Biological monitoring: general guidelines for quality assurance. In ICES Techniques in Marine Environmental Sciences, No. 32, ed. H. Rees, pp 44. IRVING, R. A. 2011. Lundy Diving Monitoring Studies, 2010. Unpublished report to Natural England (South-West). Sea-Scope, Marine Environmental Consultants. IRVING, R.A., WHITTINGTON, M.W, HOLT, R.H.F, STANWELL-SMITH, D., & NORTHEN, K.O. 2007 Across-Wales Diving Monitoring Project Volume 1: Site Descriptions and Results 2004/05. A report to the Countryside Council for Wales by Pelagial Ltd. and Sea-Scope Marine Environmental Consultants. MMR No: 25a, 158pp JNCC (Joint Nature Conservation Committee). 2012. The Marine Conservation Zone Project [online]. Available from: http://jncc.defra.gov.uk/page-2409 [Accessed 05/01/12]. JNCC (Joint Nature Conservation Committee). 2010. Different types of Marine Protected Areas. Joint Nature Conservation Committee. [online]. Available from: http://jncc.defra.gov.uk/pdf/MPAsInfoDoc_v2_2.pdf [Accessed 04/12/11]. JNCC. 2004. Common Standards Monitoring Guidance. Joint Nature Conservation Committee. Peterborough, UK. JNCC. 2001. Marine monitoring handbook. J. Davies, J. Baxter, M. Bradley, D. Connor, J. Khan, E. Murray, W. Sanderson, C. Turnbull & M. Vincent (eds). Joint Nature Conservation Committee, Peterborough. JØRGENSEN, L., RENAUD, P. & COCHRANE, S. 2011. Improving benthic monitoring by combining trawl and grab surveys. Marine Pollution Bulletin, 62, 1183-1190. KENCHINGTON, T. 2010. Environmental monitoring of the Gully Marine Protected Area: a recommendation. Department of Fisheries and Oceans Canada. [online]. Available from: http://www.dfo-mpo.gc.ca/CSAS/Csas/publications/resdocs-docrech/2010/2010_075_e.pdf [Accessed 04/01/12].

55
MAREANO 2011a. MAREANO Interactive Maps [online]. Available from: http://www.mareano.no/kart/viewer.php?language=en&bbox=197424.3,7300000.0,1692424 3,8330000.0&KARTBILDE_ID=3 [Accessed 05/12/11]. MAREANO 2011b. The sea in maps and pictures [online]. Available from: http://www.mareano.no/english/index.html [Accessed 05/12/11]. MILLER, I. 2004. Crown-of-thorns starfish and coral surveys using the manta tow and SCUBA search techniques. Standar Operational Procedure No. 8. Australian Institute of Marine Science. MINISTRY OF THE ENVIRONMENT (Norway). 2006. Integrated Management of the Marine Environment of the Barents Sea and the Sea Areas off the Lofoten Islands (management plan). [online]. Available from: http://www.regjeringen.no/en/dep/md/Selected-topics/hav ogvannforvaltning/integrated-management-of-the-barents-sea.html?id=87148 [Accessed 05/01/12]. MONTEREY BAY SANCTUARY FOUNDATION. 2010. Interpretive maps and posters [online]. Available from: http://www.californiampas.org/pages/resources/products-maps.html [Accessed 05/12/11]. MPA MONITORING ENTERPRISE. 2011. North Central Coast Monitoring Programme [online]. Available from: http://monitoringenterprise.org/where/northcentralcoast.php [Accessed 05/12/11]. MPA MONITORING ENTERPRISE. 2010. North Central Coast MPA monitoring plan. MPA Monitoring Enterprise, California Ocean Science Trust. Oakland, California, USA. NAFO (Northwest Atlantic Fisheries Organization). 2011. Map of NEREIDA survey area. [online]. Available from: http://www.nafo.int/science/frames/nereida.html [Accessed 04/01/12]. NAMPAN (North American Marine Protected Areas Network). 2012a. Race Rocks Ecological Reserve and Marine Protected Area scorecard and overview [online]. Available from: http://www2.cec.org/nampan/mpa/race-rocks-ecological-reserve-and-marine-protected-area [Accessed 11/01/12]. NAMPAN (North American Marine Protected Areas Network). 2012b. Pacific Rim National Park Reserve scorecard and overview [online]. Available from: http://www2.cec.org/nampan/mpa/pacific-rim-national-park-reserve [Accessed 11/01/12]. NAMPAN (North American Marine Protected Areas Network). 2012c. North American Marine Protected Areas Network web page [online]. Available from: http://www2.cec.org/nampan/ [Accessed 10/01/12]. NATURAL ENGLAND/JNCC. 2011. Marine Conservation Zone Project. Joint Nature Conservation Committee. NATURAL ENGLAND/JNCC. 2010. Marine Conservation Zone Project: ecological network guidance. Natural England/JNCC. [online]. Available from:http://www.naturalengland.org.uk/Images/100608_ENG_v10_tcm6-17607.pdf [Accessed 26/01/12].

56
NEHLS, G., DIEDERICHS, A., GRŰNKORN, T., KRAUSE, S., MACZASSEK, K. & VORBERY, R. 2008. Konzept zur Umsetzung der Natura 2000 Monitoring- und Berichtspflichten in den kűstenfernen Gebieten der deutschen Nord- und Ostsee. BFN (German Federal Agency for Nature Conservation). NEREIDA 2011a. NEREIDA Project. NAFO Potential Vulnerable Marine Ecosystems - Impacts of Deep-sea Fisheries. Works of Mulipurpose RV Miguel Oliver (S.G.M). [online]. Available from: http://www.nafo.int/science/diptico-nereida.pdf [Accessed 04/01/12]. NEREIDA 2011b. Canadian contributions to NEREIDA 2009-2010. Surveys and sampling tools. [online]. Available from: http://www.nafo.int/science/nereida1.pdf [Accessed 04/01/12]. NEREIDA 2011c. Canadian contributions to NEREIDA 2009-2010. Sediment samples give insight into historical distribution of sponges in the NRA. [online]. Available from: http://www.nafo.int/science/nereida2.pdf [Accessed 04/01/12]. NEREIDA 2011d. Canadian contributions to NEREIDA 2009-2010. Benthic surveys using underwater cameras. [online]. Available from: http://www.nafo.int/science/nereida3.pdf [Accessed 04/01/12]. NMS (National Marine Sanctuaries). 2012. National Marine Sanctuaries web page [online]. Available from: http://sanctuaries.noaa.gov/welcome.html [Accessed 10/01/12]. NMSP (National Marine Sanctuaries Programme). 2004. A monitoring framework for the National Marine Santurary System. [online]. Available from: http://sanctuaries.noaa.gov/library/national/swim04.pdf [Accessed 10/01/12]. PISCO (Partnership for Interdisciplinary Studies of Coastal Oceans). 2011. MLPA Central Coast study region baseline data collection. [online]. Available from: http://www.piscoweb.org/policy/marine-protected-area-policy/monitoring marineprotectedareas-/mlpa-marine-protected-area-m-0 [Accessed 04/01/12]. POMEROY, R., PARKS, J. & WATSON, L. 2004. How is your MPA doing? A Guidebook of natural and social indicators for evaluating Marine Protected Area management effectiveness. IUCN. Gland, Switzerland and Cambridge, UK. REEF (The Reef Environmental Education Foundation). 2012. The Reef Environmental Education Foundation webpage [online]. Available from: http://www.reef.org [Accessed 10/01/12]. RPDC (Resource Planning and Development Commission). 2006. Inquiry into the establishment of a marine protected area within theBruny bioregions. Background report. Resource Planning and Development Commission. Hobart, Tasmania. [online]. Available from: www.rpdc.tas.gov.au [Accessed 26/01/12]. RPDC (Resource Planning and Development Commission). 2002. Inquiry into the establishment of a marine protected area within the Davey and Twofold Shelf bioregions. Background report. Resource Planning and Development Commission. Hobart, Tasmania. [online]. Available from: www.rpdc.tas.gov.au [Accessed 26/01/12]. SIMON (Sanctuary Integrated Monitoring Network). 2012. Sanctuary Integrated Monitoring Network web page [online]. Available from: http://www.sanctuarysimon.org/index.php [Accessed 10/01/12].

57
SNH (Scottish Natural Heritage). 2012. Marine Protected Areas, Scotland [online]. Available from:http://www.snh.gov.uk/protecting-scotlands-nature/protected-areas/national designations/marine-protected-areas/ [Accssed 05/01/12]. STARR, R. & YOKLAVICH, M. 2008. Monitoring MPAs in deep water off Central California. 2007 IMPACT submersible baseline survey. California Sea Grant College Program. Publication No. T-067. SVENDSEN, L., VAN DER BIJL, L., BOUTRUP, S. & NORUP, B. 2005. NOVANA. National monitoring and assessment programme for the aquatic and terrestrial environment. Programme Description - Part 2. National Environmental Research Institute, Denmark. [online]. Available from: http://www.dmu.dk/fileadmin/Resources/BLST/NOVANA/foer08c/FR537_www_S_H.pdf [Accessed 04/01/12]. SWEATMAN, H., CHEAL, A., COLEMAN, G., EMSLIE, M., JOHNS, K., JONKER, M., MILLER, I. & OSBORNE, K. 2008. Long-term monitoring of the Great Barrier Reef, Status Report 8. Australian Institute of Marine Science. [online]. Available from: http://www.aims.gov.au/source/research/monitoring/status-reports/status-report-08.pdf [Accessed 03/01/12]. TAS PAWS (Parks and Wildlife Service Tasmania). 2012. Maps of Tasmania Marine Reserves [online]. Available from: http://www.parks.tas.gov.au/index.aspx?base=397 [Accessed 02/01/12]. TAS PAWS (Parks and Wildlife Service Tasmania). 2009. Visitor's Guide to Tasmania's Marine Reserves [online]. Available from: http://www.parks.tas.gov.au/index.aspx?base=397. [Accessed 03/01/12]. TOROPOVA, C., MELIANE, I., LAFFOLEY, D., MATTHEWS, E. & SPALDING, M. 2010. Global ocean protection: present status and future possibilities. . [online]. Available from: http://www.rampao.org/view/download/GlobalOcean_Final_lores.pdf [Accessed 10/01/12]. UNDERWOOD, A. 1992. Beyond BACI: the detection of environmental impacts populations in the real, but variable, world. Journal of Experimental Marine Biology and Ecology, 162, 145-178. UNDERWOOD, A. J. 1993. The mechanics of spatially replicated sampling programmes to detect environmental impacts in a variable world. Australian Journal of Ecology, 18, 99-116. UNEP-WCMC. 2008. National and regional networks of Marine Protected Areas: a review of progress. 144. Cambridge: UNEP-WCMC. US GOVERNMENT 2004. Marine Life Protection Act (as amended to July 2004) Fish and Game Code Sections 2850-2863. [online]. Available from: http://www.dfg.ca.gov/mlpa/pdfs/mlpa_language.pdf [Accessed 04/01/12]. UWC PEARSON COLLEGE 2012. Race Rocks web page [online]. Available from: http://www.racerocks.com/ [Accessed 11/01/12]. WHITTINGTON, M.W, HOLT, R.H.F, IRVING, R.A, NORTHEN, K.O & STANWELL-SMITH, D. (2007) Across-Wales Diving Monitoring Project Volume 2: Standard Operating

58
Procedures. A report to the Countryside Council for Wales by Pelagial Ltd. and Sea-Scope Marine Environmental Consultants. MMR No: 25b, 88pp WOOD, L. 2011. Global marine protection targets: how S.M.A.R.T are they? Environmental Management, 47, 525-535.

59
5 Appendices
Appendix 1 Summary of the UK’s obligations under each International, European or UK policy
A1.1 International Conventions
A1.1.1 Convention on Biological Diversity (CBD)
The CBD promotes the conservation of biological diversity, the sustainable use of its components and the fair and equitable sharing of the benefits arising out of the utilization of genetic resources.
It calls upon Member States to:
a) Identify components of biological diversity important for its conservation and sustainable use having regard to the indicative list of categories set down in Annex 1.
b) Monitor, through sampling and other techniques, the components of biological diversity identified pursuant to subparagraph (a) above, paying particular attention to those requiring urgent conservation measures and those which offer the greatest potential for sustainable use.
The indicative list of categories in Annex I are ecosystems and habitats which: contain high diversity, large numbers of endemic or threatened species, or wilderness; are required by migratory species; of social, economic, cultural or scientific importance; or, which are representative, unique or associated with key evolutionary or other biological processes.
The UK Biodiversity Action Plan (UK BAP) is the UK Government’s response to the CBD which called for the development and enforcement of national strategies and associated action plans to identify, conserve and protect existing biological diversity, and to enhance it wherever possible. Biodiversity indicators have been selected to monitor progress towards CBD targets, which, in relation to marine systems, includes trends and status of populations of breeding seabirds, priority species and habitats, and the extent of protected areas, sustainable fisheries, invasive species and marine ecosystem integrity (size of fish in the North Sea).
A1.1.2 Ramsar Convention
The Convention on Wetlands, or Ramsar Convention, aims to promote conservation of wetlands by calling on Member States to select Wetlands of International Importance on account of their international significance in terms of ecology, botany, zoology, limnology or hydrology, and maintain their ecological character. Under Article 3.2 each Contracting Party has to be informed at the earliest possible time if the ecological character of any wetland in its territory and included in the Ramsar List has changed; ecological character is defined as ‘the combination of the ecosystem components, processes and benefits/services that characterise the wetland at a given point in time’.
Under Resolution VIII.14, Member States are urged to establish for each site on the Ramsar List a monitoring programme, including indicators of ecological character features. The Guidelines for Management Planning for Ramsar Sites and Other Wetland Guidelines for Management Planning for Ramsar Sites and Other Wetlands suggest the following performance indicators for habitats:

60
a) Quantity: • size of area occupied by the habitat; and • distribution of the habitat b) Quality: • physical structure; • individual or groups of species indicative of condition; and • individual or groups of species indicative of change A1.1.3 Oslo Paris Convention (OSPAR)
The OSPAR Convention is the legal instrument guiding international cooperation on the protection of the marine environment of the North-East Atlantic region. Work under the Convention is managed by the OSPAR Commission, made up of representatives of the Governments of 15 Contracting Parties, including the UK, and the European Commission. The Convention requires Member States to ‘take all possible steps to prevent and eliminate pollution and shall take the necessary measures to protect the maritime area against the adverse effects of human activities so as to safeguard human health and to conserve marine ecosystems and, when practicable, restore marine areas which have been adversely affected’. Under Recommendation 2003/3, OSPAR established an ecologically coherent network of well-managed MPAs in the North-East Atlantic. The aims of the OSPAR network of MPAs are:
• to protect, conserve and restore species, habitats and ecological processes which have been adversely affected by human activities;
• to prevent degradation of, and damage to, species, habitats and ecological processes, following the precautionary principle; and
• to protect and conserve areas that best represent the range of species, habitats and ecological processes in the maritime area.
Member states are obliged to submit a management plan for each OSPAR MPA, which includes a detailed description of the biotopes/habitats of the protected area, especially those that are the objectives of protection. OSPAR contracting parties report data regarding the location of the MPAs, and which of the OSPAR threatened or declining species are present within them.
Relevant parameters to measure the conservation objectives for OSPAR MPAs would be habitat extent, species abundance and ecological processes.
A1.1.4 United Nations General Assembly (UNGA) Resolutions
UNGA Resolution 61/105 and 64/72 address improvements to the management of fisheries which aim to promote the conservation of vulnerable marine ecosystems (VMEs) which provide habitat for fish. These Resolutions aim to ‘ensure the long-term conservation, management and sustainable use of the relevant fish stocks and to prevent significant adverse impacts on vulnerable marine ecosystem’. The Food and Agricultural Organization (FAO) produced new guidelines for deep sea fisheries to provide advice on implementing these resolutions. Significant adverse impacts, as described in the guidelines, are those that, compromise ecosystem integrity (i.e. ecosystem structure or function) in a manner that:
• impairs the ability of affected populations to replace themselves; • degrades the long-term natural productivity of habitats; and • causes, on more than a temporary basis, significant loss of species richness, habitat or
community types

61
Areas where VMEs are identified are closed to fisheries until measures are in place to ensure these do not cause significant adverse impacts. VMEs will need to be monitored if fisheries are reinstated when measures are in place.
Relevant parameters to measure to assess if there are significant adverse impacts could be: abundance\productivity of key species, changes in habitat extent, changes in biotope (community types) extent, changes in species richness.
A1.2 European Policies
A1.2.1 Habitats and Birds Directives
The Habitats and Birds Directives focus on the conservation of listed habitats and species, which is achieved through the designation of Special Areas of Conservation (SACs) for the Habitats Directive or, for the Birds Directive, Special Protected Areas (SPAs). The broad conservation objective stated is for parties to ‘ensure the restoration or maintenance of natural habitats and species of Community interest at a favourable conservation status’. The Habitats Directive states that the conservation status of a natural habitat will be taken as "favourable" when:
• its natural range and areas it covers within that range are stable or increasing, and • the specific structure and functions which are necessary for its long-term maintenance
exist and are likely to continue to exist for the foreseeable future, and • the conservation status of its typical species is favourable
The conservation status of a species will be taken as "favourable" when:
• population dynamics data on the species concerned indicate that it is maintaining itself on a long-term basis as a viable component of its natural habitats, and
• the natural range of the species is neither being reduced nor is likely to be reduced for the foreseeable future, and
• there is, and will probably continue to be, a sufficiently large habitat to maintain its populations on a long-term basis.
Article 11 of the Habitats Directive specifies that Member States must undertake surveillance of the conservation status of the natural habitats and species, while Article 17 requires Member States to report on the implementation of the Directive every 6 years. Relevant parameters to monitor in order to assess if conservation status is favourable would be: the range, extent and structure and functioning of listed habitats (including species typical of listed habitats) and the habitats of listed species; the range of listed species; and long term trends in abundance of listed species.
The Habitats Directive is translated into UK legislation through the Conservation of Habitats and Species Regulations, and also the Offshore Marine Conservation Regulations, which both require the appropriate authority to make arrangements for the surveillance of the conservation status of natural habitat types and species of Community interest.
The Birds Directive, Article 2, requires Member States to take the requisite measures to maintain the population of the species at a level which corresponds in particular to ecological, scientific and cultural requirements. It would therefore be necessary to monitor the population size of listed bird species.
Article 3 of the Birds Directive states that Member States should take the requisite measures to preserve, maintain or re-establish a sufficient diversity and area of habitats for birds, and

62
describes measures which should be taken to ensure the preservation, maintenance and re-establishment of biotopes and habitats. Parameters which could be used to monitor these obligations could be bird habitat extent, and biotope extent within bird habitat.
Article 4 states ‘the species mentioned in Annex I shall be the subject of special conservation measures concerning their habitat in order to ensure their survival and reproduction in their area of distribution, and that Member States shall classify in particular the most suitable territories in number and size as special protection areas. Designated SPAs are generally coastal as they have been designated to protect breeding colonies, although some extend into the surrounding waters. The Birds Directive is potentially applicable to foraging areas offshore where seabed habitats are essential for survival of prey species.
A1.2.2 Water Framework Directive (WFD)
The WFD aims to protect and enhance the quality of waters, including coastal waters out to one mile from low-water. These regulations are therefore only relevant to monitoring coastal areas, but some of the principles laid out could be applied offshore.
Article 8 of the Directive requires the monitoring of surface water status, groundwater status and protected areas. Annex V lays out quality elements for the classification of ecological status. For coastal waters these are:
Biological elements • composition, abundance and biomass of phytoplankton • composition and abundance of other aquatic flora • composition and abundance of benthic invertebrate fauna • yydromorphological elements supporting the biological elements • morphological conditions • depth variation • structure and substrate of the coastal bed • structure of the intertidal zone • tidal regime • direction of dominant currents • wave exposure Chemical and physico-chemical elements supporting the biological elements • general • transparency • thermal conditions • oxygenation conditions • salinity • nutrient conditions • specific pollutants • pollution by all priority substances identified as being discharged into the body of water • pollution by other substances identified as being discharged in significant quantities into
the body of water Annex V also contains information regarding definitions for high, good and moderate status, monitoring design, monitoring frequency and monitoring standards.

63
A1.2.3 Marine Strategy Framework Directive (MSFD)
The MSFD requires Member States to prepare marine strategies to manage their seas to achieve or maintain Good Environmental Status (GES) by 2020. Requirements include the establishment of a monitoring programme to measure progress towards GES by July 2014. The MSFD applies to all European marine areas (including UK waters) and is not specific to MPAs, but MPA monitoring could be incorporated into this wider framework. GES is broadly described under a number of descriptors listed in Annex I, the most relevant of which is Descriptor 1: ‘biological diversity is maintained, and the quality and occurrence of habitats and the distribution and abundance of species is in line with prevailing physiographic, geographic and climate conditions’, and Descriptor 6 ‘seafloor integrity is at a level that ensures the structure and functions of the ecosystems are safeguarded and benthic ecosystems, in particular, are not adversely affected’. Part B of 2010 Commission Decision 2010/477/EU Commission Decision 2010/477/EU lists specific criteria and indicators which should be used to monitor and assess GES for each descriptor. These include a number of criteria and indicators which are relevant to monitoring seabed habitats. Relevant indicators include15:
• Habitats: habitat distributional range (1.4.1), pattern (1.4.2) habitat area (1.5.1) and habitat volume (1.5.2) condition of typical species and communities (1.6.1) and abundance and/or biomass (1.6.2); physical, hydrological and chemical conditions (1.6.3);
• Non-indigenous species: Trends in abundance, temporal occurrence and spatial distribution of non-indigenous species (2.1.1);
• Marine food webs: performance of key predator species using their production per unit biomass (productivity) (4.1.1), large fish (by weight) (4.2.1), abundance trends of functionally important selected groups/species (4.3.1);
• Sea-floor integrity: extent of biogenic substrate (6.1.1), extent of seabed significantly affected by human activities for the different substrate types (6.1.2), presence of particularly sensitive and/or tolerant species (6.2.1), multi-metric indexes assessing the benthic community condition and functionality, such as species diversity and richness and proportion of opportunistic to sensitive species (6.2.2), Proportion of biomass or number of individuals in the macrobenthos above some specified size/length (6.2.3), Parameters describing the characteristics (shape, slope and intercept) of the size spectrum of the benthic community (6.2.4); and
• Contaminants: concentration of contaminants measures in the relevant matrix (such as sediment, biota)(8.1.1).
A1.3 UK Legislation
A1.3.1 Marine and Coastal Access Act and Marine Act (Scotland)
Marine Conservation Zones (MCZs) for the England and Wales are currently being planned to fulfill requirements under the Marine and Coastal Access Act which will be selected to conserve marine flora or fauna, marine habitats or types of marine habitat, and features of geological or geomorphological interest.
A marine plan must be drawn up for the management of a MCZ, which includes stating the conservation objectives of the site, and for so long as a marine plan is in effect, the marine plan authority review, amongst other things, the progress being made towards securing those objectives.
15 Numbers in parentheses represent indicator number designated in MSFD Commission Decision 2010/477/EU.

64
The Marine Act (Scotland) is similar legislation to the Marine and Coastal Access Act covering Scottish waters, under which Nature Conservation MPAs are designated. Its broad aims are the sustainable development and protection and enhancement of the health of the Scottish marine area and mitigation of, and adaptation to, climate change. Article 70 states that the Scottish Ministers must assess from time to time the extent to which, in their opinion, the stated conservation objectives of any Nature Conservation MPA have been achieved.
An overall objective in both the Marine and Coastal Access Act and the Marine Act (Scotland) is that the areas designated as MCZs, Nature Conservation MPAs, and any relevant conservation sites in the UK marine area, form a network which satisfies three conditions:
a) that the network contributes to the conservation or improvement of the marine environment in the UK marine area;
b) that the features which are protected by the sites comprised in the network represent the range of features present in the UK marine area; and
c) that the designation of sites comprised in the network reflects the fact that the conservation of a feature may require the designation of more than one site.
A1.3.2 Wildlife and Countryside Act
The Wildlife and Countryside Act designates areas for protection as Sites of Special Scientific Interest (SSSIs). The SSSIs should be managed to ensure favourable condition, which is defined as when the SSSI is being adequately conserved and is meeting its ‘conservation objectives’. These conservation objectives are site specific, but generally adhere to the criteria for favourable status as defined in the Habitats Directive. SSSIs generally only extend to the low water mark, and so primarily offer protection only to the intertidal environment from a marine perspective.
A1.4 UK Policy Drivers
A1.4.1 UK High Level Marine Objectives
In 2002 the UK government set out a strategy for the conservation and sustainable development of the marine environment entitled ‘Safeguarding our Seas’ (Defra 2002). This report set out a vision for the future of the marine environment: “Our vision for the marine environment is clean, healthy, safe, productive and biologically diverse oceans and seas.
Guidance: MCZ conservation objective guidance
The MCZ conservation objective guidance (Natural England/JNCC 2011) suggests the following template for conservation: ‘subject to natural change, [maintain or recover] the [insert name of feature] to favourable condition [by 2020 and maintain thereafter], such that the [insert attribute/parameter] representative of the [feature] in the biogeographic region are all [maintained or recovered]. The suggested attributes/parameters are: extent, diversity, community structure, natural environmental quality, and natural environmental processes; natural environmental processes is defined as ‘biological and physical processes that occur naturally in the environment e.g. water circulation, sediment deposition and erosion etc. should not deviate from baseline at designation or reference conditions’, and natural environmental quality means ‘variables that can be used to measure the quality of the natural environment e.g. chemical quality parameters of water, suspended sediment levels, radionuclide levels etc should not deviate from baseline at designation (if available) or reference conditions’.

65
Within one generation we want to have made a real difference”. Based on this statement, the UK Government compiled the UK’s high level objectives which were divided into five sustainable development principles. The objectives listed under the ‘Living within environmental limits’ principle refer to biodiversity:
• biodiversity is protected, conserved and where appropriate recovered and loss has been halted;
• healthy marine and coastal habitats occur across their natural range and are able to support strong, biodiverse biological communities and the functioning of healthy, resilient and adaptable marine ecosystems; and
• our oceans support viable populations of representative, rare, vulnerable, and valued species.
Parameters which could assess these objectives include habitat range and extent, abundance of representative, rare, vulnerable, and valued species, diversity and ecosystem functioning.
Guidance – Common Standards Monitoring
The JNCC provides guidance on Common Standards Monitoring for protected sites (SACs, SPAs, SSSIs and Ramsar sites) which is intended to result in a simple, quick, assessment of feature condition, supported by limited, more detailed monitoring. Specific guidance is provided for different marine features. Assessments should consider those attributes which indicate condition; these should include four mandatory attributes (extent, biotope composition, sediment character and distribution of biotopes), and can also include other attributes such as extent of sub-feature or representative/notable biotopes, species composition of representative or notable biotopes, species population measures, topography, and sediment character (Organic carbon content, Oxidation reduction profile), depending on the site being considered.

66
Appendix 2 Summary of assessment of potential case studies to identify how each could help to address the gaps identified in the Addison (2011) report
Table A2.1 Gaps in knowledge on MPA marine monitoring which could be fulfilled by reviewing the case studies in Addison (2011) and those identified based on new selection criteria. New no.
Addison no.
Case study Country/ Region
Conservation objectives addressed
Relevant to UK (Domestic –
temperate/OTs - tropical)
Location (Inshore/Offs
hore/Joint)
Biological indicators monitored
Non-biological indicators monitored
Reporting language
Current, New or Developing MPA
monitoring programme
Data sources (collected by
formerly trained scientists or
citizen scientists)
Part of MPA network?
1* A1.1 Long Term Monitoring Program, Great Barrier Reef Marine Park, Queensland
Australia OTs - tropical Inshore English Current Trained scientists
2* A1.2 Reef Rescue Marine Monitoring Program, Great Barrier Reef Marine Park (MP), Queensland
Australia OTs - tropical Inshore English Current Trained scientists
3* A1.3 Sub tidal Reef Monitoring Program, Victoria‘s Marine National Parks and Sanctuaries, Victoria
Australia Domestic - temperate
Inshore English Current Trained scientists
4* A1.4 Intertidal Reef Monitoring Program, Victoria‘s Marine National Parks and Sanctuaries, Victoria
Australia Domestic - temperate
Inshore English Current Trained scientists
5* A1.5 Ecosystem Monitoring, Tasmania‘s Marine Reserves, Tasmania
Australia Domestic -temperate
Inshore English Current Trained scientists
6* A1.6 Ecosystem Monitoring, New South Wales Marine Parks
Australia Domestic -temperate
Inshore English Current Trained scientists
7* A1.7 Fish Monitoring, CROP Marine Reserve New Zealand Domestic -temperate
Inshore English Current Trained scientists
8* A1.8 Fish Monitoring, Channel Islands National Marine Sanctuary
U.S.A. Domestic Inshore English Current Trained scientists
9* A1.9 Coral Reef Evaluation and Monitoring Project, Florida Keys National Marine Sanctuary
U.S.A. OTs - tropical Inshore English Current Trained scientists
10* A1.10 NOAA Coral Reef Conservation Program – Fish Monitoring, Florida Keys National Marine Sanctuary
U.S.A. OTs - tropical Inshore English Current Trained scientists
11* A1.11 Coral Reef Conservation Project Monitoring, Kenya‘s Marine National Parks, Africa
Kenya OTs - tropical Inshore English Current Trained scientists
12† A2.1 Western Australia‘s Marine Protected Areas (e.g. Ningaloo Reef)
Australia OTs Joint English
Developing - Western Australian Marine
Monitoring Program (WAMMP)
Trained scientists
13† A2.2 South Australia‘s Marine Parks Australia Domestic - temperate
Inshore English
New - Implementation of system of marine
parks from mid 2012
?
14† A2.3 Coral Triangle Initiative, system of Marine Protected Areas
Indonesia, Philippines,
Eastern Malaysia, Papua
New Guinea, Timor Leste and
the Solomons
OTs - tropical Inshore
Developing -Establishment of a Network of MPAs
currently in progress; No monitoring
assessments available to date
?

67
New no.
Addison no.
Case study Country/ Region
Conservation objectives addressed
Relevant to UK (Domestic –
temperate/OTs - tropical)
Location (Inshore/Offs
hore/Joint)
Biological indicators monitored
Non-biological indicators monitored
Reporting language
Current, New or Developing MPA
monitoring programme
Data sources (collected by
formerly trained scientists or
citizen scientists)
Part of MPA network?
15† A2.4 Apo and Sumilon Islands Marine Reserves
Philippines OTs - tropical Inshore English Current Trained scientists
and citizen scientists
16† A2.5 Mediterranean Marine Protected Areas Mediterranean Domestic Inshore Different languages
Developing - Monitoring not
common practice for Mediterranean MPAs;
network of MPAs developing
?
17† A2.6 United Kingdom‘s MPAs UK Domestic Inshore English
Current/Developing - Only small scale
monitoring; Establishment of
MPA network planned by 2012.
Trained scientists
18† A2.7 Canary Islands Network for Protected Natural Areas,
Spanish Territory
OTs - tropical Inshore Spanish Current Trained scientists
19† A2.8 iSimangaliso (formerly Greater St. Lucia) Wetland Park
South Africa OTs - tropical Inshore English Current Trained scientists
20† A2.9 Galapagos Marine Reserve Ecuador OTs Inshore English Current Trained scientists
21† A2.10 Canada‘s National Marine Parks Canada Offshore English
Current/Developing - Currently only small
scale monitoring; Establishment of
MPA network planned by 2012, including routine
monitoring
Trained scientists
22† A2.11 Las Cruces Marine Protected Area Chile OTs Inshore English/ Spanish Current Trained scientists
23† A2.12 Mesoamerican Barrier Reef Systems (MBRS)
South America OTs Inshore English/ Spanish
Current - MBRS Synoptic Monitoring Program, but results
are still limited
Trained scientists
24‡ N/A RAMPAO (Regional Network of Marine Protected Areas in West Africa)
West Africa Domestic - temperate
Offshore English/ French
Developing - Road map for an
assessment of the RAMPAO MPAs by
2012
?
25‡ N/A NOAA System-Wide Monitoring (SWiM) USA Domestic -temperate
Offshore English Current Trained scientists
26‡ N/A NOAA Reef Environmental Education Foundation Fish Survey Project
USA Domestic -temperate
Inshore English Current Citizen scientists
27‡ N/A NOAA Sanctuary Integrated Monitoring Network (SIMoN)
USA Domestic - temperate
Offshore English New - Recent surveys focusing on deep-sea
coral communities Trained scientists
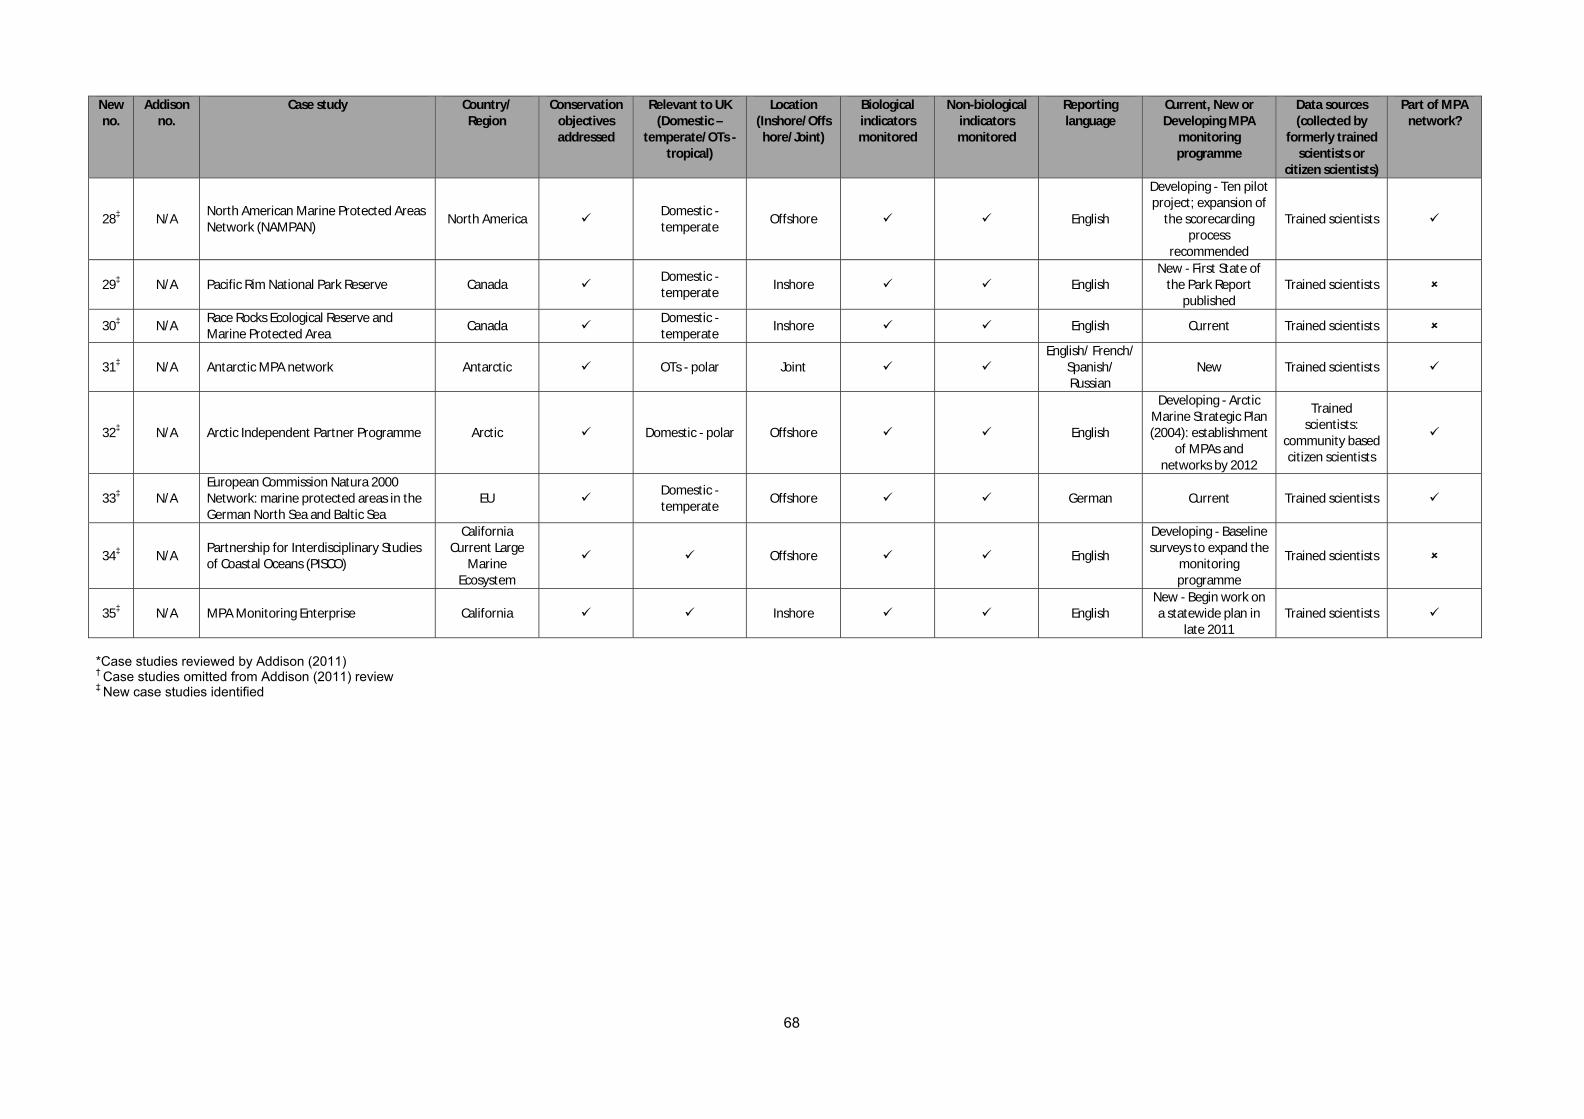
68
New no.
Addison no.
Case study Country/ Region
Conservation objectives addressed
Relevant to UK (Domestic –
temperate/OTs - tropical)
Location (Inshore/Offs
hore/Joint)
Biological indicators monitored
Non-biological indicators monitored
Reporting language
Current, New or Developing MPA
monitoring programme
Data sources (collected by
formerly trained scientists or
citizen scientists)
Part of MPA network?
28‡ N/A North American Marine Protected Areas Network (NAMPAN)
North America Domestic - temperate
Offshore English
Developing - Ten pilot project; expansion of
the scorecarding process
recommended
Trained scientists
29‡ N/A Pacific Rim National Park Reserve Canada Domestic - temperate
Inshore English New - First State of
the Park Report published
Trained scientists
30‡ N/A Race Rocks Ecological Reserve and Marine Protected Area
Canada Domestic -temperate
Inshore English Current Trained scientists
31‡ N/A Antarctic MPA network Antarctic OTs - polar Joint English/ French/
Spanish/ Russian
New Trained scientists
32‡ N/A Arctic Independent Partner Programme Arctic Domestic - polar Offshore English
Developing - Arctic Marine Strategic Plan (2004): establishment
of MPAs and networks by 2012
Trained scientists:
community based citizen scientists
33‡ N/A European Commission Natura 2000 Network: marine protected areas in the German North Sea and Baltic Sea
EU Domestic - temperate
Offshore German Current Trained scientists
34‡ N/A Partnership for Interdisciplinary Studies of Coastal Oceans (PISCO)
California Current Large
Marine Ecosystem
Offshore English
Developing - Baseline surveys to expand the
monitoring programme
Trained scientists
35‡ N/A MPA Monitoring Enterprise California Inshore English New - Begin work on a statewide plan in
late 2011 Trained scientists
*Case studies reviewed by Addison (2011) † Case studies omitted from Addison (2011) review ‡ New case studies identified

69
Appendix 3 Factsheets containing basic information on each case study not selected for full review
Western Australia‘s Marine Protected Areas (e.g. Ningaloo Reef)
MPA Facts MPA Name: Western Australia‘s Marine Protected Areas
MPA Location: Western Australia, West Coast
MPA Objectives: Marine parks are created to protect natural features and aesthetic values while allowing recreational and commercial uses that do not compromise conservation values
Year MPA Designated: 1987
MPA Management Authority: Marine Parks and Reserves Authority (MPRA)
Ecological System: Tropical and Temperate
Offshore/Inshore/Inter-tidal: Inshore, including Inter-tidal Seabed Habitat(s) Present in MPA:
Rocky coasts, coral reefs, estuarine habitats, hard and soft bottom habitats, and segments of whale migration routes.
Number of MPAs in Network: 12
Area of MPA (km2): 15,000
Monitoring Programme Facts Name of Programme: Marine Community Monitoring Program (MCMP)
Who Conducts Monitoring: Citizen Scientists
Status of Programme: Underway
Start Date: 1999
End Date: N/A
Programme Objectives:
The main aim of MCMP is to develop a partnership between managers, scientists and the community. Through this partnership we can all share information, which collectively will provide an early warning system for detecting change in the marine environment.
Biological parameters measured
Yes
Non-biological parameters measured
Yes
Key References FISHERIES, D. O. 2012. Department of Fisheries webpage [online]. Available from:
http://www.fish.wa.gov.au/sec/env/west/index.php?0502 [Accessed 11/01/12]. MARINE COMMUNITY MONITORING PROGRAMME 2005. Marine Community Monitoring Manual.
[online]. Available from: http://www.dec.wa.gov.au/content/view/792/2410/ [Accessed 11/01/12].
MPRA (Marine Parks and Reserves Authority). 2011. Marine Parks and Reserves Authority homepage [online]. Available from: http://www.dec.wa.gov.au/content/section/22/1355/ [Accessed 11/01/12].
PROGRAMME, M. C. M. 2012. Marine Community Monitoring Programme webpage [online]. Available from: http://www.dec.wa.gov.au/content/category/41/297/2410/ [Accessed 11/01/12].
Reason for Exclusion Two examples from Australian waters already selected; minimal information readily obtainable.

70
South Australia‘s Marine Parks
MPA Facts MPA Name: South Australia‘s Marine Parks
MPA Location: South Australia
MPA Objectives: Marine parks will help protect examples of all habitats found in the state's waters, and thereby help conserve the full range of plant, fish and other animal species that rely on these surroundings.
Year MPA Designated: 2010
MPA Management Authority: Department of Environment and Natural Resources
Ecological System: Temperate
Offshore/Inshore/Inter-tidal: Offshore, Inshore, Inter-tidal
Seabed Habitat(s) Present in MPA:
Seagrass meadows, mangrove forests, wetland, sponge gardens, giant kelp forests, coral reefs
Number of MPAs in Network: 19
Area of MPA (km2): 26 912
Monitoring Programme Facts Name of Programme: No monitoring programme in place yet
Who Conducts Monitoring: N/A
Status of Programme: N/A
Start Date: N/A
End Date: N/A
Programme Objectives: N/A
Biological parameters measured
N/A
Non-biological parameters measured
N/A
Key References DEPARTMENT FOR ENVIRONMENT AND HERITAGE 2009. A technical report on the outer
boundaries of South Australia's marine parks network. Department for Environment and Heritage, South Australia.
DEPARTMENT FOR ENVIRONMENT AND NATURAL RESOURCES 2012. Marine parks [online]. Available from: http://www.environment.sa.gov.au/Conservation/Coastal_marine/Marine_parks [Accessed 11/01/12].
GOVERNMENT OF SOUTH AUSTRALIA 2012. Marine parks. Reserve today. Preserve forever. [online]. Available from: http://www.data-environment.sa.gov.au/marineparks/ [Accessed 11/01/12].
Reason for Exclusion Two examples from Australian waters already selected; no monitoring programme in place yet.
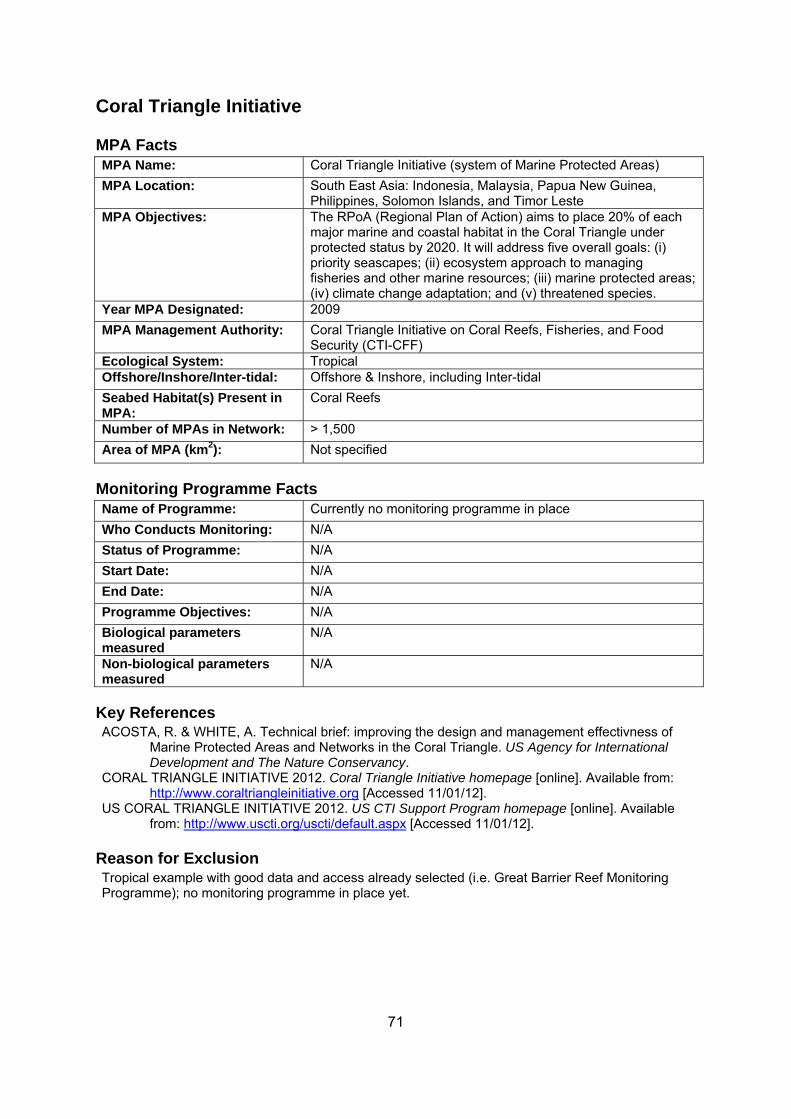
71
Coral Triangle Initiative
MPA Facts MPA Name: Coral Triangle Initiative (system of Marine Protected Areas)
MPA Location: South East Asia: Indonesia, Malaysia, Papua New Guinea, Philippines, Solomon Islands, and Timor Leste
MPA Objectives: The RPoA (Regional Plan of Action) aims to place 20% of each major marine and coastal habitat in the Coral Triangle under protected status by 2020. It will address five overall goals: (i) priority seascapes; (ii) ecosystem approach to managing fisheries and other marine resources; (iii) marine protected areas; (iv) climate change adaptation; and (v) threatened species.
Year MPA Designated: 2009
MPA Management Authority: Coral Triangle Initiative on Coral Reefs, Fisheries, and Food Security (CTI-CFF)
Ecological System: Tropical Offshore/Inshore/Inter-tidal: Offshore & Inshore, including Inter-tidal
Seabed Habitat(s) Present in MPA:
Coral Reefs
Number of MPAs in Network: > 1,500
Area of MPA (km2): Not specified
Monitoring Programme Facts Name of Programme: Currently no monitoring programme in place
Who Conducts Monitoring: N/A
Status of Programme: N/A
Start Date: N/A
End Date: N/A
Programme Objectives: N/A
Biological parameters measured
N/A
Non-biological parameters measured
N/A
Key References ACOSTA, R. & WHITE, A. Technical brief: improving the design and management effectivness of
Marine Protected Areas and Networks in the Coral Triangle. US Agency for International Development and The Nature Conservancy.
CORAL TRIANGLE INITIATIVE 2012. Coral Triangle Initiative homepage [online]. Available from: http://www.coraltriangleinitiative.org [Accessed 11/01/12].
US CORAL TRIANGLE INITIATIVE 2012. US CTI Support Program homepage [online]. Available from: http://www.uscti.org/uscti/default.aspx [Accessed 11/01/12].
Reason for Exclusion Tropical example with good data and access already selected (i.e. Great Barrier Reef Monitoring Programme); no monitoring programme in place yet.
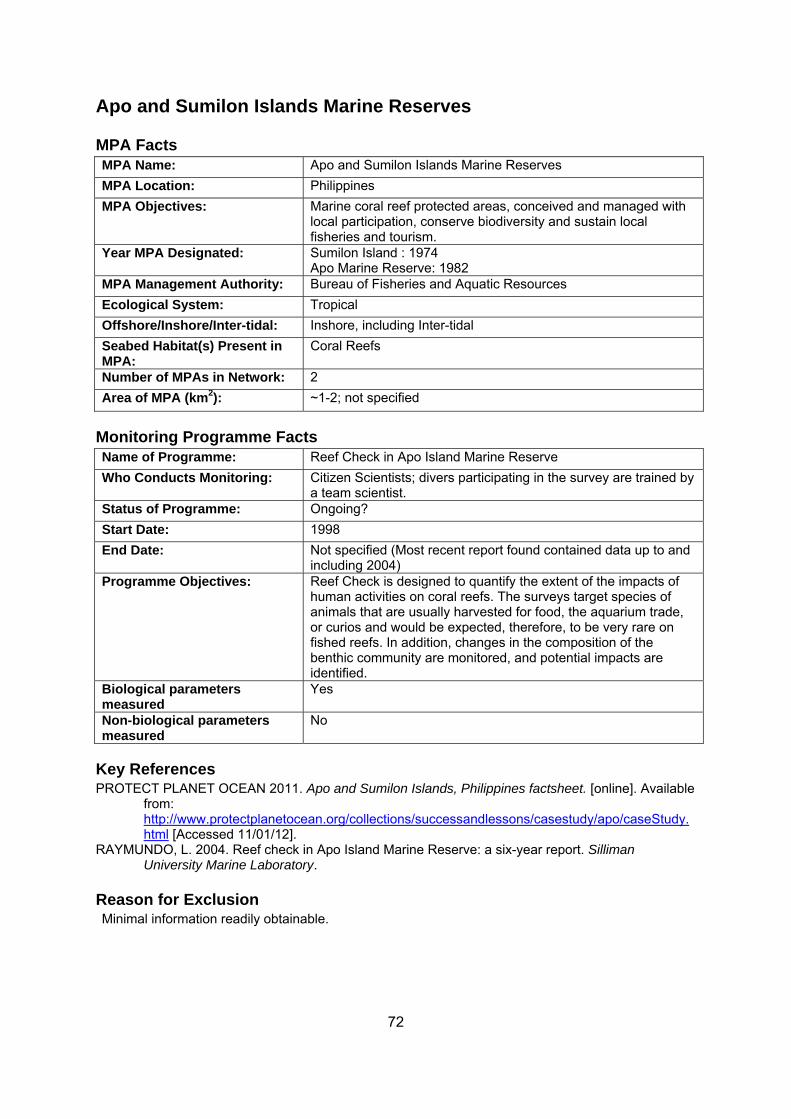
72
Apo and Sumilon Islands Marine Reserves
MPA Facts MPA Name: Apo and Sumilon Islands Marine Reserves
MPA Location: Philippines
MPA Objectives: Marine coral reef protected areas, conceived and managed with local participation, conserve biodiversity and sustain local fisheries and tourism.
Year MPA Designated: Sumilon Island : 1974 Apo Marine Reserve: 1982
MPA Management Authority: Bureau of Fisheries and Aquatic Resources
Ecological System: Tropical
Offshore/Inshore/Inter-tidal: Inshore, including Inter-tidal
Seabed Habitat(s) Present in MPA:
Coral Reefs
Number of MPAs in Network: 2
Area of MPA (km2): ~1-2; not specified
Monitoring Programme Facts Name of Programme: Reef Check in Apo Island Marine Reserve
Who Conducts Monitoring: Citizen Scientists; divers participating in the survey are trained by a team scientist.
Status of Programme: Ongoing?
Start Date: 1998
End Date: Not specified (Most recent report found contained data up to and including 2004)
Programme Objectives: Reef Check is designed to quantify the extent of the impacts of human activities on coral reefs. The surveys target species of animals that are usually harvested for food, the aquarium trade, or curios and would be expected, therefore, to be very rare on fished reefs. In addition, changes in the composition of the benthic community are monitored, and potential impacts are identified.
Biological parameters measured
Yes
Non-biological parameters measured
No
Key References PROTECT PLANET OCEAN 2011. Apo and Sumilon Islands, Philippines factsheet. [online]. Available
from: http://www.protectplanetocean.org/collections/successandlessons/casestudy/apo/caseStudy.html [Accessed 11/01/12].
RAYMUNDO, L. 2004. Reef check in Apo Island Marine Reserve: a six-year report. Silliman University Marine Laboratory.
Reason for Exclusion Minimal information readily obtainable.
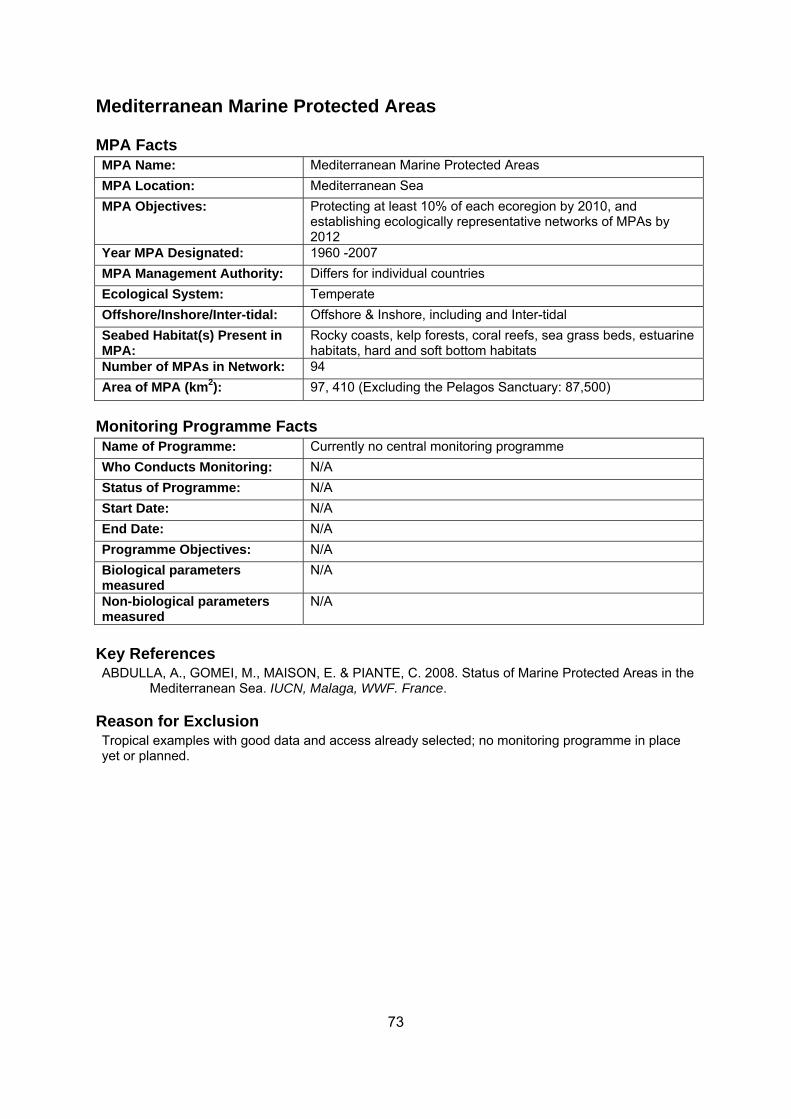
73
Mediterranean Marine Protected Areas
MPA Facts MPA Name: Mediterranean Marine Protected Areas
MPA Location: Mediterranean Sea
MPA Objectives: Protecting at least 10% of each ecoregion by 2010, and establishing ecologically representative networks of MPAs by 2012
Year MPA Designated: 1960 -2007
MPA Management Authority: Differs for individual countries
Ecological System: Temperate
Offshore/Inshore/Inter-tidal: Offshore & Inshore, including and Inter-tidal
Seabed Habitat(s) Present in MPA:
Rocky coasts, kelp forests, coral reefs, sea grass beds, estuarine habitats, hard and soft bottom habitats
Number of MPAs in Network: 94
Area of MPA (km2): 97, 410 (Excluding the Pelagos Sanctuary: 87,500)
Monitoring Programme Facts Name of Programme: Currently no central monitoring programme
Who Conducts Monitoring: N/A
Status of Programme: N/A
Start Date: N/A
End Date: N/A
Programme Objectives: N/A
Biological parameters measured
N/A
Non-biological parameters measured
N/A
Key References ABDULLA, A., GOMEI, M., MAISON, E. & PIANTE, C. 2008. Status of Marine Protected Areas in the
Mediterranean Sea. IUCN, Malaga, WWF. France.
Reason for Exclusion Tropical examples with good data and access already selected; no monitoring programme in place yet or planned.

74
iSimangaliso (formerly Greater St. Lucia) Wetland Park
MPA Facts MPA Name: iSimangaliso Wetland Park
MPA Location: South African East Coast
MPA Objectives: Not specified
Year MPA Designated: 1999
MPA Management Authority: KwaZulu-Natal Nature Conservation Service
Ecological System: Subtropical and tropical
Offshore/Inshore/Inter-tidal: Inshore, including Inter-tidal:
Seabed Habitat(s) Present in MPA:
Coral reefs, dunes, lake systems, swamps, reed and papyrus wetlands
Number of MPAs in Network: 1
Area of MPA (km2): 0.85
Monitoring Programme Facts Name of Programme: No monitoring programme specified
Who Conducts Monitoring: N/A
Status of Programme: N/A
Start Date: N/A
End Date: N/A
Programme Objectives: N/A
Biological parameters measured
N/A
Non-biological parameters measured
N/A
Key References ISIMANGALISO 2012. iSimangaliso Wetland Park homepage [online]. Available from:
http://www.isimangaliso.com/index.php [Accessed 11/01/12]. WORLD HERITAGE CONVENTION 2012. iSimangaliso Wetland Park webpage [online]. Available
from: http://whc.unesco.org/en/list/914 [Accessed 11/01/12].
Reason for Exclusion Minimal information readily obtainable; no monitoring programme in place or planned

75
Galapagos Marine Reserve
MPA Facts MPA Name: Galapagos Marine Reserve
MPA Location: Galapagos Islands, Ecuador
MPA Objectives: Not specified
Year MPA Designated: 1974
MPA Management Authority: Galapagos National Park Directorate
Ecological System: Temperate
Offshore/Inshore/Inter-tidal: Inshore, including Inter-tidal
Seabed Habitat(s) Present in MPA:
Underwater mountains or volcanoes, rocky bottoms, vertical rocky walls, sandy beaches, and very few coral reefs, coastal lagoons, wetlands, mangrove areas.
Number of MPAs in Network: 1
Area of MPA (km2): 133,000
Monitoring Programme Facts Name of Programme: Línea Base de la Biodiversidad
Who Conducts Monitoring: Scientists of the Charles Darwin research station
Status of Programme: Complete
Start Date: 2000
End Date: 2001
Programme Objectives: Baseline study expected to be useful in the process of evaluating the initial effects of the interim zoning, and to measure the progress toward the long term goals of conservation and sustainable use.
Biological parameters measured
Yes
Non-biological parameters measured
Yes
Key References PARQUE NACIONAL GALAPAGOS ECUADOR 2012. About the Galapagos Marine Reserve
[online]. Available from: http://www.galapagospark.org/nophprg.php?page=reserva_marina_sobre_la [Accessed 11/01/12].
WORLD HERITAGE CONVENTION 2012. Galapagos Islands webpage [online]. Available from: http://whc.unesco.org/en/list/914 [Accessed 11/01/12].
Reason for Exclusion Tropical examples with good data and access already selected; baseline survey only, with no ongoing monitoring programme.

76
Las Cruces Marine Protected Area
MPA Facts MPA Name: Las Cruces Marine Protected Area
MPA Location: Chile
MPA Objectives: Not specified
Year MPA Designated: 2005
MPA Management Authority: Pontifica Universidad Católica de Chile (PUC)
Ecological System: Temperate
Offshore/Inshore/Inter-tidal: Offshore & Inshore, including Inter-tidal
Seabed Habitat(s) Present in MPA:
Rocky shore and subtidal rocky reefs
Number of MPAs in Network: 1
Area of MPA (km2): 0.145
Monitoring Programme Facts Name of Programme: Monitoring programme in place, but there are no scientific papers
or reports presenting a detailed assessment of recent monitoring data
Who Conducts Monitoring: N/A
Status of Programme: N/A
Start Date: N/A
End Date: N/A
Programme Objectives: N/A
Biological parameters measured
N/A
Non-biological parameters measured
N/A
Key References NAVARRETE, S., GELCICH, S. & CASTILLA, J. 2010. Long-term monitoring of coastal ecosystems
at Las Cruces, Chile: defining baselines to build ecological literacy in a world of change. Rivista Chilena de Historia Natural, 83, 143-157. [online]. Available from: http://www.scielo.cl/pdf/rchnat/v83n1/art08.pdf [Accessed 11/01/12].
WOOD, L. 2007. MPA Global: a database of the world's marine protected areas. Sea Around Us Project, UNEP-WCMC & WWF. [online]. Available from: http://www.mpaglobal.org/index.php?action=showMain&site_code=309848 [Accessed 11/01/12].
Reason for Exclusion Minimal information readily obtainable.

77
Mesoamerican Barrier Reef Systems
MPA Facts MPA Name: Mesoamerican Barrier Reef Systems (MBRS)
MPA Location: Eastern coasts of Mexico, Belize, Guatemala and Honduras
MPA Objectives: The ICRAN Mesoamerican Reef Alliance (MAR) project was a collaborative effort aimed at confronting the decline of coral reef ecosystems and improving the economic and environmental sustainability of the Mesoamerican Barrier Reef through capacity building activities, the development of better practices, and building of partnerships with the private sector.
Year MPA Designated: No information available
MPA Management Authority: No information available
Ecological System: Tropical
Offshore/Inshore/Inter-tidal: Inshore, including Inter-tidal
Seabed Habitat(s) Present in MPA:
Coral reefs
Number of MPAs in Network: No information available
Area of MPA (km2): No information available
Monitoring Programme Facts Name of Programme: Not known
Who Conducts Monitoring: N/A
Status of Programme: N/A
Start Date: N/A
End Date: N/A
Programme Objectives: N/A
Biological parameters measured
N/A
Non-biological parameters measured
N/A
Key References ICRAN (International Coral Reef Action Network). 2012. Mesoamerican Reef Alliance (MAR) [online].
Available from: http://www.icran.org/action-mar.html [Accessed 11/01/12]. WWF (World Wildlife Fund). 2012. Mesoamerican Reef: the Atlantic Ocean's largest coral reef
[online]. Available from: http://www.worldwildlife.org/what/wherewework/mesoamericanreef/index.html [Accessed 11/01/12].
Reason for Exclusion Minimal information readily obtainable.
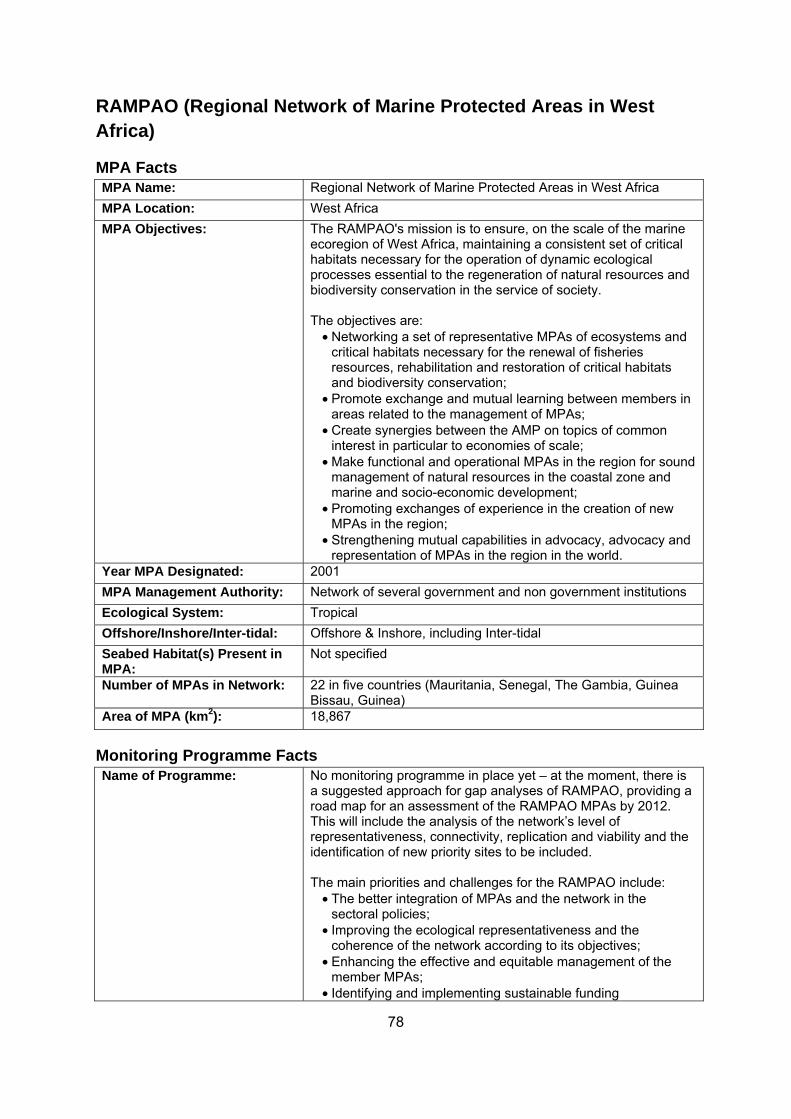
78
RAMPAO (Regional Network of Marine Protected Areas in West Africa)
MPA Facts MPA Name: Regional Network of Marine Protected Areas in West Africa
MPA Location: West Africa
MPA Objectives: The RAMPAO's mission is to ensure, on the scale of the marine ecoregion of West Africa, maintaining a consistent set of critical habitats necessary for the operation of dynamic ecological processes essential to the regeneration of natural resources and biodiversity conservation in the service of society. The objectives are:
• Networking a set of representative MPAs of ecosystems and critical habitats necessary for the renewal of fisheries resources, rehabilitation and restoration of critical habitats and biodiversity conservation;
• Promote exchange and mutual learning between members in areas related to the management of MPAs;
• Create synergies between the AMP on topics of common interest in particular to economies of scale;
• Make functional and operational MPAs in the region for sound management of natural resources in the coastal zone and marine and socio-economic development;
• Promoting exchanges of experience in the creation of new MPAs in the region;
• Strengthening mutual capabilities in advocacy, advocacy and representation of MPAs in the region in the world.
Year MPA Designated: 2001
MPA Management Authority: Network of several government and non government institutions
Ecological System: Tropical
Offshore/Inshore/Inter-tidal: Offshore & Inshore, including Inter-tidal
Seabed Habitat(s) Present in MPA:
Not specified
Number of MPAs in Network: 22 in five countries (Mauritania, Senegal, The Gambia, Guinea Bissau, Guinea)
Area of MPA (km2): 18,867
Monitoring Programme Facts Name of Programme: No monitoring programme in place yet – at the moment, there is
a suggested approach for gap analyses of RAMPAO, providing a road map for an assessment of the RAMPAO MPAs by 2012. This will include the analysis of the network’s level of representativeness, connectivity, replication and viability and the identification of new priority sites to be included. The main priorities and challenges for the RAMPAO include:
• The better integration of MPAs and the network in the sectoral policies;
• Improving the ecological representativeness and the coherence of the network according to its objectives;
• Enhancing the effective and equitable management of the member MPAs;
• Identifying and implementing sustainable funding

79
mechanisms or the MPAs and the MPAs network; and • Strengthening the functioning and institutional capacities of
the network. Source: Toropova et al (2010)
Who Conducts Monitoring: N/A
Status of Programme: N/A
Start Date: N/A
End Date: N/A
Programme Objectives: N/A
Biological parameters measured
N/A
Non-biological parameters measured
N/A
Key References TOROPOVA, C., MELIANE, I., LAFFOLEY, D., MATTHEWS, E. & SPALDING, M. 2010. Global
ocean protection: present status and future possibilities. . [online]. Available from: http://www.rampao.org/view/download/GlobalOcean_Final_lores.pdf [Accessed 10/01/12].
Reason for Exclusion No monitoring programme in place, nor proposed – network currently considering only a gap analysis. Therefore not suitable to assess in terms of monitoring procedures used.

80
NOAA System-Wide Monitoring (SWiM)
MPA Facts MPA Name: U.S. National Marine Sanctuaries (NMS)
MPA Location: U.S.A
MPA Objectives: Conserve, protect, and enhance the biodiversity, ecological integrity, and cultural legacy of the ecosystems
Year MPA Designated: First NMS designated in 1975; latest in 2000
MPA Management Authority: NOAA’s Office of National Marine Sanctuaries
Ecological System: Tropical and Temperate
Offshore/Inshore/Inter-tidal: Offshore & Inshore
Seabed Habitat(s) Present in MPA:
Rocky coasts, kelp forests, coral reefs, sea grass beds, estuarine habitats, hard and soft bottom habitats, and segments of whale migration routes.
Number of MPAs in Network: 14
Area of MPA (km2): Area of each NMS ranges from 2.6 – 13,000
Monitoring Programme Facts Name of Programme: Most sanctuaries have monitoring programmes tailored to the
information needs of the sites – one example is the System-Wide Monitoring Programme (SWiM) (NMS 2012)
Who Conducts Monitoring: Various - monitoring at the local (sanctuary) level conducted by trained scientific groups
Status of Programme: Underway
Start Date: Not specified – but some programmes already established before SWiM initiated.
End Date: N/A (ongoing)
Programme Objectives: • Ensure the timely flow of data and information to those responsible for managing and protecting resources in the ocean and coastal zone;
• Enable marine sanctuaries to develop effective, ecosystem-based monitoring programmes that address management information needs using a design process that can be applied in a consistent way at multiple spatial scales and to multiple resource types.
Source: NMSP (2004) Biological parameters measured
Yes
Non-biological parameters measured
Yes
Key References NMS (National Marine Sanctuaries). 2012. National Marine Sanctuaries web page [online]. Available
from: http://sanctuaries.noaa.gov/welcome.html [Accessed 10/01/12]. NMSP (National Marine Sanctuaries Programme). 2004. A monitoring framework for the National
Marine Santurary System. [online]. Available from: http://sanctuaries.noaa.gov/library/national/swim04.pdf [Accessed 10/01/12].
Reason for Exclusion Programme does not monitor the network per se, but rather individual MPAs only – information is then combined.
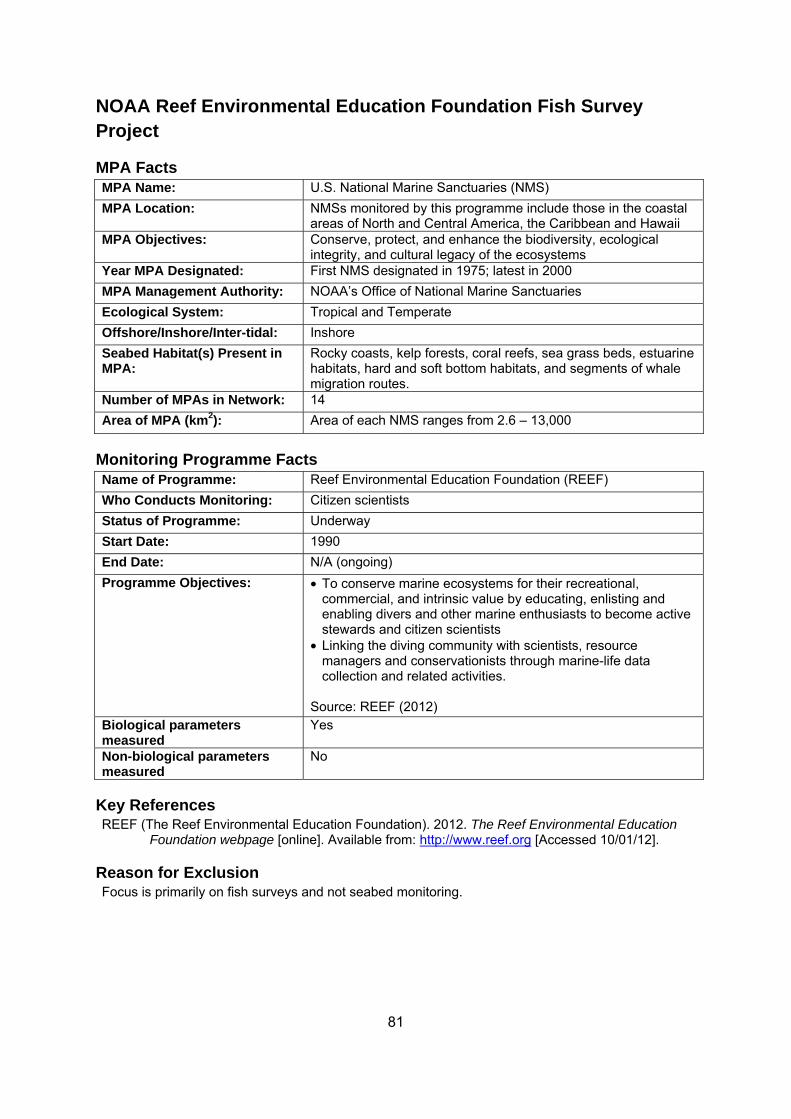
81
NOAA Reef Environmental Education Foundation Fish Survey Project
MPA Facts MPA Name: U.S. National Marine Sanctuaries (NMS)
MPA Location: NMSs monitored by this programme include those in the coastal areas of North and Central America, the Caribbean and Hawaii
MPA Objectives: Conserve, protect, and enhance the biodiversity, ecological integrity, and cultural legacy of the ecosystems
Year MPA Designated: First NMS designated in 1975; latest in 2000
MPA Management Authority: NOAA’s Office of National Marine Sanctuaries
Ecological System: Tropical and Temperate
Offshore/Inshore/Inter-tidal: Inshore
Seabed Habitat(s) Present in MPA:
Rocky coasts, kelp forests, coral reefs, sea grass beds, estuarine habitats, hard and soft bottom habitats, and segments of whale migration routes.
Number of MPAs in Network: 14
Area of MPA (km2): Area of each NMS ranges from 2.6 – 13,000
Monitoring Programme Facts Name of Programme: Reef Environmental Education Foundation (REEF)
Who Conducts Monitoring: Citizen scientists
Status of Programme: Underway
Start Date: 1990
End Date: N/A (ongoing)
Programme Objectives: • To conserve marine ecosystems for their recreational, commercial, and intrinsic value by educating, enlisting and enabling divers and other marine enthusiasts to become active stewards and citizen scientists
• Linking the diving community with scientists, resource managers and conservationists through marine-life data collection and related activities.
Source: REEF (2012) Biological parameters measured
Yes
Non-biological parameters measured
No
Key References REEF (The Reef Environmental Education Foundation). 2012. The Reef Environmental Education
Foundation webpage [online]. Available from: http://www.reef.org [Accessed 10/01/12].
Reason for Exclusion Focus is primarily on fish surveys and not seabed monitoring.

82
NOAA Sanctuary Integrated Monitoring Network (SIMoN)
MPA Facts MPA Name: U.S. National Marine Sanctuaries (NMS)
MPA Location: NMSs monitored by this programme include those in Monterey Bay, Gulf of the Farallones, and Cordell Bank, with the eventual goal of expanding throughout the NMS Program
MPA Objectives: Conserve, protect, and enhance the biodiversity, ecological integrity, and cultural legacy of the ecosystems
Year MPA Designated: First NMS designated in 1975; latest in 2000
MPA Management Authority: NOAA’s Office of National Marine Sanctuaries
Ecological System: Tropical and Temperate
Offshore/Inshore/Inter-tidal: Offshore & Inshore
Seabed Habitat(s) Present in MPA:
Rocky coasts, kelp forests, coral reefs, sea grass beds, estuarine habitats, hard and soft bottom habitats, and segments of whale migration routes.
Number of MPAs in Network: 14
Area of MPA (km2): Area of each NMS ranges from 2.6 – 13,000
Monitoring Programme Facts Name of Programme: Sanctuary Integrated Monitoring Network (SIMoN)
Who Conducts Monitoring: • Trained scientists at sanctuary level. • There is also collaboration between researchers, resource
managers, educators and the public Status of Programme: Underway
Start Date: Not specified
End Date: N/A (ongoing)
Programme Objectives: The goals of the SIMoN program are to: 1. Integrate existing and historic monitoring in sanctuaries (via a
database); 2. Establish and maintain essential, long-term monitoring
programs to provide a synoptic over-view of these marine ecosystems; and
3. Disseminate timely information to resource managers and decision makers, researchers, educators, and the general public.
Source: SIMoN (2012)
Biological parameters measured
Yes
Non-biological parameters measured
Yes
Key References SIMON (Sanctuary Integrated Monitoring Network). 2012. Sanctuary Integrated Monitoring Network
web page [online]. Available from: http://www.sanctuarysimon.org/index.php [Accessed 10/01/12].
Reason for Exclusion Programme does not monitor the network per se, but rather individual MPAs only – information is then combined.

83
North American Marine Protected Areas Network (NAMPAN)
MPA Facts MPA Name: North American Marine Protected Areas Network (NAMPAN)
MPA Location: Canada, U.S.A, Mexico
MPA Objectives: • Enhance and strengthen the conservation of biodiversity in critical marine habitats throughout North American MPAs and facilitating information exchange among experts;
• Implement complementary, integrated conservation efforts; • Increase collaboration and development of cross-cutting
conservation initiatives; • Enhance collaboration to address common challenges to
marine biodiversity; • Increase regional, national and international capacity to
conserve critical marine and coastal habitats by sharing information, new technologies and management strategies.
Year MPA Designated: 1999
MPA Management Authority: Commission for Environmental Cooperation, plus a network of resource agencies, MPA managers, and other relevant experts from:
• Canada (Parks Canada, Department of Fisheries and Oceans)
• Mexico (Comisión Nacional de Áreas Naturales Protegidas; Conanp)
• U.S.A. (National Oceanic and Atmospheric Administration; NOAA)
Ecological System: Tropical/Temperate/Polar
Offshore/Inshore/Inter-tidal: Offshore & Inshore
Seabed Habitat(s) Present in MPA:
Not specified
Number of MPAs in Network: >1,000
Area of MPA (km2): Not specified
Monitoring Programme Facts Name of Programme: Pilot Study: Development of scorecard for the Baja California to
Bering Sea (B2B) region Who Conducts Monitoring: MPA site manager and expert team
Status of Programme: Complete – but to be rolled out across the NAMPAN
Start Date: 2007
End Date: 2008
Programme Objectives: • To develop standardized marine ecological scorecards and condition reports, to use as tools for assessing the condition of MPAs in North America.
• The ecological scorecard provides a visual summary of the status of, and trends in, water, habitat, and living resources within the MPA, and the condition report provides a written summary of this information. These tools are intended to be used to understand and respond to changes at the MPA level.
• The scorecards do not replace well-designed, sustained monitoring programs and reporting used by the MPA agencies themselves that should continue to be relied upon for agency-approved reporting on ecosystem condition and trends. Instead, the scorecards can serve as a tool to identify gaps in knowledge, to bridge gaps between technical/scientific

84
communities and the public-at-large, and to allow comparisons across a broad region.
Source: CEC (2011) and NAMPAN (2012c)
Biological parameters measured
Yes
Non-biological parameters measured
Yes
Key References CEC (Commission for Environmental Cooperation). 2011. A guide to ecological scorecards for
marine protected areas in North America. [online]. Available from: http://www.cec.org/Storage/98/9685_Marine_scorecard_en.pdf [Accessed 10/01/12].
NAMPAN (North American Marine Protected Areas Network). 2012a. North American Marine Protected Areas Network web page [online]. Available from: http://www2.cec.org/nampan/ [Accessed 10/01/12].
Reason for Exclusion NAMPAN primarily focussed on developing score cards for different MPAs in the network; little information available on existing monitoring programmes.
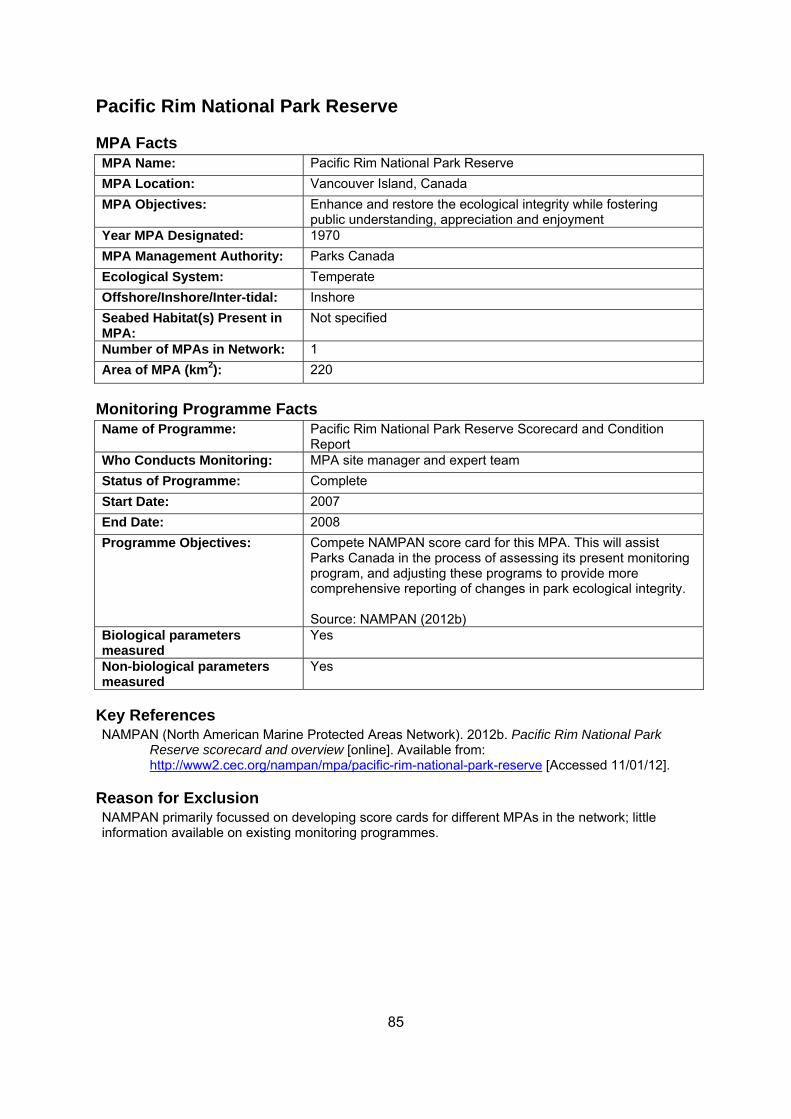
85
Pacific Rim National Park Reserve
MPA Facts MPA Name: Pacific Rim National Park Reserve
MPA Location: Vancouver Island, Canada
MPA Objectives: Enhance and restore the ecological integrity while fostering public understanding, appreciation and enjoyment
Year MPA Designated: 1970
MPA Management Authority: Parks Canada
Ecological System: Temperate
Offshore/Inshore/Inter-tidal: Inshore
Seabed Habitat(s) Present in MPA:
Not specified
Number of MPAs in Network: 1
Area of MPA (km2): 220
Monitoring Programme Facts Name of Programme: Pacific Rim National Park Reserve Scorecard and Condition
Report Who Conducts Monitoring: MPA site manager and expert team
Status of Programme: Complete
Start Date: 2007
End Date: 2008
Programme Objectives: Compete NAMPAN score card for this MPA. This will assist Parks Canada in the process of assessing its present monitoring program, and adjusting these programs to provide more comprehensive reporting of changes in park ecological integrity. Source: NAMPAN (2012b)
Biological parameters measured
Yes
Non-biological parameters measured
Yes
Key References NAMPAN (North American Marine Protected Areas Network). 2012b. Pacific Rim National Park
Reserve scorecard and overview [online]. Available from: http://www2.cec.org/nampan/mpa/pacific-rim-national-park-reserve [Accessed 11/01/12].
Reason for Exclusion NAMPAN primarily focussed on developing score cards for different MPAs in the network; little information available on existing monitoring programmes.

86
Race Rocks Ecological Reserve and Marine Protected Area
MPA Facts MPA Name: Race Rocks Ecological Reserve and Marine Protected Area
MPA Location: British Columbia, Canada
MPA Objectives: Preserve unique or representative ecosystems in the province of British Columbia that could serve for research and education and serve as baselines for monitoring ecological change with the encroachment of humans into natural areas
Year MPA Designated: 1980: designated as an Ecological Reserve 1998: Canadian Marine Protected Area – Area of Interest
MPA Management Authority: British Columbia Parks has given Lester B. Pearson College a 30 year lease to manage the ecological reserve
Ecological System: Temperate
Offshore/Inshore/Inter-tidal: Inshore, including Inter-tidal
Seabed Habitat(s) Present in MPA:
Not specified
Number of MPAs in Network: 1
Area of MPA (km2): 25
Monitoring Programme Facts Name of Programme: Race Rocks MPA Scorecard and Condition Report
Who Conducts Monitoring: Students and scientists of the Lester B. Pearson College
Status of Programme: Complete
Start Date: 2007
End Date: 2008
Programme Objectives: Compete NAMPAN score card for this MPA. This will assist British Columbia Parks in the process of assessing its present monitoring program, and adjusting these programs to provide more comprehensive reporting of changes in park ecological integrity. Source: NAMPAN (2012a) and UWC Pearson College (2012)
Biological parameters measured
Yes
Non-biological parameters measured
Yes
Key References NAMPAN (North American Marine Protected Areas Network). 2012c. Race Rocks Ecological
Reserve and Marine Protected Area scorecard and overview [online]. Available from: http://www2.cec.org/nampan/mpa/race-rocks-ecological-reserve-and-marine-protected-area [Accessed 11/01/12].
UWC PEARSON COLLEGE 2012. Race Rocks web page [online]. Available from: http://www.racerocks.com/ [Accessed 11/01/12].
Reason for Exclusion NAMPAN primarily focussed on developing score cards for different MPAs in the network; little information available on existing monitoring programmes.

87
South Orkney Islands southern shelf MPA
MPA Facts MPA Name: South Orkney Islands southern shelf MPA
MPA Location: South Orkney Islands, Antarctica
MPA Objectives: Not yet agreed upon, but will prohibit all fishing activities, as well as waste disposal and discharge from fishing vessels within its boundaries, and will allow for improved coordination of scientific research activities.
Year MPA Designated: 2010 (first entirely ‘High Seas’ MPA)
MPA Management Authority: The Convention on the Conservation of Antarctic Marine Living Resources (CCAMLR)
Ecological System: Polar
Offshore/Inshore/Inter-tidal: Offshore
Seabed Habitat(s) Present in MPA:
Submarine shelf areas and seamounts
Number of MPAs in Network: 1
Area of MPA (km2): 94,000
Monitoring Programme Facts Name of Programme: No specific programme yet, but CCAMLR has endorsed the
recommendation that the process for designation of an MPA include the development of a research and monitoring program to be conducted within a specified timetable (e.g. 3 to 5 years). Source: CCAMLR (2011, 2010, 2009)
Who Conducts Monitoring: N/A – likely to be CCAMLR Member States
Status of Programme: In development
Start Date: N/A
End Date: N/A
Programme Objectives: N/A
Biological parameters measured
N/A
Non-biological parameters measured
N/A
Key References CCAMLR (Convention on the Conservation of Antarctic Marine Living Resources). 2011. Report of
the thirtieth meeting of the Commission (Advance Copy). Convention on the Conservation of Antarctic Marine Living Resources. [online]. Available from: http://www.ccamlr.org/pu/e/e_pubs/cr/drt.htm [Accessed 11/01/12].
CCAMLR (Convention on the Conservation of Antarctic Marine Living Resources). 2010. Report of the twenty-ninth meeting of the Commission. Convention on the Conservation of Antarctic Marine Living Resources. [online]. Available from: http://www.ccamlr.org/pu/e/e_pubs/cr/drt.htm [Accessed 11/01/12].
CCAMLR (Convention on the Conservation of Antarctic Marine Living Resources). 2009. Report of the twenty-eigth meeting of the Commission. Convention on the Conservation of Antarctic Marine Living Resources. [online]. Available from: http://www.ccamlr.org/pu/e/e_pubs/cr/drt.htm [Accessed 11/01/12].
Reason for Exclusion MPA recently established but no monitoring programme in place or proposed.

88
Appendix 4 Factsheets containing information on each case study reviewed Case Study No. 1 Long Term Monitoring Program, Great Barrier
Reef Marine Park Code: GB
MPA Facts MPA Name: Great Barrier Reef Marine Park
MPA Location: Queensland, Australia
MPA Objectives: Primary: Provide for the long term protection and conservation of the environment, biodiversity and heritage values of the Great Barrier Reef Region (Australian Government 2011b). Additional: a) Allow ecologically sustainable use of the Great Barrier Reef Region b) Encourage engagement in the protection and management of the Great Barrier Reef Region c) Assist in meeting Australia’s international responsibilities in relation to the environment and protection of world heritage
Year MPA Designated: 1975 – Not fully implemented until 1989 (Addison 2011)
Legislation used to Designate MPA:
Great Barrier Reef Marine Park Act 1975 (Australian Government 2011b) Also see information on the range of legislation specific to the Great Barrier Reef Marine Park on the Great Barrier Reef Marine Park Authority webpage.
MPA Management Authority: The primary management authority is the Great Barrier Reef Marine Park Authority (GBRMPA) Other management authorities, as outlined by GBRMPA (2011) include:
• Queensland Parks and Wildlife Service: responsible for some areas of and activities in the marine park
• Queensland Fisheries: under an agreement with the Australian Government, Fisheries Queensland undertakes much of the fisheries management within the Marine Park.
Ecological System: Tropical
Offshore/Inshore/Inter-tidal: Offshore & Inshore
Seabed Habitat(s) Present in MPA:
Inshore and offshore coral reef communities (including corals, other benthic invertebrates, algae and fish). Mangroves Seagrasses
Number of MPAs in Network: N/A (single)
Area of MPA (km2): 344,000
Map of MPA: Available? Yes
Map of MPA: Reference/Link: GBRMPA General Reference Map (Australian Government 2011a)

89
Monitoring Programme Facts Name of Programme: Long Term Monitoring Programme (LTMP)
Who Conducts Monitoring: Australian Institute of Marine Science (AIMS)
Status of Programme: Underway
Start Date: 1993 (modified in 2004 in response to re-zoning)
End Date: Ongoing
Programme Objectives: Primary Objective (of coral reef monitoring) is to track changes in reef communities over time across the subregions of the GBR (Sweatman et al 2008). Reefs in a ‘subregion’ are those that lie in one of three positions across the shelf (inshore, mid-shelf, outer shelf) (Sweatman et al 2008). Specific Objectives: 1. To monitor the status and changes in distribution and abundance of reef biota on a large scale 2. To provide environmental managers with a context for assessing impacts of human activities within the GBRMP and with a basis for managing the GBR for ecologically sustainable use 3. To examine the effects of re-zoning the GBRMP on biodiversity (in alternate years)
Measurable Targets: Not specified
Cost of Programme: Total (person days/year)
Not available
Cost of Programme: Monitoring (person days/year)
Not available
Cost of Programme: Analysis (person days/year)
Not available
Cost of Programme: Assessment (person days/year)
Not available
Monitoring Programme Design Programme Design: Spatial Intensive Surveys (includes surveys of sessile benthic
organisms, fishes, and searches for agents of coral mortality). • Conducted on 46 ‘core’ reefs that span the variation in
composition of coral and fish communities. • Core reefs were selected from six of the 11 cross-shelf
sectors, with three or more reefs selected in each of the three positions across the continental shelf (inshore, middle shelf, outer shelf).
• Sites are located in the first stretch of continuous reef (excluding vertical drop-offs) to be encountered when following the perimeter from the back reef zone towards the front reef in a clockwise direction. The sites are usually situated on the north east flank of the reef. Sites are separated by at least 250 m where possible.
• Five 50 m transects are surveyed in each site • Transects were initially laid haphazardly, roughly following 1-
40 m depth contour – now permanently marked with star picket at each end and reinforcing rod at 10 m intervals
• Transects run parallel to reef crest at about 6-9 m depth Broadscale Surveys (includes manta tow surveys for crown-of-thorns starfish (COTS) and reef-wide coral cover)
• Conducted on an additional 55 reefs from the 11 cross-shelf

90
sectors • Manta tows are conducted around the entire perimeter of the
reef
Schematic of sampling effort on a core survey reef (Sweatman et al 2008). Effects of new zoning plan – a new zoning plan was implemented in 2003 (see GBRMP Zoning Plan). To assess the effects of re-zoning, pairs of mid-shelf and outer shelf reefs were selected for survey. In each pair, both had been open to fishing prior to 2004, but one reef had been re-zoned as a no-take area in 2004. The same techniques are used on these reefs as those for the intensive and broadscale surveys. Full details available in Sweatman et al (2008).
Programme Design: Temporal Intensive and Broadscale Surveys • Initially, annual surveys were conducted; however
programme was modified in 2006 when analyses of trajectories of coral cover on the survey reefs showed that little information would be lost if surveys were made every second year. This made it possible to extend the programme to monitor the effects of re-zoning of the GBRMP in 2004 by surveying an appropriate set of different reefs in alternate years.
• Each reef is surveyed at about the same time of year in a series of five or six cruises
• Note, ‘key’ reefs selected for broadscale surveys are surveyed every year; ‘cycle’ reefs are surveyed third year
Effects of re-zoning plan Surveys
• Conducted in alternate years to those above Full details available in Sweatman et al (2008).
Programme Methodology/Equipment
Intensive Surveys: • Sessile benthic organisms: o Initially involved analyzing selected frames from a
continuous video record o Method altered in 2007 whereby single frames are shot at
1 m intervals, ~50-cm above substrate, using a digital still camera in a housing (better resolution and cameras cheaper than video cameras)

91
o Percent cover of corals and other benthic categories estimated using point sampling, in which ~200 systematically dispersed points are sampled from each video transect.
• Reef fish: o Fish of 214 species are counted on each transect o Larger mobile fishes (141 species) are counted in a 5 m
wide belt transect o Damsel fishes (73 species) are counted in a 1 m wide belt
on the return swim along the transects. o Total length of coral trout species (commercially important)
are recorded along transects, as well as other species regularly targeted by fishers.
• Agents of coral mortality (SCUBA search) o COTS and size (juvenile, small or large adult) of COTS,
COTS feeding scars, Drupella spp., Drupella spp. feeding scars, unknown scars, percentage of corals that are bleached and the numbers of colonies with five categories of coral disease that occur in a 2 m wide belt that is centred on the transect tapes are recorded by a diver.
Broadscale Surveys:
• Manta tow surveys (English et al 1997, Miller 2004) for COTS and reef-wide coral cover estimates.
Quality Control: Each part of the programme has quality control measures in place, and Standard Operating Procedures (SOPs) have been produced. SOPs are reviewed every 2 years; current SOPs are available from the AIMS website (SOPs). Full details available in Sweatman et al (2008).
Level of Expertise Required High
Reason for Expertise Level Trained scientists and divers
What does Programme Monitor?
Status of MPA Effects of zoning inside vs. outside MPA
Parameters Measured Intensive Surveys: • Sessile benthic assemblages • Reef fish • Agents of coral mortality (SCUBA search)
Broadscale Surveys:
• COTS • Coral cover • Visibility
Programme does not address associated habitats: mangroves, seagrass beds, soft substrate between reefs
Justification for Parameters Not specified
Type of Data Collected for Parameter
Intensive Surveys: • Sessile benthic assemblages: o Percent cover of hard corals, soft corals, algae (macro-
algae, turf and coralline), and ‘other’ o Corals grouped by order, subclass, family or genus
• Reef fish o Abundance of species o Length of some species
• Agents of coral mortality (SCUBA search)

92
o COTS and size (juvenile, small or large adult) of COTS, COTS feeding scars, Drupella spp., Drupella spp. feeding scars, unknown scars, percentage of corals that are bleached and the numbers of colonies with five categories of coral disease
Broadscale Surveys:
• COTS: o Number, size class
• Coral cover o Percent live coral, percent dead coral, percent soft coral,
presence of feeding scars • Visibility o Distance categories
Frequency Parameter Measured
Every survey
Map of Monitored Sites: Available?
Yes
Map of Monitored Sites: Reference/Link
Sweatman et al (2008)
Reporting Statistical Analysis Used: Data Storage:
All data are entered using a number of purpose-designed data entry and checking programs. All data is stored in an OracleTM database at AIMS. Intensive Surveys:
• Sessile benthic assemblages o Percent cover and abundance estimates are calculated
from surveys, and temporal trends (both sector and GBR-wide) estimated using linear mixed effects models.
o Substantial increasing or decreasing trends are defined as absolute changes > 3%; no substantial change is defined as absolute changes <3%.
o Empirical logit transformations of annual cover are performed before analysis
• Reef fish o Abundance estimates are calculated from count data, and
temporal trends (both sector and GBR-wide) estimated using linear mixed effects models.
o Substantial increasing or decreasing trends are defined as absolute changes > 10%; no substantial change is defined as absolute changes <10%.
o Larger species are grouped into families and damsel fish into genera to increase power of tests.
o Data is log-transformed to reduce influence of abundant taxa and to stabilize variances for analyses.
• Agents of coral mortality o Data summaries are prepared
Broadscale Surveys:
• Percent cover of live/dead hard coral and live sort coral is calculated from the manta tow results by representing each cover category by the mid-point of its range.
• Coral cover, the number of COTS per reef and aveage number of COTS per tow are used to assess outbreak status (4 categories – see Sweatman et al 2008)

93
• Reef-level trends in coral cover and average COTS density are calculated from surveys and then averaged over all reefs in each sector to provide descriptive summaries for comparison among all sectors of the GBR.
Full details available in Sweatman et al (2008).
Reporting Style: Status reports Scientific Papers Non-technical summary reports Large scale reviews
Reporting Frequency: No set reporting frequency Status reports to date: 8 (roughly every 2-3 years)
Use of Results Is Design of Programme to Inform Management?
Yes
Is Design of Programme to Indicate if Management Works?
Not specifically, but information has been used to do so.
Is there Evidence that Results Used?
Yes
Use of Results Zones modified
Key References ADDISON, P. 2011. The application of a good monitoring framework to marine biological monitoring:
a global review of long-term Marine protected Area monitoring programmes. Volume 1. A report prepared for the Joint Nature Conservation Committee. Joint Nature Conservation Committee 455.
AUSTRALIAN GOVERNMENT 2011a. Great Barrier Reef Marine Park Act No. 85 of 1975. Canberra, Australia. [online]. Available from: http://www.comlaw.gov.au/Details/C2010C00166 [Accessed 03/01/12].
AUSTRALIAN GOVERNMENT 2011b. Map of the Great Barrier Reef Marine Park. Canberra, Australia. [online]. Available from: http://www.reefhq.com.au/__data/assets/pdf_file/0009/18783/SDC2004120620Sept200420General20Reference.pdf [Accessed 03/01/12].
ENGLISH, S., WILKINSON, C. & BAKER, V. 1997. Survey manual for tropical marine resources. 2nd Edition. Townsville, Australia: Australian Institute of Marine Sciences.
GBRMPA G. B. R. M. P. Authority). 2011. Great Barrier Reef Marine Park Authority [online]. Available from: http://www.gbrmpa.gov.au/ [Accessed 03/01/12].
MILLER, I. 2004. Crown-of-thorns starfish and coral surveys using the manta tow and SCUBA search techniques. Standar Operational Procedure No. 8. Australian Institute of Marine Science.
SWEATMAN, H., CHEAL, A., COLEMAN, G., EMSLIE, M., JOHNS, K., JONKER, M., MILLER, I. & OSBORNE, K. 2008. Long-term monitoring of the Great Barrier Reef, Status Report 8. Australian Institute of Marine Science. [online]. Available from: http://www.aims.gov.au/source/research/monitoring/status-reports/status-report-08.pdf [Accessed 03/01/12].

94
Case Study No. 2 The Gully MPA Code: GU
MPA Facts MPA Name: The Gully MPA MPA Location: Scotian Shelf, Canada
MPA Objectives: 1. Protect the natural biodiversity of the Gully 2. Protect the physical structure of the Gully and its physical and
chemical properties 3. Maintain the productivity of the Gully ecosystem
Year MPA Designated: 2004
Legislation used to Designate MPA:
Oceans Act (Canadian Government 2011)
MPA Management Authority: Fisheries and Oceans Canada (DFO)
Ecological System: Temperate
Offshore/Inshore/Inter-tidal: Offshore only
Seabed Habitat(s) Present in MPA:
Deep sea canyon, continental slope, abyssal plain, cold water corals, bedrock, gravel, sands, silts, iceberg pits, pockmarks
Number of MPAs in Network: N/A (single)
Area of MPA (km2): 2,364
Map of MPA: Available? Yes
Map of MPA: Reference/Link DFO (2010)
Monitoring Programme Facts Name of Programme: Gully Marine Protected Area Monitoring Indicators, Protocols And
Strategies Who Conducts Monitoring: Fisheries and Oceans Canada (DFO)
Status of Programme: In development
Start Date: Not yet determined. • However, there is previous and ongoing monitoring within and
near the Gully MPA (DFO 2010): o The Atlantic Zonal Monitoring Program (AZMP) was
implemented in 1998 to detect and monitor seasonal and interannual variability of biological, chemical and physical properties of coastal waters of eastern Canada. Stations were sampled opportunistically inside the Gully by DFO until about 2005, when four stations within the Gully were identified to be sampled annually in April and October. A wide variety of oceanographic variables are monitored.
o From research vessels associated with the AZMP, Environment Canada monitors the distribution and abundance of seabird species within and beyond the Gully MPA. Surveys within the Gully MPA have been conducted by the Canadian Wildlife Service since 2006 in both April and October.
o DFO has conducted an annual multispecies research vessel (RV) survey in the Region using bottom trawl gear each July since 1970. This stratified random survey has periodically included stations within the boundaries of the Gully MPA, the last one being in 2005.
End Date: Not yet determined
Programme Objectives: Priority conservation issues which are focus of monitoring: 1. Protecting cetaceans from impacts caused by human

95
activities; 2. Protecting seafloor habitat and associated benthic
communities from alteration caused by human activities; 3. Maintaining or restoring the quality of the water and
sediments of the Gully, and 4. Conserving other commercial and non-commercial living
resources Measurable Targets: Not specified
Cost of Programme: Total (person days/year)
• Programme costs have not been determined, however to achieve efficiency and cost-effectiveness, it has been recommended that the selected indicators be monitored through a number of component programs, one of which would involve compiling data already collected for other purposes.
• Most of the proposed component monitoring programs are based around a single platform and several utilize existing routine deployments, such as the AZMP or DFO’s multispecies bottom trawl survey.
• Where new deployments are unavoidable, wherever possible they have been chosen as extensions of existing programs to better use expertise and equipment already routinely deployed by DFO and to facilitate the combination of Gully data with wider datasets from the Eastern Scotian Shelf (DFO 2010).
Cost of Programme: Monitoring (person days/year)
See above
Cost of Programme: Analysis (person days/year)
See above
Cost of Programme: Assessment (person days/year)
See above
Monitoring Programme Design Programme Design: Spatial Only spatial design of the coral/benthic habitat monitoring
programme is discussed here – for other indicators, see Kenchington (2010) and DFO (2010).
• Coral monitoring: o 3 transects (2 previously surveyed) spread across the
MPA. o No comparative monitoring outside MPA.
Programme Design: Temporal Only temporal design of the coral/benthic habitat monitoring programme is discussed here – for other indicators, see Kenchington (2010) and DFO (2010).
• Coral monitoring: o Every 10 years, and after severe storms and accidental
events, as well as before and after planned bottom-contacting activities that may cause damage to corals
Programme Methodology/Equipment
Proposed that video transects will be used. In previous surveys, the following methods/equipment were employed:
• Video and photographic imagery was collected from The Gully in 1997 – 2000 by DFO and NRCan (Cogswell et al 2009). There were 92 stations (79 Campod stations, 8 Benthos camera stations and 5 Videograb stations). Campod is the DFOs remotely operated camera on an aluminum tripod frame.
• Physical variables describing the benthic environment from

96
31 stations of the 92 stations, representing inner and outer parts of The Gully were obtained from the following sources: water depth – from ship log; sediment type – from underwater photographs and multibeam interpretation; and local slope – from multibeam bathymetry. Images from 31 stations of the 92 stations, representing inner and outer parts of The Gully were also examined, to find patterns of epifauna biomass and respiration. Respiration was measured using fresh specimens collected with the DFO Videograb.
• Video/Images/Collections were taken in the Gully in 2006 using Deep Seabed Intervention System (DSIS), and in 2007 using Remotely Operated Platform for Ocean Science (ROPOS). Video/images only were taken in 2008 using the DFOs Campod.
Level of Expertise Required High
Reason for Expertise Level Need to use large offshore vessels
What does Programme Monitor?
Status of MPA only
Parameters Measured Forty-seven indicators have been recommended to be monitored through fourteen separate “component programs”. A further four component programs are recommended for the preparation of baselines, even though no corresponding indicators have yet be defined. Additional indicators may emerge once the baselines have been established.
• Indicators 13-16 relate to coral/benthic surveys and it is
proposed that the following parameters are measured: o Coral distribution, density and size structure by species
(indicator 13) o Coral diversity (indicator 14) o Proportions of live and dead corals, by species (indicator
15) o Proportion of live corals that show zooanthid over-growths
and the extent of over-growth in any affected colonies (indicator 16)
• Other proposed indicators relate to monitoring parameters of
cetaceans, fish and fishery resources, seabirds, environmental condition, and vessel activity within the MPA(see Kenchington 2010 for full details).
Justification for Parameters Rationale for all proposed indicators is given – full details provided in Kenchington (2010). For coral/benthic monitoring, justification for the indicators is as follows:
o Indicators 13 and 14: deepwater corals are signature species of the MPA and are specifically mentioned in the MPA’s Monitoring Plan. Such corals were also recognized as prime examples of “Vulnerable Marine Ecosystems” by the U.N. General Assembly in 2006 and are regarded as “structural habitat features” under Canada’s 2009 Policy for Managing the Impacts of Fishing on Sensitive Benthic Areas. Ensuring that they are effectively conserved is a key responsibility for this monitoring program.
o Indicator 15: Most threats to the corals cannot be efficiently monitored by direct observations. However, the cumulative consequences of all threats can be monitored, from the video records of the coral surveys, at a gross level by observing the proportions of live and dead

97
material – the difference being readily perceived and yet the skeletal material being persistent over long periods. This indicator can only represent a relative index, not a quantitative measure of mortality rates. As such, it does not require knowledge of the various breakdown rates of dead coral of different species.
o Indicator 16: The only biotic threat to the corals yet observed is their over-growth by zooanthids, which have been seen to be killing corals in the Northeast Channel (between Georges and Browns banks). That too can be readily monitored using video records.
Type of Data Collected for Parameter
Species diversity and abundance; percent cover; proportional data
Frequency Parameter Measured
Every 10 years
Map of Monitored Sites: Available?
Yes (of some coral monitoring sites)
Map of Monitored Sites: Reference/Link
Cogswell et al (2009)
Reporting Statistical Analysis Used: • Data for Indicators 15 and 16 have not yet been collected.
• Data for Indicators 13 and 14 have been collected occasionally and analysed – e.g. Cogswell et al (2009), using the following: o Similarity between frequencies of occurrence of different
taxa was calculated using a Bray-Curtis similarity index. Cluster analysis was performed on a dissimilarity matrix and Ward's method of linkage was used to distinguish groups of co-occurring of taxa.
Reporting Style: No reporting completed yet
Reporting Frequency: Not yet specified
Use of Results Is Design of Programme to Inform Management?
Yes
Is Design of Programme to Indicate if Management Works?
No
Is there Evidence that Results Used?
N/A – in development
Use of Results N/A – in development
98
Key References CANADIAN GOVERNMENT 2011. Oceans Act [online]. Available from: http://laws-
lois.justice.gc.ca/PDF/O-2.4.pdf [Accessed 03/01/12]. COGSWELL, A., KENCHINGTON, T., LIRETTE, C., MACISAAC, K., BEST, M., BEAZLEY, L. &
VICKERS, J. 2009. The current state of knowledge concerning the distribution of coral in the maritime provinces. Department of Fisheries and Oceans Canada Canadian Technical Report of Fisheries and Aquatic Sciences 2855. [online]. Available from: http://ecovector.com/Publications/Gully%20Can%20Tech%20Rep_2002.pdf [Accessed 03/01/12].
DFO (Department of Fisheries and Oceans). 2010. Gully Marine Protected Area Monitoring Indicators, Protocols and Strategies. Department of Fisheries and Oceans Canada Canadian Science Advisory Secretariat Science Advisory Report 2010/066. [online]. Available from: http://www2.mar.dfo-mpo.gc.ca/science/rap/internet/SAR_2010_066_E.pdf [Accessed 04/01/12].
KENCHINGTON, T. 2010. Environmental monitoring of the Gully Marine Protected Area: a recommendation. Department of Fisheries and Oceans Canada. [online]. Available from: http://www.dfo-mpo.gc.ca/CSAS/Csas/publications/resdocs-docrech/2010/2010_075_e.pdf [Accessed 04/01/12].

99
Case Study No. 3 Ecosystem Monitoring, Tasmania‘s Marine Reserves, Tasmania Code: TA
MPA Facts MPA Name: Tasmania‘s Marine Reserves
MPA Location: Tasmania, Australia
MPA Objectives: a) To establish and manage a comprehensive, adequate and representative system of MPAs, to contribute to the long-term ecological viability of marine and estuarine systems b) To maintain ecological processes and systems c) To protect Tasmania‘s biological diversity (DPIWE 2000)
Year MPA Designated: Seven marine reserves have been designated in Tasmania at various points through time: • 1991: Governor Island, Ninepin Point, Tinderbox, Maria Island • 2000: Macquarie Island Marine Reserve • 2004: The Kent Group and Port Davey Marine Reserve (DPIWE 2000, Tas PAWS 2009)
Legislation used to Designate MPA:
Living Marine Resources Management Act 1975 National Parks and Wildlife Act 1970
MPA Management Authority: Department of Primary Industries, Parks, Water and Environment (DPIWE)
Ecological System: Temperate
Offshore/Inshore/Inter-tidal: Inshore only
Seabed Habitat(s) Present in MPA:
Sub-tidal rocky reef assemblages (algae, invertebrates, fish), soft sediments (primarily sand), seagrass
Number of MPAs in Network: 7
Area of MPA (km2): 1,227
Map of MPA: Available? Yes
Map of MPA: Reference/Link Tasmania's Marine Nature Reserves - DPIWE (DPIWE 2012) Tasmania's Marine Nature Reserves - Tas PAWS (Tas PAWS 2012)
Monitoring Programme Facts Name of Programme: Case Study: Ecosystem monitoring of sub-tidal reefs in
Tasmania’s Marine Reserves Who Conducts Monitoring: Tasmania Aquaculture and Fisheries Institute (TAFI) which is
now part of the Institute for Marine and Antarctic Studies (IMAS) Status of Programme: Underway
Start Date: 1993
End Date: Ongoing
Programme Objectives: To determine if there were any identifiable effects associated with the removal of fishing pressure within reserves on target species, bycatch species or the broader ecosystem over this ecologically significant timescale (one decade).
Measurable Targets: No specific performance targets were set
Cost of Programme: Total (person days/year)
270
Cost of Programme: Monitoring (person days/year)
130 (includes field work, and quality control)
Cost of Programme: Analysis (person days/year)
40 (average). Varies depending on scope of analysis.

100
Cost of Programme: Assessment (person days/year)
100
Monitoring Programme Design Programme Design: Spatial • Programme is conducted in four of the seven marine reserves
in Tasmania, plus their associated reference sites: Ninepin Point, Tinderbox, Maria Island, Governor Island
• Four ‘no-take’ and ‘restricted-take’ zones (Marine Reserves) are compared to non-restricted zones (reference sites).
• Within each zone, multiple reefs (between 1 and 6) are monitored.
• At each reef a 200 m long transect (split into four 50 m units), fixed at the 5 m depth contour is surveyed.
Full details available in Barrett et al (2009, 2007).
Programme Design: Temporal • Surveys conducted two times each year in 1992, 1993 and 1997 in all reserves: o ‘Autumn’ – between February and late April o ‘Spring’ – September
• Less extensive in terms of reserves or seasons in other years through to and beyond 2002.
Full details available in Barrett et al (2009, 2007). NB: Monitoring now conducted annually in six of the seven MPAs (Ninepin Point, Tinderbox, Maria Island, Governor Island, Port Davey and Kent group), with annual monitoring of those since 2002 and prior monitoring on several occasions going back to 1994.
Programme Methodology/Equipment
Experimental design: • Based on a BACI (before, after, control, impact) design, with
before and after comparisons made between reserve (impact) and fished (control) sites. Multiple sites were examined within each treatment to give generality to any observed response time.
Invertebrate census and size of abalone and lobsters: • Four 1 x 50m SCUBA transects along 5m depth contour Relative abundance and size of fishes: • Four 1 x 50m SCUBA transects along 5m depth contour Macroalgal species cover: • 0.5 x 0.5m quadrats at 10m intervals along the 200m transect • Quadrat was divided into a grid of 7 x 7 perpendicular wires,
giving 50 points (including one corner) per sample position, under each of which the cover of the various species present was recorded. Initially the cover of over-storey was recorded, and then these swept aside to expose under-storey species for counting.
Full details available in Barrett et al (2009, 2007)
Level of Expertise Required High for algal surveys; Medium for fish and invertebrates. Now have Reef Life Survey which engages volunteer divers to conduct similar fish and invertebrate surveys on various reefs within the network.

101
Reason for Expertise Level Trained scientists and divers; Volunteers
What does Programme Monitor?
Status of MPA Effects of removing fishing pressure inside vs. outside MPA
Parameters Measured Invertebrate census: • Counts of mobile mega-faunal invertebrates (>20 mm length) Fishes: • Fish sizes were recorded in the following categories: 25, 50,
75, 100, 125, 150, 200, 250, 300, 350, 375, 400, 500, 625, 750, 875 and 1000+mm, centred around the mid point between categories.
• Calibration of size estimates was based on comparison of observed fish lengths with a scale-bar on underwater slates carried by divers
Abalone: • Maximum shell length (to nearest mm) measured in situ with
calipers until at least 20 measure per 50 m section of the transect
Lobsters: • Carapace length (CL) and sex of lobsters with a CL of at least
30 mm measured with calipers for those which could be captured without damaging the animal
• For those which couldn’t be captured, CL estimates made by holding calipers as close to animal as possible.
Macroalgal species cover: • Percent cover estimated by making point counts of each taxon,
usually to species level but within higher categories for algae that could not be accurately indentified in situ.
Justification for Parameters Obtain maximum ecological information on readily identifiable and observable species within the average time available to a dive team of three divers on a single dive.
Type of Data Collected for Parameter
Mega-faunal invertebrates: • Count data Fish, Abalone and Lobsters: • Size data Macroalgal species cover: • Percent cover
Frequency Parameter Measured
Each survey
Map of Monitored Sites: Available?
Yes
Map of Monitored Sites: Reference/Link
Barrett et al (2009, 2007).
Reporting Statistical Analysis Used: • Assessment of temporal trends: mean ± SE for invertebrate,
fish and algal species and broader species groupings, species richness (both exploited and other species showing trends).
• Serial convergence or divergence between sites was tested using two-tailed critical values of the Spearman rank correlation coefficients.
• The size of the commonly exploited lobster and abalone
102
(proportion of 3 size classes) was plotted for each year but no statistical analysis done.
• Bray-Curtis similarity indexes, Multi-dimensional Scaling (MDS) and SIMPER were used to investigate spatial and temporal differences of invertebrate, fish and algal communities.
Reporting Style: • Scientific papers (primarily – e.g. Barrett et al (2009, 2007). • Also:
o Technical/status reports - e.g. Barrett et al (2006). o Reviews - e.g. Babcock et al (2010).
Reporting Frequency: • Scientific papers: infrequent • Long-term monitoring results: decadal.
Use of Results Is Design of Programme to Inform Management?
Yes
Is Design of Programme to Indicate if Management Works?
Yes
Is there Evidence that Results Used?
Yes
Use of Results Marine conservation planning and fisheries management, including for rock lobster, abalone and scale fish fisheries; also to inform fishery-related ecosystem models. For examples, see RPDC (2006, 2002).
Key References BABCOCK, R., SHEARS, N., ALCALA, A., BARRETT, N., EDGAR, G., LAFFERTY, K.,
MCCLANAHAN, T. & RUSS, G. 2010. Decadal trends in marine reserves reveal differential rates of change in direct and indirect effects. Proceedings of the National Academy of Sciences of the United States of America, 107, 18256-18261.
BARRETT, N., BUXTON, C. & EDGAR, G. 2009. Changes in invertebrate and macroalgal populations in Tasmanian marine reserves in the decade following protection. Journal of Experimental Marine Biology and Ecology, 370, 104-119.
BARRETT, N., EDGAR, G., BUXTON, C. & HADDON, M. 2007. Changes in fish assemblages following 10 years of protection in Tasmanian marine protected areas. Journal of Experimental Marine Biology and Ecology, 345, 141-157.
BARRETT, N., EDGAR, G. & POLACHECK, A. 2006. Ecosystem monitoring – The Kent Group. baseline surveys of the subtidal reef biota of the Kent Group Marine Nature Reserve 2004-2006. Tasmanian Aquiculture Fisheries Institute Internal Report.
DPIWE (Department of Primary Industries Water and Environment). 2012. Maps of Tasmanian Marine Reserves [online]. Available from: http://www.dpiw.tas.gov.au/internnsf/WebPages/KMEE-63B3R6?open#MarineNatureReserves [Accessed 03/01/12].
DPIWE (Department of Primary Industries Water and Environment). 2000. Tasmanian Marine Protected Areas Strategy. Hobart, Australia. [online]. Available from: http://www.dpiw.tas.gov.au/inter,nsf/Attachments/BHAN-5498CT?open [Accessed 03/01/12].
RPDC (Resource Planning and Development Commission). 2006. Inquiry into the establishment of a marine protected area within theBruny bioregions. Background report. Resource Planning and Development Commission. Hobart, Tasmania. [online]. Available from: www.rpdc.tas.gov.au [Accessed 26/01/12].
RPDC (Resource Planning and Development Commission). 2002. Inquiry into the establishment of a marine protected area within the Davey and Twofold Shelf bioregions. Background report. Resource Planning and Development Commission. Hobart, Tasmania. [online]. Available from: www.rpdc.tas.gov.au [Accessed 26/01/12].
TAS PAWS (Parks and Wildlife Service Tasmania). 2012. Maps of Tasmania Marine Reserves [online]. Available from: http://www.parks.tas.gov.au/index.aspx?base=397 [Accessed 02/01/12].

103
TAS PAWS (Parks and Wildlife Service Tasmania). 2009. Visitor's Guide to Tasmania's Marine Reserves [online]. Available from: http://www.parks.tas.gov.au/index.aspx?base=397. [Accessed 03/01/12].

104
Case Study No. 4 Danish Natura 2000 sites Code: DA
MPA Facts MPA Name: Danish Natura 2000 sites (also OSPAR)
MPA Location: Danish waters
MPA Objectives: No specific network objectives
Year MPA Designated: 2007-2009
Legislation used to Designate MPA:
Birds Directive adopted in 1979 (European Commission 2009) Complemented by the Habitats Directive in 1992 (European Commission 1992) Other relevant Danish environmental legislation relevant to Natura 2000 (Hansen 2010):
• Nature Protection Act • Environmental Protection Act • Act on environmental objectives for Water Districts and
Natura 2000 sites • Act on Spatial Planning • Act on Marine Environment • Act on Hunting and Game Management
MPA Management Authority: Danish Ministry of the Environment
Ecological System: Temperate
Offshore/Inshore/Inter-tidal: Offshore & Inshore, including intertidal
Seabed Habitat(s) Present in MPA:
Reef, bubbling reefs, shallow inlets and bays, coastal lagoons, mudflats, estuaries, sandbanks
Number of MPAs in Network: 185
Area of MPA (km2): 18,540
Map of MPA: Available? Yes
Map of MPA: Reference/Link: Danish Natura 2000 sites (Hansen 2010)
Monitoring Programme Facts Name of Programme: NOVANA (National Monitoring and Assessment Programme for
the Aquatic and Terrestrial Environment) Who Conducts Monitoring: Danish Ministry of the Environment
Status of Programme: Underway
Start Date: 2004
End Date: Ongoing
Programme Objectives: • Describe sources of pollution and water and nutrient transports and their effects on the state and trend in the Danish coastal waters and open marine waters
• Document the overall effect of national action plans and measures aimed at the aquatic environment and nature – including whether the objectives are attained, and whether the trend is in the desired direction
• Help fulfill Denmark’s obligations under EU legislation, international conventions and national legislation
• Help strengthen the scientific foundation for future international measures, national action plans, regional administration and other measures to improve the aquatic environment and nature
Measurable Targets: The target for the monitoring program is to give documentation and knowledge to support the administration of the following management needs and obligations (Hansen 2010):

105
• Meet the obligations under EU law and national law in relation to monitor nature, water and air quality.
• Supporting the national administration, including contributing to document the effect and goal achievement of national aquatic environmental plans and nature plans, including water and Natura 2000-Plans and initiatives in agriculture and the national air quality program.
• Meet the obligations under international conventions on nature and water and clean air.
Cost of Programme: Total (person days/year)
Not available
Cost of Programme: Monitoring (person days/year)
Not available
Cost of Programme: Analysis (person days/year)
Not available
Cost of Programme: Assessment (person days/year)
Not available
Monitoring Programme Design Programme Design: Spatial All Danish waters, including MPAs
Stations are located in coastal waters and open waters. Number of stations: • Submerged aquatic vegetation: 3.75 (coastal), 12 (open water) • Fauna on soft bottom: 845 (coastal) • Fauna on hard substrate: 3.75 (coastal), 12 (open waters)
Programme Design: Temporal Monitoring programme is designed over a six-year period. The frequencies of which parameters are measured varies between 1–47 (which means that sampling is carried out between 1 and 47 times per year) or 1/6 (sample collection once during the programme period, 2/6 (sample collection twice during the programme period) and 3/6 (sample collection three times during the programme period).
Programme Methodology/Equipment
Methodology/Equipment used varies by parameter. Sampling and analysis methods are described in the technical instructions for marine monitoring (see Andersen et al (2004) – in Danish Only). The technical instructions follow the guidelines stipulated for monitoring under the international marine conventions: HELCOM’s “Manual for Marine Monitoring in the COMBINE Programme of HELCOM”, and OSPAR’s “Joint Assessment and Monitoring Programme”. These guidelines are binding for the activities encompassed by NOVANA.
Level of Expertise Required High
Reason for Expertise Level Trained scientific personnel needed
What does Programme Monitor?
Status of MPA only
Parameters Measured • Eutrophication (Profile measurements, chlorophyll a, nutrients and oxygen)
• Biodiversity and habitats: o Phytoplankton (species composition, abundance and
biomass) o Zooplankton (micro- and mesozooplankton – species
composition, abundance and biomass) o Submerged aquatic vegetation (macroalgae on hard
substrate and rooted angiosperms (eelgrass) – species composition and coverage)
o Fauna on soft bottom (species composition, abundance
106
and biomass) o Fauna on hard substrate (semi-quantitative studies of
species composition and abundance) o Fish (species composition and size distribution)
• Hazardous substances: o In sediment and biota, biological effect monitoring in
molluscs (imposex/intersex) - see p105 in Svendsen et al (2005) for list of substances.
Justification for Parameters The selection of quality elements (indicators, supporting variables etc.) was based on a combination of knowledge concerning the elements and structures that best characterize the Danish marine ecosystems, the resilience and measurability of these elements and structures, and the costs associated with carrying out the measurements (Svendsen et al 2005).
Type of Data Collected for Parameter
Field sampling data (see parameters measured)
Frequency Parameter Measured
• Eutrophication: between 20-33 times per year • Phytoplankton: between 13-26 times per year • Zooplankton: between 18-19 times per year • Submerged aquatic vegetation: twice in 6 years (coastal), once
a year (open waters) • Fauna on soft bottom: once in 6 years (coastal) • Fauna on hard substrate: twice in 6 years (coastal), once a
year (open waters) • Fish: once in six years Full details in Svendsen (2005)
Map of Monitored Sites: Available?
Yes
Map of Monitored Sites: Reference/Link
Danish Natura 2000 sites (Hansen 2010)
Reporting Statistical Analysis Used: Details contained in Anderson et al (2004) (in Danish only)
Reporting Style: Status report (for Government; three levels – regional, nationwide, national scientific cross-cutting summary report) Themed reports
Reporting Frequency: Annual
Use of Results Is Design of Programme to Inform Management?
Yes
Is Design of Programme to Indicate if Management Works?
Yes
Is there Evidence that Results Used?
Yes
Use of Results Data used to meet various reporting obligations as listed above in ‘Measurable Targets’.
Key References ANDERSEN, J. H., MARIAGER, S. & ÆRTEBJERG, G. 2004. Tekniske anvisninger for marin
overvågning (in Danish). National Environmental Research Institute. EUROPEAN COMMISSION 2009. Directive 2009/147/EC of the European Parliment and The Council
of 30 November 2009 on the conservation of wild birds (codified version). Official Journal of the European Union, L 20/7, 19. [online]. Available from: http://eur-lex.europa.eu/LexUriServ/LexUriServ.do?uri=OJ:L:2010:020:0007:0025:EN:PDF [Accessed
107
04/12/11]. EUROPEAN COMMISSION 1992. Council Directive 92/43/EEC 21 May 1992 on the conservation of
natural habitats and of wild fauna and flora (codified version). Official Journal of the European Union, L 206/7, 44. [online]. Available from: http://eur-lex.europa.eu/LexUriServ/LexUriServ.do?uri=OJ:L:1992:206:0007:0050:EN:PDF [Accessed 04/12/11].
HANSEN, L. R. 2010. Monitoring marine habitats in Denmark. Nature Division, Danish Ministry of the Environment. [online]. Available from: http://www.slu.se/Global/externwebben/centrumbildningar-projekt/artdatabanken/Dokument/Konferenser/Monitoring%20marine%20habitats/Lone-Reerso%20Hansen_Meeting%20sep-2010-%20DK-What-to-monitor.pdf [Accessed 05/12/11].
SVENDSEN, L., VAN DER BIJL, L., BOUTRUP, S. & NORUP, B. 2005. NOVANA. National monitoring and assessment programme for the aquatic and terrestrial environment. Programme Description - Part 2. National Environmental Research Institute, Denmark. [online]. Available from: http://www.dmu.dk/fileadmin/Resources/BLST/NOVANA/foer08c/FR537_www_S_H.pdf [Accessed 04/01/12].

108
Case Study No. 5 German EEZ Natura 2000 Network Code: GE
MPA Facts MPA Name: German EEZ Natura 2000 Network
MPA Location: German EEZ of the North Sea and Baltic Sea
MPA Objectives: Conserve and where necessary restore biological diversity
Year MPA Designated: 2004
Legislation used to Designate MPA:
Birds Directive adopted in 1979 Complemented by the Habitats Directive in 1992
MPA Management Authority: German Federal Agency for Nature Conservation (BfN)
Ecological System: Temperate
Offshore/Inshore/Inter-tidal: Offshore
Seabed Habitat(s) Present in MPA:
Reefs and sandbanks
Number of MPAs in Network: 10
Area of MPA (km2): 10,377
Map of MPA: Available? Yes
Map of MPA: Reference/Link North Sea Network (BfN 2011b) Baltic Sea Network (BfN 2011b)
Monitoring Programme Facts Name of Programme: Marine Biodiversity Monitoring in the German EEZ
Who Conducts Monitoring: Trained scientists of (inter alia): o Leibniz-Institut für Ostseeforschung Warnemünde o Forschungs- und Technologiezentrum Westküste (FTZ) o Stiftung Tierärztliche Hochschule Hannover, Institut für
Terrestrische und Aquatische Wildtierforschung Deutsches Meeresmuseum Stralsund
Status of Programme: Underway
Start Date: 2008
End Date: Ongoing
Programme Objectives: Implementing the marine monitoring needs by national, European and international obligations.
Measurable Targets: Not specified
Cost of Programme: Total (person days/year)
• North Sea: 32 • Baltic Sea: 32
Nehls et al (2008) Cost of Programme: Monitoring (person days/year)
• North Sea: o Days at sea per reporting period – 10 o Days at sea annually – 3-4 o Man days at sea per reporting period – 30 o Man days at sea annually – 9-12
• Baltic Sea:
o Days at sea per reporting period – 8 o Days at sea annually – 3-4 o Man days at sea per reporting period – 24 o Man days at sea annually – 9-12
Cost of Programme: Analysis (person days/year)
• North Sea:

109
o Days processing grab/diver + dredge samples per reporting period – 75
o Days processing grab/diver + dredge annually – 15 o Days processing video samples per reporting period – 20 o Days processing video samples annually – 5
• Baltic Sea: o Days processing grab/diver + dredge samples per
reporting period – 25 o Days processing grab/diver + dredge annually – 15 o Days processing video samples per reporting period – 18 o Days processing video samples annually – 5
Cost of Programme: Assessment (person days/year)
Not available
Monitoring Programme Design Programme Design: Spatial • Systematic annual long-term monitoring across the German
North Sea and Baltic Sea incorporating: o Benthic monitoring: 10 monitoring stations per habitat type o Aerial and ship-based Seabird monitoring Aerial surveys of the entire German Baltic Sea every 3
years Annual aerial surveys in parts of the German Baltic
Sea, namely SPA ‘Pommeranian Bay’ Ship-based surveys in parts of the German Baltic sea,
namely SPA ‘Pommeranian Bay’ and adjacent coastal protected areas every 2 years
Annual aerial surveys of the entire German North sea Aerial surveys in parts of the German North sea,
namely SPA ‘Eastern German Bight’, and areas of the National Park ‘Wattenmeer’ away from coast every 2 years
Annual ship-based surveys of the German EEZ around Helgoland and parts of Lower Saxony and Schleswig Holstein away from coast
o Cetacean monitoring Aerial surveys of the western German Baltic sea every
2 years Aerial surveys of the entire German North Sea every 3
years, 3 times a year (spring, summer, autumn) Annual aerial survey in the area of SAC ‘Borkum
ReefGround’ o Annual aerial surveys in the area of SAC ‘Sylt Outer reef’
Programme Design: Temporal • Benthic monitoring: over 1 month p.a. • Seabird monitoring
o Aerial and ship-based surveys as mentioned above • Cetacean monitoring • Aerial and ship-based surveys as mentioned above
Programme Methodology/Equipment
• Inter alia, transect lines, aerial survey transects, underwater cameras.
• Detailed monitoring manual in English/German available at: Methods Manual (BSH 2010).
Level of Expertise Required High
Reason for Expertise Level Trained scientific personnel needed
What does Programme Monitor?
Status of biodiversity elements

110
Parameters Measured • Benthic characteristics, species and habitats • Habitats - sandbanks, reefs, shell gravel bottoms, gravel
bottoms with Ophelia-species, macrophyte meadows and beds and the pelagic biotope offshore waters below the halocline
• Sea birds – inter alia divers, Little Gulls, sea ducks, auks, guillemots, razorbills – abundance/density/distribution
• Cetacean monitoring – abundance/density/distribution Justification for Parameters Monitoring requirements under the Habitats Directive (Annex II),
OSPAR, HELCOM, ASCOBANS and MSFD Type of Data Collected for Parameter
• Transect data • Conservation status is assessed using prescribed criteria –
see http://www.bfn.de/0316_ak_marin.html (German only) Frequency Parameter Measured
Annually
Map of Monitored Sites: Available?
Yes
Map of Monitored Sites: Reference/Link
Methods Manual (BSH 2010) Monitored Sites North Sea and Baltic Sea (BfN 2011b, a)
Reporting Statistical Analysis Used: Various, including ANOVA; Cluster analysis; non-metric, multi-
dimensional scaling (MDS); SIMPER Reporting Style: • Annual monitoring reports, Status reports, Indicator reports
• Scientific Papers: o Include Summary, Methods and Materials, Results,
Proposals, Outlook, Tabular data, Maps o See Monitoring Reports (German only, with English
summaries) Reporting Frequency: Annual
Use of Results Is Design of Programme to Inform Management?
Yes
Is Design of Programme to Indicate if Management Works?
Yes
Is there Evidence that Results Used?
Yes
Use of Results European directives and international agreements require Germany to monitor a range of marine biotic parameters. Results are used for reporting to the EC and on agreements.
Key References BFN (German Federal Agency for Nature Conservation). 2011a. Map of German Natura 2000 sites
[online]. Available from: http://www.bfn.de/habitatmare/en/monitoring-programm.php [Accessed 04/01/12].
BFN (German Federal Agency for Nature Conservation). 2011b. Habitat Mare [online]. Available from: http://www.bfn.de/habitatmare/en/habitat-mare.php [Accessed 04/01/12].
BSH (Bundesamt für Seeschifffahrt und Hydrographie). 2010. Monitoring Specifications (in German and English). Länder-Messprogramm für die Meeresumwelt von Nord- und Ostsee (BLMP). [online]. Available from: www.blmp-online.de/Seiten/Monitoringhandbuch.htm [Accessed 04/01/12].
NEHLS, G., DIEDERICHS, A., GRŰNKORN, T., KRAUSE, S., MACZASSEK, K. & VORBERY, R. 2008. Konzept zur Umsetzung der Natura 2000 Monitoring- und Berichtspflichten in den kűstenfernen Gebieten der deutschen Nord- und Ostsee. BFN (German Federal Agency for Nature Conservation).

111
Case Study No. 6 Marine Life Protection Act MPA network – Central Coast California Code: CC
MPA Facts MPA Name: Marine Life Protection Act MPA network – Central Coast
California MPA Location: • Central coast of the latitudinal scale of the California Current
Large Marine Ecosystem along the west coast of North America o Extends from Pigeon Point in the north to Point
Conception in the south MPA Objectives: • Increase coherence and effectiveness in protecting the state’s
marine life and habitats, marine ecosystems, and marine natural heritage, as well as to improve recreational, educational and study opportunities provided by marine ecosystems subject to minimal human disturbance.
• Better conserve marine resources for their long-term sustainable use while enhancing outdoor recreation and ocean research opportunities along the coast.
Year MPA Designated: 2007
Legislation used to Designate MPA:
Marine Life Protection Act (MLPA) of 1999 which took effect September 21st, 2007 (US Government 2004)
MPA Management Authority: Department of Fish and Game (DFG)
Ecological System: Temperate
Offshore/Inshore/Inter-tidal: Offshore & Inshore, including Inter-tidal
Seabed Habitat(s) Present in MPA:
Deep rocky banks and outcrops, underwater pinnacles, submarine canyons, kelp forests, rocky intertidal
Number of MPAs in Network: 29
Area of MPA (km2): 530
Map of MPA: Available? Yes
Map of MPA: Reference/Link MLPA Central Coast (Fish and Game Commission 2008) Interpretive maps and posters (Monterey Bay Sanctuary Foundation 2010)
Monitoring Programme Facts Name of Programme: MLPA baseline monitoring survey – Central Coast California
Who Conducts Monitoring: Collection of academic researchers with expertise in each of the ecosystems that constitute the monitoring program
Status of Programme: Complete
Start Date: September 2007
End Date: May 2008
Programme Objectives: • Characterize the state of ecosystems at the time of the establishment of the network
• Inform the design of a long-term monitoring programme to evaluate effectiveness of the MPAs
• Initiate some aspects of the long-term monitoring time series Measurable Targets: No
Cost of Programme: Total (person days/year)
Not available
Cost of Programme: Monitoring (person days/year)
Not available
Cost of Programme: Analysis Not available

112
(person days/year)
Cost of Programme: Assessment (person days/year)
Not available
Monitoring Programme Design Programme Design: Spatial Large scale one-time baseline data collection:
• Kelp Forest Ecosystem Surveys (3 - 20m deep) • Rocky Intertidal Ecosystem Surveys (0 -2m deep) • Deep-Water Demersal Community Surveys (24 -365m deep),
164,000 m2 • Collaborative Fishing Surveys of Nearshore Fish Species • Socio-economic Surveys (Resource-Use Mapping and Rapid
Social Assessment) Programme Design: Temporal Frequency differs among ecosystems: Kelp forests and rocky
intertidal were surveyed once per year (summer and fall, respectively) in 2007 and 2008.
Programme Methodology/Equipment
• Kelp forests: divers visually surveyed multiple 30-meter-long transects at multiple depths
• Rocky intertidal: MARINe techniques for community structure and PISCO ones for characterizing biodiversity
• Deep rocky reefs: Submersible Baseline Survey - 337 quantitative, visual strip transects
• Nearshore rocky reef fish assemblages: Standardized, catch and release fishing techniques conducted in collaboration with fishermen. Each MPA and Reference pair was surveyed a total of 8 days per year.
Level of Expertise Required High
Reason for Expertise Level Trained scientific personnel needed for sampling methods and taxonomic knowledge.
What does Programme Monitor?
• State of populations and communities in each ecosystem within MPAs and associated reference areas outside MPAs
• The data from these monitoring programs will be used as a starting point to make future comparisons inside vs. outside MPAs, tracking changes in ecosystem and social attributes over time and evaluating if MPAs are having the desired results
Parameters Measured • Biological monitoring: abundance and size structure of fish, invertebrate and algal populations; community structure; biodiversity.
• Water temperatures • Socio-economic monitoring addressing the social economic
influences of the newly created network Justification for Parameters Monitoring was focused on characterizing the attributes of these
rocky reef ecosystems that reflect goals of MPA network Type of Data Collected for Parameter
• Standardized visual survey (transects) data • Standardized catch data
Frequency Parameter Measured
One-time baseline surveys
Map of Monitored Sites: Available?
Yes
Map of Monitored Sites: Reference/Link
MLPA Central Coast Monitoring Sites (PISCO 2011) Starr et al (2008) Carr et al (2010)
Reporting Statistical Analysis Used: Not documented
113
Reporting Style: • Other: Booklets, publications, reports, presentations and web-accessible data archives
• For monitored MPAs – will use intuitive reporting tools; transparent, and available for independent review
Reporting Frequency: One-time reports
Use of Results Is Design of Programme to Inform Management?
Yes
Is Design of Programme to Indicate if Management Works?
Partially - baseline studies will inform longer-term evaluation studies but will not evaluate reserve effectiveness themselves.
Is there Evidence that Results Used?
Yes
Use of Results Aim of monitoring: provide a baseline against which to measure future changes in living marine resource abundance and diversity inside vs. outside MPAs (see statement of programme objectives above)
Key References CARR, M., MALONE, D., LONHART, S. & SELBIE, H. 2010. Monitoring MPAs by SCUBA in waters
off Central California. 2007/8 results of PISCO baseline monitoring surveys. PISCO, USA. FISH AND GAME COMMISSION 2008. Map of Central California Protected Areas. Marine Life
Protection Act Inititive. [online]. Available from: http://www.dfg.ca.gov/mlpa/ccmpas_list.asp [Accessed 05/12/11].
MONTEREY BAY SANCTUARY FOUNDATION 2010. Interpretive maps and posters [online]. Available from: http://www.californiampas.org/pages/resources/products-maps.html [Accessed 05/12/11].
PISCO (Partnership for Interdisciplinary Studies of Coastal Oceans). 2011. MLPA Central Coast study region baseline data collection. [online]. Available from: http://www.piscoweb.org/policy/marine-protected-area-policy/monitoring-marine-protected-areas-/mlpa-marine-protected-area-m-0 [Accessed 04/01/12].
STARR, R. & YOKLAVICH, M. 2008. Monitoring MPAs in deep water off Central California. 2007 IMPACT submersible baseline survey. California Sea Grant College Program. Publication No. T-067.
US GOVERNMENT 2004. Marine Life Protection Act (as amended to July 2004) Fish and Game Code Sections 2850-2863. [online]. Available from: http://www.dfg.ca.gov/mlpa/pdfs/mlpa_language.pdf [Accessed 04/01/12].

114
Case Study No. 7 Marine Life Protection Act MPA network –North Central Coast California
MPA Facts MPA Name: Marine Life Protection Act MPA network –North Central Coast,
California MPA Location: The North Central Coast MPA network spans the area from Alder
Creek, near Point Arena, to Pigeon Point, including the Farallon Islands.
Note there are two other regional networks in California:
• Central Coast (see Case Study 6) • South Coast – includes MPAs in waters from Point
Conception to the US/Mexico border, including the Channel Islands
MPA Objectives: • To protect the natural diversity and abundance of marine life, and the structure, function, and integrity of marine ecosystems.
• To help sustain, conserve, and protect marine life populations, including those of economic value, and rebuild those that are depleted.
• To improve recreational, educational, and study opportunities provided by marine ecosystems that are subject to minimal human disturbance, and to manage these uses in a manner consistent with protecting biodiversity.
• To protect marine natural heritage, including protection of representative and unique marine life habitats in California waters for their intrinsic value.
• To ensure that California's MPAs have clearly defined objectives, effective management measures, and adequate enforcement, and are based on sound scientific guidelines.
• To ensure that the state's MPAs are designed and managed, to the extent possible, as a network.
Year MPAs Designated: 2010
Legislation used to Designate MPAs:
Marine Life Protection Act (MLPA) of 1999 (US Government 2004).
MPA Management Authority: California Department of Fish and Game (DFG), California Fish and Game Commission (FGC)
Ecological System: Temperate
Offshore/Nearshore/Inter-tidal: Primarily Nearshore, including Intertidal (to mean high water) and estuaries (to the extent of marine influence), and some offshore islands.
Seabed Habitat(s) Present in MPAs:
Rocky intertidal ecosystems; kelp forest and shallow rocky reef ecosystems; mid-depth rock ecosystems; deep-water ecosystems including canyons; beach and soft-bottom intertidal ecosystems; soft-bottom sub-tidal ecosystems; estuarine & wetland ecosystems.
Number of MPAs in Network: 25 (plus 6 special closures)
Area of MPAs (km2): 396
Map of MPAs: Available? Yes
Map of MPAs: Reference/Link North Central Coast MPAs (DFG 2010) Ashcraft et al (2010)

115
Monitoring Programme Facts Name of Programme: North Central Coast MPA Baseline Program
Who Conducts Monitoring: 11 different projects were funded. For a complete list visit the MPA Monitoring Enterprise website.
Status of Programme: Baseline monitoring is on-going
Start Date: • Baseline Program: 2010 • Long-term monitoring: anticipated to begin in 2015
End Date: Baseline Program 2015
Programme Objectives: The Baseline Program in the North Central Coast has two purposes: 1. Baseline Characterization – A summary description,
assessment and understanding of ecological and socioeconomic conditions in the South Coast region, inside and outside MPAs established under the MLPA, at or near the time of their implementation. Baseline characterization provides a frame of reference to support subsequent assessment of MPA network performance against MLPA goals and facilitate future adaptive management.
2. Assessment of Initial Ecological and Socioeconomic Changes – Measurement of initial ecological changes and the short-run net benefits or costs to consumptive and non-consumptive user groups following MPA implementation.
Measurable Targets: Progress is measured towards the goals of the MLPA (see above) focusing monitoring using 10 Ecosystem Features (e.g., rocky intertidal, kelp & shallow rock).
Cost of Programme: Total (person days/year)
The state of California has allocated USD$4M per region for baseline monitoring. Spending plans, which provide an estimate of the costs of long-term monitoring under a variety of scenarios, are available in long-term monitoring plans for the North Central Coast (http://monitoringenterprise.org/where/northcentralcoast.php)
Cost of Programme: Monitoring (person days/year)
See above
Cost of Programme: Analysis (person days/year)
See above
Cost of Programme: Assessment (person days/year)
See above
Monitoring Programme Design Programme Design: Spatial • Five distinct study regions that, when completed, will have
assessed all state waters. • Regional baseline programs aim to survey as many
ecosystems and MPAs as possible given time and funding constraints (exact locations of monitoring are dependent on individual principal investigators).
• Consecutive long-term monitoring o In the North Central Coast, the intention is to monitor 6
MPAs and 6 reference sites for each of the 9 ecosystem features, plus an additional 4 port/harbor complexes for socioeconomic monitoring.
Programme Design: Temporal One-time baseline monitoring collects data in the first 2 to 3 years immediately following MPA implementation, with results reported at the 5-year mark. Long-term monitoring commences in year five with a 5-year monitoring cycle
Programme • Long-term monitoring will follow, and build on the foundation
116
Methodology/Equipment established by the Baseline Program (MPA Monitoring Enterprise 2011).
• Potential monitoring methods are outlined in regional monitoring plans (see above).
Level of Expertise Required Medium to High
Reason for Expertise Level Monitoring is designed in such a way that it may be conducted by government agencies and research institutions as well as by citizen-science groups.
What does Programme Monitor?
• Assessments of ecosystem condition and trends • Evaluations of MPA design and management questions (see monitoring framework available on the MPA Monitoring Enterprise website)
Parameters Measured Habitats, marine life populations, diversity, abundance, patterns of human uses. More details are available in regional monitoring plans (MPA Monitoring Enterprise 2011).
Justification for Parameters • Parameters needed for assessment of ecosystem condition and trends, and evaluation of MPA design and management decisions.
• Contextual information needed for interpretation of results. Type of Data Collected for Parameter
• Monitoring is designed to provide assessments of ecological and socioeconomic condition, inside and outside MPAs and to measure ecological changes and the net benefits or costs to consumptive and non-consumptive user groups.
Frequency Parameter Measured
• Baseline monitoring is implemented for newly designated regional MPA networks and continues for two or three years following implementation.
• Long-term monitoring is implemented following the baseline period, commencing approximately 5 years after MPA implementation.
Map of Monitored Sites: Available?
No
Map of Monitored Sites: Reference/Link
N/A
Reporting Statistical Analysis Used: Analytical and reporting approaches under development for the
Central Coast 5 year baseline reporting Reporting Style: • Methods of reporting not yet defined but will include:
o Highly synthesized and interpretable results; o For monitored MPAs - use of intuitive reporting tools;
transparent, and available for independent review. o Results will be available both on-line and in printed
reports. Reporting Frequency: First monitoring report will be available for North Central Coast
region in late 2014. After baseline programs are complete, it is anticipated that there will be a 5-year monitoring and reporting cycle.
Use of Results Is Design of Programme to Inform Management?
Yes
Is Design of Programme to Indicate if Management Works?
Yes
Is there Evidence that Results Used?
Not yet.
Use of Results Currently no results

117
Key References ASHCRAFT, S., HRBACEK, K., MACINTYRE, K. & NASLUND, B. 2010. Guide to the North-Central
California Marine Protected Areas: Alder Creek to Pigeon Point. Californian Department of Fish and Game (DFG). [online]. Available from: http://www.dfg.ca.gov/mlpa/pdfs/nccmpas/nccmpas_guide.pdf [Accessed 05/01/12].
DFG (California Department of Fish and Game). 2010. North Central Coast MPAs. California Department of Fish and Game. [online]. Available from: http://www.dfg.ca.gov/mlpa/pdfs/mpamaps/nccmpas.pdf [Accessed 26/01/12].
MPA MONITORING ENTERPRISE 2011. North Central Coast Monitoring Programme [online]. Available from: http://monitoringenterprise.org/where/northcentralcoast.php [Accessed 05/12/11].
US GOVERNMENT 2004. Marine Life Protection Act (as amended to July 2004) Fish and Game Code Sections 2850-2863. [online]. Available from: http://www.dfg.ca.gov/mlpa/pdfs/mlpa_language.pdf [Accessed 04/01/12].

118
Case Study No. 8 Arctic Marine Areas (AMAs) Code: AM
MPA Facts MPA Name: Arctic Marine Areas (AMAs)
MPA Location: Arctic
MPA Objectives: The Circumpolar Biodiversity Monitoring Program (CBMP) is an international network of scientists, government agencies, Indigenous organizations and conservation groups working together to harmonize and integrate efforts to monitor the Arctic's living resources. The goal of CBMP is to facilitate more rapid detection, communication, and response with respect to the significant biodiversity-related trends and pressures affecting the circumpolar world. The CBMP is the cornerstone program of the Arctic Council's Conservation of Arctic Flora and Fauna (CAFF) Working Group. The CBMP has been endorsed by the Arctic Council and is the biodiversity component of the Sustaining Arctic Observing Networks (SAON).
Year MPA Designated: Proposed Marine Plan and AMAs presented to Arctic Council in May 2011
Legislation used to Designate MPA:
N/A
MPA Management Authority: Arctic Council16
Ecological System: Polar
Offshore/Inshore/Inter-tidal: Offshore (intertidal areas <30m deep excluded)
Seabed Habitat(s) Present in MPA:
Not specified, but benthic species monitored.
Number of MPAs in Network: 7 AMAs
Area of MPA (km2): Not specified
Map of MPA: Available? Yes
Map of MPA: Reference/Link Arctic Marine Biodiversity Monitoring Plan (Gill et al 2011).
Monitoring Programme Facts Name of Programme: Arctic Marine Biodiversity Monitoring Plan
Who Conducts Monitoring: Six Arctic coastal nations (Canada, Denmark (including
16 The Arctic Council (formed in September 1996) is a high-level forum for political discussions on common issues to the governments of the Arctic States and its inhabitants. The Arctic Council is the only circumpolar forum for political discussions on Arctic issues, involving all the Arctic states, and with the active participation of its Indigenous Peoples. The council is formed from the Governments of the eight member states (see below), the Permanent Participants (PPs), the Working Groups and the Observers. The Arctic council member states are: Canada, Denmark (including Greenland and the Faroe Islands), Finland, Iceland, Norway, Sweden, Russian Federation, United States of America. Senior Arctic Officials are appointed by an Arctic state to manage its interests in the Arctic Council. The SAO is thus a government representative, usually from a member states' Ministry of Foreign Affairs. The SAO guides and monitors Arctic Council activities in accordance with the decisions and instructions of the Arctic Council Foreign Ministers. Permanent Participants is a common term for organizations that represent indigenous peoples in the Arctic Council; either by representing a) a single Indigenous People resident in more than one Arctic State; or, b) more than one Arctic Indigenous People resident in a single Arctic State. The PPs participate actively and are fully consulted in all deliberations and activities of the Arctic Council. The Indigenous Peoples Secretariat (IPS) in Copenhagen, Denmark, serves the six Permanent Participant organizations: Aleut International Association Arctic Athabaskan Council, Gwich'in Council International, Inuit Circumpolar Council, Russian Association of Indigenous Peoples of the North, Siberia and Far East, Saami Council. Source: Arctic Council, ARCTIC COUNCIL 2012. The Arctic Council [online]. Available from: http://www.arctic-council.org/index.php/en/ [Accessed 04/01/12].
119
Greenland and the Faroe Islands), Finland, Iceland, Norway, Sweden, Russian Federation, United States of America), including a great number of national, regional, Aboriginal and academic organizations and agencies.
Status of Programme: In development
Start Date: Phase 1: 2011-2015 (Baseline & testing) Post-2015 (Long-term monitoring)
End Date: N/A
Programme Objectives: The overall goal of the CBMP-Marine Plan is to improve our ability to detect and understand the causes of long-term change in the composition, structure and function of Arctic marine ecosystems, as well as to develop authoritative assessments of key elements of Arctic marine biodiversity (e.g., key indicators, ecologically pivotal and/or other important taxa). Specifically, the Plan identifies agreement on the following:
• A suite of common biological parameters and indicators to monitor and report on change across Arctic marine ecosystems;
• Key abiotic parameters, relevant to marine biodiversity, which should be monitored;
• Optimal sampling schemes (e.g., where, when and how the suite of parameters should be measured and by whom); and
• Arctic Marine Areas, by which monitoring results will be organized and reported.
Measurable Targets: Not specified
Cost of Programme: Total (person days/year)
Not available
Cost of Programme: Monitoring (person days/year)
Not available
Cost of Programme: Analysis (person days/year)
Not available
Cost of Programme: Assessment (person days/year)
Not available
Monitoring Programme Design Programme Design: Spatial • 11 Focal Ecosystem Component (FECs) groups have been
identified which will be monitored. o Two FECs will monitor benthic components: Benthic meio,
macro and mega fauna, and Benthic /Demersal fish. Programme Design: Temporal • Common sampling approaches and designs have been
identified for six discipline areas: Plankton, Sea-ice Biota, Benthos, Fish, Seabirds, Marine Mammals.
• Implementation of common sampling approaches and designs will focus on existing Arctic marine biodiversity monitoring networks run by Arctic nations.
• Monitoring networks run by non-Arctic sources may be brought into the monitoring plan in the second phase of implementation (2015+).
• Sampling periods will vary from several times a year to once every 1-5 years.
Programme Methodology/Equipment
Detailed methods/equipment for sampling parameters for each of the six discipline areas are provided in Chapter 6 of the Arctic Marine Biodiversity Monitoring Plan (Gill et al 2011). • Some methods include:
120
o Plankton: fixed sentinel stations, trawls (depth stratified and using different mesh sizes)
o Sea-ice biota: ice cores, SCUBA samples, video monitoring
o Benthos: transects using underwater imaging (video, stills photography), grab samples, trawls, SCUBA transects for inshore hard substratum
o Fish: to be determined o Seabirds: visual surveys (in-colony and at-sea), banding,
diet sampling o Marine Mammals: visual surveys, satellite telemetry,
remote sensing, tissue analysis, diet samples Level of Expertise Required High/Low
Reason for Expertise Level Trained scientific personnel needed and citizen science could be used for some components
What does Programme Monitor?
Differences and/or effects inside vs. outside MPA
Parameters Measured • Key parameters for each discipline have been identified – full details are provided in Chapter 5 of the Arctic Marine Biodiversity Monitoring Plan (Gill et al 2011).
• The following will be monitored for benthic (micro, macro and mega fauna/flora) communities: o Abundance o Biomass o Species composition o Barcoding o Other genomics
• Benthic indicators include: o Abundance; community composition o Biomass; community composition o Size-frequency distribution (for selected, o mainly pan-Arctic species) o Diversity indices (e.g., Shannon, Simpson) o Distribution
Justification for Parameters • Develop long-term data sets to allow the estimation of natural variability, assess the status and trends of the Focal Ecosystem Components (FECs) in the context of this natural variation, and make this data available to correlate with potential driver data sets (e.g., abiotic or anthropogenic pressures) to assist research in identifying casual mechanisms driving Arctic marine environmental change.
• Develop pan-Arctic data collections to allow comparison of regional trends across the Arctic, thus also facilitating the identification of possible mechanisms driving change.
• Using the FECs and indicators, implement a responsive system for monitoring the status and trends of Arctic marine ecosystems and their biodiversity, which allows for ongoing assessment of the quality and health of the Arctic marine ecosystem.
Type of Data Collected for Parameter
• Key data required for each parameter in each of the six disciplines have been identified –full details are provided Chapter 8 of the Arctic Marine Biodiversity Monitoring Plan (Gill et al 2011); Preliminary sampling protocols are set out in Chapter 6 of the Arctic Marine Biodiversity Monitoring Plan (Gill et al 2011).
• For Benthic communities it is proposed that the following data
is collected:

121
o Abundance: The number of individual benthos of the same species found in a particular ecosystem/specified area
o Biomass: Total mass of living benthos in a given area at a given time
o Species Composition: The number of different species found in a specific area
o Community Composition: The number of different species found in a specific community
o Community Structure: combination of both the number of different types of species and the number of individuals of a species that are present in a specified area as well as the interaction between different species and the interaction between different individuals of the same species
o Distribution: The spatial arrangement (geographic location) of benthic organisms
o Diversity indices (e.g., Shannon, Simpson): Give indication of the number and variety of species present in an area/within a community. The Shannon index provides information about the evenness of the populations of various species and reaches a maximum when all species are equally abundant. The Simpson index measures the probability that two individuals randomly selected from a sample will be from the same species
o Size-frequency distribution: The relationship between abundance and size of individual benthic organisms
Frequency Parameter Measured
Not yet determined, but will be guided by exiting monitoring programmes – likely that sampling periods will vary from several times a year to once every 1-5 years.
Map of Monitored Sites: Available?
No
Map of Monitored Sites: Reference/Link
N/A
Reporting Statistical Analysis Used: To establish baselines for each FEC, it will be necessary to
conduct retrospective analyses of historical data, including proxy data. Subsequent analysis will include:
• Biodiversity indicators • Conceptual models • Statistical trends to determine spatial and temporal
trends • Empirical and other models • Quality assurance and control
Reporting Style: Anticipated reporting structure: • Status Reports • Indicator Reports • Review of protocols • Scientific papers • Performance Reports • Communications material
Reporting Frequency: Anticipated reporting frequency: • Status Reports – every 5 years (from 2015) • Indicator Reports – biannually (from 2012) • Review of protocols - every 5 years (from 2015) • Scientific papers – ongoing (from 2013) • Performance Reports – ongoing (Annually from 2012) • Communications material - ongoing (from 2013)

122
Use of Results Is Design of Programme to Inform Management?
Yes
Is Design of Programme to Indicate if Management Works?
No
Is there Evidence that Results Used?
Yes
Use of Results Data from existing monitoring programmes has been used, inter alia, for developing indicators and indices for the Arctic Species Trends Index (ASTI) and Arctic Protected Areas (known size and exact location of marine environment incorporated in protected areas not currently known).
Key References ARCTIC COUNCIL 2012. The Arctic Council [online]. Available from: http://www.arctic-
council.org/index.php/en/ [Accessed 04/01/12]. GILL, M., CRANE, K., HINDRUM, R., ARNEBERG, P., BYSVEEN, I., DENISENKO, N., GOFMAN, V.,
GRANT-FRIEDMAN, A., GUDMUNDSSON, G., HOPCROFT, R., IKEN, K., LABANSEN, A., LIUBINA, O., MELNIKOV, I., MOORE, S., REIST, J., SIRENKO, B., STOW, J., UGARTE, F., VONGRAVEN, D. & WATKINS, J. 2011. Arctic Marine Biodiversity Monitoring Plan (CBMP-Marine Plan). CAFF International Secretariat CAFF Monitoring Series Report No. 3. [online]. Available from: http://caffportal.arcticportal.org/images/nuuk_deliverables/Monitoring/M3_Marine [Accessed 05/12/11].

123
Case Study No. 9 Welsh Special Areas of Conservation Code: WA
MPA Facts MPA Name: Welsh Special Areas of Conservation
MPA Location: Wales, UK
MPA Objectives: To contribute to the development of an ecologically coherent UK network of well managed MPAs. The network will conserve rare, threatened, and representative species and habitats to enhance biodiversity and ecosystems. Meeting this commitment should in turn help secure a healthy marine environment that supports livelihoods and leisure around Wales.
Year MPA Designated: 2004
Legislation used to Designate MPA:
• The Marine and Coastal Access Act 2009 • Regulation 35 of the Conservation of Habitats and Species
Regulations 2010 (formerly known as 'Regulation 33 advice' under 1994 Habitats Regulations)
MPA Management Authority: • The Welsh Assembly Government • Countryside Council for Wales
Ecological System: Temperate
Offshore/Inshore/Inter-tidal: Inshore, including Intertidal
Seabed Habitat(s) Present in MPA:
Inlets, lagoons, Saltmarsh, sea-cliffs, mud-flats, sand-flats, sub-tidal rocky reefs
Number of MPAs in Network: • 5 European marine sites • 2 additional proposed sites • 2 terrestrial SACs which include marine features
Area of MPA (km2): 5,835
Map of MPA: Available? Yes
Map of MPA: Reference/Link Welsh Protected Areas
Monitoring Programme Facts Name of Programme: Across Wales marine monitoring programme
Who Conducts Monitoring: Countryside Council for Wales (CCW)
Status of Programme: Underway
Start Date: 2004
End Date: N/A (ongoing)
Programme Objectives: To follow and implement the component in Article 17 of the Habitat Directive 1992 that relates to marine monitoring.
Measurable Targets: Not specified
Cost of Programme: Total (person days/year)
250
Cost of Programme: Monitoring (person days/year)
7 x 30 person days/year
Cost of Programme: Analysis (person days/year)
40 (includes assessment)
Cost of Programme: Assessment (person days/year)
See above

124
Monitoring Programme Design Programme Design: Spatial • Three locals with varied number of sampling stations within
each: o Menai: 5 stations o Pen Llyn: 8 stations o Pembrokehsire Marine: 8 stations.
• Within each station, a varied number of sampling arrays have been established.
• Sampling within each station follows JNCC Common Standards
Monitoring protocol which has two approaches: o Features Based - specific features that categorize the
SAC undergo site-specific periodic sampling. o Fixed arrays of benthic quadrats surveyed following
anticipated gradient of anthropogenic influence across the SAC.
• In both, community structure is analysed spatially and temporally.
Programme Design: Temporal Annual or bi-annual sampling by reporting cycle
Programme Methodology/Equipment
• SCUBA surveys on relocatable fixed quadrats or line transects where applicable
• Extensive video and camera sampling • Drop-down video for below SCUBA depth • Mulit-beam side-scan sonar (to examine dynamic shift of reef
movements) Level of Expertise Required High and Low
Reason for Expertise Level Experienced divers or equipment handlers required for majority of work, although citizen scientists also used to support sample collecton. Taxonomic specialists used for red algae identification.
What does Programme Monitor?
Status of MPA
Parameters Measured • Community structure of benthic macro fauna and flora • Proportion of live cover, extent and condition of biogenic reefs
(Modiolus modiolus – horse mussel), plus epifaunal analysis • Spatial and temporal trends in indicator species – site specific
sponges (proxy for species diversity on limestone reefs), Parazonathus axinellae (anemone used for edge of range assessment), Laminera spp. (kelp, used as proxy for water clarity).
• Periodic fish population distribution on reefs – diversity and abundance
• Spat collection • Genetic profiling of biogenic reefs from cores (periodic
sampling) Justification for Parameters Follow EC Habitat Directive Article 17
Type of Data Collected for Parameter
See ‘Parameters Measured’
Frequency Parameter Measured
Every survey
Map of Monitored Sites: Available?
Yes
Map of Monitored Sites: Reference/Link
www.ukmarinesac.org.uk/uk-sites.htm http://www.pembrokeshiremarinesac.org.uk/index.htm

125
Reporting Statistical Analysis Used: Suite of multivariate techniques, utilising Primer-e (www.primer-
e.com) Reporting Style: • Status reports
• Scientific Papers • Non-technical summary reports • Large scale reviews
Reporting Frequency: Annual internal reporting, collated every 6-years.
Use of Results Is Design of Programme to Inform Management?
No
Is Design of Programme to Indicate if Management Works?
Yes
Is there Evidence that Results Used?
No
Use of Results N/A
Key References IRVING, RA, WHITTINGTON, MW, HOLT, RHF, STANWELL-SMITH, D, & NORTHEN, KO (2007)
Across-Wales Diving Monitoring Project Volume 1: Site Descriptions and Results 2004/05. A report to the Countryside Council for Wales by Pelagial Ltd. and Sea-Scope Marine Environmental Consultants. MMR No: 25a, 158pp
WHITTINGTON, MW, HOLT, RHF, IRVING, RA, NORTHEN, KO & STANWELL-SMITH, D (2007) Across-Wales Diving Monitoring Project Volume 2: Standard Operating Procedures. A report to the Countryside Council for Wales by Pelagial Ltd. and Sea-Scope Marine Environmental Consultants. MMR No: 25b, 88pp
126
Case Study No. 10 MAREANO mapping programme Code: NO
MPA Facts MPA Name: MAREANO mapping programme
MPA Location: Norwegian and Barents Seas, including Sularevet, Iverryggen and Rostrevet MPAs
MPA Objectives: N/A (Baseline Survey)
Year MPA Designated: N/A (Baseline Survey)
Legislation used to Designate MPA:
N/A (Baseline Survey)
MPA Management Authority: N/A (Baseline Survey)
Ecological System: Temperate/Polar
Offshore/Inshore/Inter-tidal: Offshore & Inshore
Seabed Habitat(s) Present in MPA:
Strandflat, submarine canyons, marine valleys, fjords, abyssal plain
Number of MPAs in Network: N/A (Baseline Survey)
Area of MPA (km2): 76,000km2 depth-mapped by MAREANO in 2005–2011. 67,600km2 mapped for habitat and biodiversity. Still expanding.
Map of MPA: Available? Yes
Map of MPA: Reference/Link MAREANO planned/completed survey areas (MAREANO 2011a)
Monitoring Programme Facts Name of Programme: MAREANO mapping programme
Who Conducts Monitoring: Executive Working Group: Institute of Marine Research, Geological Survey of Norway, Norwegian Hydrographic Service. Programme Group led by the Directorate of Fisheries.
Status of Programme: Ongoing
Start Date: 2005
End Date: 2011 (1st phase), 2015 (2nd phase)
Programme Objectives: MAREANO questions: • How is the seascape of the Norwegian continental shelf formed? • What does the seabed consist of? • How is the biodiversity distributed on the seabed? • How are habitats and biotopes distributed on the seabed? • What is the relationship between the physical environment, biodiversity and biological resources? • How are contaminants stored in sediments?
Measurable Targets: Not specified
Cost of Programme: Total (person days/year)
Not available
Cost of Programme: Monitoring (person days/year)
Not available
Cost of Programme: Analysis (person days/year)
Not available
Cost of Programme: Assessment (person days/year)
Not available

127
Monitoring Programme Design Programme Design: Spatial • Progressive mapping through structured areas of the
Norwegian and Barents Sea • Phase 1: 162,000 km2 area mapped • Phase 2 is focusing on valuable and vulnerable areas identified
in the management plan for the Norwegian Sea • 1 km long video transects positioned across mapped area with
associated grab stations. Locations selected based on review of bathymetry maps.
Programme Design: Temporal One off baseline survey
Programme Methodology/Equipment
Multibeam echo-sounding and bio-geo-sampling: • The Campod video rig: covers 1500–2000 m2 in one kilometre-
long transects, and documents the distribution of seabed types and megafauna (benthic animals greater than 2 cm), but also shows traces left by fishing gear on both fauna and the seabed., box corer, grab, epibenthic sledge, beam trawl used in this order.
• Box-corer: covers 0.1 m2 and provides information about the particle composition of the sediments and organic material available as food for benthic fauna.
• Grab: Documents the quantitative composition of macro-organisms (> 1 mm) that live in the sediments (known as infauna). Two samples, each covering 0,25 m2 meters, are taken at each station.
• Epibenthic sledge: covers 300–400 m2 and documents the occurrence and composition of crustaceans (hyperbenthos) that live in the upper sedimentary layer or swim just over the seabed (shrimps, mysidae, amphipods, etc.).
• Beam trawl: covers 500–800 m2; documents the occurrence of macro- and megafauna, particularly large animals that live in the upper layer or on the surface of the sediment.
• Multicorer; capable of taking up to nine core samples, and used to study the sedimentary content of environmental contaminants.
• The video rig is the first to be deployed, as this enables documentation of the seabed before the sampling process affects it, and indentification of sites where sensitive equipment (e.g. the box-corer, grab and epibenthic sledge) cannot be used. Samples are then gathered from suitable locations along the video transect, using the grab, multicorer and box-corer. Finally, the beam trawl and epibenthic sledge are dragged along the line of the video transect.
• By using several different sampling gears, MAREANO is able to document a large proportion of the overall biodiversity.
Details available from (MAREANO 2011b)
Level of Expertise Required High
Reason for Expertise Level Trained scientific personnel needed, specialist equipment
What does Programme Monitor?
MAREANO maps depth and topography, sediment composition, biodiversity, habitats and biotopes as well as pollution in the seabed in Norwegian coastal and offshore regions.
Parameters Measured • Seabed type distribution • Seabed characteristics • Distribution of species (megafauna, corals, epifauna,
dominants) • Sediment composition (inc. organics and contaminants: heavy

128
metals, hydrocarbons) • Production • Biodiversity • Infauna composition • Crustaceans (hyperbenthos) that live in the upper sedimentary
layer or swim just over the seabed (shrimps, mysidae, amphipods, etc.) - occurrence and composition
Details available from (MAREANO 2011b)
Justification for Parameters • The composition of the sediments, their forms and how they lie in the landscape indicate which processes have been historically active in shaping the seabed as it is today. The depositional environment map shows which present-day processes are affecting the seabed.
• Heavy metals, organic pollutants like PAH or PCB and radioactive substances may be found naturally in the sea, occasionally in high concentrations. It is therefore essential to know the background levels before contamination can be proved, and monitoring the natural levels of pollutants in non-contaminated areas is an important aspect of environmental chemistry investigations.
• Fish population distributions allow for monitoring of commercially important species and identification of potential conflicts with other industries (e.g. oil extraction).
• This distribution of epi- and infauna is important to know in order to manage the sea floor in the most sustainable way. Similarly, coral distributions help identify damaged habitats and areas of high conservation value.
Type of Data Collected for Parameter
• Mapping data (bathymetry) • Field sampling data
Frequency Parameter Measured
One off surveys
Map of Monitored Sites: Available?
Yes
Map of Monitored Sites: Reference/Link
Interactive maps (MAREANO 2011a)
Reporting Statistical Analysis Used: Detrended Correspondence Analysis (DCA) analysis to find
species groupings based on video footage, supervised GIS classification using DCA analysis outputs to map biotopes.
Reporting Style: • Interactive maps frequently updated allow exploration of the data. Online news articles present survey reports/successes and new species.
Reporting Frequency: Web site updated frequently
Use of Results Is Design of Programme to Inform Management?
Yes
Is Design of Programme to Indicate if Management Works?
No
Is there Evidence that Results Used?
Yes
Use of Results • Fill gaps in knowledge • Strengthening the knowledge base of the Barents Sea
management plan (Ministry of the Environment)

129
Key References MAREANO 2011a. MAREANO Interactive Maps [online]. Available from:
http://www.mareano.no/kart/viewer.php?language=en&bbox=-197424.3,7300000.0,1692424.3,8330000.0&KARTBILDE_ID=3 [Accessed 05/12/11].
MAREANO 2011b. The sea in maps and pictures [online]. Available from: http://www.mareano.no/english/index.html [Accessed 05/12/11].
MINISTRY OF THE ENVIRONMENT (Norway). 2006. Integrated Management of the Marine Environment of the Barents Sea and the Sea Areas off the Lofoten Islands (management plan). [online]. Available from: http://www.regjeringen.no/en/dep/md/Selected-topics/hav--og-vannforvaltning/integrated-management-of-the-barents-sea.html?id=87148 [Accessed 05/01/12].

130
Case Study No. 11 NEREIDA NAFO Potential Vulnerable Marine Ecosystems Code: NE
MPA Facts MPA Name: NEREIDA NAFO Potential Vulnerable Marine Ecosystems
MPA Location: Flemish Cap, Northwest Atlantic
MPA Objectives: N/A (Baseline survey)
Year MPA Designated: N/A (Baseline survey)
Legislation used to Designate MPA:
N/A (Baseline survey)
MPA Management Authority: N/A (Baseline survey)
Ecological System: Temperate
Offshore/Inshore/Inter-tidal: Offshore only
Seabed Habitat(s) Present in MPA:
Seamounts, hydrothermal vents, cold water corals, rocky habitat, sponge and sea-pen grounds
Number of MPAs in Network: N/A (Baseline Survey)
Area of MPA (km2): The study area covers from the 200 miles off the Canadian EEZ and the 700-2000 m isobaths in High Seas of the Northwest Atlantic High Seas
Map of MPA: Available? Yes
Map of MPA: Reference/Link NEREIDA Study Area - NEREIDA (NEREIDA 2011a) NEREIDA Study Area - NAFO (NAFO 2011)
Monitoring Programme Facts Name of Programme: NEREIDA NAFO Potential Vulnerable Marine Ecosystems
Who Conducts Monitoring: • Canada (Geological Survey of Canada and DFO) • Russia (PINRO and PP Shirshov Institute of Oceanology) • UK (CEFAS) • Spain (IEO and SGM)
Status of Programme: Complete
Start Date: 2009
End Date: 2011
Programme Objectives: • To identify the presence and distribution of the organisms that constitute Vulnerable Marine Ecosystems (VMEs) (e.g. cold water corals, large sponges) • To describe the ecology of the deep-sea habitats identified • To map the distribution of VMEs and other topographically distinct features in the area of study • To create and maintain a Geographic Information System database of all information collected during the project
Measurable Targets: Not specified
Cost of Programme: Total (person days/year)
Unknown (pers comms with Project Coordinator) – 8 months vessel time including mapping
Cost of Programme: Monitoring (person days/year)
Unknown
Cost of Programme: Analysis (person days/year)
Unknown
Cost of Programme: Assessment (person days/year)
Unknown

131
Monitoring Programme Design Programme Design: Spatial Stations selected at areas of interest identified from bathymetry
data. Surveys conducted both inside and outside of fisheries closures.
Programme Design: Temporal Once in four years 2011- 2015
Programme Methodology/Equipment
Multibeam Echosounder, Megabox-corer, Rock dredge, CTD (Conductivity, Temperature, Depth) Sensors, Remotely Operated Vehicles (ROV); equipment capable of working to depths of between 2000-5000 m - see NEREIDA (2011b, c, d).
Level of Expertise Required High
Reason for Expertise Level Trained scientific personnel needed
What does Programme Monitor?
Status both inside and outside VMEs
Parameters Measured • Sediment type distribution/composition • Organic matter • Infauna composition • Benthic epifauna - abundance of species, number of taxa • Concentration of vulnerable marine ecosystems (sponge, coral) • As of 2011, the following had been completed:
o 68,000 km2 had been surveyed o 1,048 seismic lines o 105 rock dredges o 368 box cores o 415 CTD Stations
Justification for Parameters Not specified
Type of Data Collected for Parameter
• Mapping data (bathymetry) • Species abundance, composition and distribution • Oceanographic data
Frequency Parameter Measured
One off survey
Map of Monitored Sites: Available?
Yes
Map of Monitored Sites: Reference/Link
NEREIDA Study Area - NEREIDA (NEREIDA 2011a) NEREIDA Study Area - NAFO (NAFO 2011) NEREIDA Survey Tools (NEREIDA 2011b) NEREIDA Sediment Samples (NEREIDA 2011c) Benthic Surveys (NEREIDA 2011d)
Reporting Statistical Analysis Used: • Analysis currently being undertaken. It is proposed that:
o The abundance of sponges and corals inside and outside closed areas will be compared
o Relationship between depth and abundance of species/number of taxa will be assessed.
o GIS database to be generated o GIS analysis o Cluster analysis to identify VMEs
Reporting Style: Not documented
Reporting Frequency: Once only - results due to be published 2014
Use of Results Is Design of Programme to Inform Management?
Yes
Is Design of Programme to No

132
Indicate if Management Works? Is there Evidence that Results Used?
N/A – results still to be finalised
Use of Results To identify VMEs in the NAFO area, to help better define the boundaries of closures
Key References NAFO (Northwest Atlantic Fisheries Organization). 2011. Map of NEREIDA survey area. [online].
Available from: http://www.nafo.int/science/frames/nereida.html [Accessed 04/01/12]. NEREIDA 2011a. NEREIDA Project. NAFO Potential Vulnerable Marine Ecosystems - Impacts of
Deep-sea Fisheries. Works of Mulipurpose RV Miguel Oliver (S.G.M). [online]. Available from: http://www.nafo.int/science/diptico-nereida.pdf [Accessed 04/01/12].
NEREIDA 2011b. Canadian contributions to NEREIDA 2009-2010. Surveys and sampling tools. [online]. Available from: http://www.nafo.int/science/nereida1.pdf [Accessed 04/01/12].
NEREIDA 2011c. Canadian contributions to NEREIDA 2009-2010. Sediment samples give insight into historical distribution of sponges in the NRA. [online]. Available from: http://www.nafo.int/science/nereida2.pdf [Accessed 04/01/12].
NEREIDA 2011d. Canadian contributions to NEREIDA 2009-2010. Benthic surveys using underwater cameras. [online]. Available from: http://www.nafo.int/science/nereida3.pdf [Accessed 04/01/12].

133
Appendix 5 Examples of good practice derived from the case studies reviewed
A5.1 Monitoring programme element #1: costs
The examples below show the variation in costs for different programmes. It should be noted that numerous factors will influence total costs, especially variation in currency value between countries. Where possible, the number of man days or years required to undertake the monitoring program are provided, which may be more useful for determining what the costs may be in the UK context. • Case Study 7: North Central Coast California
o The North Central Coast, California monitoring programme is extensive and well funded. The proposed budget, based on monitoring selected elements and not full implementation, is approximately USD$1.8 million (~GBP£1.2 million) for year one and approximately USD$2 million (~GBP£1.3 million) for years two to four.
o The North Central Coast, California monitoring plan also includes a breakdown of the pros and cons of different methods and associated costs (Figure A5.1.1).
Figure A5.1.1 Estimated costs of ecosystem feature checkup or assessment for rocky tidal ecosystems in the North Central Coast California monitoring programme. Source: MPA Monitoring Enterprise (2011).
• Case Study 4: Danish Natura 2000 sites
o The Danish NOVANA monitoring programme is an example of a national programme which is less detailed and has a lower level of sampling than the North Coast California example. It should be noted that this programme covers all Danish waters and not just MPAs. The Ministry of Environment will provide DKK9.4 million (~GBP£1 million) and regional authorities will provide DKK 40 million (~GBP£4.4 million) for the marine component over the course of the 5 year project. This equates to 8.3 man years from the Ministry of Environment and 35.7 man years from regional authorities.

134
• Case Study 11: NEREIDA NAFO Potential Vulnerable Marine Ecosystems o The NEREIDA project is an example of a small scale mapping programme. For this
project Spain used the RV Miguel Oliver for 6 months, and Canada used the RV Hudson for 2 months.
• Case Study 10: MAREANO mapping programme
o MAREANO is a much larger scale mapping programme which aims to cover all Norwegian waters but current focuses on key areas. The Programme is financed by the Ministry of Fisheries and Coastal Affairs, the Ministry of Environment and the Ministry of Trade and Industry via contributions from the National Budget. The total contribution over the course of 6 years, was NOK191.8 million (~GBP£20.7 million).
• Case Study 5: German Natura 2000 sites
o The German Natura 2000 monitoring is the case study which is most comparable to the UK context as it focuses on the monitoring of habitats within Natura 2000 MPAs, covers a similar range of habitats, and uses a similar range of methods. A breakdown of the costs in time annually and for a 6 year reporting period are provided in Table A5.1.1 (North Sea region) and Table A5.1.2 (Baltic Sea region).
Table A5.1.1 Overview of the study effort during one reporting period for the North Sea. Source: Nehls et al (2008).
North Sea Number of replicas sampled
once per reporting period Number of replicas sampled yearly
Habitats Reefs 52 10 Sandbanks 35 10 Total 87 20 Total expenditure Once per reporting period Yearly Days at sea 10 days 3-4 days Man days at sea 30 days 9-12 days Processing of the samples (Grab/Diver + Dredge)
75 working days 15 working days
Processing of the video material 20 working days 5 working days Table A5.1.2 Overview of the study effort during one reporting period for the Baltic Sea. Source: Nehls et al (2008).
Baltic Sea Number of replicas sampled
once per reporting period Number of replicas sampled yearly
Habitats Reefs 33 10 Sandbanks 35 10 Total 68 20 Total expenditure Once per reporting period Yearly Days at sea 8 days 3-4 days Man days at sea 24 days 9-12 days Processing of the samples (Grab/Diver + Dredge)
25 working days 15 working days
Processing of the video material 18 working days 5 working days
135
A 5.2 Monitoring programme element #2: MPA / MPA network objectives
• Case Study 1: Great Barrier Reef Marine Park o The Great Barrier Reef Marine Park has one broad Primary objective: ‘Provide for
the long term protection and conservation of the environment, biodiversity and heritage values of the Great Barrier Reef Region’. There are also three additional, specific additional objectives:
a) Allow ecologically sustainable use of the Great Barrier Reef Region b) Encourage engagement in the protection and management of the Great
Barrier Reef Region c) Assist in meeting Australia’s international responsibilities in relation to the
environment and protection of world heritage.
o The monitoring objectives show how the programme will assess whether objective a) is being met:
1. To monitor the status and changes in distribution and abundance of reef biota on a large scale
2. To provide environmental managers with a context for assessing impacts of human activities within the GBRMP and with a basis for managing the GBR for ecologically sustainable use
3. To examine the effects of re-zoning the GBRMP on biodiversity (in alternate years)
o These objectives guide the survey design, as a comparison is required between
zones to meet monitoring objective 3.
• Case Study 3: Tasmania‘s Marine Reserves o The Tasmanian monitoring programme was designed specifically to test for the
effect of the MPA at protecting fish populations by making comparisons between inside the MPA and outside. The monitoring objective reflects this: ‘To determine if there were any identifiable effects associated with the removal of fishing pressure within reserves on target species or the broader ecosystem over this ecologically significant timescale (one decade)’.
• Case Study 4: Danish Natura 2000 sites
o The Danish NOVANA programme was developed following a review of all Denmark’s monitoring obligations17.
• Case Study 7: North Central Coast California
o The North Central Coast, California Monitoring plan includes general objectives for the whole network which are based on the Marine Life Protection Act obligations, and then more targeted objectives were set.
• Case Study 2: The Gully MPA
o The Gully MPA has broad MPA objectives: 1. Protect the natural biodiversity of the Gully 2. Protect the physical structure of the Gully and its physical and chemical
properties 3. Maintain the productivity of the Gully ecosystem
17 http://www2.dmu.dk/1_viden/2_Publikationer/3_fagrapporter/rapporter/FR532.PDF

136
o The Gully MPA programme also has more specific targets designed to address the key threats identified:
1. Protecting cetaceans from impacts caused by human activities; 2. Protecting seafloor habitat and associated benthic communities from
alteration caused by human activities; 3. Maintaining or restoring the quality of the water and sediments of the Gully,
and 4. Conserving other commercial and non-commercial living resources.
A5.3 Monitoring programme element #3: management use
• Case Study 1: Great Barrier Reef Marine Park o The results of the Long Term Monitoring Programme (LTMP) conducted by the
Australian Institute of Marine Science (AIMS) on the Great Barrier Reef are used to inform zoning plans.
o The Great Barrier Reef Marine Park assessed its management effectiveness using the IUCN guidelines and adjusted its management plan accordingly.
• Case Study 8: Arctic Marine Areas
o For Arctic Marine Areas, it is proposed that there is an independent review of the parameters, indicators, sampling, data management, and analysis and reporting used in the Circumpolar Biodiversity Monitoring Program Marine Plan every 5 years.
• Case Study 11: NEREIDA NAFO Potential Vulnerable Marine Ecosystems
o The NEREIDA programme was commissioned by NAFO in order to assess whether the boundaries of fisheries closures were in the best location in order to protect the densest aggregations of sponges.
A5.4 Monitoring programme element #4: assessment and analysis
Sensitivity analysis • Case Study 1: Great Barrier Reef Marine Park
o The LTMP conducted by AIMS on the GBR was the only case study where it was evident that some form of sensitivity analysis had been conducted. Results from the analysis showed that sampling effort for status and trends surveys could be reduced from annual to bi-annual without significant loss of information. This enabled them to use these resources to expand the programme to monitor the effects of major rezoning in the GBR Marine Park by surveying a different set of appropriate reefs in the alternate years.
Type of assessment • Case Study 1: Great Barrier Reef Marine Park
o Assessments in the status reports for AIMS LTMP generally compare the trends of various parameters between different areas but no not attempt to perform any statistical analyses. Linear mixed effects models were used to assess if there were significant differences in fish abundance in different zones, but this was limited to a select number of sites and undertaken as a one-off experiment to test for the effects of re-zoning.
• Case Study 3: Tasmania o Long-term ecosystem monitoring was undertaken in one MPA within the
Tasmanian network, Jurien Bay (Edgar et al 2009). Assessments used

137
multivariate statistical analyses to test for significant differences between sanctuary zones, multiple use zones and scientific reference sites. PCAs and MDS analysis were used to assess for differences in community structure and ANOVA was used to test for differences between sites, although this did not include factors to take into account spatial noise between sites, such as depth. This type of survey could not be replicated at a national scale as 42 different sites were monitored just for one habitat type (reef) which is likely to be unfeasible within the budget. It is likely that an even larger level of replication is needed to identify differences within a heterogeneous environment, as statistical tests used in this case study did not identify any significant differences. This is probably due ‘overfitting’ the models used to the data available.
Network assessment • Amongst others, both the North Central Coast California programme and the Great
Barrier Reef Marine Park Authority have established methods for assessing networks as a whole
o Case Study 7: North Central Coast California The North Central Coast, California monitoring plan provides a suggested
layout for reporting assessments, which includes a red to green colour scale to show current state and an arrow to show the current trend (Figure A5.4.1).
Figure A5.4.1 Example assessment report from North Central Coast, California case study. Source: MPA Monitoring Enterprise (2011).
• Case Study 1: Great Barrier Reef Marine Park The GBR ecosystems’ environmental, social and economic values,
pressures, and responses were compiled from existing evidence, and assessed by experts (including from agencies, researchers, industry representatives and members of the public), to provide the likely outlook for

138
the system. Each element was graded from Very Good through to Very Poor (examples shown in Figure A5.4.2.
a)
b)
Figure A5.4.2 Results of the assessment of the GBR for a) Biodiversity on the GBR, and b) the GBR ecosystem as a whole. Source: GBRMPA (2009).
A5.5 Monitoring programme element #5: survey design
Spatial design • Case Study 8: Arctic Marine Areas
o The locations of existing monitoring in Arctic Marine Areas were reviewed, and additional stations proposed to ensure adequate coverage of all habitats.
• Case Study 1: Great Barrier Reef Marine Park
o The Great Barrier Reef Marine Park monitors the perimeter of reef areas using manta tows, and at an additional five transects within each site. Four paired sites were selected across the whole survey area to test for difference inside and outside the marine park. Monitoring was also conducted to compare selected parameters between management zones, following re-zoning.
• Case Study 6: Central Coast California
o In order to monitor the effect of the MPA on fish communities, the Central Coast, California sub-tidal monitoring programme selected four sites inside and four sites outside of MPAs using a random stratified approach (see Figure A5.5.1). At each of these sites divers collected data on the size and abundance of all conspicuous

139
fish species found at four depth zones (5, 10, 15, and 20 m deep). At each depth zone, pairs of divers surveyed three transects (30 m long by 2 m wide by 2 m tall) at three levels within the water column (benthic, mid-water and canopy), totalling 36 transects per site. Seabed habitat monitoring would only require the benthic level to be monitored, but the general survey design could be considered for the UK. Benthic fauna was also surveyed at three depth zones along three transects.
Figure A5.5.1 Stratified random sampling survey design of PISCO monitoring of MPAs by SCUBA in waters off Central California, 2007-08. Source: MPA Monitoring Enterprise (2010). • Case Study 5: German Natura 2000 sites
• In the German Natura 2000 monitoring programme, sampling stations were selected to encompass all Annex I Habitat protected by the MPA (see example in Figure A5.5.2). The boundaries of habitats were recorded in advance using side scan sonar.

140
Figure A5.5.2 Station overview for the Sylter Auβenriff reefs. Source: Nehls et al (2008). Temporal scale • Case Study 5: German Natura 2000 sites
o Monitoring of the German Natura 2000 sites is undertaken annually; monitoring of the full extent of habitats using seabed mapping is repeated every 10 years.
• Case Study 1: Great Barrier Reef Marine Park
o Initially, annual surveys were conducted for the AIMS LTMP of the Great Barrier Reef; however, the programme was modified in 2006 when analyses of trajectories of coral cover on the survey reefs showed that little information would be lost if surveys were made every second year.

141
A5.6 Monitoring programme element #6: parameters
• Case Study 7: North Central Coast California o This case study listed the parameters required for each key attribute under each
ecosystem (those relevant to seabed habitats summarised in Table A5.6.1). Focal species were selected for several parameters to act as indicators for attributes which cannot be monitored as a whole, such as trophic structure. These species do not occur in UK waters, but provide an example of the type of focal species which could be selected.
Table A5.6.1 Example key attributes, parameters and focal species from the Californian North Central Coast case study.
Key Attribute Relevant ecosystems
Parameter Focal species18
Predators: benthic invertebrates
Soft bottom sub-tidal
Density of focal species Dungeness crab (Metacarcinus magister) and sea stars (Pisaster ochraceus, Pycnopodia helianthoides)
Strong ecological interactors
Rocky inter-tidal
Density and size structure of focal species (invertebrates)
Sea stars (Pisaster ochraceus, Pycnopodia helianthoides), purple sea urchin (Strongylocentrotus purpuratus), giant/owl limpet (Lottia gigantean)
Trophic structure
Mid depth rock (30-100m)
Density of focal species (mobile invertebrates)
Rock crabs (Cancer spp.), sheep crabs (Loxorhynchus grandis), box crabs (Lopholithodes foraminatus)
Soft bottom sub-tidal
Benthic infauna: Feeding guilds (relative proportions)
Sand dollar (Dendraster excentricus)
Estuarine and wetlands
Abundance of focal species
Infaunal assemblage: Mud shrimp (Upogebia pugettensis), ghost shrimp (Neotrypaea californiensis), Pacific innkeeper worm (Urechis caupo), Pacific gaper clam (Tresus nuttali), Littleneck clam (Protothaca laciniata)
Soft bottom inter-tidal and beach
Abundance and size structure of focal species (suspension feeders)
Sand crab (Emerita analoga), razor clam (Siliqua patula)
Biogenic habitat
Kelp and shallow rock (0-30m)
Areal extent of surface kelp canopy, stipe (stalk) density and size structure
Rocky inter-tidal ecosystems
Cover of focal species Turf algae, foliose red algae, fucoids, mussels (Mytilus spp.), feather boa kelp (Egregia menziesii, turf grass (Phyllospadix sp.)
Mid depth rock (30-100m)
Cover and density of structure forming invertebrates
Soft bottom sub-tidal
Total cover of biogenic habitat, biogenic habitat diversity
Estuarine and wetlands
Areal extent of eel grass
18 Most of these focal species do not occur in the UK, but are provided as an example of which types of species were selected.
142
A5.7 Monitoring programme element #7: survey techniques
Equipment/methodology • Case Study 6: Central Coast California
o The Central Coast, California baseline survey utilised 29 trained divers to collect monitoring data on kelp forest, allowing 30 km2 to be covered within 5 months.
• Case Study 10: MAREANO mapping programme
o The MAREANO Norwegian seabed mapping project conducted a very thorough census of biodiversity using the CAMPOD video rig (an underwater video which moves along a static transect), box core, grab sample, epibenthic sledge and trawl. They found the different equipment sampled different components of the community, and none were effective alone; however, it is unlikely that this approach could be taken regularly due to prohibitive costs.
• Case Study 5: German Natura 2000 sites
o The German Natura 2000 monitoring programme includes mapping habitats using remote sensing by side scan sonar or bathymetry every 10 years.
• Case Study 1: Great Barrier Reef Marine Park
o The LTMP conducted by AIMS on the Great Barrier Reef involves recording video along 50m transects and 50 still photographs shots. They found that stills should be taken rather than screen shots from continual video footage, as the resolution is better for analysis.
• Case Study 8: Arctic Marine Areas
o The Circumpolar Biodiversity Monitoring Plan for AMAs provides a detailed methodlogy for benthic sampling, and states that 3-5 replicate grab samples are needed to adequately capture local variability of the community.
Who conducts monitoring • Case Study 1: Great Barrier Reef Marine Park
o The Australian Institute of Marine Science (AIMS), responsible for the LTMP on the Great Barrier Reef, is a partner of the Western Australian Marine Science Institution (WAMSI). WAMSI is a collaboration between state, federal, industry and academic institutions, thus utilising the expertise of universities. AIMS uses volunteers and students to assist with their research, but they must have adequate logged dive time and previous experience.
• Case Study 7: North Central Coast California
o The North Central Coast, California monitoring plan proposes that volunteers monitor ‘vital signs’ such as rock crab abundance for rock ecosystems, while trained scientists monitor other parameters such as the cover and density of structure forming invertebrates.

143
A5.8 Monitoring programme element #8: dissemination and reporting
• Case Study 7: North Central Coast California o The North Coast California monitoring plan recommends that annual progress
reports are produced which show progress towards project targets, and a summary of expenditure. Final reports following the completion of a monitoring project will include a comparison of results to the baseline established linked to programme objectives, as well as a financial report.
• Case Study 8: Arctic Marine Areas
o The Arctic Marine Area monitoring programme proposes to disseminate information in a number of ways: State of Arctic Marine Biodiversity Report (every 5 years), Status of Indicators Scientific Publications (bi-annual), Performance Reports and Work Plans (annual).
A5.9 Monitoring programme element #9: data management
• Case Study 8: Arctic Marine Areas o The Circumpolar Biodiversity Monitoring Program (CBMP) for Arctic Marine Areas
has an online portal where data is submitted, and a publicly accessible web page with search facilities for finding and downloading data. This is available at: www.arcticdata.is.
o The CBMP monitoring plan provides a detailed description of standards for data management.
• Case Study 10: MAREANO mapping programme
o MAREANO has a website with map viewer and download tool, information pages and example charts. Available at: www.mareano.no/english/.
• Case Study 6: Central Coast California
o Data from baseline surveys for the Central Coast, California is managed in PISCO’s data catalogue, and assessment results can be explored, queried and downloaded in an online map viewer. Available at: http://osu.piscoweb.org/DataCatalogAccess/DataCatalogAccess.html.
• Case Study 1: Great Barrier Reef Marine Park
o The AIMS data catalogue holds monitoring data from their long term monitoring programme on the Great Barrier Reef. Data can be searched, viewed in an online mapping tool and downloaded. This is available at: http://data.aims.gov.au/metadataviewer/faces/search.xhtml;jsessionid=6C61E397D14783A374AD5AAC9CB04BE5.

144
Appendix 6 Supplementary Electronic Material
Two supplementary pieces of information that support this report are available in electronic format (Microsoft Excel spreadsheets). The databases are available for download from the JNCC website (http://jncc.defra.gov.uk/page-2132 - see JNCC Report No. 460).
1. A database containing information on each of the 11 case studies selected for review. 2. The results of the SAC analysis performed on each individual case study.