review of fit for the future strategies - ipart.nsw.gov.au · review of fit for the future...
TRANSCRIPT

Review of Fit for the Future
Strategies
Port Macquarie Hastings Council
Final Report
June, 2015

Port Macquarie-Hastings Council - Review of Fit for the Future Strategies Final Report
i
Document Control
Job ID: 17940
Job Name: Peer Review of Sustainability Proposal
Client: Port Macquarie-Hastings Council
Client Contact: Monika Bretmaisser
Project Manager: Gavin O’Donovan
Email: gavin.odonovan aecgroupltd.com
Telephone: 0438 550 018
Document Name: Review of Fit for the Future Strategies Draft V2.0
Last Saved: 5/6/2015 10:48 AM
Version Date Reviewed Approved
Draft V1.0 06/05/2015 DT GO
Draft V1.1 11/05/2015 DT GO
Draft V2.0 02/06/2015 DT GO
Final 05/06/2015 DT GO
Disclaimer:
Whilst all care and diligence have been exercised in the preparation of this report, AEC Group Pty Ltd does not warrant the accuracy of the information contained within and accepts no liability for any loss or damage that may be suffered as a result of reliance on this information, whether or not there has been any error, omission or negligence on the part of AEC Group Pty Ltd or their employees. Any forecasts or projections used in the analysis can be affected by a number of unforeseen variables, and as such no warranty is given that a particular set of results will in fact be achieved.

Port Macquarie-Hastings Council - Review of Fit for the Future Strategies Final Report
ii
Executive Summary
Port Macquarie-Hastings Council (Council) has prepared a Fit for the Future Improvement Proposal based around a range of revenue, cost and service delivery strategies, which aims to meet the requirements of the Fit for the Future program Expert Advisory Panel – the Independent Pricing and Regulatory Tribunal (IPART). AEC was commissioned to undertake
a peer review of the appropriateness of these strategies and their implications for Council’s overall financial capacity and sustainability.
Council’s strategies include:
Increases in fees and charges including the crematorium;
50% cost recovery for Parks and Reserves expenditure;
Income from improved use of property including some sales of excess land;
Decrease in interest on borrowings from a Loan Review;
Savings in procurement;
Savings in depreciation from an Asset Review;
Leave Liability Review; and
Dividends from the Water and Sewerage Funds derived from an improved operating position, assisted by reductions in interest and depreciation charges.
In addition to the above strategies, Council is proposing the following Special Rate
Variations (SRV):
Making the temporary SRV of 4.43% permanent from 2017/18 and a continuation of increased maintenance expenditure;
Application for an additional permanent SRV phased in over 3 years (10.0% in 2017/18, 10.0% in 2018/19, 6.0% in 2019/20), funding additional maintenance expenditure and infrastructure renewals;
If all proposed Fit for the Future sustainability strategies are implemented by Council,
supported by the community and approved by the relevant regulatory bodies, its financial capacity and sustainability will be greatly improved.
With respect to meeting the IPART requirements:
Sustainability
o Operating Performance – Council achieves the requirement of ‘must meet within 5 years’ in relation to at least a break even operating position.
o Own Source Operating Revenue – Council achieves the requirement of ‘must meet
within 5 years’ in relation to at least 60% own source revenue.
o Building and Infrastructure Asset Renewal – Council achieves an overall improvement which is consistent with the requirement to ‘meet or improve within 5 years’ in relation to the 100% benchmark. (However, Council should confirm the appropriateness of its assumption that all capital works from 2017/18 are of a
renewal nature.)
Effective Infrastructure and Service Management
o Infrastructure Backlog – Council achieves a significant improvement which is consistent with the requirement to ‘meet or improve/inform within 5 years’ in relation to the less than 2% benchmark.
o Asset Maintenance Ratio – Council achieves the requirement to ‘meet or improve/inform within 5 years’ in relation to the 100% benchmark.
o Debt Service Ratio – Council achieves the requirement of ‘must meet within 5 years’
in relation to a 0%-20% debt service ratio.

Port Macquarie-Hastings Council - Review of Fit for the Future Strategies Final Report
iii
Efficiency
o Real Operating Expenditure per capita – Council is committing to additional investment in asset maintenance expenditure (to a more ‘normalised’ level of expenditure) which distorts the 2015/16 to 2019/20 trend and the capability to
meet the requirement of ‘must demonstrate operational savings (net of IPR supported service improvements) over 5 years’. However, when taking into account a longer period it is evident that Council is expected to achieve a declining real operating expenditure per capita ratio.
Council has demonstrated that it has undertaken a large number of reviews and implemented numerous strategies to improve its financial position to date, with the additional Fit for the Future strategies expected to materialise additional cost savings and
operational/service delivery efficiencies. A review by AEC of potential additional strategies for consideration highlighted that the scope for additional investigations and strategies is quite limited, particularly given that Council is also 12 months into a very comprehensive Service Review. Any savings or efficiencies that may be achieved as a result of this Service Review would be above and beyond those included in the Fit for the Future submission
given that they are not identifiable and quantifiable at this stage.

Port Macquarie-Hastings Council - Review of Fit for the Future Strategies Final Report
iv
Table of Contents
DOCUMENT CONTROL .......................................................................................... I
EXECUTIVE SUMMARY ......................................................................................... I
TABLE OF CONTENTS......................................................................................... IV
1. INTRODUCTION .......................................................................................... 1
1.1 PURPOSE OF THIS STUDY ..................................................................................... 1
1.2 SCOPE AND LIMITATIONS ..................................................................................... 1
2. COUNCIL’S SUSTAINABILITY PROPOSAL .................................................... 2
2.1 IPART REQUIREMENTS ....................................................................................... 2
2.3 COUNCIL’S FIT FOR THE FUTURE PROPOSAL ................................................................ 3
2.4 SUSTAINABILITY INDICATOR OUTCOMES .................................................................... 4
3. STRATEGY ANALYSIS ................................................................................ 10
3.1 HISTORIC IMPROVEMENTS .................................................................................. 10
3.2 PROPOSED FFTF STRATEGIES ............................................................................. 14
3.3 OTHER CONSIDERATIONS/RISKS .......................................................................... 18
3.4 POTENTIAL ADDITIONAL STRATEGIES ..................................................................... 19
4. RESULTS OF PEER REVIEW ........................................................................ 21
4.1 FINANCIAL PERFORMANCE .................................................................................. 21
4.2 MEETING THE FIT FOR THE FUTURE REQUIREMENTS ..................................................... 21
REFERENCES ..................................................................................................... 23
GLOSSARY ........................................................................................................ 25
APPENDIX A – FINANCIALS .............................................................................. 26

Port Macquarie-Hastings Council - Review of Fit for the Future Strategies Final Report
1
1. Introduction
1.1 Purpose of this Study
Previous reviews of Port Macquarie-Hastings Council’s (Council) financial sustainability
have identified a number of concerns surrounding persistent operating deficits and a growing infrastructure backlog. Council has undertaken a range of strategies to date to influence both revenue and expenditure outcomes, including the successful application for a Special Rate Variation (SRV) in 2012 to assist in meeting these obligations.
Looking forward, Council staff have identified a range of new strategies to address the identified sustainability concerns and to support its ongoing capacity and financial
sustainability. These strategies have been incorporated in Council’s Fit for the Future submission to meet the requirements of the NSW Government’s Fit for the Future reform program.
Part of the submission is modelling Council’s financial position and forecasting the
movement in its sustainability indicators over time. AEC Group Pty Ltd (AEC) has been commissioned to review the accuracy and appropriateness of the financial inputs, assumptions and results underlying Council’s submission, in addition to undertaking an
assessment of the strategies forming part of the submission and other strategies that may assist in enhancing Council’s overall financial sustainability position.
This report undertakes an evaluation of the appropriateness of Council’s Fit for the Future strategies and their implications for ongoing financial capacity and sustainability.
A Fit for the Future local government is indicated to be one that:
Has the scale and capacity to engage effectively across community, industry and government;
Is sustainable;
Is efficient; and
Effectively manages infrastructure and delivers services for communities.
The Independent Pricing and Regulatory Tribunal (IPART) has been directed to act as the Expert Advisory Panel to review the Fit for the Future proposals submitted by NSW local governments.
1.2 Scope and Limitations
The financial model assessment undertaken by AEC is at a specific point in time, knowing that strategies are being formulated in an ongoing manner to further improve the financial sustainability of Council. It should be noted here that this review does not consider cash
flows, balance sheets or asset valuations. It purely includes an assessment of Council’s submissions meeting the Fit for the Future requirements and the reasonableness of the underlying inputs, assumptions, outcomes and strategies.
The peer review has undertaken a number of checks associated with the implementation of the Fit for the Future strategies within the modelling, with each of these queries being
raised and discussed with Council senior staff where relevant. The values reflected in this report are reflective of the LTFP modelling provided on 15 May 2015 (updated from earlier
versions from 4 May 2015 and 27 April 2015).

Port Macquarie-Hastings Council - Review of Fit for the Future Strategies Final Report
2
2. Council’s Sustainability Proposal
2.1 IPART Requirements
IPART has been directed to act as the Expert Advisory Panel to review the Fit for the Future
proposals submitted by NSW local governments. IPART published its Consultation Paper on 27 April 2015 on the Methodology for Assessment of Council fit for the Future Proposals.
As part of its Fit for the Future submission, Council must have a sound and credible plan to improve its financial situation. The plan could be structural change or include strategies for consistent structural improvement1.
The scale and capacity assessment of Council includes its ability to meet the financial
sustainability indicator benchmarks or demonstrate improvements to meet the benchmarks. The requirements are separated into ‘must meet’ and ‘must demonstrate improvement’ within a 5 year time period, as per the following table.
Table 2.1: Sustainability Indicator Requirements
Financial Indicator Benchmark Requirement
Sustainability
Operating Performance Greater than or equal to break-even average over 3 years
Must meet within 5 years
Own Source Operating Revenue
Greater than 60% average over 3 years Must meet within 5 years
Building and Infrastructure Asset Renewal Ratio
Greater than 100% average over 3 years Meet or improve within 5 years
Effective Infrastructure and Service Management
Infrastructure Backlog Less than 2% Meet or improve/inform within 5 years
Asset Maintenance Ratio Greater than 100% average over 3 years Meet or improve/inform within 5 years
Debt Service Ratio Greater than 0% and less than 20% average over 3 years
Meet within 5 years
Efficiency
Decrease in Real Operating Expenditure per capita over time
A decrease in Real Operating Expenditure per capita over time
Must demonstrate operational savings (net of IPR supported service improvements) over 5 years
Source: Council LTFP
IPART’s Consultation Paper encourages all Councils to meet the benchmarks as early as possible, with an assessment of Council capacity and resources to achieve these benchmarks.
Councils are required to complete the proposed templates for 2013/14 actuals and 2016/17 to 2019/20 projections, noting that 2014/15 and 2015/16 would assist IPART’s assessment.
1 http://www.fitforthefuture.nsw.gov.au/preparing-proposal

Port Macquarie-Hastings Council - Review of Fit for the Future Strategies Final Report
3
2.3 Council’s Fit for the Future Proposal
Council is preparing its Fit for the Future submission based on remaining a stand-alone entity, i.e. it can be sustainable by itself without structural reform. As such, the Council Improvement Plan (Template 2) is used for its sustainability assessment.
A number of reviews have been and are being undertaken by Council which will work to improve the financial position both in the short term and through the long term. The ‘new’ strategies that are incorporated into the LTFP to achieve the Fit for the Future requirements can be summarised as follows:
Revenue:
o Increases in fees and charges including the crematorium
o 50% cost recovery for Parks and Reserves expenditure
o Income from improved use of property, including some sales of excess land
o Making the temporary SRV approved by IPART in 2012 of 4.43% permanent from
2017/18, generating approximately $2 million per annum as outlined below.
Table 2.2: Making the Temporary SRV Permanent, 2017/18 to 2019/20 ($000’s)
Description 2017/18 2018/19 2019/20
SRV income $1,948 $2,006 $2,066
Maintenance expense $580 $597 $615
Maintenance Allocation 30% 30% 30%
Renewals $1,368 $1,409 $1,451 Source: Council LTFP
o Application for an additional SRV with a phased implementation over 3 years, consisting of a 10.0% permanent increase in 2017/18, a 10.0% permanent increase in 2018/19, and a 6.0% permanent increase in 2019/20, generating an additional $14 million in 2019/20;
Table 2.3: Additional SRV, 2017/18 to 2019/20 ($000’s)
Description 2017/18 2018/19 2019/20
SRV income $4,840 $10,280 $14,041
Maintenance expense $2,500 $2,575 $2,678
Maintenance Allocation 52% 25% 19%
Renewals $2,340 $7,705 $11,363 Source: Council LTFP
Expenditure:
o Decrease in interest on borrowings from Loan Review
o Savings in procurement
o Savings in depreciation from Asset Review
o
o Continuation of the increased maintenance expenditure attached to the 4.43%
(currently temporary) SRV
o Additional maintenance expenditure and infrastructure renewals from the proposed additional (phased) permanent SRV; and
Inter-fund:
o Dividends from the Water and Sewerage Funds.
The financial implications of the above strategies are summarised in Table 2.4.

Port Macquarie-Hastings Council - Review of Fit for the Future Strategies Final Report
4
Table 2.4: Strategies in Fit for the Future Submission, 2015/16 to 2019/20 ($000’s)
Description 2015/16 2016/17 2017/18 2018/19 2019/20
Operating Revenue
Crematorium Revenue - $50 $50 $50 $50
Cost Recovery from Parks and Gardens - $300 $307 $315 $322
Land Review $43 $335 $867 $1,393 $1,765
Make Temporary 4.43% SRV Permanent - - $1,948 $2,006 $2,066
Additional Permanent SRV Request - - $4,840 $10,280 $14,041
Operating Expenses
Net Interest Change – Glasshouse Loans $(325) $(295) $(272) $(240) $(226)
Net Interest Change – Sewerage Loans $(462) $(425) $(391) $(351) $(307)
Procurement Savings - $(250) $(256) $(262) $(268)
Depreciation Change – General Fund Buildings $(416) $(433) $(450) $(468) $(487)
Depreciation Change – Stormwater $228 $237 $247 $256 $267
Depreciation Change – Roads $(600) $(624) $(649) $(675) $(702)
Depreciation Change – Water Fund and Sewerage Fund $(2,912) $(3,028) $(3,150) $(3,276) $(3,406)
4.43% SRV Maintenance Expenditure Permanent - - $580 $597 $615
Additional Permanent SRV Maintenance Expenditure - - $2,500 $2,575 $2,678
Asset Renewals
4.43% SRV Renewals Expenditure Permanent - - $1,368 $1,409 $1,451
Additional Permanent SRV Renewals Expenditure - - $2,340 $7,705 $11,363
Inter-Fund
Dividend Receipts – General Fund $824 $1,328 $1,884 $1,903 $1,921
Dividend Payments – Sewerage Fund $297 $667 $906 $915 $924 Dividend Payments – Water Fund $527 $661 $978 $988 $997
Source: Council LTFP Note: Positive Operating Revenue values reflect income increase, Positive Operating Expense values reflect increase in costs.
The following outcomes are noted:
Making the current temporary 4.43% SRV permanent generates approximately $2 million from 2017/18, with 70% allocated to renewals and 30% allocated to maintenance expenditure;
Identified loan savings and depreciation reductions allow the Water and Sewerage
Funds to pay dividends to the General Fund which begin at around $0.8 million in
2015/16, increasing to around $1.9 million from 2017/18;
The General Fund interest changes equate to an 8.8% reduction against the base LTFP, with the General Fund depreciation reduction equating to a 3.2% reduction against the base LTFP.
The additional SRV rates revenue will be applied to asset renewals and maintenance expenditure, with the table below reflecting the results over the five year forecast
period.
Table 2.5: Asset Maintenance Expenditure Forecast 2015/16 – 2019/20 ($000’s)
Financial Year Required
Maintenance Forecast
Maintenance Forecast
Renewals Forecast Backlog
2015/16 $16,724 $13,703 $30,758 $116,716
2016/17 $17,125 $14,032 $11,939 $116,716
2017/18 $17,536 $16,869 $16,778 $113,008
2018/19 $17,957 $17,289 $21,439 $107,602
2019/20 $18,388 $17,745 $26,831 $103,902 Source: Council LTFP
2.4 Sustainability Indicator Outcomes
2.4.1 Summary
The table below shows the sustainability indicators after the Fit for the Future strategies are applied, with Appendix A providing the indicators for the longer forecast period. Council is forecast to meet 3 of the 7 sustainability indicator benchmarks over the 5 year period, with:
The Efficiency Ratio requiring a longer period given the increased maintenance
expenditure projected to cover the current shortfall is distorting the ratio outcomes;

Port Macquarie-Hastings Council - Review of Fit for the Future Strategies Final Report
5
The infrastructure backlog showing an improving trend towards the identified
benchmark;
The renewal ratio showing an improving trend towards the identified benchmark; and
The asset maintenance ratio showing a significant improvement towards benchmark.
Table 2.6: Sustainability Indicators Fit for the Future LTFP, 2015/16 to 2019/20
Indicator Benchmark 2015/16 2016/17 2017/18 2018/19 2019/20
Sustainability Financial Indicators
Operating Performance >= breakeven (avg over 3yrs)
(6.4)% (7.6)% (3.8)% (1.6)% 2.0%
Own Source Operating Revenue >60%
(avg over 3yrs) 66.66% 69.05% 73.39% 78.50% 79.67%
Building and Infrastructure Asset Renewal Ratio
>100% (avg over 3yrs)
74.58% 75.58% 80.16% 63.92% 79.82%
Effective Infrastructure and Service Management Financial Indicators
Infrastructure Backlog <2%
(annual chg) 9.01% 9.04% 8.82% 8.14% 7.15%
Asset Maintenance Ratio >100%
(avg over 3yrs) 67.23% 81.94% 86.69% 91.47% 96.32%
Debt Service Ratio 0-20%
(avg over 3yrs) 9.67% 10.29% 10.02% 9.37% 8.49%
Efficiency Financial Indicators
Decrease in Real Operating Expenditure per capita over time
Declining trend (annual chg)
1.1634 1.1807 1.1953 1.1942 1.1964
Source: Council LTFP Notes: The values where the Benchmark requires annual change reflects the yearly change, whereas the other indicator values reflect the 3 year averaged values, that is, they are not annual yearly change. Green reflects outcomes that meet the relevant benchmark. Red reflects outcomes
not meeting the relevant benchmark.
2.4.2 Financial Indicators – Sustainability
2.4.2.1 Operating Performance
The operating deficit (before capital grants and contributions) in the base LTFP is estimated
at $6.8 million in 2015/16, increasing to $10.3 million in 2016/17 and $11.8 million in 2017/18, with the deteriorating trend projected to continue in the future years. Under the Fit for the Future strategies, the operating position improves substantially, with operating surpluses generated from 2018/19 and continuing through the future forecast period to 2024/25. On a 3-year average basis, the relevant IPART requirement is met in 2019/20.
Figure 2.1: Operating Performance Indicator 2015/16 to 2019/20
Source: Council LTFP
(15)%
(10)%
(5)%
0%
5%
10%
2015/16 2016/17 2017/18 2018/19 2019/20
3 year average (Base) 3 year average (FFF)
Break even Operating Performance yearly (FFF)
Council achieves the requirement of ‘must meet within 5 years’ in relation to at least a break even operating position.

Port Macquarie-Hastings Council - Review of Fit for the Future Strategies Final Report
6
2.4.2.2 Own Source Operating Revenue Indicator
The Own Source Operating Revenue Ratio is above benchmark, of 60% or greater, for the forecast period as shown in Figure 2.2 under both the base LTFP and the Fit for the Future strategies LTFP. The jump in the ratio in 2016/17 is due to a $19 million drop in capital
grants and contributions.
Figure 2.2: Own Source Operating Revenue Indicator 2015/16 to 2019/20
Source: Council LTFP
2.4.2.3 Building and Infrastructure Asset Renewal Indicator
Building and infrastructure asset renewal funding remains insufficient to achieve the benchmark by 2019/20 (and even 2024/25), although a significant improvement is projected from the base LTFP as a result of the implementation of the Fit for the Future strategies. Council averages a result of around 80% over the 10 year period. Council has assumed that from 2017/18 all capital works will be of a renewal nature. Any change in
this assumption would have implications for Council’s performance against this sustainability indicator.
Figure 2.3: Building & Infrastructure Asset Renewal Indicator, 2015/16 to 2024/25
Source: Council LTFP
50%
55%
60%
65%
70%
75%
80%
85%
2015/16 2016/17 2017/18 2018/19 2019/20
3 year average (Base) 3 year average (FFF)
FFF yearly Benchmark
0%
20%
40%
60%
80%
100%
120%
140%
20
15
/16
20
16
/17
20
17
/18
20
18
/19
20
19
/20
20
20
/21
20
21
/22
20
22
/23
20
23
/24
20
24
/25
Renewal 3 yr avg (Base) Bldg & Infra Renwal yearly (FFF)
Benchmark Renewal 3 yr avg (FFF)
Council achieves the requirement of ‘must meet within 5 years’ in relation to at least 60% own source revenue.

Port Macquarie-Hastings Council - Review of Fit for the Future Strategies Final Report
7
2.4.3 Financial Indicators - Effective Infrastructure and Service Management
2.4.3.1 Infrastructure Backlog Indicator
The infrastructure backlog does not achieve the benchmark by 2019/20, however the
benchmark is achieved by 2024/25. A significant improvement is projected from the base LTFP as a result of the Fit for the Future strategies.
Figure 2.4: Infrastructure Backlog Indicator, 2015/16 to 2024/25
Source: Council LTFP
0%
2%
4%
6%
8%
10%
12%
20
15
/16
20
16
/17
20
17
/18
20
18
/19
20
19
/20
20
20
/21
20
21
/22
20
22
/23
20
23
/24
20
24
/25
Infrastructure Backlog (base) Infrastructure Backlog ( FFF)
Benchmark (Backlog)
Council achieves an overall slight improvement which is consistent with the
requirement to ‘meet or improve within 5 years’ in relation to the 100% benchmark. However, Council should confirm the appropriateness of its assumption that all capital works from 2017/18 are of a renewal nature.
Council achieves a significant improvement which is consistent with the requirement to ‘meet or improve/inform within 5 years’ in relation to the less
than 2% benchmark.

Port Macquarie-Hastings Council - Review of Fit for the Future Strategies Final Report
8
2.4.3.2 Asset Maintenance Ratio
The Asset Maintenance Ratio does not achieve benchmark by 2019/20 but is close to reaching the benchmark through to 2024/25 after the application of the Fit for the Future strategies.
Figure 2.5: Asset Maintenance Indicator, 2015/16 to 2024/25
Source: Council LTFP
2.4.3.3 Debt Service Ratio
Under both the base LTFP and the Fit for the Future strategies LTFP, Council achieves a ratio of which is around the mid-point of the benchmark range.
Figure 2.6: Debt Service Indicator 2015/16 to 2019/20
Source: Council LTFP
60%
70%
80%
90%
100%
110%2
01
5/1
6
20
16
/17
20
17
/18
20
18
/19
20
19
/20
20
20
/21
20
21
/22
20
22
/23
20
23
/24
20
24
/25
Asset Mtnce 3 yr avg (Base) Asset Maintenance ( FFF)
Benchmark (Asset) Asset Mtnce 3 yr avg (FFF)
0%
5%
10%
15%
20%
25%
2015/16 2016/17 2017/18 2018/19 2019/20
3 year average (Base) 3 year average (FFF)
FFF yearly Benchmark
Council achieves the requirement to ‘meet or improve/inform within 5 years’ in relation to the 100% benchmark.
Council achieves the requirement of ‘must meet within 5 years’ in relation to a 0%-20% debt service ratio.

Port Macquarie-Hastings Council - Review of Fit for the Future Strategies Final Report
9
2.4.4 Financial Indicators - Efficiency
2.4.4.1 Real Operating Expenditure per capita
In order to meet the asset maintenance ratio, Council is required to commit additional funds towards maintenance expenditure which has the effect of increasing the level of
operating expenditure per capita. Therefore, this hinders its ability to meet this ratio through the short term. However, over a longer period, it is evident that real operating expenditure per capita shows a declining trend.
Figure 2.7: Real Operating Expenditure per Capita, 2015/16 to 2024/25
Source: Council LTFP
When excluding the effects of the SRV-related maintenance expenditure on the real operating expenditure per capita ratio and including 2013/14 (actuals) and 2014/15 (budget), the declining trend is more evident.
Figure 2.8: Real Operating Expenditure per Capita (excluding SRV-related additional maintenance), 2013/14 to 2024/25
Source: Council LTFP, AEC
1.14
1.15
1.16
1.17
1.18
1.19
1.20
20
15
/16
20
16
/17
20
17
/18
20
18
/19
20
19
/20
20
20
/21
20
21
/22
20
22
/23
20
23
/24
20
24
/25
Base yearly FFF yearly
1.12
1.14
1.16
1.18
1.20
1.22
1.24
1.26
1.28
1.30
1.32
20
13
/14
20
14
/15
20
15
/16
20
16
/17
20
17
/18
20
18
/19
20
19
/20
20
20
/21
20
21
/22
20
22
/23
20
23
/24
20
24
/25
FFF yearly (excl. add'l maint.) FFF yearly
Council is committing to additional investment in asset maintenance
expenditure (to a more ‘normalised’ level of expenditure) which distorts the 2015-16 to 2019/20 trend and the capability to meet the requirement of
‘must demonstrate operational savings (net of IPR supported service improvements) over 5 years’. However, when taking into account a longer
period it is evident that Council is expected to achieve a declining real operating expenditure per capita ratio.
, although projections over a longer period highlight a declining trend from
these.

Port Macquarie-Hastings Council - Review of Fit for the Future Strategies Final Report
10
3. Strategy Analysis
3.1 Historic Improvements
Commencing in the 2008/09 financial year, Council implemented a suite of financial
improvement strategies to enhance its capacity and sustainability. Details on these strategies were provided in support of its submission to IPART for the Section 508(2) Special Variation Application (Section 7: Productivity Improvements Application), and were detailed in the Business Papers for an extra-ordinary Council meeting on 16 May 20122.
A summary of the improvements and strategies creating opportunities for increasing revenue and cost savings and/or productivity or capacity improvements is provided in the
table on the following page.
Offsetting these additional revenues and cost saving initiatives have been a number of cost and service increases above CPI in addition to the running costs of the Glasshouse Convention Centre (based on 2008/09 vs. 2013/14 actuals), including:
Energy price increases – 76% (91% increase to 2012/13 with a net 8% decrease in 2013/14, reflecting the gain from solar efficiencies);
Increasing depreciation from new capital works, including the Glasshouse – 37%;
Increasing interest/borrowing costs – 59%;
Increasing other governments payments – 1077%; and
Additional 35 staff – filling of vacant positions.
2 PMHC Extra-Ordinary Council Business Paper, 16 May 2012 Item 05.01, Financial Sustainability Review.
http://portmacquarie.infocouncil.biz/Open/2012/05/OC_16052012_AGN_EXTRA.PDF

Port Macquarie-Hastings Council - Review of Fit for the Future Strategies Final Report
11
Table 3.1: Historic Strategies Delivering Additional Revenues and Cost Savings ($000’s)
Strategies Description Benefit
REVENUE ADDITIONS
Increasing fee collection for cemetery services
Increasing the level of cost recovery from the cemeteries function. Estimated to equate to an additional $27,000 on average per annum.
$27
Installation of parking overstay meters Council has installed electronic parking overstay detectors to replace the practice of chalk marking tyres. The expected revenue increase has been estimated at 25% or $317,000 annually.
$317
COST SAVINGS
Rationalisation of the workforce in 2008/09
Commencing in 2008/09 Council focussed on major cost reduction strategies, with a major contributor to the anticipated ongoing savings of $3.1 million being a reduction in the workforce of 74 FTE (or 13%).
Some of the reduction realised productivity improvements whereas others resulted in a reduction of service levels. This reduced staff level was maintained until 2012/13 and an additional 35 staff have filled job vacancies since this time. 2013/14 employee costs increased by 6.75% as a result of the additional staff. Employee numbers are not anticipated to increase similarly in future periods.
n/a
Improved leave management practices Reducing leave liability by implementing a range of strategies including limiting backfill for non-essential positions. Council is undertaking a review of its current leave management strategies to identify means to reducing these balances in line
with industry benchmark levels Preliminary conservative estimates believe this should see savings to Council in the vicinity of $100,000 annually. However
additional work is required and may result in additional savings. Savings have been projected in the base LTFP but the strategies have yet to be formally implemented.
$100
Parks volunteer program Council established a volunteer program for assistance in maintaining parks and reserves. n/a
Sale of Timbertown, Wauchope Timbertown was sold in 2010. This facility had been operating at a loss in excess of $600,000 per annum, as well as necessary expenditure on maintenance
and capital investments/renewal activities.
$600
Resignation from managing Bonny Hills and North Haven Caravan Parks
Council resigned as Trust Managers of the Caravan Parks due in part to the costs and resources involved in running these facilities and in part due to recognising that running caravan parks was not core council business.
$190
Fuel tank decommissioning Caltex cards have replaced the depot fuel tanks, reducing annual costs associated with software and compliance. n/a
Fleet review and optimisation A fleet review has been underway to rationalise cost and size of Council’s fleet. Service levels for parks has been improved by replacing five (5) smaller plant items with four (4) larger items resulting in an
overall reduction in time between mowing visits from five (5) weeks to three (3) weeks.
n/a
Solar power generation at the library Solar panels generating approximately 97kW of power have been installed on the Port Macquarie Library’s roof, reducing electricity consumption by approximately 50% or a net savings of $35,000 annually.
$35
Energy efficiency upgrades Council has been active in identifying and implementing opportunities for energy efficiency including to converting to more energy efficient office equipment, increased number of fuel efficient vehicles, replacing pumping equipment for water and sewerage with speed variable pumps and an energy efficient street lighting strategy.
n/a
Printing cost reductions A review of print expenditure was undertaken to achieve cost reductions and generate efficiencies which included a review of Council’s internal printing room and the efficiency of the printer fleet, changes to default printing practices (e.g. default double sided printing) and methods for issuing Council documents, such as electronic issue of business papers, emailing of payslips and electronically sending rates notices.
$120

Port Macquarie-Hastings Council - Review of Fit for the Future Strategies Final Report
12
Strategies Description Benefit
PRODUCTIVITY/SERVICE LEVEL
Upgrade/integration of Council Enterprise Resource Planning Application
Council systems have been under a program of upgrading to later versions to improve productivity, including: o Customer Request Management (community requests); o Centralised Personnel Management (staff functions); o Financial Management Information System (budget and cost management); o Saving of Authority Reports into standard PDF format; and o Moving modules onto browser based interfaces with each upgrade.
n/a
Online fee payments system The installation of the Smart Fees (SF) module has enabled a single point of maintenance, reducing the need to engage external consultants to review the calculation, reduction of duplicated data entry across systems and related reconciliation processes.
n/a
Electronic Housing Code Pilot Project Council is one of the NSW Government Department of Planning’s ‘e-Planning pilot project which covers the end to end processing of complying development under the Housing Code.
Council went live in November 2011 and received its first applications in February 2012.
n/a
Online certificates S149 and s603 automated generation. n/a
Online grant application The implementation of IT software, Smartygrants, has streamlined the grant application process. The community can submit applications online with council staff not required to enter data, are focused on enhancing
reporting to enable better decision making.
n/a
Crematorium administration efficiencies Implementation of integrated software for the service resulting in administrative efficiencies. n/a
Self-service checkout at the library The Port Macquarie Library has installed a Library Radio Frequency Identification System (RFID), allowing clients and the community to self-checkout their borrowing material.
This improvement has allowed the library to meet and provide services for a larger number of clients.
n/a
Shared services investigation A “Shared Service Suitability Guide” was developed with 8 member councils of the Mid-North Coast, with the intent to seek if any potential shared approach were identified. Each council identified were to collect data on a range of services for this review.
n/a
Source: Council
Notes: Values are unavailable for a number of these strategies.

Port Macquarie-Hastings Council - Review of Fit for the Future Strategies Final Report
13
Other reviews and investigations undertaken by Council have included:
Consolidation of corporate budgets for greater control, e.g. legal / conferences / consultants;
Engagement of a food & beverage contractor for the Glasshouse;
Investigate solar options for the Glasshouse;
Investigate solar options for the Main Administration Building;
Investigate the implementation of fortnightly pay cycle;
Investigate the permanent rostering of staff to cover out of ordinary hours work;
Limitation of $200 in sundry budgets from 01/07/12;
Review advertising, hire cars, taxi charges at airport;
Review allocation / purchase of tools process;
Review of Civic events coordination & management;
Review of coloured printing of Council Matters in Port News and other papers;
Review of Communications section functions / capacity / delivery;
Review of Councils laboratory with a view to developing it into a business unit;
Review of Engineering Trade Services ledger restructuring;
Review of Fleet and Plant management;
Review of Flexible Working Hours policy;
Review of Indoor Uniform policy;
Review of Mobile Phone Policy;
Review of Motor Vehicle Policies - to & from vehicle charges, leaseback charges & conditions;
Review of Purchase Card policy and procedure;
Review of Sick Leave Policy;
Review of the Information Technology section, i.e. infrastructure and operating model;
Review of the Mechanical Workshop operations; and
Review of bank fees including the implementation of credit card surcharging.
Council has implemented a number of strategies to help address identified asset renewal and maintenance issues, with a key driver being the SRV application to IPART for relief from the rate capping policy to provide additional funding to address these concerns. IPART allowed the following SRVs to apply:
7.36% temporary increase in 2010/11 and again in 2011/12; and
7.30% permanent increase from 2012/13 and 4.43% temporary increase for the five years from 2012/13 to 2016/17.
These funds were to be committed towards the maintenance of roads and parks and to help address the infrastructure backlog. During the 2012/13 application, IPART (p.14) noted that:
The special variation does provide the council with additional recurrent funding to erase the short-term pressures it faces, but it does not solve the council’s financial sustainability issues. We encourage the council to develop a strategic plan to address the impact of the Glasshouse on its operating expenditure.
In addition to the SRV revenues, Council has advised budget allocations were reprioritised towards renewals and maintenance expenditure of over $2 million during 2012/13 and 2013/14, with another $500k in 2014/15 transferred from parks to footpaths as a one-off.
Council indicated that it would review its position and long term options for ensuring sufficient funds are available for this purpose at the end of the temporary SRV period 2016/17), including a potential further application to IPART for a SRV.

Port Macquarie-Hastings Council - Review of Fit for the Future Strategies Final Report
14
Commencing in 2013, Council commissioned an independent review of the road
construction network and maintenance practices3. To date, this review has identified:
Council has a high level of technical skill;
Road work prioritisation has had a positive impact on general road conditions; and
There is a need to increase investment in proactive road maintenance.
Council has also commissioned a review into the valuation and depreciation treatment of buildings (including the Glasshouse), water and sewerage assets, in addition to a separate assessment of the backlog calculation methodology. Council is committed to asset management with this review being a significant project which has been continuing for over 12 months and utilises 2.5FTE staff.
Council is also 12 months into a very comprehensive Service Summary Review. A review
of all Council services has been undertaken to date and a more comprehensive and focussed review of selected services is anticipated in the near future following a Councillor workshop. While this strategy is in progress, it was begun 12 months ago and should have
a positive impact on financial performance and service levels into the future.
3.2 Proposed FFTF Strategies
The preceding chapter highlighted a number of strategies proposed by Council to enhance financial sustainability in addition to operational performance and efficiency. These are summarised in the table on the following page, as well as consideration of potential risks attached to each strategy.
It is anticipated that the identified loan savings and depreciation reductions will allow the
Water and Sewerage Funds to pay the following dividends to the General Fund:
$0.824 million in 2015/16;
$1.328 million in 2016/17;
$1.884 million in 2017/18;
$1.903 million in 2018/19; and
$1.921 million in 2019/20.
Meanwhile, the additional SRV rates revenue from making the temporary SRV approved by
IPART in 2012 of 4.43% permanent from 2017/18 and the phased implementation of an additional permanent SRV increase over 3 years (10.0% in 2017/18, 10.0% in 2018/19, 6.0% in 2019/20) will help fund additional maintenance and renewals expenditure as per the following table. Only the maintenance expenditure forms part of operating expenditure and therefore the SRVs will substantially improve Council’s operating position.
Table 3.2: Additional SRVs Proposed by Council ($000’s)
Description 2017/18 2018/19 2019/20
Make Temporary 4.43% SRV Permanent $1,948 $2,006 $2,066
Maintenance Expenditure $580 $597 $615 Renewals Expenditure $1,368 $1,409 $1,451 Additional Permanent SRV Request (10%/10%/6%) $4,840 $10,280 $14,041
Maintenance Expenditure $2,500 $2,575 $2,678 Renewals Expenditure $2,340 $7,705 $11,363
Source: Council LTFP
Proposing rating increases within the Fit for the Future process is out of sequence to the standard procedures for a SRV application which will require community support for additional increases. Council is acutely aware of this sequence irregularity and will need to manage community expectation following its Fit for the Future submission. Council will also need to demonstrate that the revenue raised from the current SRV has been appropriately
spent on maintenance and renewals as per its submission and corresponding approval requirements.
3 http://www.pmhc.nsw.gov.au/Lists/News-Listing/2013/November/Roads-Review-supports-Council-processes

Port Macquarie-Hastings Council - Review of Fit for the Future Strategies Final Report
15
The risk for Council is that the proposed permanent SRVs are yet to be considered by the
community and formally assessed by IPART. Should the community or IPART refuse or reduce the extent of the SRV, then this will jeopardise Council’s Fit for the Future strategy and its financial sustainability position.

Port Macquarie-Hastings Council - Review of Fit for the Future Strategies Final Report
16
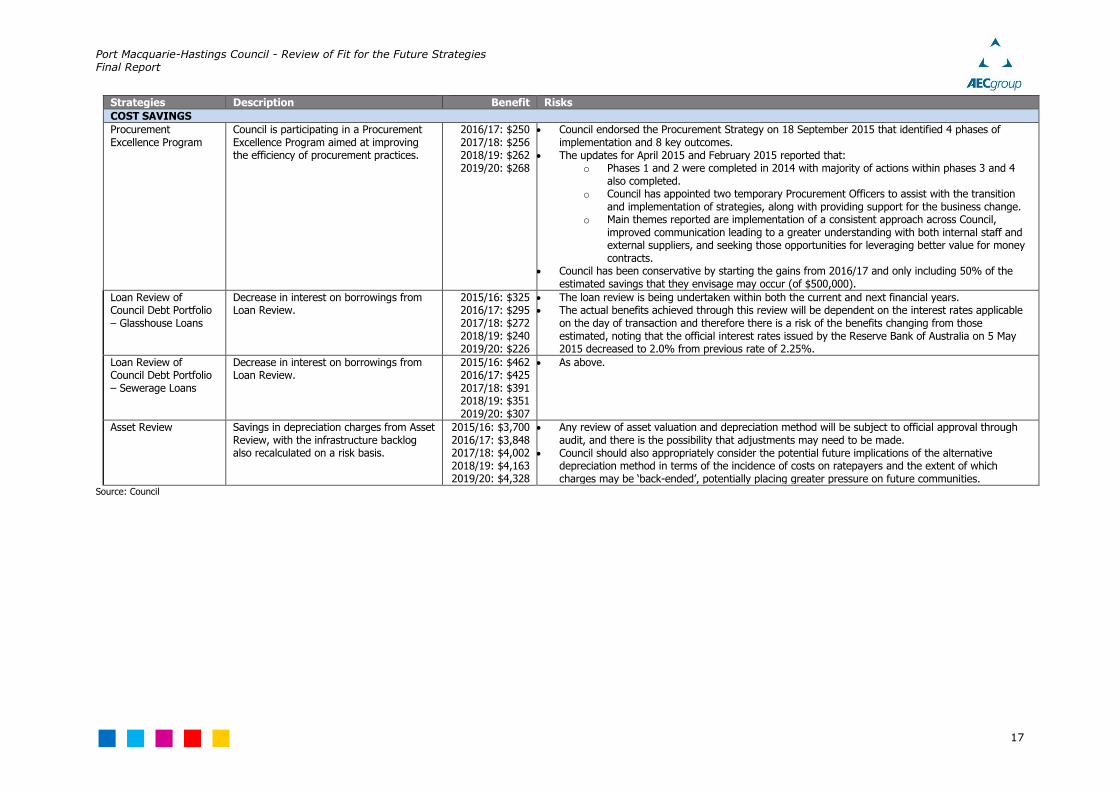
Table 3.3: Proposed Strategies Delivering Additional Revenues and Cost Savings ($000’s)
Strategies Description Benefit Risks
REVENUE ADDITIONS
Crematorium Cost Recovery
Increased fees and charges for crematorium services, estimated at $50,000 on average per annum.
2015/16: $50 2016/17: $50 2017/18: $50 2018/19: $50 2019/20: $50
The ability to increase crematorium fees and charges will be highly dependent on the price elasticity of demand and the availability of alternative facilities and services provided outside of the region or by any potential new entrant.
Parks and Reserves Cost Recovery
Implementation of cost recovery for parks and reserves expenditure, estimated at 50% of 2013/14 expenditure, or approximately $300,000 per annum.
2016/17: $300 2017/18: $307 2018/19: $315 2019/20: $322
The new revenues mainly relate to introduction of fees for use of sporting fields, with some increases to other parks fees for e.g. events and social gatherings. o Currently only one sporting facility is charged. o A user based approach, on a per member, per team or per facility basis, across the sporting field
network will assist in offsetting some of the maintenance expenditure, such as mowing, line marking etc.
Any introduction of new fees and charges or increases to the existing charging contains an element of risk for estimating the revenues for budgeting purposes and also estimating the community reaction to embracing any major change to charging structure. o Council may be required to introduce a graduated approach to these new charges over a 2-3
year period, to allow clubs time to change the membership fee structures.
Income from Property Council has considered a number of land parcels for sale, rezoning and/or development that will generate future revenue streams.
2015/16: $43 2016/17: $335 2017/18: $867
2018/19: $1,393 2019/20: $1,765
The land strategy involves a mix of interest received on funds from the sale of land (property reserve) and generating future revenue streams from developing high profile commercial/office buildings, being funded from land sales and use of working capital loan.
The development expenditure and sale revenues within the Property Reserve are currently contained solely within the reserve and do not flow through to the Income Statement, Capital Works Program and other Financial Statements. The interest revenue is incorporated into the Income Statement and therefore reflected in the Sustainability Ratios.
Obviously, there are numerous risks associated with the development and sale of land, including both supply side risks such as the availability and development of competing land and demand side risks such as a slowdown in growth, both of which will ultimately drive the number of lots sold and the price at which lots are sold.
Council has only included 50% of its anticipated revenues from the land strategy in the LTFP in order to be conservative.
Port Macquarie-Hastings Council - Review of Fit for the Future Strategies Final Report
17
Strategies Description Benefit Risks
COST SAVINGS
Procurement Excellence Program
Council is participating in a Procurement Excellence Program aimed at improving the efficiency of procurement practices.
2016/17: $250 2017/18: $256 2018/19: $262 2019/20: $268
Council endorsed the Procurement Strategy on 18 September 2015 that identified 4 phases of implementation and 8 key outcomes.
The updates for April 2015 and February 2015 reported that: o Phases 1 and 2 were completed in 2014 with majority of actions within phases 3 and 4
also completed. o Council has appointed two temporary Procurement Officers to assist with the transition
and implementation of strategies, along with providing support for the business change. o Main themes reported are implementation of a consistent approach across Council,
improved communication leading to a greater understanding with both internal staff and external suppliers, and seeking those opportunities for leveraging better value for money contracts.
Council has been conservative by starting the gains from 2016/17 and only including 50% of the estimated savings that they envisage may occur (of $500,000).
Loan Review of Council Debt Portfolio – Glasshouse Loans
Decrease in interest on borrowings from Loan Review.
2015/16: $325 2016/17: $295 2017/18: $272 2018/19: $240 2019/20: $226
The loan review is being undertaken within both the current and next financial years. The actual benefits achieved through this review will be dependent on the interest rates applicable
on the day of transaction and therefore there is a risk of the benefits changing from those estimated, noting that the official interest rates issued by the Reserve Bank of Australia on 5 May 2015 decreased to 2.0% from previous rate of 2.25%.
Loan Review of Council Debt Portfolio – Sewerage Loans
Decrease in interest on borrowings from Loan Review.
2015/16: $462 2016/17: $425 2017/18: $391 2018/19: $351 2019/20: $307
As above.
Asset Review Savings in depreciation charges from Asset Review, with the infrastructure backlog also recalculated on a risk basis.
2015/16: $3,700 2016/17: $3,848 2017/18: $4,002 2018/19: $4,163 2019/20: $4,328
Any review of asset valuation and depreciation method will be subject to official approval through audit, and there is the possibility that adjustments may need to be made.
Council should also appropriately consider the potential future implications of the alternative depreciation method in terms of the incidence of costs on ratepayers and the extent of which charges may be ‘back-ended’, potentially placing greater pressure on future communities.
Source: Council

Port Macquarie-Hastings Council - Review of Fit for the Future Strategies Final Report
18
3.3 Other Considerations/Risks
3.3.1 Grants and Contributions
There is a risk that the assumed 3% inflationary parameter applied to grants and contributions will not occur, particularly given the present freeze implemented by the Federal Government in 2014 on FAG payments. It may be more conservative for Council to adopt a lower increase over the forecast period, unless it can be shown that higher payments will in fact be made.
3.3.2 Waste Management Charge
In the LTFP, Council has applied the rate peg of 2.4% to waste management charges over the entire forecast period which is deemed to be appropriate. Given the cost base of the waste management business includes a waste collection contract subject to rise and fall which may considerably impact the cost of collection and disposal service provision. The environmental levy charged by the State Government is currently now at its maximum
level and unless changed, the costs are incorporated into the current base charging structure and should not be subject to significant change.
Given the rate peg is not mandated on the waste management charge, any variations in the cost base should flow through to higher charges to ensure cost recovery is appropriately achieved and Council’s operating position is not negatively impacted, whilst keeping within the NSW Local Government Act 1993 that requires income generated from the domestic waste management charges do not exceed reasonable cost of providing those services.
From our experiences, one area of risk for Council waste management functions relates to
whether future landfill rehabilitation liabilities have been appropriately identified and funded. Council has indicated that liability is closely monitored and that an external review has been undertaken with those recommendations currently in place. It was also noted that the external auditors review this future liability.
3.3.3 Depreciation Charge
Separate from the proposed reduction in depreciation charges resulting from the Asset Review, depreciation charges have been increasing at a rate greater than that projected in
the LTFP moving forward. It is acknowledged that recent asset additions may have influenced these outcomes, it would be more appropriate to project depreciation within the LTFP based on new asset additions and a cost indexation factor rather than an indexation factor that allows for growth in the asset base in addition to cost indexation.
3.3.4 Loss on Disposal
The LTFP includes anticipated losses on assets disposals of $1.5 million in 2015/16 General Fund, with a 3% yearly inflation applied across the forecast period. This asset disposal loss
was identified as a Key Observation and Risk within the TCorp Financial Assessment as a result of write-off of infrastructure assets when they are rehabilitated.
In particular, the losses on disposal of road assets relate to when they are replaced with new paving or realigned. This would indicate that Council’s depreciation calculation may
not be completely aligned with asset life. It may be more accurate to expense the cost of the roads as a depreciation charge throughout the life of the assets rather than as losses
on the disposal of assets at the end of their useful life.
The Loss on Disposal is not included within the ratio calculations, however if the depreciation was realigned to account for some or all of this loss on disposal, then it would be included within operating expenditure and impact the sustainability indictors.
As Council improves its Asset Management Planning and co-ordination with its 10 year financial forecasts, this issue may be addressed. In fact, Council expects one of outcomes from the current review undertaken by JRA that useful lives may be closer aligned, with
values assigned to the differing elements of asset components and therefore potentially reduce the loss on disposal.

Port Macquarie-Hastings Council - Review of Fit for the Future Strategies Final Report
19
3.3.5 Weather Effects
Ongoing weather/rainfall events may continue to impact on road infrastructure.
3.3.6 Borrowings
The LTFP shows that there is no new borrowings over the forecast period, which may
become a funding restriction over time. Council has indicated that it prudently elects to borrow only when required for specific projects with the LTFP continually evolving and any capital funding restrictions will be reviewed in future.
3.3.7 Future Capital Works
All new capital expenditure increases depreciation, maintenance and operating costs and therefore all works projects need to be carefully considered, even when capital grants and subsidies are made available.
Council has progressed Project Planning with inclusion of ‘whole of life’ costing in the
preparation of project plans.
3.4 Potential Additional Strategies
As part of the review of Council’s Fit for the Future strategies, AEC was requested to identify
any potential additional strategies that could enhance Council’s financial capacity and sustainability moving forward. What was evident during this stage of the review was that Council has undertaken a wide range of investigations and strategies into its operational efficiency in recent years and the scope for additional investigations and strategies is quite limited.
This is particularly the case given that Council is also 12 months into a very comprehensive
Service Review. A review of all Council services has been undertaken to date and a more comprehensive and focussed review of selected services is anticipated in the near future following a Councillor workshop. Any savings generated and/or potential efficiencies from potential service delivery changes resulting from the service review, would enhance the
financial outcomes evaluated in the preceding chapter.
In light of this comprehensive Service Review, any proposed suggestions for changing service delivery such as a reduction in service levels or outsourcing functions within Council
is premature.
The following table provides a summary of areas that would normally be considered as appropriate areas for review within the General Fund. It should be noted that some of these strategies are not necessary ‘additional’ strategies for consideration but are actually being actioned within the current Service Review.
Table 3.4: Potential Additional Strategies for Consideration (or presently being considered)
Potential Area of Improvement
Strategies
Plant and Fleet Council indicated that it has undertaken a plant review, although the scope of that review was unclear.
A comprehensive plant and fleet review should include an evaluation of the method of financing (lease vs. own), which roles require a vehicle, optimisation of plant to meet base demands with peak demands being met by external hire (if cost effective), review of workshop operations, etc.
This ‘additional’ strategy is being addressed as part of the current Service Review. Libraries No major service reviews appear to have been undertaken to date.
Potential for efficiency gains and cost savings. This ‘additional’ strategy is being addressed as part of the current Service Review.
Pools Pools are externally managed under contract, a result of a prior review indicating that external management was the best strategy.
No additional strategy is likely to significantly improve the financial position. Airport Operating as a commercial business unit of Council and is self-funded by its revenues
While passenger-related revenue increases can be limited due to contractual obligations with airlines, other revenue streams should be maximised where possible.
It is acknowledged that a Master Plan exists for the airport. In recent years, an external audit undertook a review into airport revenue streams with
those outcomes investigated further and/or implemented.

Port Macquarie-Hastings Council - Review of Fit for the Future Strategies Final Report
20
Potential Area of Improvement
Strategies
In recent times there has been substantial investment of $21 million for airside infrastructure, notably the runway, taxiway and apron.
Glasshouse The Glasshouse Port Macquarie Strategic Business Plan sets out the direction and identifies the need to improve the financial viability through maximising partnerships, marketing strategies and rationalise costs.
This is reflected in the Council Meeting Business Papers for 15 April 2015, Item 09.05: Glasshouse Quarterly Report and Update on Strategic Plan Recommendations, where it states, “…continued focus on revenue growth and ongoing review of operational costs”, in response to $260,000 reduction in the operating deficit for the financial year to date.
Council’s strategy and service review should account for any potential outsourcing opportunities.
Ferries The ferries service is outsourced, a result of a prior review indicating that external management was the best strategy.
No additional strategy is likely to significantly improve the financial position. Works Council’s strategy and service review should account for any potential outsourcing
opportunities. Parks and Gardens There is potential to change the mowing contracts and other parks and gardens works
into an outsourced delivery model should it be deemed to be more cost effective. Council’s strategy and service review should account for any potential outsourcing
opportunities. This ‘additional’ strategy is being addressed as part of the current Service Review.
Management, Administration and Corporate Support
It is noted that the overheads levied on Council functions/businesses as a percentage of operating costs (excluding depreciation and interest) over the 5 year forecast period appear relatively high when compared to industry benchmarks at:
o 13% for the waste function vs. industry benchmark of 5%-8%; o 21% for the water function vs. industry benchmark of 10%-14%; o 20% for the sewerage function vs. industry benchmark of 10%-14%; and o 14% for the Glasshouse.
Council’s strategy and service review should account for any potential organisational resourcing, efficiency and/or outsourcing opportunities of internal support services.
For example, the transactional type back office operations such as accounts payable, accounts receivable and payroll have the potential to be outsourced or provided via shared service arrangements with other Councils.
Source: AEC, Council
Notes: Benchmark overheads exclude costs of governance that would not be incurred by a business in a commercial environment.
For the Waste Management Fund, potential benefits could be achieved through site operations review (including service levels/opening times and days), a review of the appropriateness of charges and the financial implications of the applicable waste strategy.
For the Water and Sewerage Funds, potential benefits could be achieved through an operational review, the application of business cases for all significant capital works, and a review of the appropriateness of charges.

Port Macquarie-Hastings Council - Review of Fit for the Future Strategies Final Report
21
4. Results of Peer Review
4.1 Financial Performance
Council’s historic financial performance has shown recurring operating deficits, with deficits
forecast to continue without additional revenue and cost strategies particularly following the removal of the temporary SRV from 2017/18.
Council has demonstrated that it has undertaken a large number of reviews and implemented numerous strategies to improve its financial position to date, with the additional Fit for the Future strategies expected to materialise additional cost savings and operational/service delivery efficiencies.
However, it is clear that without additional rates and charges revenue that it cannot meet the established Fit for the Future financial indicator targets. Therefore, an additional SRV is proposed as part of the Fit for the Future strategies to ensure that Council is able to meet the IPART requirements.
Even with the proposed SRV, Council will need to remain diligent to ensure that its projected cost base is not exceeded in order to meet or progress towards desired financial sustainability indicator benchmarks.
If all proposed Fit for the Future sustainability strategies are implemented by Council, supported by the community and approved by the relevant regulatory bodies, then it is evident that Council’s financial capacity and sustainability will be greatly improved.
4.2 Meeting the Fit for the Future Requirements
This review has been undertaken to provide a reasonableness test of the financial modelling underlying Council’s Fit for the Future strategies and submission.
Generally, Council’s proposed Fit for the Future strategies for long-term sustainability cover the key areas of:
Increased income (outside of SRVs);
Ensuring business units achieve reasonable cost recovery and provide a dividend to the General Fund;
Optimisation of financing costs;
Efficiencies within the cost base; and
An assessment of assets and depreciation charges.
The balancing item is then set to be the required SRVs that need to be applied for, with community support.
All of the identified strategies appear valid.
The Asset Maintenance Ratio and the Building and Infrastructure Backlog indicator whilst do not achieve the benchmark by 2019/20 show that significant improvements are made with the inclusion of the FFTF strategies over the longer forecast period beyond 2019/20,
with considerable Council investment on an asset methodology review. Council is also a member of the Mid North Coast Region of Councils (MIDROC) reviewing asset methodologies to ensure consistency across the member group.
The Building and Infrastructure Renewals Ratio remains a concern for Council to address
in the Fit for the Future submission averaging around 80% over the forecast period. Whilst there is a significant improvement with the FFTF strategies, further funds will be required in order for Council to reach the benchmark.
The sharp increase in improving the maintenance ratio directly impacts the Efficiency Ratio with it showing a corresponding increase in the short term before entering a declining trend over the longer term. The higher point shown for the Efficiency Ratio, after this short term increase, is more reflective of a ‘normalised’ cost base after the FFTF strategies are applied.
Council will need to show that it has appropriately considered other strategies that may have helped to improve its financial position and why these strategies were not deemed to

Port Macquarie-Hastings Council - Review of Fit for the Future Strategies Final Report
22
be appropriate (or have already been covered in prior reviews and initiatives). It is
acknowledged that Council has undertaken a wide range of investigations and strategies into its operational efficiency in recent years and the scope for additional investigations and strategies is quite limited. This is particularly the case given that Council is also 12
months into a very comprehensive Service Review. Any savings or efficiencies that may be achieved as a result of this Service Review would be above and beyond those included in the Fit for the Future submission given that they are not identifiable and quantifiable at this stage.

Port Macquarie-Hastings Council - Review of Fit for the Future Strategies Final Report
23
References
Forecast.ID.com.au. Port Macquarie-Hastings Council area. http://forecast.id.com.au/port-macquarie-hastings/Population-households-dwellings
Profile.ID.com.au. Port Macquarie-Hastings Council area. http://profile.id.com.au/port-macquarie-hastings/population-estimate
Australian Bureau of Statistics
Port Macquarie-Hastings Council. Annual Financial Statement 2009/10 through 2013/14
Port Macquarie-Hastings Council. Resourcing Strategy 2013 – 2017
Port Macquarie-Hastings Council. One Year Operational Plan 2014 - 2015
Port Macquarie-Hastings Council. Fees and Charges 2014 – 2015
Port Macquarie-Hastings Council. Revenue Policy 2014 – 2015
Port Macquarie-Hastings Council. Quarterly reports September 2014, December 2014, March 2015
Port Macquarie-Hastings Council. Contracts Register December 2014
Port Macquarie-Hastings Council. Glasshouse Strategic Business Plan 2014 - 2017
Port Macquarie-Hastings Council. Community Strategic Plan, Towards 2030
Port Macquarie-Hastings Council. IPART Section 508(2) Special Variation Application Form – Part B 2012/13
Port Macquarie-Hastings Council. Extra-Ordinary Council Business Paper 16 May 2012, Item 05.01
Financial Sustainability Review.
Coffs Harbour City Council. Annual Financial Statement 2013/14
Gloucester Shire Council. Annual Financial Statement 2013/14
Greater Taree City Council. Annual Financial Statement 2013/14
Great Lakes Council. Annual Financial Statement 2013/14
Kempsey Shire Council. Annual Financial Statement 2013/14
Lake Macquarie City Council. Annual Financial Statement 2013/14
Newcastle City Council. Annual Financial Statement 2013/14
Shoalhaven City Council. Annual Financial Statement 2013/14
Tweed Shire Council. Annual Financial Statement 2013/14
Wollongong City Council. Annual Financial Statement 2013/14
TCorp (2012-2013). Financial Assessment Reports: Individual Councils reports for Port Macquarie-Hastings, Greater Taree, Great Lakes, Kempsey, Gloucester, Coffs Harbour, Lake Macquarie, Newcastle, Shoalhaven, Tweed, and Wollongong
TCorp (2013). Financial Sustainability of the New South Wales Local Government Sector: Findings,
Recommendations and Analysis
NSW Independent Local Government Review Panel (2013). Revitalising Local Government
NSW Local Government Act 1993
NSW Office of Local Government (2012). Circular 12-23 TCorp Assessment of Financial Sustainability
NSW Office of Local Government (2014). Fit for the Future Guidance Material, Completing Template 2 (Council Improvement Proposal)
NSW Government (2015). Terms of Reference for a review of local council Fit for the Future proposals by an Expert Advisory Panel, Premier of New South Wales letter to Chairman IPART.
IPART (2010). Local Government – Information Paper, Local Government Cost Index

Port Macquarie-Hastings Council - Review of Fit for the Future Strategies Final Report
24
IPART (2012). Port Macquarie-Hastings Council’s Application for a Special Variation 2012/13 (Local
Government - Determination)
IPART (2014). Fact Sheet - Rate Peg for NSW councils for 2015/16
IPART (2015). Methodology for Assessment of Council Fit for the Future Proposals (Local
Government – Consultation Paper)

Port Macquarie-Hastings Council - Review of Fit for the Future Strategies Final Report
25
Glossary
ABS Australian Bureau of Statistics
CPI Consumer Price Index
Council Port Macquarie-Hastings Council
ILGRP Independent Local Government Review Panel
LGCI Local Government Cost Index
LTFP Long Term Financial Plan
OLG NSW Government: Office of Local Government
TCorp NSW Treasury Corporation

Port Macquarie-Hastings Council - Review of Fit for the Future Strategies Final Report
26
Appendix A – Financials
Long Term Financial Plan
The following table supports the figures over the longer forecast period used in the body of this report.
Table A.1: Financial Indicators (FFTF)
Indicator Benchmark 2015/16 2016/17 2017/18 2018/19 2019/20 2020/21 2021/22 2022/23 2023/24 2024/25
Sustainability Financial Indicators
Figure 2.1
Operating Performance – FFTF >= breakeven (avg over 3yrs)
(6.4)% (7.6)% (3.8)% (1.6)% 2.0% 4.1% 4.6% 4.1% 3.2% 2.1%
Ratio (annual) – FFTF (3.6)% (5.7)% (1.9)% 2.9% 5.1% 4.4% 4.3% 3.5% 1.8% 0.9%
Operating Performance – Base
(avg over 3yrs) (7.1)% (9.7)% (8.9)% (10.9)% (12.0)% (12.7)% (13.2)% (13.5)% (14.1)% (15.1)%
Figure 2.2
Own Source Operating Revenue – FFTF
>60% (avg over 3yrs)
66.66% 69.05% 73.39% 78.50% 79.67% 80.36% 80.72% 80.83% 80.97% 81.06%
Ratio (annual) - FFTF 64.43% 77.09% 78.63% 79.79% 80.61% 80.68% 80.86% 80.96% 81.09% 81.15% Own Source Operating Revenue – Base
(avg over 3yrs) 66.65% 69.00% 72.76% 76.96% 77.06% 77.21% 77.38% 77.53% 77.70% 77.82%
Figure 2.3
Building and Infrastructure Asset Renewal Ratio – FFTF
>100% (avg over 3yrs)
74.58% 75.58% 80.16% 63.92% 79.82% 88.14% 90.43% 85.24% 82.34% 80.95%
Ratio (annual) – FFTF 128.08% 47.80% 64.59% 79.37% 95.50% 89.55% 86.24% 79.92% 80.85% 82.09% Building and Infrastructure Asset Renewal Ratio – Base
(avg over 3yrs)
73.22% 73.71% 73.01% 46.39% 47.07% 45.30% 44.30% 40.24% 38.47% 38.27%

Port Macquarie-Hastings Council - Review of Fit for the Future Strategies Final Report
27
Indicator Benchmark 2015/16 2016/17 2017/18 2018/19 2019/20 2020/21 2021/22 2022/23 2023/24 2024/25
Effective Infrastructure and Service Management Financial Indicators
Figure 2.4
Infrastructure Backlog – FFTF <2%
(annual chg) 9.01% 9.04% 8.82% 8.14% 7.15% 6.14% 5.11% 4.06% 3.00% 1.91%
Infrastructure Backlog – Base (annual chg) 9.01% 9.04% 9.13% 9.24% 9.34% 9.47% 9.60% 9.76% 9.93% 10.10%
Figure 2.5
Asset Maintenance Ratio – FFTF >100%
(avg over 3yrs) 67.23% 81.94% 86.69% 91.47% 96.32% 96.55% 96.92% 97.45% 98.15% 99.05%
Ratio (annual) - FFTF 81.94% 81.94% 96.19% 96.28% 96.50% 96.87% 97.40% 98.09% 98.97% 100.07% Asset Maintenance Ratio - Base (avg over 3yrs) 67.23% 81.94% 81.94% 81.94% 81.94% 81.94% 81.94% 81.94% 81.94% 81.94%
Figure 2.6
Debt Service Ratio – FFTF 0-20%
(avg over 3yrs) 9.67% 10.29% 10.02% 9.37% 8.49% 7.87% 7.52% 7.28% 6.42% 5.45%
Ratio (annual) 10.30% 10.42% 9.34% 8.34% 7.80% 7.48% 7.28% 7.09% 4.91% 4.34% Debt Service Ratio - Base (avg over 3yrs) 9.72% 10.41% 10.46% 10.16% 9.63% 9.09% 8.71% 8.43% 7.41% 6.25%
Efficiency Financial Indicators
Figure 2.7
Decrease in Real Operating Expenditure per capita over time – FFTF
Declining trend (annual chg)
1.1634 1.1807 1.1953 1.1942 1.1964 1.1937 1.1818 1.1787 1.1855 1.1842
Decrease in Real Operating Expenditure per capita over time - Base
Declining trend (annual chg)
1.1698 1.1896 1.1680 1.1666 1.1685 1.1653 1.1524 1.1482 1.1535 1.1502
Source: Council LTFP Notes: The values where the Benchmark requires annual change reflects the yearly change, whereas the other indicator values reflect the 3 year averaged values, that is, they are not annual yearly change. Green reflects
outcomes that meet the relevant benchmark. Red reflects outcomes not meeting the relevant benchmark.

Port Macquarie-Hastings Council - Review of Fit for the Future Strategies Final Report
28
PAGE LEFT INTENTIONALLY BLANK

E [email protected] W www.aecgroupltd.com ABN 84 087 828 902
Economics, Planning & Development
Business Strategy & Finance
Community Research & Strategy
Design, Marketing & Advertising
Information & Knowledge Management