review of available information sources and …
TRANSCRIPT

REVIEW OF AVAILABLE INFORMATION SOURCESAND INDICATORS ON GOVERNANCE
Esta obra forma parte del acervo de la Biblioteca Jurídica Virtual del Instituto de Investigaciones Jurídicas de la UNAM www.juridicas.unam.mx https://biblio.juridicas.unam.mx/bjv
DR © 2017. Instituto Nacional de Estadística y Geografía http://www.inegi.org.mx/
Libro completo en: https://goo.gl/i3pCU4

49Documentos de análisis y estadísticas / Gobierno Statistical Analysis Reports / Government
REVIEW OF AVAILABLE INFORMATION SOURCES AND INDICATORS ON GOVERNANCE
In order to measure or quantify governance, National Statistical Offices (NSO) and International Organizations have established several data collection efforts and methodologies. Notwithstanding, due to a lack of definition, many of them differ substantially in content, data coverage, type of sources, and quality. Initiatives also diverge in terms of their conceptualization, aggregation and weighting. Thus, each one has its own methodology. Figure 2 presents which are the main sources used for measuring Governance.
In the case of NSO’s, three cases will be mentioned. In the UK, the Office for National Statistics (ONS) presents Governance indicators related to elections and trust in Government. Additionally, the ONS has data on Government research and development, public sector personnel, public service productivity, aid and development, and Defense.
The Australian Bureau of Statistics (ABS) measures progress in governance by asking Australians what are the most relevant aspects for achieving good governance. From this consultation, five main themes were identified: governmental trust, effectiveness, participation, informed debate and rights and responsibilities. Each of these themes have their own sub-dimensions.
Lastly, the National Institute of Statistics and Geography of Mexico (INEGI), through Government Censuses, collects data on Government, Public Safety, and Justice. These data include material and human resources, regulatory frameworks, policies and processes. INEGI also surveys people to assess perceptions on the quality of public services, confidence in public sector and perceptions on Public Security and Justice, as well as perceptions and actual experiences on corruption. Both censuses and surveys provide data according to the level of government: national, state and local.
UKOFFICE FORNATIONALSTATISTICS
AUSBUREAU OFSTATISTIC
MEXSTATISTICALINSTITUTE
INEG
I. G
ober
nanz
a: u
na re
visi
ón c
once
ptua
l y m
etod
ológ
ica.
Doc
umen
tos
de a
nális
is y
est
adís
tica.
201
7.
INEG
I. G
over
nanc
e: a
con
cept
ual a
nd m
etho
dolo
gica
l rev
iew
. Sta
tistic
al A
naly
sis
Rep
orts
. 201
7.
Esta obra forma parte del acervo de la Biblioteca Jurídica Virtual del Instituto de Investigaciones Jurídicas de la UNAM www.juridicas.unam.mx https://biblio.juridicas.unam.mx/bjv
DR © 2017. Instituto Nacional de Estadística y Geografía http://www.inegi.org.mx/
Libro completo en: https://goo.gl/i3pCU4
50 Documentos de análisis y estadísticas / Gobierno Statistical Analysis Reports / Government
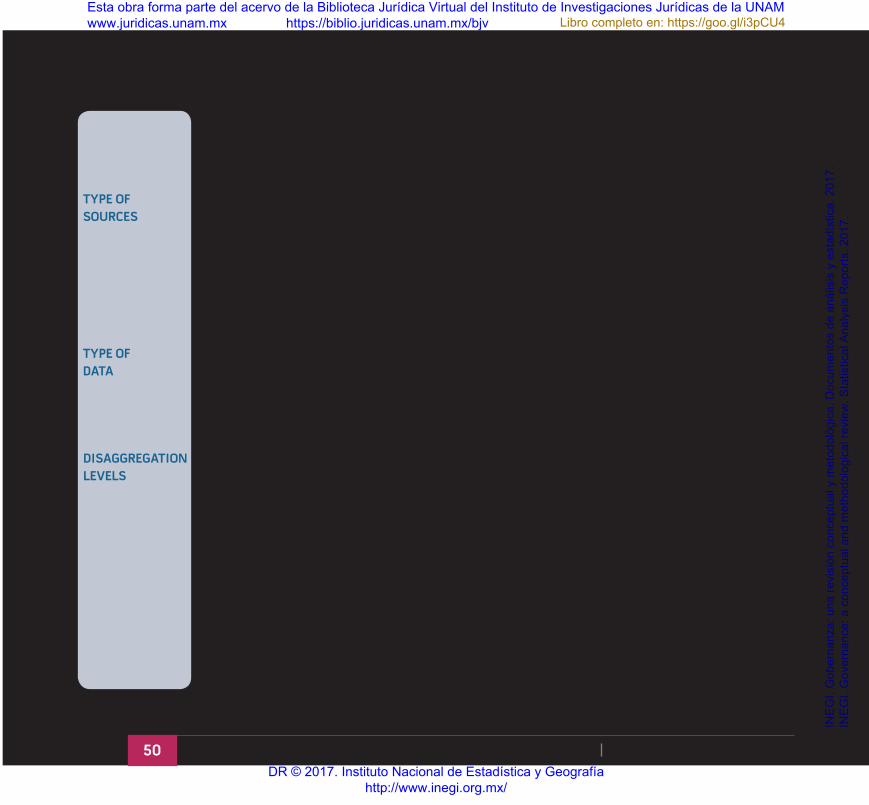
Regarding the type of sources, they can be categorized in one of three ways:
• Population based surveys – these are focused on a representative sample of the general population.These sources aim to show the perceptions of people about a certain phenomenon.
• Expert based questionnaires (surveys) – in these types of surveys, researchers and experts in thefield are asked to answer a questionnaire on a particular issue or to try to approach the situation ofa country. Experts are expected to give answers based on knowledge and evidence.
• Administrative records – includes data obtained directly from government agencies or institutionsresponsible for governmental functions.
In terms of the type of data used by these exercises, three classifications can be identified. OECD (2013) divides the data into: inputs, processes, products and results. Fukuyama (2013) proposes that governance data should be associated with measures of procedures, inputs, outputs and bureaucratic autonomy. Finally, Levi-Faur (2012) argues that governance consists of four elements: structure, processes, mechanisms and strategies.
As a final point, it is important to note that the vast majority of governance measurements only presents indicators at national level. This means that disaggregation at other levels, for example by region, function, or subnational levels of government is still in an exploratory phase. In addition, several of these measurements cannot necessarily be extrapolated to other regimes or political contexts, so their replicability is limited.
TYPE OFDATA
TYPE OFSOURCES
DISAGGREGATIONLEVELS
INEG
I. G
ober
nanz
a: u
na re
visi
ón c
once
ptua
l y m
etod
ológ
ica.
Doc
umen
tos
de a
nális
is y
est
adís
tica.
201
7.
INEG
I. G
over
nanc
e: a
con
cept
ual a
nd m
etho
dolo
gica
l rev
iew
. Sta
tistic
al A
naly
sis
Rep
orts
. 201
7.
Esta obra forma parte del acervo de la Biblioteca Jurídica Virtual del Instituto de Investigaciones Jurídicas de la UNAM www.juridicas.unam.mx https://biblio.juridicas.unam.mx/bjv
DR © 2017. Instituto Nacional de Estadística y Geografía http://www.inegi.org.mx/
Libro completo en: https://goo.gl/i3pCU4

51Documentos de análisis y estadísticas / Gobierno Statistical Analysis Reports / Government
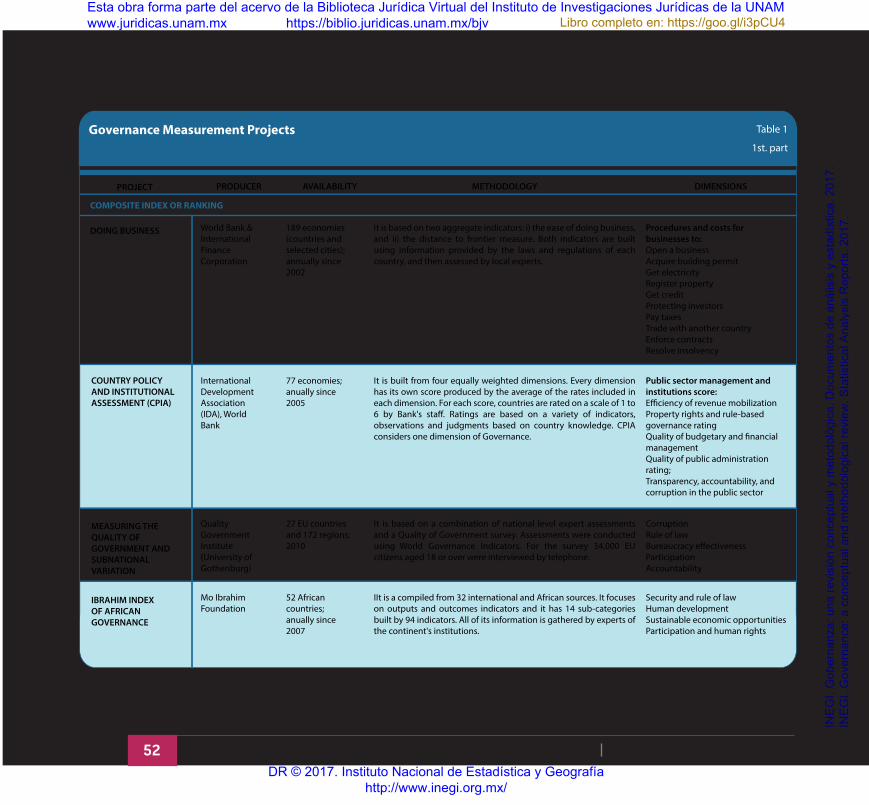
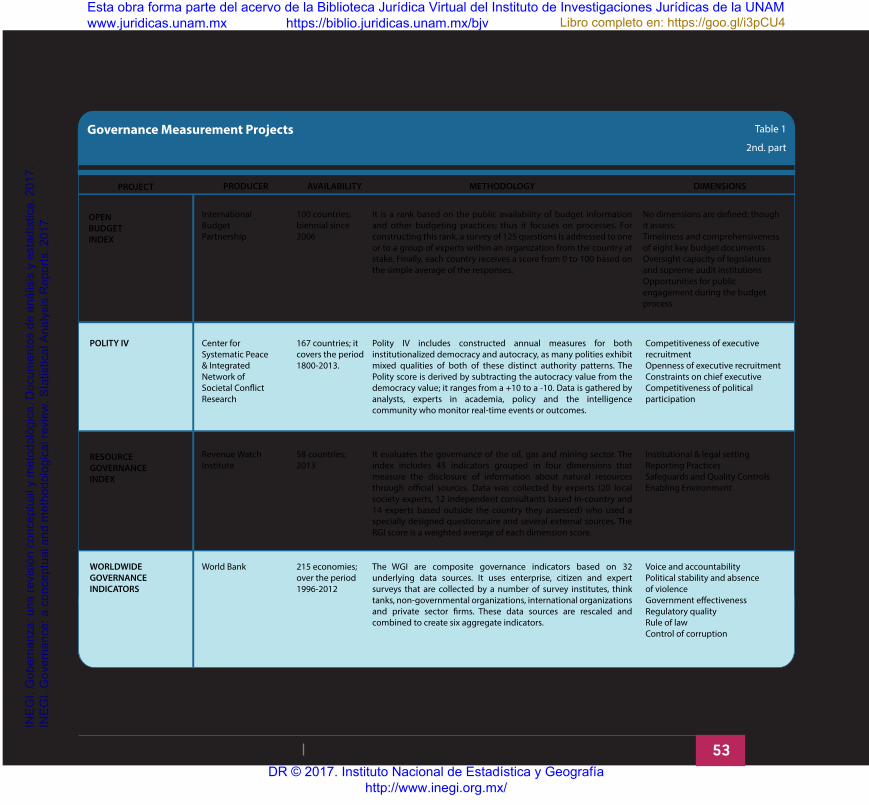
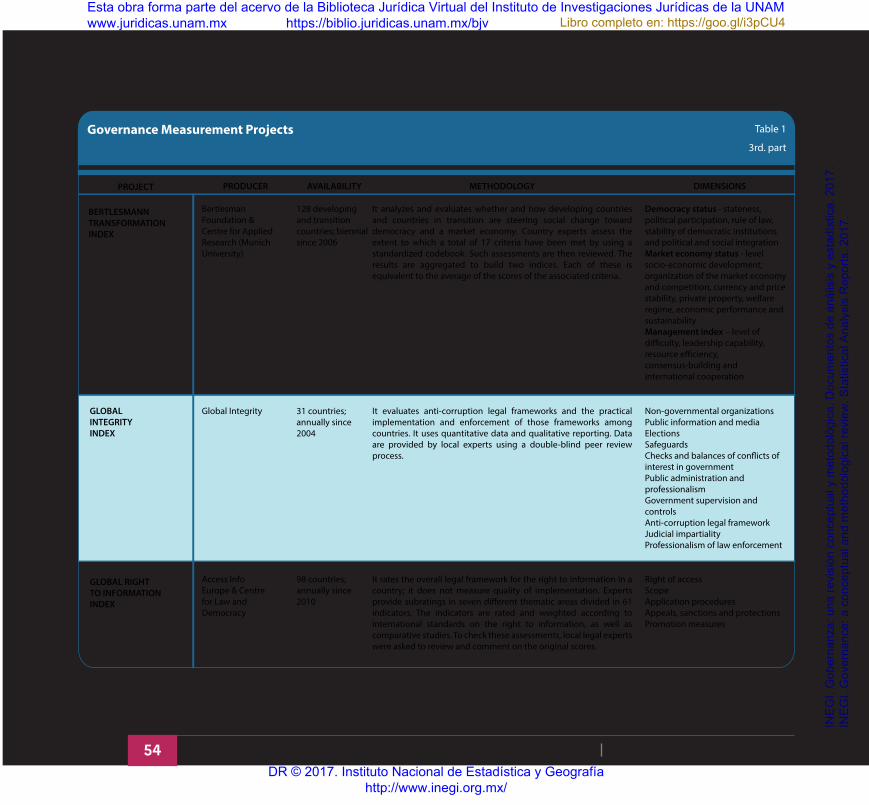
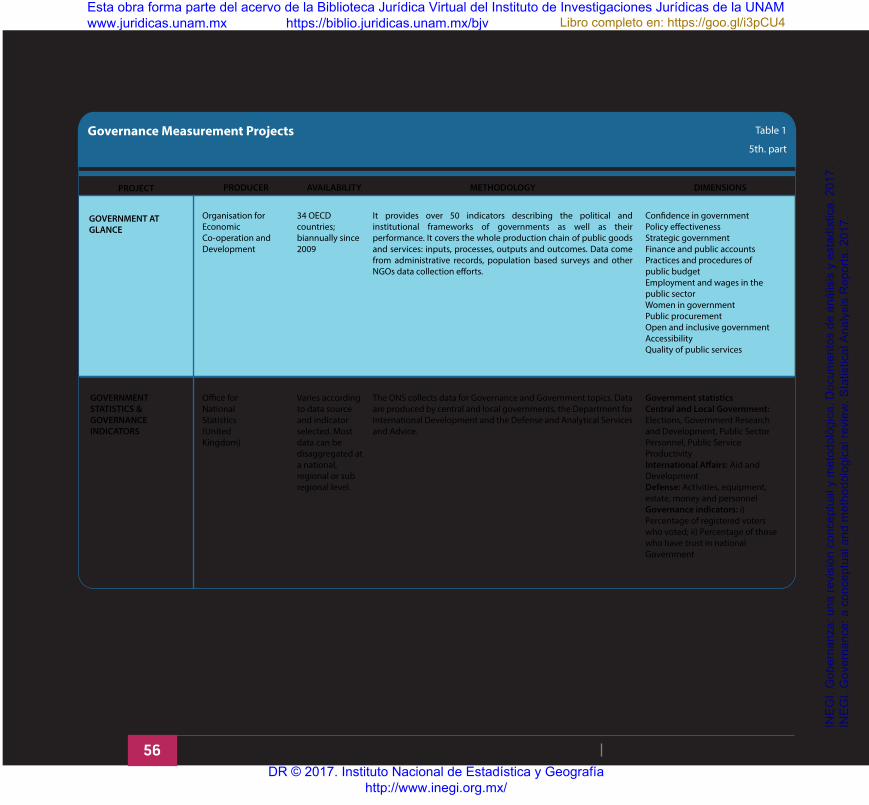
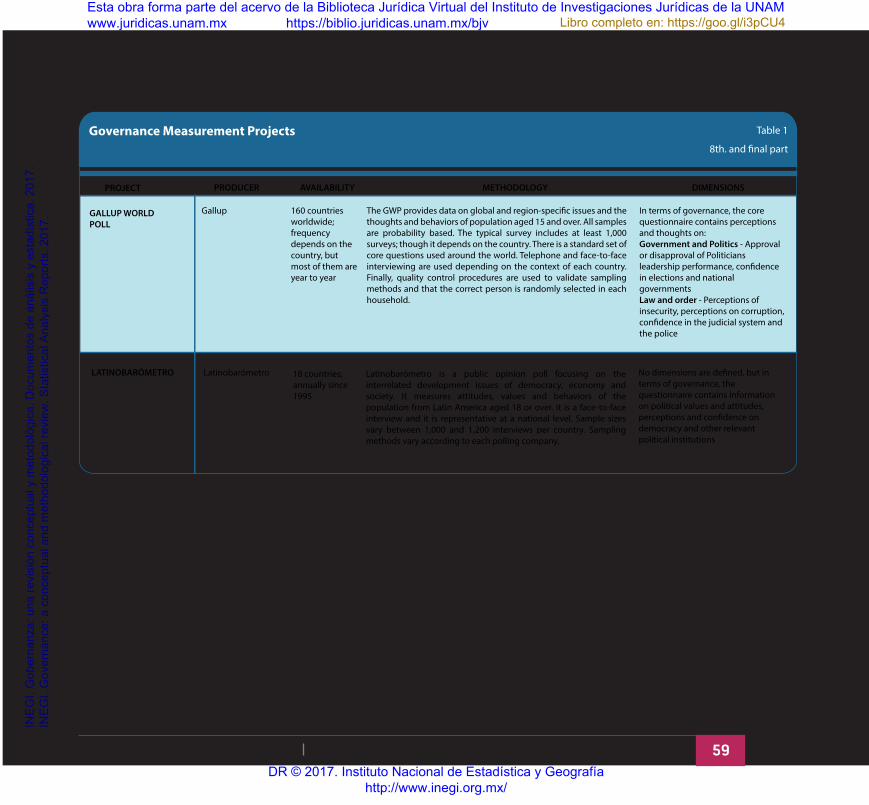
Figure 2 and Table 1 summarize some of the main sources used for measuring governance or aspects related to it. Table 1 is sorted by type of project and it presents the producer, availability, methodology used, as well as the dimensions included in each one.
Figure 2Main Sources on Governance Information
Source: own elaboration based on the sources of information used by the Governance Projects presented in Table 1.
Country Policy and Institutional
Assessments
Bertelsmann Transformation
Index
Freedom House
Economic Freedom Index
Worldwide Governance
Indicators Global Competitiveness
Report
Economist Intelligence
Unit
Gallup World Poll
IDEA
Latinobarómetro
Press Freedom
IndexWorld
Development Indicators
Global Integrity
Index
Institutional Pro�les
Database
PEFA Performance
Measurement
Political Risk Services
InternationalSatistical Capacity
IndexWorld Justice Project - Rule
of Law
Doing Business
INEG
I. G
ober
nanz
a: u
na re
visi
ón c
once
ptua
l y m
etod
ológ
ica.
Doc
umen
tos
de a
nális
is y
est
adís
tica.
201
7.
INEG
I. G
over
nanc
e: a
con
cept
ual a
nd m
etho
dolo
gica
l rev
iew
. Sta
tistic
al A
naly
sis
Rep
orts
. 201
7.
Esta obra forma parte del acervo de la Biblioteca Jurídica Virtual del Instituto de Investigaciones Jurídicas de la UNAM www.juridicas.unam.mx https://biblio.juridicas.unam.mx/bjv
DR © 2017. Instituto Nacional de Estadística y Geografía http://www.inegi.org.mx/
Libro completo en: https://goo.gl/i3pCU4
52 Documentos de análisis y estadísticas / Gobierno Statistical Analysis Reports / Government
PROJECT PRODUCER
Governance Measurement Projects Table 1
AVAILABILITY METHODOLOGY DIMENSIONS
DOING BUSINESS World Bank & International Finance Corporation
189 economies (countries and selected cities); annually since 2002
It is based on two aggregate indicators: i) the ease of doing business, and ii) the distance to frontier measure. Both indicators are built using information provided by the laws and regulations of each country, and then assessed by local experts.
Procedures and costs for businesses to:Open a businessAcquire building permitGet electricityRegister propertyGet creditProtecting investorsPay taxesTrade with another countryEnforce contractsResolve insolvency
COMPOSITE INDEX OR RANKING
1st. part
COUNTRY POLICY AND INSTITUTIONAL ASSESSMENT (CPIA)
International Development Association (IDA), World Bank
77 economies; anually since 2005
It is built from four equally weighted dimensions. Every dimension has its own score produced by the average of the rates included in each dimension. For each score, countries are rated on a scale of 1 to 6 by Bank's sta�. Ratings are based on a variety of indicators, observations and judgments based on country knowledge. CPIA considers one dimension of Governance.
Public sector management and institutions score:E�ciency of revenue mobilization Property rights and rule-based governance rating Quality of budgetary and �nancial management Quality of public administration rating; Transparency, accountability, and corruption in the public sector
MEASURING THE QUALITY OF GOVERNMENT AND SUBNATIONAL VARIATION
Quality Government Institute (University of Gothenburg)
27 EU countries and 172 regions; 2010
It is based on a combination of national level expert assessments and a Quality of Government survey. Assessments were conducted using World Governance Indicators. For the survey 34,000 EU citizens aged 18 or over were interviewed by telephone.
CorruptionRule of lawBureaucracy e�ectivenessParticipation Accountability
IBRAHIM INDEX OF AFRICAN GOVERNANCE
Mo Ibrahim Foundation
52 African countries; anually since 2007
IIt is a compiled from 32 international and African sources. It focuses on outputs and outcomes indicators and it has 14 sub-categories built by 94 indicators. All of its information is gathered by experts of the continent's institutions.
Security and rule of lawHuman developmentSustainable economic opportunitiesParticipation and human rights
INEG
I. G
ober
nanz
a: u
na re
visi
ón c
once
ptua
l y m
etod
ológ
ica.
Doc
umen
tos
de a
nális
is y
est
adís
tica.
201
7.
INEG
I. G
over
nanc
e: a
con
cept
ual a
nd m
etho
dolo
gica
l rev
iew
. Sta
tistic
al A
naly
sis
Rep
orts
. 201
7.
Esta obra forma parte del acervo de la Biblioteca Jurídica Virtual del Instituto de Investigaciones Jurídicas de la UNAM www.juridicas.unam.mx https://biblio.juridicas.unam.mx/bjv
DR © 2017. Instituto Nacional de Estadística y Geografía http://www.inegi.org.mx/
Libro completo en: https://goo.gl/i3pCU4
53Documentos de análisis y estadísticas / Gobierno Statistical Analysis Reports / Government
PROJECT PRODUCER
Governance Measurement Projects Table 1
AVAILABILITY METHODOLOGY DIMENSIONS
OPEN BUDGET INDEX
International Budget Partnership
100 countries; biennial since 2006
It is a rank based on the public availability of budget information and other budgeting practices; thus it focuses on processes. For constructing this rank, a survey of 125 questions is addressed to one or to a group of experts within an organization from the country at stake. Finally, each country receives a score from 0 to 100 based on the simple average of the responses.
No dimensions are de�ned; though it assess:Timeliness and comprehensiveness of eight key budget documentsOversight capacity of legislatures and supreme audit institutionsOpportunities for public engagement during the budget process
2nd. part
POLITY IV Center for Systematic Peace & Integrated Network of Societal Con�ict Research
167 countries; it covers the period 1800-2013.
Polity IV includes constructed annual measures for both institutionalized democracy and autocracy, as many polities exhibit mixed qualities of both of these distinct authority patterns. The Polity score is derived by subtracting the autocracy value from the democracy value; it ranges from a +10 to a -10. Data is gathered by analysts, experts in academia, policy and the intelligence community who monitor real-time events or outcomes.
Competitiveness of executive recruitmentOpenness of executive recruitmentConstraints on chief executiveCompetitiveness of political participation
RESOURCE GOVERNANCE INDEX
Revenue Watch Institute
58 countries; 2013
It evaluates the governance of the oil, gas and mining sector. The index includes 45 indicators grouped in four dimensions that measure the disclosure of information about natural resources through o�cial sources. Data was collected by experts (20 local society experts, 12 independent consultants based in-country and 14 experts based outside the country they assessed) who used a specially designed questionnaire and several external sources. The RGI score is a weighted average of each dimension score.
Institutional & legal settingReporting PracticesSafeguards and Quality ControlsEnabling Environment
WORLDWIDE GOVERNANCE INDICATORS
World Bank 215 economies; over the period 1996-2012
The WGI are composite governance indicators based on 32 underlying data sources. It uses enterprise, citizen and expert surveys that are collected by a number of survey institutes, think tanks, non-governmental organizations, international organizations and private sector �rms. These data sources are rescaled and combined to create six aggregate indicators.
Voice and accountabilityPolitical stability and absence of violenceGovernment e�ectivenessRegulatory qualityRule of lawControl of corruption
INEG
I. G
ober
nanz
a: u
na re
visi
ón c
once
ptua
l y m
etod
ológ
ica.
Doc
umen
tos
de a
nális
is y
est
adís
tica.
201
7.
INEG
I. G
over
nanc
e: a
con
cept
ual a
nd m
etho
dolo
gica
l rev
iew
. Sta
tistic
al A
naly
sis
Rep
orts
. 201
7.
Esta obra forma parte del acervo de la Biblioteca Jurídica Virtual del Instituto de Investigaciones Jurídicas de la UNAM www.juridicas.unam.mx https://biblio.juridicas.unam.mx/bjv
DR © 2017. Instituto Nacional de Estadística y Geografía http://www.inegi.org.mx/
Libro completo en: https://goo.gl/i3pCU4
54 Documentos de análisis y estadísticas / Gobierno Statistical Analysis Reports / Government
PROJECT PRODUCER
Governance Measurement Projects Table 1
AVAILABILITY METHODOLOGY DIMENSIONS
BERTLESMANN TRANSFORMATION INDEX
Bertlesman Foundation & Centre for Applied Research (Munich University)
128 developing and transition countries; biennial since 2006
It analyzes and evaluates whether and how developing countries and countries in transition are steering social change toward democracy and a market economy. Country experts assess the extent to which a total of 17 criteria have been met by using a standardized codebook. Such assessments are then reviewed. The results are aggregated to build two indices. Each of these is equivalent to the average of the scores of the associated criteria.
Democracy status - stateness, political participation, rule of law, stability of democratic institutions and political and social integrationMarket economy status - level socio-economic development, organization of the market economy and competition, currency and price stability, private property, welfare regime, economic performance and sustainabilityManagement index – level of di�culty, leadership capability, resource e�ciency, consensus-building and international cooperation
3rd. part
GLOBAL INTEGRITY INDEX
Global Integrity 31 countries; annually since 2004
It evaluates anti-corruption legal frameworks and the practical implementation and enforcement of those frameworks among countries. It uses quantitative data and qualitative reporting. Data are provided by local experts using a double-blind peer review process.
Non-governmental organizationsPublic information and mediaElectionsSafeguardsChecks and balances of con�icts of interest in governmentPublic administration and professionalismGovernment supervision and controlsAnti-corruption legal frameworkJudicial impartialityProfessionalism of law enforcement
GLOBAL RIGHT TO INFORMATION INDEX
Access Info Europe & Centre for Law and Democracy
98 countries; annually since 2010
It rates the overall legal framework for the right to information in a country; it does not measure quality of implementation. Experts provide subratings in seven di�erent thematic areas divided in 61 indicators. The indicators are rated and weighted according to international standards on the right to information, as well as comparative studies. To check these assessments, local legal experts were asked to review and comment on the original scores.
Right of accessScopeApplication proceduresAppeals, sanctions and protectionsPromotion measures
INEG
I. G
ober
nanz
a: u
na re
visi
ón c
once
ptua
l y m
etod
ológ
ica.
Doc
umen
tos
de a
nális
is y
est
adís
tica.
201
7.
INEG
I. G
over
nanc
e: a
con
cept
ual a
nd m
etho
dolo
gica
l rev
iew
. Sta
tistic
al A
naly
sis
Rep
orts
. 201
7.
Esta obra forma parte del acervo de la Biblioteca Jurídica Virtual del Instituto de Investigaciones Jurídicas de la UNAM www.juridicas.unam.mx https://biblio.juridicas.unam.mx/bjv
DR © 2017. Instituto Nacional de Estadística y Geografía http://www.inegi.org.mx/
Libro completo en: https://goo.gl/i3pCU4

55Documentos de análisis y estadísticas / Gobierno Statistical Analysis Reports / Government
PROJECT PRODUCER
Governance Measurement Projects Table 1
AVAILABILITY METHODOLOGY DIMENSIONS
CORRUPTION PERCEPTION INDEX
Transparency International
177 countries; annually since 1995
It scores and ranks countries based on how corrupt a country's public sector is perceived to be. It is based on a combination of surveys and assessments of corruption collected by di�erent institutions. The data capture business and expert views. Year to year comparisons are possible from 2012 onwards.
No dimensions are de�ned
4th. part
RULE OF LAW INDEX
World Justice Project
99 countries; annually since 2010
It is a composite score that captures the experiences and perceptions concerning the performance of the State, its agents and the actual operation of the legal framework. It presents data on nine composite factors that can be disaggregated into 47 speci�c indicators. Each score is calculated using a General Population Poll and Quali�ed Respondents' Questionnaires. The General Population Poll uses a probability sample of 1,000 respondents in the three largest cities of each country. Polling methodologies vary according to the context of each country. The Quali�ed Respondents Survey are completed by respondents selected from directories of law �rms, universities, research organizations and NGOs; on average, there are 24 respondents per country. Both questionnaires are equally weighted in the calculation of the scores.
Constraints on Government powerAbsence of corruptionOpen GovernmentFundamental rightsOrder and securityRegulatory enforcementCivil justiceCriminal justiceInformal justice
AGI DATA World Bank Varies according to data source, country and indicator
It is a portal that consolidates information on actionable governance indicators. Its purpose is to facilitate the use of governance indicators for research, policy analysis and design of institutional, governance and public sector reforms. Data are provided by di�erent sources from non-governmental, multilateral and academic institutions.
No dimensions are de�ned; though it compiles indicators on:Institutional arrangements (design)Organizational capacityGovernance system performance
DATA COLLECTION EFFORTS
DATA GOB Inter-American Development Bank
Varies according to data source, country and indicator
It is a user-friendly interface for accessing indicators from 30 di�erent publications, including multilateral organizations, NGOs, private �rms, and think tanks. It allows users to easily produce cross-national comparative and time series graphs and tables. It contains approximately 400 governance indicators.
GovernanceRule of lawDecentralizationDemocracyMarketsSocietyPublic administrationTransparency
INEG
I. G
ober
nanz
a: u
na re
visi
ón c
once
ptua
l y m
etod
ológ
ica.
Doc
umen
tos
de a
nális
is y
est
adís
tica.
201
7.
INEG
I. G
over
nanc
e: a
con
cept
ual a
nd m
etho
dolo
gica
l rev
iew
. Sta
tistic
al A
naly
sis
Rep
orts
. 201
7.
Esta obra forma parte del acervo de la Biblioteca Jurídica Virtual del Instituto de Investigaciones Jurídicas de la UNAM www.juridicas.unam.mx https://biblio.juridicas.unam.mx/bjv
DR © 2017. Instituto Nacional de Estadística y Geografía http://www.inegi.org.mx/
Libro completo en: https://goo.gl/i3pCU4
56 Documentos de análisis y estadísticas / Gobierno Statistical Analysis Reports / Government
PROJECT PRODUCER
Governance Measurement Projects Table 1
AVAILABILITY METHODOLOGY DIMENSIONS
5th. part
GOVERNMENT STATISTICS & GOVERNANCE INDICATORS
O�ce for National Statistics (United Kingdom)
Varies according to data source and indicator selected. Most data can be disaggregated at a national, regional or sub regional level.
The ONS collects data for Governance and Government topics. Data are produced by central and local governments, the Department for International Development and the Defense and Analytical Services and Advice.
Government statisticsCentral and Local Government: Elections, Government Research and Development, Public Sector Personnel, Public Service ProductivityInternational A�airs: Aid and DevelopmentDefense: Activities, equipment, estate, money and personnelGovernance indicators: i) Percentage of registered voters who voted; ii) Percentage of those who have trust in national Government
GOVERNMENT AT GLANCE
Organisation for Economic Co-operation and Development
34 OECD countries; biannually since 2009
It provides over 50 indicators describing the political and institutional frameworks of governments as well as their performance. It covers the whole production chain of public goods and services: inputs, processes, outputs and outcomes. Data come from administrative records, population based surveys and other NGOs data collection e�orts.
Con�dence in governmentPolicy e�ectivenessStrategic governmentFinance and public accountsPractices and procedures of public budgetEmployment and wages in the public sectorWomen in governmentPublic procurementOpen and inclusive governmentAccessibilityQuality of public services
INEG
I. G
ober
nanz
a: u
na re
visi
ón c
once
ptua
l y m
etod
ológ
ica.
Doc
umen
tos
de a
nális
is y
est
adís
tica.
201
7.
INEG
I. G
over
nanc
e: a
con
cept
ual a
nd m
etho
dolo
gica
l rev
iew
. Sta
tistic
al A
naly
sis
Rep
orts
. 201
7.
Esta obra forma parte del acervo de la Biblioteca Jurídica Virtual del Instituto de Investigaciones Jurídicas de la UNAM www.juridicas.unam.mx https://biblio.juridicas.unam.mx/bjv
DR © 2017. Instituto Nacional de Estadística y Geografía http://www.inegi.org.mx/
Libro completo en: https://goo.gl/i3pCU4

57Documentos de análisis y estadísticas / Gobierno Statistical Analysis Reports / Government
PROJECT PRODUCER
Governance Measurement Projects Table 1
AVAILABILITY METHODOLOGY DIMENSIONS
6th. part
GOVERNMENT STATISTICS
National Institute of Statistics and Geography (MEX)
Since 2009; Data can be disaggregated at National, State and Municipal levels.
INEGI has two major sources for Governance data. One is the Government Censuses which contain data on Public Administrations (institutional design, legal framework, resources and processes). Data are provided by the public administrations at the federal, state and municipal levels. The other, the Quality of Public Services Survey is a Population based survey that measures the experiences and perceptions of public services, including measurements of perceptions and actual experiences on corruption. The sample size is about 33,000 individuals.
Public administrations: Organizational structure, Resources, Processes and services, Anticorruption measures, Legal framework.Quality of Public Services: Perceptions and expectations, Experiences with processes and services, Evaluations and priorities
MEASURES OF AUSTRALIA´S PROGRESS
Australian Bureau of Statistics (AUS)
Varies according to data source and indicator selected.
According to a consultation, Australians have rated governance as an important part of their national progress. In this sense, the ABS sought to provide indicators that measure Australian’s aspirations. For this purpose, �ve dimensions were identi�ed. Data sources vary according to each indicator; however, they are mainly provided by administrative records and population based surveys.
Trust: Overall progress, Integrity, Transparency, Accountability, Processes and SystemsE�ective governance: Overall progress, E�ective, Interactions, Protection, Balance, ResilienceParticipation: Overall progress, Involvement, Awareness, Access and opportunity, ResponsibilityInformed public debate: Overall progress, Open and informed, Freedom, Free media, RegulationPeople's rights and responsibilities: Overall progress, Rights and responsibilities, Laws, Justice, Freedom, International
POPULATION BASED SURVEYS
EUROBAROMETER European Commission
28 EU countries, since 1973
The Eurobarometer is a European-wide survey with national representative samples published twice a year. It has a core questionnaire and a thematic battery that changes with every edition. The Eurobarometer uses a non-substitute representative sample in each of the 28 countries; number of face-to-face interviews ranges from about 500 to 1,500 per country.
No dimensions are de�ned; however, the main questionnaire centers on topics such as: Citizens’ rights, political institutions, economic situation and opinions about present topics and future perspectives The thematic batteries vary widely on the topics, from agricultural policy to sport or personal well-being
INEG
I. G
ober
nanz
a: u
na re
visi
ón c
once
ptua
l y m
etod
ológ
ica.
Doc
umen
tos
de a
nális
is y
est
adís
tica.
201
7.
INEG
I. G
over
nanc
e: a
con
cept
ual a
nd m
etho
dolo
gica
l rev
iew
. Sta
tistic
al A
naly
sis
Rep
orts
. 201
7.
Esta obra forma parte del acervo de la Biblioteca Jurídica Virtual del Instituto de Investigaciones Jurídicas de la UNAM www.juridicas.unam.mx https://biblio.juridicas.unam.mx/bjv
DR © 2017. Instituto Nacional de Estadística y Geografía http://www.inegi.org.mx/
Libro completo en: https://goo.gl/i3pCU4

58 Documentos de análisis y estadísticas / Gobierno Statistical Analysis Reports / Government
PROJECT PRODUCER
Governance Measurement Projects Table 1
AVAILABILITY METHODOLOGY DIMENSIONS
7th. part
THE NATIONAL CITIZEN SURVEY
National Research Center (USA)
More than 500 cities/counties in the US; periodicity varies according to cities/counties
The National Citizen Survey measures the public opinion on services and other challenges that cities face. This is not a nation-wide poll: cities that require it, hire the NRC to carry on the study based on its needs and budget; thus sample-sizes, periodicity and content varies between cities. The collection data method is generally web-based questionnaires, although cities may choose to expand to a telephone or mail sample. It is the most wide-spread local citizen satisfaction survey in the US.
No dimensions are de�ned, but topics include: Community engagementEducation and enrichmentRecreation and wellnessEconomyBuilt environmentNatural environmentSafety Mobility
CITIZENS FIRST Canadian Institute for Citizen-Centered Service (ICCS)
6 waves, since 1996
The “Citizens First” Survey focuses on the satisfaction with the services provided by the government. It generates nation-wide satisfaction indicators that are used to assess improvements on public services. The sample-size is about 10,000 people and it is collected whether by on-line or by mail methods.
No dimensions are de�ned; however the survey aims to capture the general satisfaction with public services, including: Expectations, actual experiences and service reputation and importance. It also includes questions about the maximum time expected to wait in line and the use of web-services, for example
UK CITIZEN'S SATISFACTION SURVEYS
UK cities and local councils
Varies according to city or council
Local authorities use speci�c on-line or telephone surveys to account for public opinion during the decision-making process. Most surveys are followed by public meetings and discussions to analyze the results and take the appropriate measures. These exercises are not standardized and cannot be used for making large-scale comparisons nor trends, but serve as a speci�c and local way to bring citizens and authorities to work together. The methodology varies widely depending on the topic, including on-line voluntary polls or telephone surveys of a representative sample.
Topics vary widely, from general, long-term satisfaction surveys, to speci�c problems that cities face, such as public libraries, urbanization, parks, etc.
INEG
I. G
ober
nanz
a: u
na re
visi
ón c
once
ptua
l y m
etod
ológ
ica.
Doc
umen
tos
de a
nális
is y
est
adís
tica.
201
7.
INEG
I. G
over
nanc
e: a
con
cept
ual a
nd m
etho
dolo
gica
l rev
iew
. Sta
tistic
al A
naly
sis
Rep
orts
. 201
7.
Esta obra forma parte del acervo de la Biblioteca Jurídica Virtual del Instituto de Investigaciones Jurídicas de la UNAM www.juridicas.unam.mx https://biblio.juridicas.unam.mx/bjv
DR © 2017. Instituto Nacional de Estadística y Geografía http://www.inegi.org.mx/
Libro completo en: https://goo.gl/i3pCU4
59Documentos de análisis y estadísticas / Gobierno Statistical Analysis Reports / Government
PROJECT PRODUCER
Governance Measurement Projects Table 1
AVAILABILITY METHODOLOGY DIMENSIONS
8th. and �nal part
GALLUP WORLD POLL
Gallup 160 countries worldwide; frequency depends on the country, but most of them are year to year
The GWP provides data on global and region-speci�c issues and the thoughts and behaviors of population aged 15 and over. All samples are probability based. The typical survey includes at least 1,000 surveys; though it depends on the country. There is a standard set of core questions used around the world. Telephone and face-to-face interviewing are used depending on the context of each country. Finally, quality control procedures are used to validate sampling methods and that the correct person is randomly selected in each household.
In terms of governance, the core questionnaire contains perceptions and thoughts on:Government and Politics - Approval or disapproval of Politicians leadership performance, con�dence in elections and national governmentsLaw and order - Perceptions of insecurity, perceptions on corruption, con�dence in the judicial system and the police
LATINOBARÓMETRO Latinobarómetro 18 countries; annually since 1995
Latinobarómetro is a public opinion poll focusing on the interrelated development issues of democracy, economy and society. It measures attitudes, values and behaviors of the population from Latin America aged 18 or over. It is a face-to-face interview and it is representative at a national level. Sample sizes vary between 1,000 and 1,200 interviews per country. Sampling methods vary according to each polling company.
No dimensions are de�ned, but in terms of governance, the questionnaire contains information on political values and attitudes, perceptions and con�dence on democracy and other relevant political institutions
INEG
I. G
ober
nanz
a: u
na re
visi
ón c
once
ptua
l y m
etod
ológ
ica.
Doc
umen
tos
de a
nális
is y
est
adís
tica.
201
7.
INEG
I. G
over
nanc
e: a
con
cept
ual a
nd m
etho
dolo
gica
l rev
iew
. Sta
tistic
al A
naly
sis
Rep
orts
. 201
7.
Esta obra forma parte del acervo de la Biblioteca Jurídica Virtual del Instituto de Investigaciones Jurídicas de la UNAM www.juridicas.unam.mx https://biblio.juridicas.unam.mx/bjv
DR © 2017. Instituto Nacional de Estadística y Geografía http://www.inegi.org.mx/
Libro completo en: https://goo.gl/i3pCU4
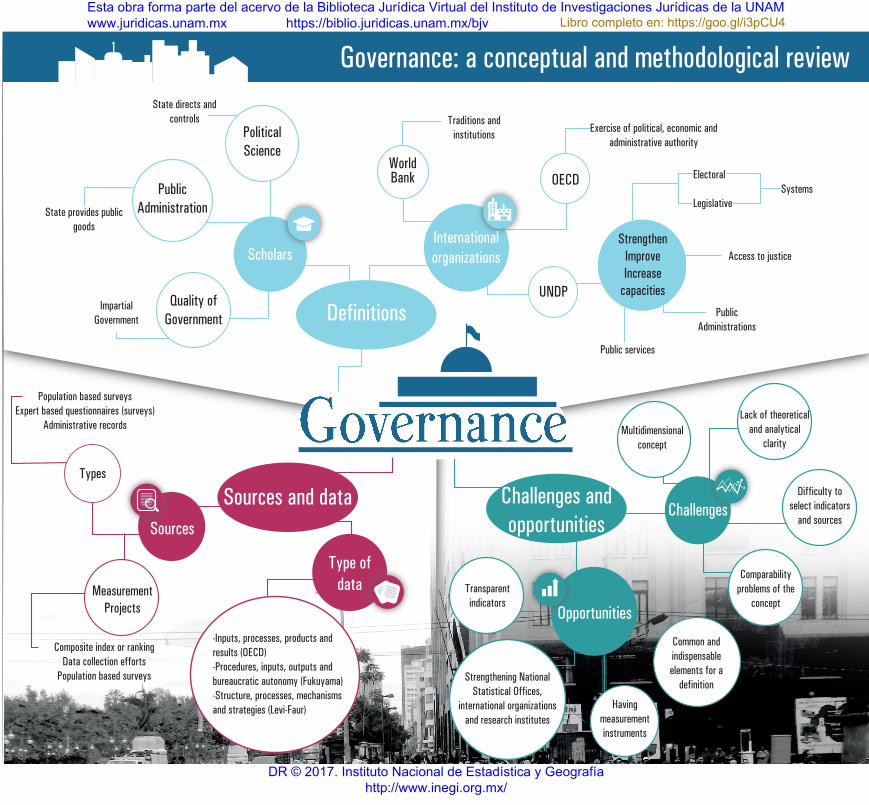
Governance
Definitions
ScholarsInternational organizations
Political Science
Traditions and institutions
State directs and controls
Exercise of political, economic and administrative authority
Quality of Government
Impartial Government
Public AdministrationState provides public
goods
World Bank OECD
UNDP
StrengthenImproveIncrease
capacities
SystemsElectoral
Legislative
Access to justice
Public Administrations
Public services
Sources and data Challenges and opportunities Sources
Type of data
Types
Measurement Projects
Population based surveysExpert based questionnaires (surveys)
Administrative records
Composite index or rankingData collection efforts
Population based surveys
-Inputs, processes, products and results (OECD)-Procedures, inputs, outputs and bureaucratic autonomy (Fukuyama)-Structure, processes, mechanisms and strategies (Levi-Faur)
Challenges
Opportunities
Multidimensional concept
Lack of theoretical and analytical
clarity
Difficulty to select indicators
and sources
Comparability problems of the
concept
Common and indispensable elements for a
definition
Having measurement instruments
Strengthening National Statistical Offices,
international organizations and research institutes
Transparent indicators
Governance: a conceptual and methodological review
Esta obra forma parte del acervo de la Biblioteca Jurídica Virtual del Instituto de Investigaciones Jurídicas de la UNAM www.juridicas.unam.mx https://biblio.juridicas.unam.mx/bjv
DR © 2017. Instituto Nacional de Estadística y Geografía http://www.inegi.org.mx/
Libro completo en: https://goo.gl/i3pCU4