review of approaches for the estimation of sensible heat
TRANSCRIPT

Review of approaches for the estimation ofsensible heat flux in remote sensing-based
evapotranspiration models
M. M. Prakash Mohan , Rajitha Kanchirapuzha ,*and Murari R. R. Varma
BITS Pilani Hyderabad Campus, Department of Civil Engineering, Hyderabad, India
Abstract. We recapitulate the approaches of sensible heat flux (H) estimation, which is acritical parameter in the remote sensing (RS)-based evapotranspiration (ET) models. We pro-pose a classification scheme for the ET models considering their distinctions in approaches forthe estimation of H. Adhering to the proposed classification scheme, the theoretical back-grounds ofH estimation in the single-source and two-source RS-based ET models are discussedin brief, along with their unique characteristics. We addressed the role of critical parametersthat influenced the H computation under each model and presented the related progress inthe research. The importance of data assimilation techniques, as well as the application of un-manned aerial vehicles for the uninterrupted estimation of turbulent heat flux, are discussed inthe context of single-source and two-source models. The influence of scale on the validation ofthe models and the impact of the aggregation methods are discussed. We compared the per-formance of the popular ET models for the estimation of H, utilizing the information obtainedfrom peer-reviewed articles. The limitations related to the RS datasets in terms of spatial andtemporal resolution and the scope of alleviating the shortcomings using the future satellite mis-sions are discussed. We conclude by pointing toward the current challenges and the prospectivedomain of research, which needs to be addressed critically in the future. © 2020 Society of Photo-Optical Instrumentation Engineers (SPIE) [DOI: 10.1117/1.JRS.14.041501]
Keywords: sensible heat flux; surface energy balance models; evapotranspiration; remotesensing; single-source models; two-source models.
Paper 200065V received Jan. 23, 2020; accepted for publication Oct. 5, 2020; published onlineOct. 15, 2020.
1 Introduction
The sensible heat flux (H) and latent heat flux (λET) of the energy balance equation, have anotable role in various domains of applications spanning from climate change to water resourcemanagement. In the remote sensing (RS) perspective, sensible heat flux computation gainedmore attention because of its sensitivity and computationally complex nature among all othercomponents in the surface energy balance equation.1,2 The sensible heat flux parameter has asignificant impact on the λET values as most of the RS-based models calculate λET as a residualof the surface energy balance equation as follows:3
EQ-TARGET;temp:intralink-;e001;116;213λET ¼ Rn − G −H; (1)
where Rn is the net radiation (Wm−2), G is the soil heat flux (Wm−2), H is the sensible heat flux(Wm−2), and λET represents the latent heat flux (Wm−2).
The RS-based evapotranspiration (ET) models attained much importance in the last fourdecades due to the accelerated advancements in the satellite RS technology. Though the RS-based models are preferred to other approaches due to their better estimation of H capabilityunder water-stressed conditions, there exist many challenges, such as lack of techniques for
*Address all correspondence to Rajitha Kanchirapuzha, [email protected]
REVIEW
Journal of Applied Remote Sensing 041501-1 Oct–Dec 2020 • Vol. 14(4)
Downloaded From: https://www.spiedigitallibrary.org/journals/Journal-of-Applied-Remote-Sensing on 29 Mar 2022Terms of Use: https://www.spiedigitallibrary.org/terms-of-use
aerodynamic temperature measurements, use of radiometric temperature as a surrogate to aero-dynamic temperature, and existence of heterogeneous partial canopy cover conditions.4
This review is an attempt to organize the outcomes obtained from the research carried out inthe realm of sensible heat flux computation focusing on RS-based ET models. This review tar-gets to create a comprehensive link between the approaches through a new classification schemebased on their mode of operation for the estimation of sensible heat flux.
1.1 Hybrid Nature of Sensible Heat Flux Estimation Approach
The sensible heat flux estimation could not be considered as a sole RS approach as many of themodels utilize the combination of micrometeorological and RS concepts. Though the RS modelsconsider land surface temperature (often referred as LST or Ts or Trad) as the primary boundarycondition, they could not account for the uncertainty due to canopy cover and turbulence in theatmosphere. The parameters such as aerodynamic roughness of the surface and the wind velocityare also crucial under the non-neutral conditions of the atmosphere. Therefore, the estimation ofH needs a hybrid approach by incorporating RS and micrometeorological concepts. This reviewmainly focuses on the RS aspects of the hybrid approach.
1.2 Organization of the Paper
This review starts with the concepts of resistance-based models with historical developments thatguided the evolution of RS-based models. The RS-based ET models grouped under the proposedclassification scheme are linked to form a comprehensive account of the progress in the sensibleheat flux research in the succeeding sections. This review further discusses the importance ofdata assimilation techniques, the influence of scale changes on field validation of the models, andthe recent developments in the use of unmanned aerial vehicles (UAVs) for the estimation ofturbulent heat flux. This review concludes with a record of historical milestones along with thecurrent developments in sensible heat flux related research.
2 Concepts of Resistance-Based Models for the Estimation ofSensible Heat Flux
The concept of resistance in plant physiology dates back to 1900, and later Monteith proved thatthe Ohm’s law-based resistance approach could simplify the estimation of H from naturalsurfaces.5 The “Penman–Monteith” (PM) equation (“big-leaf” approach), which follows theresistance-based concept, was the simple model used in the one-dimensional single-sourcedescriptions of ET process, which is expressed as6
EQ-TARGET;temp:intralink-;e002;116;282H ¼ ρCpðT0 − TaÞraa
; (2)
where raa is the aerodynamic resistance between the source (canopy) and the reference height,T0 is the aerodynamic temperature (K), Ta is the air temperature (K), Cp is the specific heat of airat constant pressure (J kg−1 K−1), and ρ is the mean air density (kgm−3). One of the well-knownpractical application of the big-leaf approach is the FAO-56 (Irrigation and Drainage PaperNo. 56) of Food and Agricultural Organisation.7 The performance of big-leaf based modelsmainly constrained to the rational calculation of an “excess resistance” term quantified bykB−1. The term kB−1 [which is equal to lnðz0m∕z0hÞ] explains the difference between the heightof the equivalent surfaces for momentum absorption (z0m) and heat transfer (z0h).
8
The inability of the big-leaf concept to represent the canopy resistance for sparse vegetativeconditions led to the development of two-source models where the estimation of componentfluxes of soil and vegetation is essential.9 The two-source conceptual framework incorporatedthe influence of soil and vegetation components separately and categorized as series andparallel ET models.10 The presence of canopy structure with stacked multiple layers becamethe impetus for the development of multi-source models. The turbulence within the canopy and
Mohan, Kanchirapuzha, and Varma: Review of approaches for the estimation of sensible heat flux. . .
Journal of Applied Remote Sensing 041501-2 Oct–Dec 2020 • Vol. 14(4)
Downloaded From: https://www.spiedigitallibrary.org/journals/Journal-of-Applied-Remote-Sensing on 29 Mar 2022Terms of Use: https://www.spiedigitallibrary.org/terms-of-use
the counter-gradient fluxes, which are prominent in multi-layered canopies, make the multi-layered models complicated and limited.11
3 Importance of Radiometric Temperature and AerodynamicTemperature in ET Models
The radiometric surface temperature (Ts) derived from RS platforms is used as a proxy for aero-dynamic temperature (T0) in RS-based models.3 The single-source models primarily rely uponthe relationship, which accounts for the difference between T0 and Ts. In the partially vegetatedareas, the difference between Ts and T0 can even reach up to 10°C resulting in the overestimationof H.12–16 To overcome this difference, an extra resistance term rex, derived from kB−1 wasincorporated in the bulk transfer equation.17 Due to the uncertainty regarding the dependencyof kB−1 on surface temperature, wind speed, and ground cover conditions, many methods wereproposed without incorporating kB−1 parameter.14,18–20 Among them, the temperature gradient-based approaches reduced the errors contributed by the air temperature and successfully adoptedin many of the current popular RS-based models.19,21
4 Atmospheric Stability Corrections and Aerodynamic Resistance
The earlier ET models assumed the existence of neutral atmospheric stability with homogeneousland surface temperature and stable wind velocity profile at the near-surface layers. The occur-rence of such neutral stability condition is rare in heterogeneous canopy cover with varying soilmoisture conditions.22 As the soil moisture depletes, the canopy temperature would rise, andthe air density above the canopy would reduce, and it creates unstable conditions with increasedheat transport. Similarly, at unstable conditions, the rate of decrease of air temperature withan increase in elevation is higher than the adiabatic lapse rate, which promotes the increasedexchange of sensible heat flux. Contrary to this, at stable conditions, the rate of heat transferdecreases. The incorporation of atmospheric stability correction procedures in the estimation ofaerodynamic resistance (rah) accounted for the aforementioned micrometeorological changesthat influenced the sensible heat flux computations.23,24 Numerous studies proposed Monin–Obukhov (MO) stability parameter (ζ) or Richardson’s number (Ri) as the indicator of theatmospheric stability conditions.16,17,19,25,26 Generally, an iterative procedure is adopted whileusing ζ as a quantifier for atmospheric stability changes. Instead of ζ, many researchers hadused Ri to avoid the iterative procedures in various surface energy balance models.3,27,28
Though the Richardson’s number found its place in various studies, it was not usually preferredover ζ since it is an unknown function of height and often approaches a constant value fornear-surface layer applications.25
5 Classification of ET Models Based on Sensible Heat Flux EstimationApproach
The classification scheme unlocks opportunities to understand the characteristics of models sys-tematically. One of the well-known classification methods developed by Courault et al. catego-rized the ET models into four different classes based on the complexity, considering the balancebetween the empirical and physical approaches applied in the models.29 The four categories aredirect empirical methods, the residual methods of the energy budget, the deterministic methods,and the vegetation index-based methods. The direct empirical category includes RS-based semi-empirical ET models, and the residual models use empirical and physical modules that are opera-tional. The deterministic models are more complex models where the RS data are assimilatedat different modeling levels. The vegetation index-based category of models uses RS data tocompute reduction factors (e.g., crop coefficient and Priestley–Taylor coefficient) to estimateET. Later, a new classification scheme by Bhattarai et al. grouped single-source energy balancemodels into three categories based on the methodology adopted for the estimation of H.
Mohan, Kanchirapuzha, and Varma: Review of approaches for the estimation of sensible heat flux. . .
Journal of Applied Remote Sensing 041501-3 Oct–Dec 2020 • Vol. 14(4)
Downloaded From: https://www.spiedigitallibrary.org/journals/Journal-of-Applied-Remote-Sensing on 29 Mar 2022Terms of Use: https://www.spiedigitallibrary.org/terms-of-use

The categories are hot and cold pixel-based full energy balance models, excess resistance-basedfull energy balance models, and partial energy balance models.30
The current population of RS-based ET models that include single- and multi-source modelsdemands a generic theme of classification that facilitates a comprehensive approach with a betterdistinction between the classes. The approach should also improve the flexibility to update futuredevelopments. In view of these requirements, this review proposes a classification scheme forRS-based ET models as an extension of the classification scheme by Bhattarai et al. The currentclassification scheme considers the sensible heat flux estimation approach as the criterion forcategorizing the models.
The classification scheme (Fig. 1) broadly divides the models into iterative and non-iterativemodels. The iterative models estimate H using an iterative procedure based on an initializationand termination condition. The non-iterative models are further classified into feature space-based and non-feature space-based models. The feature space-based models among non-iterativecategory utilize two-dimensional feature space [e.g., vegetation fraction cover-land surfacetemperature (VFC-LST) space] to estimate the parameters essential for the models. The non-iterative, non-feature space-based models are simple and straightforward that retrieve the modelparameters without the aid of feature space or iterative procedure.
6 Sensible Heat Flux Estimation Approaches in Single-Source ETModels
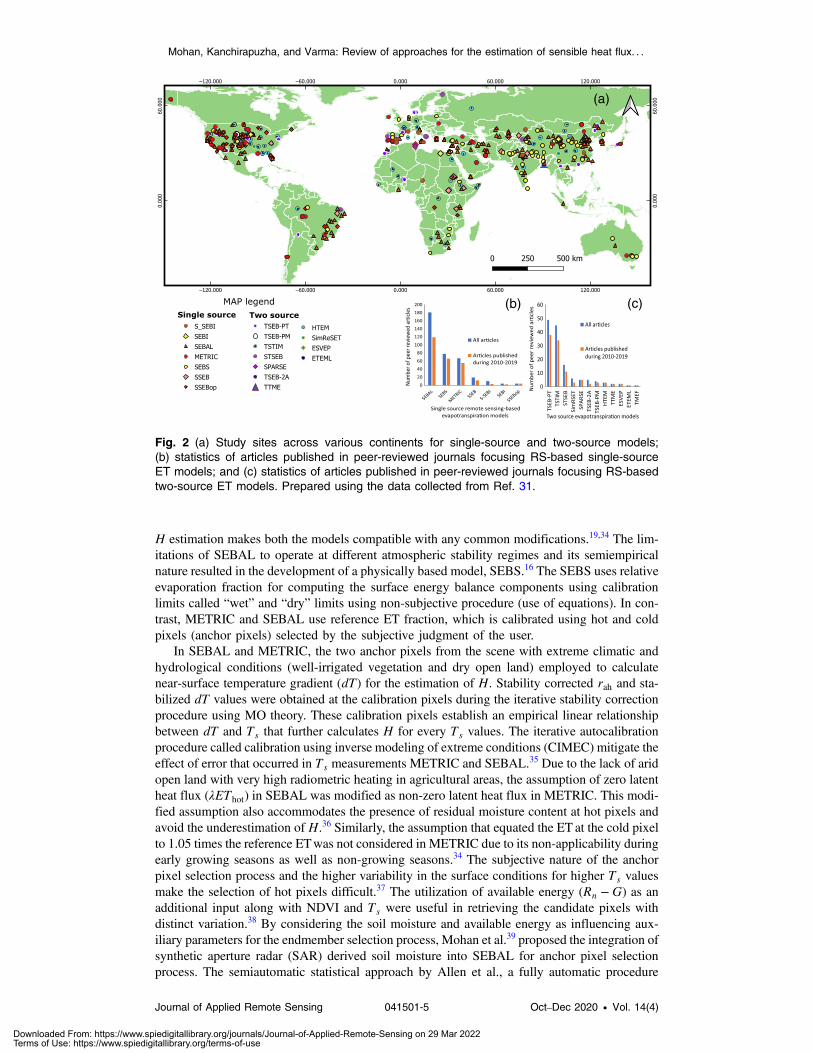
Statistics of the peer-reviewed articles published during the last 10 years (source: Ref. 31)revealed that the surface energy balance algorithm for land (SEBAL), mapping evapotranspi-ration at high resolution with internalized calibration (METRIC), and surface energy balancesystem (SEBS) are the popular models of the single-source category [Fig. 2(b)]. Though thesemodels are more suitable for semiarid regions, the spatial distribution of the sites chosenfor executing these models are spread across all the climatic regions except polar group(as per Köppen–Geiger climate classification32). Refer to Fig. 2(a) for the spatial distributionof sites across the globe where popular models were tested.
6.1 Sensible Heat Flux Estimation Approaches in Iterative Single-SourceET Models
The SEBAL,19 METRIC,21 and SEBS33 are the iterative models that follow the H estimationprocedure as a hybrid approach using micrometeorological and RS concepts. METRIC is animproved version of SEBAL that provides relatively more accurate estimates of ET at a higherspatial resolution and more suitable for advective conditions. The similarity of SEBAL andMETRIC in their theoretical framework, underlying assumptions, and data requirements for
Fig. 1 Classification of RS-based ET models based on sensible heat flux estimation approaches.
Mohan, Kanchirapuzha, and Varma: Review of approaches for the estimation of sensible heat flux. . .
Journal of Applied Remote Sensing 041501-4 Oct–Dec 2020 • Vol. 14(4)
Downloaded From: https://www.spiedigitallibrary.org/journals/Journal-of-Applied-Remote-Sensing on 29 Mar 2022Terms of Use: https://www.spiedigitallibrary.org/terms-of-use
H estimation makes both the models compatible with any common modifications.19,34 The lim-itations of SEBAL to operate at different atmospheric stability regimes and its semiempiricalnature resulted in the development of a physically based model, SEBS.16 The SEBS uses relativeevaporation fraction for computing the surface energy balance components using calibrationlimits called “wet” and “dry” limits using non-subjective procedure (use of equations). In con-trast, METRIC and SEBAL use reference ET fraction, which is calibrated using hot and coldpixels (anchor pixels) selected by the subjective judgment of the user.
In SEBAL and METRIC, the two anchor pixels from the scene with extreme climatic andhydrological conditions (well-irrigated vegetation and dry open land) employed to calculatenear-surface temperature gradient (dT) for the estimation of H. Stability corrected rah and sta-bilized dT values were obtained at the calibration pixels during the iterative stability correctionprocedure using MO theory. These calibration pixels establish an empirical linear relationshipbetween dT and Ts that further calculates H for every Ts values. The iterative autocalibrationprocedure called calibration using inverse modeling of extreme conditions (CIMEC) mitigate theeffect of error that occurred in Ts measurements METRIC and SEBAL.35 Due to the lack of aridopen land with very high radiometric heating in agricultural areas, the assumption of zero latentheat flux (λEThot) in SEBAL was modified as non-zero latent heat flux in METRIC. This modi-fied assumption also accommodates the presence of residual moisture content at hot pixels andavoid the underestimation of H.36 Similarly, the assumption that equated the ET at the cold pixelto 1.05 times the reference ETwas not considered in METRIC due to its non-applicability duringearly growing seasons as well as non-growing seasons.34 The subjective nature of the anchorpixel selection process and the higher variability in the surface conditions for higher Ts valuesmake the selection of hot pixels difficult.37 The utilization of available energy (Rn − G) as anadditional input along with NDVI and Ts were useful in retrieving the candidate pixels withdistinct variation.38 By considering the soil moisture and available energy as influencing aux-iliary parameters for the endmember selection process, Mohan et al.39 proposed the integration ofsynthetic aperture radar (SAR) derived soil moisture into SEBAL for anchor pixel selectionprocess. The semiautomatic statistical approach by Allen et al., a fully automatic procedure
(a)
(b) (c)
Fig. 2 (a) Study sites across various continents for single-source and two-source models;(b) statistics of articles published in peer-reviewed journals focusing RS-based single-sourceET models; and (c) statistics of articles published in peer-reviewed journals focusing RS-basedtwo-source ET models. Prepared using the data collected from Ref. 31.
Mohan, Kanchirapuzha, and Varma: Review of approaches for the estimation of sensible heat flux. . .
Journal of Applied Remote Sensing 041501-5 Oct–Dec 2020 • Vol. 14(4)
Downloaded From: https://www.spiedigitallibrary.org/journals/Journal-of-Applied-Remote-Sensing on 29 Mar 2022Terms of Use: https://www.spiedigitallibrary.org/terms-of-use
based on exhaustive search algorithm by Bhattarai et al. and the modified version ASEBAL withan automated endmember selection process are the recent related developments in the domain ofanchor pixel selection process.40–42
Single-source models use aerodynamic resistance as an essential parameter that captures thespatial variability of H. The aerodynamic resistance and its component parameters (surfaceroughness lengths) are characterized by spatially varying canopy architecture.43 The roughnesslength calculation is sensitive to the changes in wind speed, soil, and canopy temperature andmay result in significant temporal variability. To account for these, a physically based model wasdeveloped by Su et al.16 to incorporate the surface condition and the aerodynamic variables fromthe ground. Such physical models require detailed information at the ground level at all scales ofapplications, and the scaling of the models from local to regional scales demanded a considerableamount of ground sampling.
RS-based ET models explicitly do not consider soil moisture variations for the estimation ofH, relying upon the assumptions that the Ts and NDVI indirectly consider and incorporate theinfluence of soil moisture.44 However, at water-stressed conditions, the radiometric temperatureis inadequate to represent the effect of soil moisture and biophysical parameters. At limitingconditions of soil moisture, z0h increases whereas z0m decreases, which leads to the changesin kB−1 values. The influence of kB−1 on varying soil moisture conditions contributed to thedevelopment of various empirical approaches, which included the soil moisture information intothe bulk transfer equation in SEBS.44–46 In METRIC, the incorporation of soil moisture relatedparameters is done through the Priestley–Taylor parameter (αPT) by choosing a value differentfrom the usual value of 1.26 according to the changes in soil moisture content. This modifiedapproach is often referred to as wMETRIC.47
In the case of METRIC and SEBAL, the estimate of Rn and H had a constant bias across thescene. The radiometric accuracy of the satellite data, the assumptions related to the models, andthe uncertainties in the parameters used for the estimation of surface roughness and wind speedwere the significant factors that influenced the magnitude of the bias.40 The application ofMETRIC and SEBAL in arid and non-agricultural areas resulted in the overestimation of H,inferring that both the models are not suitable for sites with extreme climatic conditions.48,49
Unlike SEBAL and METRIC, the application of SEBS in non-agricultural areas becomes ver-satile due to its non-subjective approach for the selection of the extreme wet and dry limits.Among the single-source models, SEBS is more sensitive to changes in the surface to the airtemperature gradient (Ts − Ta) for the computation ofH compared to the individual effect of Ts,and it is more sensitive than the surface aerodynamic parameters.50–52 The SEBAL and METRICavoided the direct use of Ts by adopting the near-surface temperature gradient (dT) estimated byCIMEC process, which eliminates the systematic bias in the calculated Ts values.
53 When com-paring the performance of the single-source iterative models, the major difference was observedin the estimation ofH. SEBAL consistently underestimatedH and showed more than 65% varia-tion from reference eddy covariance (EC) measurements.54 The deviations for METRIC andSEBS were 34% and 56%, respectively.55,56 For λET, all three models exhibited less variations(SEBAL-13.5%, METRIC-15.1%, and SEBS-20.6%) compared to H. The higher deviations ofH in these models could be explained by their inability to partition the soil and vegetation com-ponent fluxes and their extreme sensitivity to the calibration pixels. A modified approach calledM-SEBAL was introduced to decrease the bias inH in SEBAL by determining the anchor pixelsfrom VFC-LST space. This approach minimized the deviation of H from 65% to 24.8%.54 Theabove values are only for reference to show the general trend of each model outputs.
6.2 Sensible Heat Flux Estimation Approaches in Single-SourceNon-Iterative ET Models
The single-source models of non-iterative category compute H as a residual of other energybalance components, using evaporative fraction (EF). Models such as surface energy balanceindex (SEBI), simplified surface energy balance index (S-SEBI), simplified surface energybalance (SSEB) model, and operational simplified surface energy balance (SSEBop) modelare listed under this category. Among these models, SSEB has tested for all climatic zonesexcept the polar zone, whereas its operational version SSEBop was tested only for tropical and
Mohan, Kanchirapuzha, and Varma: Review of approaches for the estimation of sensible heat flux. . .
Journal of Applied Remote Sensing 041501-6 Oct–Dec 2020 • Vol. 14(4)
Downloaded From: https://www.spiedigitallibrary.org/journals/Journal-of-Applied-Remote-Sensing on 29 Mar 2022Terms of Use: https://www.spiedigitallibrary.org/terms-of-use

dry climatic zones. Minimal studies are available for SEBI and tested for very few locationsgrouped under continental and dry climatic zones. The S-SEBI, the simplified version ofSEBI, has successfully applied at dry, temperate, and continental zones.
6.2.1 Feature space-based models
S-SEBI is a simplified operational RS-based model, in which the extreme temperatures at theboundary conditions are extracted from the Ts-reflectance spectral space. The two assumptionsfollowed in S-SEBI are the existence of constant atmospheric conditions as well as the presenceof calibration pixels within the area of application.57 S-SEBI utilizes Ts-reflectance feature spaceto determine EF without any ancillary data sets or meteorological data from the field.57,58 S-SEBImodel is empirical, which restricts the extensive application of the model to global scales. Henceit is essential to calibrate the model for diverse climatic conditions. For instance, in semiaridareas with vegetation, EF exhibits very low values as a water deficit indicator, and therefore,a non-evaporative fraction-based approach was proposed for estimating sensible heat flux.59
Since S-SEBI is a pure image-based model that entirely relies upon the feature space for modelparameters, the current focus of the research is to reduce the atmospheric and sensor relatederrors from the feature space. The use of surface albedo calculated by weighted surface reflec-tance approach is generally adopted for the feature space creation in S-SEBI. To improve itsperformance, a proper view zenith angle correction is essential. The surface broadband albedocalculated by the integration of bidirectional reflectance distribution function was found to beeffective for the estimation of surface energy balance components in S-SEBI.60 Regarding theperformance of the model compared to other single-source models, S-SEBI showed comparableperformance with SEBAL and METRIC at arid conditions and the model was less suitable forwet conditions as it overestimated H.61
6.2.2 Non-feature space-based models
The SEBI became the precursor of RS-based ET models, which laid the strong theoretical foun-dations for all the present-day single-source models. It is the modified parametrization of cropwater stress index developed by Jackson et al.62 and obtained by simultaneously solving theenergy balance equation and the profile equations for sensible heat flux and latent heat fluxat two extreme conditions of potential ET and zero ET in the study area. SEBI estimates theH based on the difference between the plant surface temperature and air potential temperatureat the top of the atmospheric boundary layer.63 The model is unique because of its capability tohandle situations when sufficient wet and dry pixels are not available in the study area. It uses thetemperature difference obtained either from radio soundings or weather prediction models forestimating boundary conditions. The requirement of essential meteorological variables from theupper boundary of planetary boundary layer (PBL) made the model less operational as well asless compatible for RS datasets.64
SSEB is a regional scale model that inherits the concept of “near-surface temperature gradient(dT)” from SEBAL and METRIC for the actual ET estimation. The linearity assumption ofsensible heat flux in SEBAL (H is proportional to dT) is extended for the estimation of latentheat flux in SSEB. The calibration pixels that correspond to zero ET and potential ET are used toestablish a linear relationship between the temperature gradient and the actual ET, which furtheremployed to derive the EF for any pixel within the study area. The SSEB model was modified toSSEBop by predefining the hot and cold extremes, which enhanced its potential as a large-scaleoperational RS model.65 The models such as SSEB, SEBAL, and METRIC designate thecandidate pixels for a limited period, during which a uniform hydroclimatic condition exists.In actual field conditions, the candidate pixels change their locations within the same study areaas per the variations of environmental factors. Contrary to this, the assumption of changing can-didate pixels was discarded in SSEBop as it found to be less influential in the context of theaccuracy of outputs obtained. Therefore, the candidate pixels were predefined and remained assame for the entire period for which the fluxes are estimated. The underestimation of H at dryopen areas is a major limitation of the model. At vegetated areas, SSEB exhibits comparableperformance with SEBAL and METRIC.66
Mohan, Kanchirapuzha, and Varma: Review of approaches for the estimation of sensible heat flux. . .
Journal of Applied Remote Sensing 041501-7 Oct–Dec 2020 • Vol. 14(4)
Downloaded From: https://www.spiedigitallibrary.org/journals/Journal-of-Applied-Remote-Sensing on 29 Mar 2022Terms of Use: https://www.spiedigitallibrary.org/terms-of-use

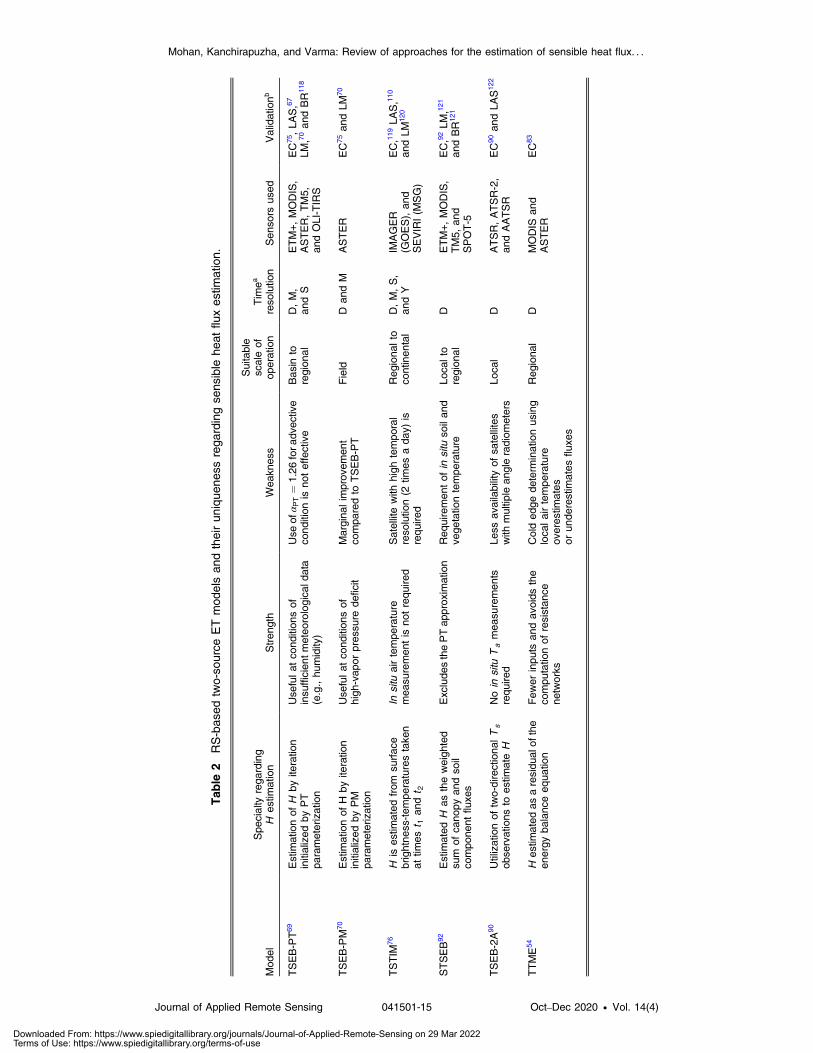
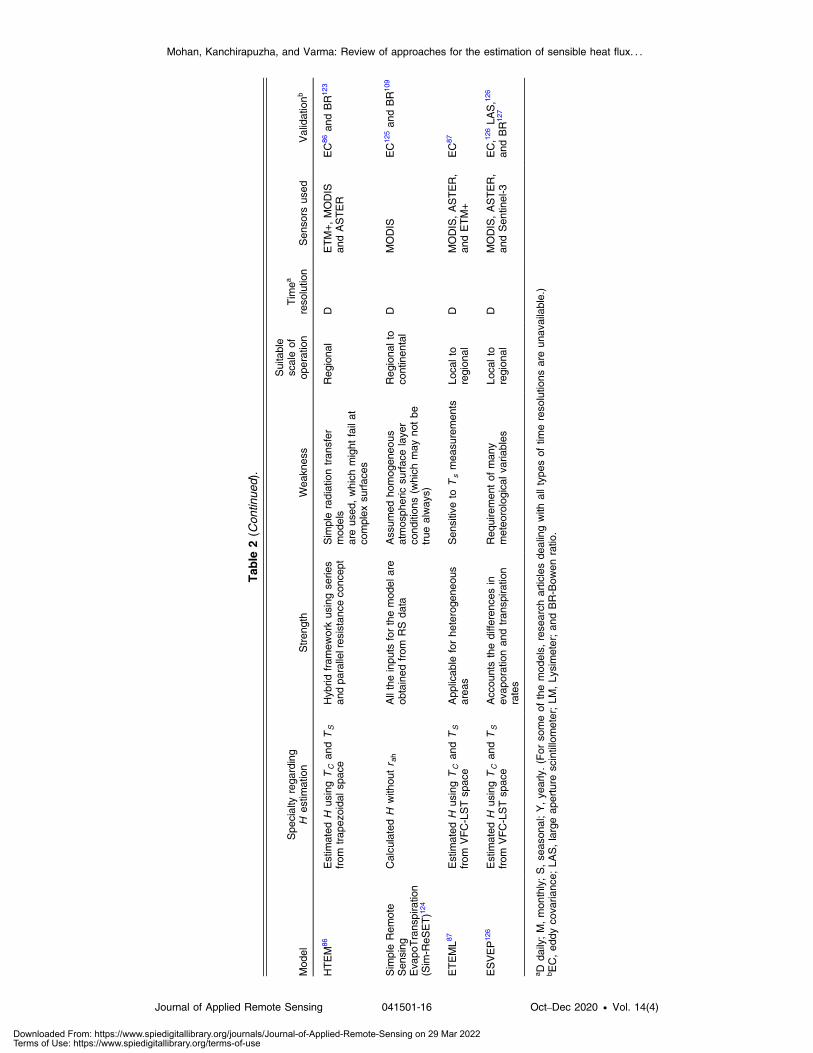
7 Sensible Heat Flux Estimation Approaches in Two-Source ET Models
The two-source approach is more robust than the single-source approach due to its ability topartition the canopy and soil flux components. It also handles the influences of atmosphericand the sensor look angle effectively. The two-source models predict more accurate valuesof H in sparse canopy conditions and provide a reliable physical framework for capturing thevariations of the aerodynamic resistance compared to single-source models.67,68 The two-sourcemodels are differentiated based on the approaches adopted for partitioning the directional radio-metric surface temperature into canopy and soil temperatures (TC and TS). Among iterative mod-els, two-source energy balance-Priestley–Taylor (TSEB-PT) and two-source time integratedmodel (TSTIM) and its operational versions such as atmosphere-land exchange inverse(ALEXI) model were tested for all climatic zones except polar. Only limited studies are availablefor two-source energy balance-Penman–Monteith (TSEB-PM), and it was tested only for dryclimatic conditions. Among non-iterative models, the best performing model hybrid dual-sourcescheme and trapezoid framework-based evapotranspiration model (HTEM) was tested for dryand continental climates only. The two-source energy balance model-two angle (TSEB-2A) thatutilizes two-directional surface temperature has few studies available and was tested for dry,tropical, and continental climates [refer Fig. 2(a)]. The statistics of the peer-reviewed articlespublished during the last 10 years showed that the TSEB-PT model gained more attention com-pared to other RS-based TSEB models [Fig. 2(c)].
7.1 Sensible Heat Flux Estimation Approaches in Iterative Two-Source ETModels
The TSEB-PM69 and TSEB-PT70 are the two different approaches, under the iterative category oftwo-source models, which differ mainly based on the fundamental equation used to estimate theinitialization parameter (λEC) for iteration. The TSEB-PT model calculates λEC by the PT equa-tion, assuming potential transpiration whereas, in TSEB-PM the calculation follows PM equa-tion. In TSEB-PT, the iteration begins by assigning the value of PT coefficient (αPT) as 1.26,which progressively assumes smaller values in the subsequent iterations. The iteration proceduredynamically estimates various energy balance components as detailed by Norman et al.69 Duringeach iteration, new values of TC and TS are calculated from TradðθÞ and used to estimate com-ponent sensible heat fluxes (HC and HS) by substituting in bulk transfer equation. The soil com-ponent of the latent heat flux (λES) is estimated during the progress of the iteration procedure as aresidual of overall energy balance components. During each iteration, the value of componentfluxes is progressively revised. When the λES stabilizes to a positive value the solution for com-ponent fluxes are achieved. In the case of the water-stressed condition, the value of λEC is over-estimated, which converge to a negative value of λES. In such cases, the λES is set to zero, andHS
and HC are recalculated. The use of the constant initial value of αPT (1.26) for all the cases ofatmospheric, soil, and ground cover conditions is the major limitation of TSEB-PT approach.At advective conditions, the actual value of αPT is much higher than 1.26, which might lead tooverestimation of H.71 In order to account for varying ground cover conditions, the fractionalvegetation cover, f in the PT equation was modified by an empirical function of soil adjustedvegetation index.72 The influence of changing atmospheric and soil moisture conditions wasaddressed by a modified approach Gc-TSEB, which incorporated the canopy conductanceGc (a function of LAI, water vapor deficit, and visible radiation) in the model to calculate theenergy balance components.73
Unlike the PT approach, the PM approach requires vapor pressure deficit and canopy resis-tance information to execute the model. This could account for the increased transpiration ratedue to advective conditions as well as for the low relative humidity cases. TSEB-PM approachestimated more accurate soil and vegetation component temperatures and showed slightly supe-rior performance compared to the PT approach at normal conditions.74 The unavailability of airtemperature and wind speed measurements for a larger area hinder the applicability of TSEB-PTand TSEB-PM approaches for larger-scale applications. When comparing the performance ofPT and PM approaches, both the models showed almost similar performance with a slight upper-hand for TSEB-PM. The root-mean-square error (RMSE) of estimated H was 44.9 and
Mohan, Kanchirapuzha, and Varma: Review of approaches for the estimation of sensible heat flux. . .
Journal of Applied Remote Sensing 041501-8 Oct–Dec 2020 • Vol. 14(4)
Downloaded From: https://www.spiedigitallibrary.org/journals/Journal-of-Applied-Remote-Sensing on 29 Mar 2022Terms of Use: https://www.spiedigitallibrary.org/terms-of-use
47.5 Wm−2 for TSEB-PM and TSEB-PT, respectively.75 The λET also showed a similar trend(TSEB-PM-70.6 Wm−2 and TSEB-PT-75.3 Wm−2).
TSTIM is a time-integrated iterative two-source model essentially meant for regional tocontinental-scale applications.76 The model is an extension of TSEB models that use two instan-taneous satellite acquisitions to estimate the sensible heat flux. The two satellite observations,which are acquired just after the sunrise and before noon, reduce the effect of advection to areasonable extent and avoid the requirement of local calibration and precise air temperaturedata.77 The two submodels associated with the TSTIM are surface layer component (SLC) andPBL component. The SLC follows the TSEB modeling schemes that compute instantaneoussensible heat fluxesH1 andH2 using radiometric temperature data at times t1 and t2 by assuminga linear increase in the sensible heat flux.78 The ALEXI model is a well-known time-integratedmodel that retrieve the surface energy fluxes at 5 to 10 km resolution using the two instantaneousvalues of sensible heat flux.79 Most of the studies related to ALEXI used the LST from GOES ata temporal resolution of 30 min or from Meteosat Second Generation (MSG) retrieved at every15 min. The spatial resolution of GOES and MSG are 4 km and 3 km, respectively, at nadir.
7.2 Sensible Heat Flux Estimation Approaches in Non-Iterative Two-SourceET Models
The requirement of locally measured surface roughness length and wind speed narrowed theapplication potential of two-source iterative models for heterogeneous landscapes with non-linear surface characteristics. In iterative PTand PM formulations, the ambiguity of the initializingparameters induced significant biases in the H estimations. The use of directional radiometrictemperature to estimate the soil and vegetation component temperatures eliminates the use ofinitializing parameter to estimate the canopy transpiration. The non-iterative two-source modelsestimate component temperatures either using simultaneous observations of directional temper-atures from two viewing angles, or by surface temperature measurements from a single viewingangle. The retrieval of component temperatures by single Ts observation is complex and requiresa “VFC-LST feature space” and in situ meteorological data sets. Those models that utilize theVFC-LST feature space are classified as non-iterative feature space-based models.
7.2.1 Non-iterative feature space-based models
The scatter plot of VFC versus LST forms a trapezoidal or triangular space for an area with awide range of land-use and land-cover types. The trapezoidal spectral space could adequatelyaccount for the water stress, canopy transpiration, and the aerodynamic effects of the surfacecompared to triangular space.80,81 The VFC-LST space-based models gained attention due to itssite-independent model parameterization capability. These models decompose the TradðθÞ intoTC and TS using soil surface moisture availability isopleths superimposed on trapezoidal space.81
The warm edge and the cold edge of the trapezoidal space (Fig. 3) define the boundary conditionfor VFC-LST space-based models. There exist several isopeistic lines within these boundaryconditions that represent the same soil surface moisture availability for the same TS values.82
One of the earlier versions of the VFC-LST space-based patch model called two-source trap-ezoidal model for evapotranspiration (TTME) utilizes the trapezoid framework and isopleths ofsoil surface moisture availability to calculate energy balance components. The Ts;max that definesthe upper boundary conditions requires stability corrected aerodynamic resistance through aniterative process (non-iterative for estimating surface energy balance components), and theTs;min corresponds to the spatially averaged air temperature (Ta). The TTME uses these boun-dary conditions for decomposing radiometric temperatures into soil and canopy component tem-peratures. These component temperatures are subsequently used for calculating componentevaporation fractions. The model estimates H as a residual of the energy balance equation, andthe values are sensitive to the boundary conditions.83 HTEM is a modified form of TTME modelthat adopts a hybrid scheme of the layered and the patch approaches. The soil and vegetationcomponents ofH are estimated directly using component temperatures in bulk transfer equation.The procedure for the retrieval of component temperatures is the same as that of TTME model.Both TTME and HTEM rely upon the average value of Ta, albedo, aerodynamic resistance, and
Mohan, Kanchirapuzha, and Varma: Review of approaches for the estimation of sensible heat flux. . .
Journal of Applied Remote Sensing 041501-9 Oct–Dec 2020 • Vol. 14(4)
Downloaded From: https://www.spiedigitallibrary.org/journals/Journal-of-Applied-Remote-Sensing on 29 Mar 2022Terms of Use: https://www.spiedigitallibrary.org/terms-of-use

water vapor pressure of the entire image, which may lead to the incorrect temperaturetransformations.84 The modified version of trapezoidal approach enhanced two-source evapo-transpiration model for land (ETEML) focuses on estimating canopy–air temperature gradient(TC − Ta) and soil–air temperature gradient (TS − Ta), which eliminates the need for spatiallyvarying air temperature. In ETEML, physically based theoretical equations define the boundaryconditions rather than the empirical equations. The conventional trapezoidal space used inTTME, HTEM, and ETEML assumed to have a horizontal wet edge, which was determinedby the lowest air temperature in the study area. The invalid cold edge assumption often ledto the underestimation of the EF. The modified two-stage LST-VFC feature space-based,“two-source model for estimating evaporative fraction (TMEF)” succeeded this limitation bycalculating the cold edge by PT equation.85 The comparison of LST-VFC space-based modelsrevealed that the H estimation of HTEM showed the least deviation (14.5%) from referenceEC measurements compared to ETEML (18%) and TTME (24.5%).83,86,87 In the case of λET,the values are 9.1%, 1.5%, and 24.7% for HTEM, ETEML, and TTME, respectively.
7.2.2 Non-iterative non-feature space-based models
The directional radiometric surface temperature viewed from two different sensors can inferthe canopy geometry and the vertical canopy temperature profile. It also nullifies the direc-tional influences of TS while substituting for T0.
88 TSEB-2A showed lesser mean absolutepercentage error compared to single-source iterative models (λE-15% and H-35% from ECmeasurements89). The limited availability of sensors with simultaneous measurements in twoview angles made this concept less operational. The along track scanning radiometer(ATSR) onboard ERS-1 satellite, advanced along-track scanning radiometer (AATSR) onboardTerra satellite, and ASTR-2 onboard ERS-2 were used in various studies to prove the strength ofthe dual view angle approach.90,91 The data from SLSTR of Sentinel-3 are a possible data sourceto implement the dual angular approach (refer to Table 4 in Appendix A for sensor details). TheTSEB-2A calculates TC and TS, by solving two simultaneous equations for radiometric surfacetemperature ðTradðθÞ ¼ ffðθÞT4
C þ ½1 − fðθÞ�T4Sg
14Þ from two different view angles (θ1 and θ2).
The dual-angle approach eliminates the dumping of bias into H, as it directly calculates sensibleheat flux from TC and TS. The H estimation is extremely sensitive to the clumping of vegetationcover, and its importance was proved in the initial trials of TSEB-2A using the airborne datacollected during First International Satellite Land Surface Climatology Project (ISLSCP) FieldExperiment (FIFE).89 The simplified two-source energy balance (STSEB) model is a simplifiedpatch version of TSEB model of non-iterative class, which excludes the PT approximation andestimates the total sensible heat flux as the weighted sum of canopy and soil component fluxes at
Fig. 3 VFC-LST feature space, applicable to the models such as TTME, HTEM, and ETEML.
Mohan, Kanchirapuzha, and Varma: Review of approaches for the estimation of sensible heat flux. . .
Journal of Applied Remote Sensing 041501-10 Oct–Dec 2020 • Vol. 14(4)
Downloaded From: https://www.spiedigitallibrary.org/journals/Journal-of-Applied-Remote-Sensing on 29 Mar 2022Terms of Use: https://www.spiedigitallibrary.org/terms-of-use
the field scale. STSEB is an efficient model that requires fewer input variables compared toiterative TSEB models but necessary to collect the field-measured component temperatures.92
8 Unmanned Aerial Vehicles for Turbulent Heat Flux Estimation
The lack of sufficient in situ data sources for the validation of ET models and the requirementof the high-resolution dataset with frequent coverage prompted the utilization of UAV techniquesin the domain of surface energy budget.93 The UAVs provide economic and compact instrumen-tation for real-time monitoring of fluxes in precision farming. The fixed-wing UAVs are preferredover rotary wings for large-scale field applications where heavy RS cameras and micrometeoro-logical sensors are required. The multi-spectral and thermal infrared sensors attached to the UAVplatform bridge the gap in scale between the field-based and satellite-based observations. Modelssuch as SEBAL, METRIC, and TSEB-PT have been tested for UAVapplications, and the TSEB-PT have exhibited better potential for UAVapplications.94 These models are designed for satelliteimages with medium to coarse resolutions and modifications are required while using it for high-resolution UAV images. The larger data volume for smaller areas demands complex algorithms toachieve better results. TSEB-2T95 and deriving atmosphere turbulent transport useful to dummiesusing temperature (DATTUTDUT)96,97 are the two models that suit better for UAVapplications.The TSEB-2T model employs contextual Trad-NDVI space to estimate the soil and vegetationcomponent temperatures. The model identifies pure pixels of vegetation and soil from thehigh-resolution images for the estimation of TS and TC. In contrast to contextual models,DATTUTDUT model estimates EF solely from surface temperature information. The smallmulti-function research and teaching Sonde application proved the reliability of temperature andhumidity measurements from UAV platforms for the estimation of sensible heat flux.98,99
Another recent research related to surface flux estimations revealed that the wind speed, temper-ature, and relative humidity from UAVs were in good agreement with ground-based values andthe data quality was sufficient for the computation of the bulk heat transfer coefficient.100
9 LST and ET Models
The accurate estimation of LST is crucial in RS-based ET models due to its importance as aboundary condition. The first ISLSCP-FIFE reported an error of up to 100 wm−2 for instanta-neous H measurements due to variations in measured thermal infrared measurements.101 Theappropriate calibration and atmospheric correction of satellite-based thermal infrared observa-tions are essential to minimize these errors.102 Due to the complexities and cost of the technol-ogy, there are very few operational satellites with thermal bands available to the user community(refer to Table 4 in Appendix A for sensor details).
9.1 Thermal Remote Sensing Missions
The history of thermal RS related to ET models traces back to 1962 with the launch of TIROS-II.During the early 1970s, the aerial RS was the only mode of getting thermal images for under-standing agricultural crop stress. The launch of GOES (in 1975) and NOAA/AVHRR (in 1979)satellites with thermal sensors became the significant milestones toward the use of satellite RStechnology for surface energy balance studies. These missions delivered thermal images with ahigh temporal resolution (daily) and coarse spatial resolution (1 km). Landsat 5 mission (1985)was the first mission that collected thermal images with a relatively high spatial resolution(120 m) at the cost of its temporal resolution (16 days). Terra (1999) and Aqua (2002) missionswith MODIS were of the same category as that of AVHRR, in spatial and temporal resolution,but with a large number of optical and infrared bands that could collect vegetation- and soil-related information along with thermal bands. Suomi NPP or JPSS-1 (2011) with VIIRS sensorimproved the spatial resolution to 750 m keeping the daily temporal resolution. ERS-1 (1991)and ERS-2 (1995) satellites delivered thermal images of the same area from two view angles intandem to facilitate the development of two-source ET models. The collection of thermal imageswith a high spatial and temporal resolution was a challenge for both polar and geostationary
Mohan, Kanchirapuzha, and Varma: Review of approaches for the estimation of sensible heat flux. . .
Journal of Applied Remote Sensing 041501-11 Oct–Dec 2020 • Vol. 14(4)
Downloaded From: https://www.spiedigitallibrary.org/journals/Journal-of-Applied-Remote-Sensing on 29 Mar 2022Terms of Use: https://www.spiedigitallibrary.org/terms-of-use

satellites. Use of two polar-orbiting satellites (Landsat) in tandem was a solution to this problembut constrained to the radiometric quality of the data due to two different sensors. ECOSTRESSmission is a new solution to the problem mentioned above, where the thermal scanner is onboardInternational Space Station, which would deliver thermal images with high spatial (69 m) andtemporal (daily) resolution. ECOSTRESS is a unique mission where the users are provided withready-made ET maps in 30-m resolution using ALEXI and PT-JPL (Priestley–Taylor JetPropulsion Laboratory) algorithm. The latest version of ECOSTRESS is expected in 2020or 2021. There are missions such as HyspIRI and TRISHNA in the conceptual and planningstage that could deliver similar products with high spatial and temporal resolution. Refer toTable 3 for a comprehensive list of operational and future thermal RS missions.
9.2 Data Assimilation Approaches
The two major approaches based on the use of LST for the estimation of turbulent heat fluxes arethe diagnostic/retrieval-based approach and DA approach.103 The retrieval approach mainlyfocuses on instantaneous heat flux estimations from satellite images, and a variety of empiricaland physical models discussed in this review comes under this category. The retrieval methodsestimate the turbulent heat fluxes only for the available instances of LST observations. In con-trast, the assimilation techniques capture the significant amount of information contained in thetemporal datasets of LST and estimate the turbulent heat fluxes for instances without LSTobservations.104 The recent research in the field of DA techniques yielded numerous techniquesthat are mainly grouped into variational data assimilation (VDA) techniques and ensemble tech-niques. VDA techniques utilize the force-restore equation or full heat diffusion equation to pre-dict LST by assimilating the known instances. By minimizing the difference between the RSderived LST and predicted LST, the optimum values of the unknown neutral bulk heat transfercoefficient (CHN) and EF are estimated. The CHN is a function of changing phenology that variesmonthly, whereas the EF changes daily, and it is affected by soil moisture and LAI. The CHN
scales the sum of turbulent heat fluxes, and EF scales the partitioning of turbulent heat fluxes.105
Among single-source and two-source VDA schemes, the performance of two sources is com-paratively better due to the differences in cost functions for minimizing the observed and pre-dicted LST.103 The VDA approach performed better for sparse vegetated dry regions compared todense vegetated wet areas. The incorporation of daily precipitation as forcing input improved theresults in wet areas.106 The main limitation of VDA is that it does not consider the mutual in-fluence of water and energy in the soil plant atmosphere continuum. Therefore, soil moistureassimilation has a powerful influence on the improvement in heat flux predictions.107 Whenusing predicted LST in surface energy balance models, the uncertainties in H estimation byVDA schemes are mainly due to errors in the CHN and LSTestimates. Similarly, the uncertaintiesin λET are influenced by EF, CHN, and LST measurements.103
The ensemble Kalman filter (EnKF) and ensemble Kalman smoother (EnKS) are the twoapproaches that became better choices compared to the VDA approach. The ensemble approachesare efficient due to their easy formulation, non-linear capture, the ability to account for a widerange of measurement errors, and their capability to provide uncertainty estimates.108 The EnKFand EnKS mainly differ in their selection of inputs for the prediction process. In the EnKF, theprediction for a time t considers all available observations prior to and at time t, whereas in EnKSthe observations that are available prior to and subsequent to the time t are used. The criticalparameters related to the surface control and surface turbulence in ensemble methods are thesame as that of the VDA approach (i.e., CHN and EF), but estimated by a different approachcalled “state augmentation method.” The H and λET estimates from the EnKS scheme revealedthat the uncertainty of the estimatedH is related to the errors in EF,CHN, incoming solar radiation,and air temperature. Similarly, the uncertainty of λET depends only on the predictedH and EF.108
10 Influence of Scale Effects and Validation of ET Models
Validation and comparison of ET models have been conducted across the world in variousclimatic zones by methods such as the Bowen ratio, lysimeters, EC system, and large aperture
Mohan, Kanchirapuzha, and Varma: Review of approaches for the estimation of sensible heat flux. . .
Journal of Applied Remote Sensing 041501-12 Oct–Dec 2020 • Vol. 14(4)
Downloaded From: https://www.spiedigitallibrary.org/journals/Journal-of-Applied-Remote-Sensing on 29 Mar 2022Terms of Use: https://www.spiedigitallibrary.org/terms-of-use
scintillometers. (refer Tables 1 and 2). It is essential to compare the performance of models bymaintaining similar site conditions, sensor and field validation method. Adhering to these, thisreview compared the research outcomes of popular ET models at SMACEX site (Moisture–Atmosphere Coupling Experiment in central Iowa) and HiWATER-MUSOEXE site (HeiheWatershed Allied Telemetry Experimental Research in China) for various studies conductedbetween 2006 and 2018 (refer to Fig. 4). The SMACEX (41.87°N to 42.05°N, 93.83°W to93.39°W) and HiWATER-MUSOEXE (41.87°Nto 42.05°N, 93.83°W to 93.39°W) fall underhot summer continental climate and cold desert climate, respectively. For SMACEX andMUSOEXE sites, satellite data from ETM+ and ASTER, respectively, were considered forcomparison. The comparison based on RMSE and bias of λET and H showed that the VFC-LST feature space-based model HTEM exhibited an overall better performance, followed byTTME and ETEML for both the sites. Among single-source models compared at SMACEXsites, the SEBAL showed better performance statistics compared to SEBS and METRIC, andthe same results were obtained in a site nearby Oklahoma using OLI/TIRS data.130 The superiorperformance of SEBAL could not be generalized for all the ground cover conditions and climaticzones.30
The validation of the surface energy balance models depends on the spatial resolution of itsoutputs.131 The approach for validation of fine-resolution products is generally straightforwarddue to its scale correspondence with the ground measurements. For coarser-resolution products(>100 m, e.g., MODIS), the already validated fine-resolution products are used after up-scalingor aggregation.132 The methods such as simple averaging, nearest neighbor sampling, bilinearinterpolation, or bicubic interpolation are the usual techniques used in the aggregation process.The aggregation of the input bands of the ET models or the aggregation of its fine resolutionoutputs (fluxes) are the two main aggregation approaches. The effect of aggregation varies withmodels as well as the resolution to which the aggregation is targeted. A study conducted on theaggregation of RS images from 5 m (very high resolution) to 1 km and its impact on surfaceenergy balance components revealed that at spatial resolutions <30 m the difference inH valueswere negligible (2%) and it increased up to 24% at lower spatial resolutions.133 This could bedue to the impact of aggregation on the actual values of NDVI and Ts, and calibration pixels,which could influence the values of estimated H. Scaling can affect the values of aerodynamicresistance, calculated empirically from vegetation indices. In SEBS, the input aggregationapproach using a simple average of the pixel within a kernel window performed better in pre-serving the magnitude and the spatial distribution of fluxes. Contrary to this, the simple aver-aging procedure exhibited inferior performance in the case of flux aggregation.134 However, inthe case of SEBAL, both the input and output aggregation showed similar spatial patterns.135
In the case of METRIC, the sensible heat flux exhibited higher sensitivity to the aggregationprocess than the latent heat flux due to the non-linear changes of surface roughness parametersin the model.133 In the VFC-LST feature space-based ET models, the aggregation process has aconsiderable impact on the shape of the trapezoidal scatter plot, which would change the boun-dary conditions for ET estimation. The other components Rn and G are relatively insensitive tothe changes in spatial scales owing to the fact that these parameters are calculated from incom-ing solar radiation whose spatial variability is not intensive as in the case of vegetation and soilparameters.136 One of the main factors that hinder the scaling up of the popular RS-based ETmodels is the need of in situ air temperature data and wind speed data for the estimation of H.Though the single-source models such as METRIC and SEBAL avoided the use of near-surfaceair temperature by adopting dT approach, the requirement of u for the stability correctionrestricted its applications beyond the regional scale. Similarly, the dependence of TSEB-PTmodel on the in situ air temperature values limits its scalability for larger areas. In cases wherethe in situ air temperature data are unavailable, the capability of ALEXI to calculate Ta inter-nally was utilized to estimate higher resolution turbulent heat fluxes. This is achieved byALEXI flux disaggregation approach popularly known as DisALEXI.119 Though the disaggre-gation of ALEXI was proved to be efficient in estimating fluxes, the demand for computation-ally simple and disaggregation free method resulted in the TSEB-I method. The TSEB-I is ahybrid of single- and two-source approaches that estimates Ta by combining the self-calibrationconcept of SEBAL and the physically based land surface representation of TSEB. The air tem-perature was estimated using the cold pixel in the study area by sensible heat flux inversion
Mohan, Kanchirapuzha, and Varma: Review of approaches for the estimation of sensible heat flux. . .
Journal of Applied Remote Sensing 041501-13 Oct–Dec 2020 • Vol. 14(4)
Downloaded From: https://www.spiedigitallibrary.org/journals/Journal-of-Applied-Remote-Sensing on 29 Mar 2022Terms of Use: https://www.spiedigitallibrary.org/terms-of-use

Tab
le1
RS-bas
edsing
le-sou
rceETmod
elsan
dtheirun
ique
ness
rega
rdingse
nsible
heat
fluxes
timation.
Mod
elSpe
cialty
rega
rding
Hes
timation
Stren
gth
Wea
knes
s
Suitable
scaleof
operation
Tim
ea
reso
lutio
nSen
sors
used
Validationb
SEBI63
EFto
estim
ateH
Suitablewhe
nwet
and
drypixe
lsareno
tav
ailable
inthestud
yarea
Meteo
rologica
lvariables
from
the
uppe
rbo
unda
ryof
PBLrequ
ired
Reg
iona
lD
ETM+an
dASTER
Groun
d-ba
sed
EF63
S-SEBI57
EFto
estim
ateH
Imag
e-ba
sed
Nee
dco
nstant
atmos
pheric
cond
ition
sBas
inD
andM
ETM+,MODIS,ASTER,
AVHRR,TM5,
andOLI-TIRS
EC,57LA
S,57
andBR
109
SEBAL1
9Use
ofne
ar-surface
tempe
rature
grad
ient
Calibratio
nby
CIM
EC
Sub
jectivejudg
men
tof
calibratio
npixe
lsField
toregion
alD,M,S,
andY
ETM+,MODIS,ASTER,
AVHRR,TM5,
andOLI-TIRS
EC,54LA
S,110
LM,111
and
BR
112
METRIC
21Use
ofne
ar-surface
tempe
rature
grad
ient
Soilm
oistureat
hotpixe
lco
nsidered
Sub
jectivejudg
men
tof
calibratio
npixe
lsField
toregion
alD,M,S,
andY
ETM+,TM5,
OLI-TIRS,an
dMODIS
EC,55LA
S,110
LM,111
andBR
109
SEBS33
Use
sMOS
orBAS
theo
ryto
estim
ateH
Mod
ified
kB
−1
Too
man
yinpu
tpa
rameters
Loca
ltoregion
alD
andM
ATSR-2,ASTER,AATSR,
TM5,
ETM+,OLI-TIRS,AVHRR,
MODIS,HJ1
,an
dMERIS
EC,56LA
S,113
LM,114
andBR
44
SSEB11
5EFto
estim
ateH
Ope
ratio
nalm
odel
Highse
nsitivity
toT
sBas
into
region
alD,M,
andS
ASTER,MODIS,OLI-TIRS,
AVHRR,TM5,
andETM+
EC,65LM
,116
andBR
112
SSEBop
65Use
pred
efined
calibratio
npixe
lsOpe
ratio
nalm
odel
Con
stan
tdT
indu
cebias
ones
timated
fluxe
sBas
into
region
alD,M,S,
andY
ETM+,MODIS,an
dOLI-TIRS
EC,65LM
,117
andBR
109
a D,da
ily;M,mon
thly;S,se
ason
al;an
dY,ye
arly.(For
someof
themod
els,
rese
arch
articlesde
alingwith
alltyp
esof
timereso
lutio
nsareun
available.)
b EC,ed
dyco
varia
nce;
LAS,largeap
erture
scintillometer;LM
,Ly
simeter;an
dBR,Bow
enratio
.
Mohan, Kanchirapuzha, and Varma: Review of approaches for the estimation of sensible heat flux. . .
Journal of Applied Remote Sensing 041501-14 Oct–Dec 2020 • Vol. 14(4)
Downloaded From: https://www.spiedigitallibrary.org/journals/Journal-of-Applied-Remote-Sensing on 29 Mar 2022Terms of Use: https://www.spiedigitallibrary.org/terms-of-use
Tab
le2
RS-bas
edtwo-so
urce
ETmod
elsan
dtheirun
ique
ness
rega
rdingse
nsible
heat
fluxes
timation.
Mod
elSpe
cialty
rega
rding
Hes
timation
Stren
gth
Wea
knes
s
Suitable
scaleof
operation
Tim
ea
reso
lutio
nSen
sors
used
Validationb
TSEB-PT69
Estim
ationof
Hby
iteratio
ninitialized
byPT
parameterization
Use
fula
tco
ndition
sof
insu
fficien
tmeteo
rologica
ldata
(e.g.,hu
midity)
Use
ofαPT¼
1.26
fora
dvec
tive
cond
ition
isno
teffective
Bas
into
region
alD,M,
andS
ETM+,MODIS,
ASTER,TM5,
andOLI-TIRS
EC
75,LA
S,67
LM,70an
dBR
118
TSEB-PM
70Estim
ationof
Hby
iteratio
ninitialized
byPM
parameterization
Use
fula
tco
ndition
sof
high
-vap
orpres
sure
deficit
Margina
limprov
emen
tco
mpa
redto
TSEB-PT
Field
Dan
dM
ASTER
EC
75an
dLM
70
TSTIM
76H
ises
timated
from
surfac
ebrightne
ss-tem
peraturestake
nat
times
t 1an
dt 2
Insitu
airtempe
rature
mea
suremen
tis
notrequ
ired
Satellitewith
high
tempo
ral
reso
lutio
n(2
times
ada
y)is
requ
ired
Reg
iona
lto
continen
tal
D,M,S,
andY
IMAGER
(GOES),an
dSEVIRI(M
SG)
EC,119
LAS,110
andLM
120
STSEB92
Estim
ated
Has
theweigh
ted
sum
ofca
nopy
andso
ilco
mpo
nent
fluxe
s
Exclude
sthePTap
prox
imation
Req
uiremen
tof
insitu
soilan
dve
getatio
ntempe
rature
Loca
lto
region
alD
ETM+,MODIS,
TM5,
and
SPOT-5
EC,92LM
,121
andBR
121
TSEB-2A90
Utilizationof
two-directiona
lTs
obse
rvations
toes
timateH
Noin
situ
Tamea
suremen
tsrequ
ired
Less
availabilityof
satellites
with
multip
lean
gleradiom
eters
Loca
lD
ATSR,ATSR-2,
andAATSR
EC
90an
dLA
S12
2
TTME54
Hes
timated
asaresidu
alof
the
energy
balanc
eeq
uatio
nFew
erinpu
tsan
dav
oids
the
compu
tatio
nof
resistan
cene
tworks
Colded
gede
term
inationus
ing
loca
lairtempe
rature
overes
timates
orun
derestim
ates
fluxe
s
Reg
iona
lD
MODIS
and
ASTER
EC
83
Mohan, Kanchirapuzha, and Varma: Review of approaches for the estimation of sensible heat flux. . .
Journal of Applied Remote Sensing 041501-15 Oct–Dec 2020 • Vol. 14(4)
Downloaded From: https://www.spiedigitallibrary.org/journals/Journal-of-Applied-Remote-Sensing on 29 Mar 2022Terms of Use: https://www.spiedigitallibrary.org/terms-of-use
Tab
le2(C
ontin
ued).
Mod
elSpe
cialty
rega
rding
Hes
timation
Stren
gth
Wea
knes
s
Suitable
scaleof
operation
Tim
ea
reso
lutio
nSen
sors
used
Validationb
HTEM
86Estim
ated
Hus
ingT
Can
dT
Sfrom
trap
ezoida
lspa
ceHyb
ridfram
eworkus
ingse
ries
andpa
rallelres
istanc
eco
ncep
tSim
pleradiationtran
sfer
mod
els
areus
ed,which
might
failat
complex
surfac
es
Reg
iona
lD
ETM+,MODIS
andASTER
EC
86an
dBR
123
Sim
pleRem
ote
Sen
sing
Eva
poTrans
piratio
n(Sim
-ReS
ET)1
24
Calcu
latedH
with
outr a
hAlltheinpu
tsforthemod
elare
obtained
from
RS
data
Ass
umed
homog
eneo
usatmos
pheric
surfac
elaye
rco
ndition
s(w
hich
may
notbe
true
alway
s)
Reg
iona
lto
continen
tal
DMODIS
EC
125an
dBR
109
ETEML8
7Estim
ated
Hus
ingT
Can
dT
Sfrom
VFC-LSTsp
ace
App
licab
leforhe
teroge
neou
sarea
sSen
sitiveto
Tsmea
suremen
tsLo
calto
region
alD
MODIS,ASTER,
andETM+
EC
87
ESVEP12
6Estim
ated
Hus
ingT
Can
dT
Sfrom
VFC-LSTsp
ace
Accou
ntsthediffe
renc
esin
evap
orationan
dtran
spira
tion
rates
Req
uiremen
tof
man
ymeteo
rologica
lvariables
Loca
lto
region
alD
MODIS,ASTER,
andSen
tinel-3
EC,126
LAS,126
andBR
127
a Dda
ily;M,mon
thly;S,se
ason
al;Y,ye
arly.(For
someof
themod
els,
rese
arch
articlesde
alingwith
alltyp
esof
timereso
lutio
nsareun
available.)
b EC,ed
dyco
varia
nce;
LAS,largeap
erture
scintillometer;LM
,Ly
simeter;an
dBR-Bow
enratio
.
Mohan, Kanchirapuzha, and Varma: Review of approaches for the estimation of sensible heat flux. . .
Journal of Applied Remote Sensing 041501-16 Oct–Dec 2020 • Vol. 14(4)
Downloaded From: https://www.spiedigitallibrary.org/journals/Journal-of-Applied-Remote-Sensing on 29 Mar 2022Terms of Use: https://www.spiedigitallibrary.org/terms-of-use

method.137 A study conducted using DisALEXI, TSEB-I, and TSEB-PT revealed that the esti-mated air temperature showed an average difference in the order of 1 K only.137 Similarly, theneed for spatially varying air temperature restricts the HTEM to scale its application from fieldto regional scales. By coupling with a simple time-integrated ABL model, the modified HTEMwas able to perform better than its basic version and the RMSE was found to be <1 mmd−1. Theestimated value of Ta, by HTEM-ABL, was in close agreement with the in situ measuredvalues.138 The research outcomes revealed that the architecture of a model free from in situTa measurement might not ultimately contribute to its scalability. The best instance isTSEB-PT, where the use of simultaneous directional radiometric temperatures could alleviatethe need of Ta but its greater dependency on in situ wind speed disable the model for larger-scale applications. A simple temperature domain two-source model (TD-TSEB) is a model thatdoes not use wind speed measurements to estimate sensible heat flux, but it requires in situ Ta asan input parameter. The moderate sensitivity of TSEB-TD to Ta values promoted its successfulapplication for larger river basins.139
10.1 Milestones
This review recapitulates the essential milestones of research and developments in the domainof sensible heat flux estimation through RS-based methods (Table 4 in Appendix A) for the last120 years. The events are selected based on the contribution of research outcomes for furtherresearch associated with sensible heat flux. The milestones facilitate to categorize the researchperiod into different focal periods of development. Till 1970, most of the research focussed onfundamental research related to micrometeorology, plant physiology, and its relation to ET,canopy temperature, and aerodynamic resistance. The RS-based ET estimation attained more
(a)
(b)
Fig. 4 (a) Comparison of RS-based ET models using SMACEX data (SEBAL,54 METRIC,55
SEBS,128 TSEB-PM,55 TTME,83 HTEM,86 and ETEML87) and (b) comparison of RS-based ETmod-els using HiWATER-MUSOEXE data (SEBS,56 TSEB-PM,75 TSEB-PT,75 HTEM,75 andETEML129).
Mohan, Kanchirapuzha, and Varma: Review of approaches for the estimation of sensible heat flux. . .
Journal of Applied Remote Sensing 041501-17 Oct–Dec 2020 • Vol. 14(4)
Downloaded From: https://www.spiedigitallibrary.org/journals/Journal-of-Applied-Remote-Sensing on 29 Mar 2022Terms of Use: https://www.spiedigitallibrary.org/terms-of-use

importance between 1970 and 1990 due to the accelerated developments in the satellite RStechnology. The evolution of the thermal imaging sensors and their capability to estimateLST has revolutionized the RS-based ET research. The period after 1990 till 2019 was theperiod of “RS-based ET models,” during which many single-source and two-source modelswere proposed and validated.
10.2 Current Research Activities
Though the two-source models are gaining more attention within the research community, thesingle-source models still continue to contribute through rigorous revisions for the last 10 years.Among the single-source models, SEBS, SEBAL, and METRIC are mainly modified inten-sively. In SEBS, the research activities are mainly focussed on the incorporation of the soil mois-ture information into the model for the improvement of the accuracy of H estimation. Thedomain of the anchor pixel selection process and its automation are the primary focus in thecase of SEBAL and METRIC. In TSEB models, the non-iterative VFC-LST space-based modelsare getting more attention due to its simplicity and better performance. Current research activitiesfocus on delineating VFC-LST space boundaries appropriately. In two-source iterative models,the research mainly focused on the value of αPT, which is an initialization parameter for theiteration process. Between the years of 1990 and 2020 (period of RS-based ET models), themain research focus was to improve the parameterization of roughness lengths, aerodynamicresistance, canopy resistance, and soil resistance. Statistics of the research activities for the last10 years revealed that the parameterization of roughness length and aerodynamic resistance wasthe central area of research (Fig. 5). The application of UAV images in the context of turbulentheat flux estimation is one of the primary focus of the current area of research. There is anaccelerated development in the UAV hardware and related algorithms in order to facilitate thetransition of the ET models to replace satellite images with UAV products. The near real-timemonitoring of ET is the need of the time by utilizing the UAV outputs as better inputs to two-source models such as TSEB-PT, TSEB-PM, and TSTIM. Field crop-based calibration of themodels based on leaf area index or canopy height and growth stages makes the RS-based ETdomain more crop and field-specific. The application of UAV images in the context of turbulentheat flux estimation need to be refined further by alleviating the challenges, which include theradiometric accuracy of thermal images attributed to low signal-to-noise ratio, camera noise,interimage sensor noise, and atmospheric conditions.140 The existing surface energy balancemodels rely mainly upon optical dataset for retrieving the parameters of the model either director in the indirect form and the potential of SAR dataset such as ESAs Sentinel-1A/1B with6 days of temporal resolution is less explored. Its high spatial (20 m) and temporal resolution(6 days) make the mission suitable for exploring the possibilities of retrieving crop structuralparameters and soil moisture that can be incorporated in the ET models. The thermal data with ahigh temporal and spatial resolution for surface energy balance models are an ideal requirement,
Fig. 5 Thrust area of research between 1990 and 2020. Prepared using the data collected fromRef. 31.
Mohan, Kanchirapuzha, and Varma: Review of approaches for the estimation of sensible heat flux. . .
Journal of Applied Remote Sensing 041501-18 Oct–Dec 2020 • Vol. 14(4)
Downloaded From: https://www.spiedigitallibrary.org/journals/Journal-of-Applied-Remote-Sensing on 29 Mar 2022Terms of Use: https://www.spiedigitallibrary.org/terms-of-use

and the possibility of disaggregating of MODIS LST using SAR data and Landsat 8 data isbeing explored.141
11 Current Challenges and Perspectives
The synapse between the challenges and the developments of RS-based H estimation techniqueswitnessed various facets of improvisations cornered mainly to the refinement of the architecture ofclassical ET models. The unwrapping of challenges of most of the RS-based models knocks at therole of the multitude of variant parameters that significantly contribute toward the robust modelarchitecture. This review attempted to identify the prominent challenges related to the RS-basedsensible heat flux estimation approaches using the insights obtained through the research out-comes across the globe. This review tried to address minor challenges related to each model alongwith model descriptions. The challenges listed below focussed entirely on the current thrust areaof research related to turbulent heat flux estimations using RS-based ET models.
• To modify the VFC-LST feature space-based models for ecosystems where the LST andVFC are positively correlated. The assumption of the inverse relationship between LSTand VFC in trapezoidal feature space-based models will not be valid for all types of eco-systems. At mid- and high-latitude regions (forest steppe ecosystem, high mountains, andtaiga), the increase in vegetation growth is proportional to the increase in temperature.142
At such conditions, the geometry of the trapezoidal space changes and the approaches forthe retrieval of boundary conditions to be modified.
• To incorporate a dynamic PT coefficient instead of a fixed value of 1.26 in RS-basedTSEB-PT model for the initialization of iteration. The fixed value of 1.26 applies to satu-rated conditions and vary with a multitude of parameters such as soil water stress, vaporpressure deficit, VFC, air temperature, and ground cover conditions.143 The TSEB modeldid not account the changes in the vapor pressure deficit and stomatal conductance in themodel formulation leading to higher TC and lesser H. Though the modified approachTSEB-PM has made a slight improvement in terms of RMSE of estimated flux, the nighttime ET by both the models showed negative values (not always).74 The TSEB-PT con-sistently showed this error and modification by a dynamic PT coefficient might address thislimitation.
• To modify the TSEB-2A model using satellite-based multi-angular thermal observations.Using airborne data, the TSEB-multi-angular model was successfully implemented forheterogeneous land surface conditions, which revealed its superior performance comparedto TSEB-2A model.89 The multi-angular implementation requires new satellite missionsthat could procure more than two thermal images simultaneously.
• To incorporate downscaled soil moisture products into ET models to enhance turbulentheat flux estimations. The spatial resolution available for soil moisture active passive mis-sion (SMAP) is 30 to 40 km with a volumetric accuracy of 0.04 m3 m−3 in the top 5-cmsoil layer, covered with moderately thick vegetation with canopy moisture content<5 kgm−3.144 The feasibility of downscaling soil moisture products to 1- to 5-km reso-lution using thermal bands of MODIS or Sentinel-3, is to be checked in future studies tosupport regional to continental scale ET estimations. There are successful attemptsreported in achieving soil moisture products at 10-km resolution using the synergy ofSMAP, AMSR2, and Sentinel-1 datasets.145 The soil moisture products obtained by down-scaling could be used to derive surface energy balance components for all-weatherconditions.
• Need for thermal remote sensing missions with high spatial and temporal resolutions. Theneed for increased cloud-free observations with the high spatial and temporal resolution isessential to estimate crop water requirements daily or weekly basis. The current thermal RSmissions deliver thermal data with moderate resolutions at the cost of poor temporalresolutions. The future missions such as ECOSTRESS (new version), HysPIRI, andTRISHNA are promising thermal RS ventures that would provide better datasets forET models. Refer to Table 3 for future thermal RS missions by various space agencies.Details of operational thermal RS missions are included in Table 4 in Appendix A.
Mohan, Kanchirapuzha, and Varma: Review of approaches for the estimation of sensible heat flux. . .
Journal of Applied Remote Sensing 041501-19 Oct–Dec 2020 • Vol. 14(4)
Downloaded From: https://www.spiedigitallibrary.org/journals/Journal-of-Applied-Remote-Sensing on 29 Mar 2022Terms of Use: https://www.spiedigitallibrary.org/terms-of-use

12 Conclusions
The current review spans across the research conducted to date in the area of sensible heat fluxcomputations using RS-based ET models. The evolution of new-generation surface energy bal-ance models for turbulent flux estimation, integrated with satellite sensor advances in the field ofenvironmental RS, were discussed in the review, citing the milestones of developments startingfrom classical PM equation. The conceptual framework of classical models that triggered andaccelerated the development of RS-based sensible heat flux models are emphasized in the begin-ning sections. The relevant research outcomes of each model were analyzed and summarized theessential characteristics related to sensible heat flux estimation in Tables 1 and 2. Spatial dis-tribution of the sites where each model was executed is mapped based on the published articlesunder each model. It aids in the comprehensive understanding of climatic zones, in which themodels are being tested. A simple classification scheme for the RS-based ET models was pro-posed based on the different approaches followed for the sensible heat flux estimation as iterative
Table 3 Details of operational and future satellite missions with thermal infrared sensors
SensoraSatellite orpayload Launch (year)
Revisit(days)
Resolutionb
(m)Spaceagency
Future missions
TIRS-2 Landsat-9 2020 16 100 NASA
ECOSTRESS ISS Post-2020 3 to 5 69 NASA
FCI MTG 2021 Daily 2000 TAS France
SLSTR Sentinel-3C 1000 Daily 2021 ESA
VIIRS JPSS-2 Post-2021 Daily 750 NASA
SLSTR Sentinel-3D Post-2021 Daily 1000 ESA
HyspIRI SBG Conceptual Post-2023 5 60 NASA
TRISHNA (Feasibility stage) Post-2024 3 50 ISRO andCNES
VIIRS JPSS-3 Post-2026 Daily 750 NASA
VIIRS JPSS-4 Post-2031 Daily 750 NASA
Operational missions
ETM+ Landsat 7 1999 16 60 NASA
MODIS Terra and Aqua 1999 and 2002 16 1000 NASA
SEVIRI Meteosat-8, 9, 10, 11 2002, 2005, 2012,and 2015
Daily 3000 ESA
AVHRR NOAA-18, 19 2005 and 2009 Daily 1000 NASA
AVHRR/3 Metop-A, B, C 2006, 2012, 2018 Daily 1000 ESA
TIRS Landsat-8 2013 16 100 NASA
VIIRS Suomi NPP, JPSS-1 2011 and 2017 Daily 750 ESA
AHI Himawari-8, 9 2015 and 2016 Daily 2000 JAXA
ABI GOES-16, 17 2016 and 2018 Daily 2000 NASA
SLSTR Sentinel-3A, 3B 2016 and 2018 Daily 1000 ESA
ECOSTRESS ISS 2018 Daily 69 NASA
aSensors with spatial resolution ≤3000 m are considered.bSpatial resolution of thermal bands.
Mohan, Kanchirapuzha, and Varma: Review of approaches for the estimation of sensible heat flux. . .
Journal of Applied Remote Sensing 041501-20 Oct–Dec 2020 • Vol. 14(4)
Downloaded From: https://www.spiedigitallibrary.org/journals/Journal-of-Applied-Remote-Sensing on 29 Mar 2022Terms of Use: https://www.spiedigitallibrary.org/terms-of-use

and non-iterative categories. This review also discussed the role of advance RS techniques suchas UAVs and the DA techniques under the purview of turbulent heat flux estimations in ETmodels. The ET models tested at SMACEX and HiWATER-MUSOEXE sites revealed that thetwo-source feature space-based model, HTEM performed better compared to all other models.
13 Appendix A: Milestones
Table 4 presents the chronological order of research and developments in the domain of sensibleheat flux estimation with emphasize on the remote sensing techniques.
Table 4 Milestones of research activities related to sensible heat flux estimation.
Year Key research contributions
1900 Concept of resistance for explaining the diffusion of water vapor from leaves5
1921 The wind speed, the water surface temperature, the eddy diffusivity, distribution of water vapor abovethe surface, and their effect on evaporation was analyzed146
1930 The main driving factor for fluctuations in evaporation is the mean air temperature147
1940 Themain resistance to evaporation from a surface is due to a thin layer of air just above the surface148
1948 Penman’s equation1
1951 Big-leaf model149
1954 Experimental validation of MO similarity theory150
1956 Modified Penman’s equation by adding stability correction151
1960 Aerodynamic resistance could be calculated from wind speed and surface resistance152
1960 The actual source/sink for mass, heat, and momentum are located at different levels153
1962 Radiometric temperature and the air temperature difference is used for estimating ET154
1962 Leaf temperature and its relation with transpiration was studied155
1962 Surface temperature from meteorological satellite TIROS-II156
1968 kB−1 parameter8
1970 Flux gradient relationship for momentum readdressed (Businger–Dyer concept)157
1970 Formulation of Universal functions ψ for heat and mass transfer25
1972 The areal thermal scanner was used to understand water stress in cotton canopies158
1972 Priestley and Taylor equation159
1975 Launched GOES-1. GOES continuity missions continue to produce LST images
1976 The areal thermal scanner used for estimating ET160
1977 ET is linearly related to the difference between the air and the leaf temperature22
1978 Heat Capacity Mapping Mission data was used for evaporation mapping161
1979 Start of NOAA-AVHRR missions
1985 Landsat-5 mission (thermal sensor: TM, spatial resolution 120 m, and revisit: 16 days)
1985 Shuttleworth and Wallace’s model was developed10
1985 AVHRR data were used to show the importance of vegetation height and density162
Mohan, Kanchirapuzha, and Varma: Review of approaches for the estimation of sensible heat flux. . .
Journal of Applied Remote Sensing 041501-21 Oct–Dec 2020 • Vol. 14(4)
Downloaded From: https://www.spiedigitallibrary.org/journals/Journal-of-Applied-Remote-Sensing on 29 Mar 2022Terms of Use: https://www.spiedigitallibrary.org/terms-of-use

Table 4 (Continued).
Year Key research contributions
1986 Concept of blending height163
1987 The formal theoretical base for ET estimation by RS of surface temperature164
1989 EF, remained stable during daylight hours165
1991 ERS-1 mission (thermal sensor: ASTR-1, spatial resolution 1000 m, and revisit: 2 to 3 days)
1993 SEBI63
1995 ERS-2 mission (thermal sensor: ASTR-2, spatial resolution 1000 m, and revisit: 2 to 3 days)
1995 TSEB-PT69
1997 Two source approach by two radiometric temperature observations (TSEB-2A)90
1997 TSTIM76
1998 SEBAL19
1999 Massman’s model for estimating kB−1166
1999 Landsat-7 mission (thermal sensor: ETM+, spatial resolution 60 m, and revisit: 16 days)
1999 Terra satellite (thermal sensor: MODIS, spatial resolution 1000 m, and revisit: 1 to 2 days) (thermalsensor: ASTER, spatial resolution 90 m, and revisit: 16 days)
2000 S-SEBI57
2002 ENVISAT satellite (thermal sensor: AATSR, spatial resolution 1000 m, and revisit: 35 days)
2002 AQUA satellite (thermal sensor: MODIS, spatial resolution 1000 m, and revisit: 1 to 2 days)
2002 Meteosat-8 (thermal sensor: SEVIRI, spatial resolution 3000 m, and revisit: daily)
2002 SEBS33
2005 MTSAT-1R or Himawari-6 (thermal sensor: JAMI, spatial resolution 2000 m, and revisit: daily)
2005 Pixel component arranging and comparing algorithm167
2005 ET mapping algorithm168
2006 Metop-A (thermal sensor: AVHRR/3, spatial resolution 2000 m, and revisit: daily)
2007 METRIC model21
2008 HJ 1B satellite (thermal sensor: IRMSS, spatial resolution 300 m, and revisit: 4 days)
2009 STSEB92
2009 Sim-ReSET estimation124
2011 SNPP (thermal sensor: VIIRS, spatial resolution 750 m, and revisit: daily)
2012 TSEB-PM70
2012 TTME54
2013 Landsat 8 mission (thermal sensor: TIRS, spatial resolution 100 m, and revisit: 16 days)
2013 HTEM86
2014 CBERS-4 satellite (thermal sensor: IRSCAM-4, spatial resolution 80 m, and revisit: 26 days)
2015 ETEML87
2016 GOES-16 satellite (thermal sensor: ABI, spatial resolution 2000 m, and revisit: daily)
Mohan, Kanchirapuzha, and Varma: Review of approaches for the estimation of sensible heat flux. . .
Journal of Applied Remote Sensing 041501-22 Oct–Dec 2020 • Vol. 14(4)
Downloaded From: https://www.spiedigitallibrary.org/journals/Journal-of-Applied-Remote-Sensing on 29 Mar 2022Terms of Use: https://www.spiedigitallibrary.org/terms-of-use
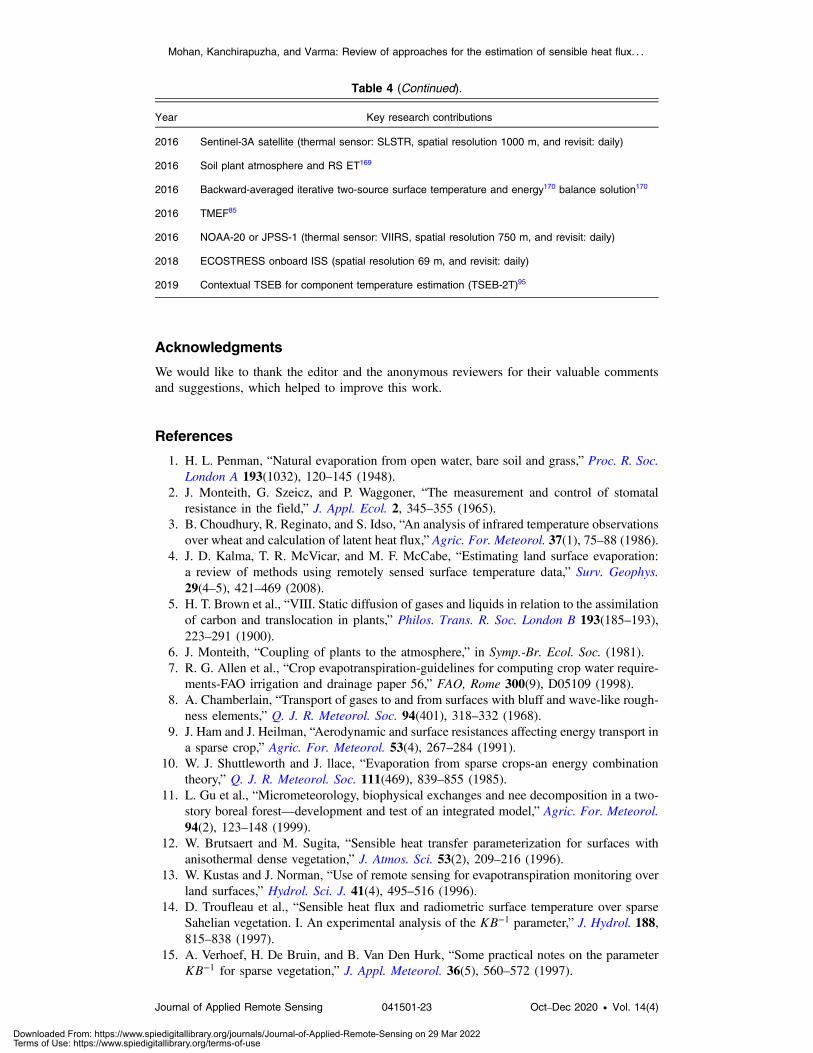
Acknowledgments
We would like to thank the editor and the anonymous reviewers for their valuable commentsand suggestions, which helped to improve this work.
References
1. H. L. Penman, “Natural evaporation from open water, bare soil and grass,” Proc. R. Soc.London A 193(1032), 120–145 (1948).
2. J. Monteith, G. Szeicz, and P. Waggoner, “The measurement and control of stomatalresistance in the field,” J. Appl. Ecol. 2, 345–355 (1965).
3. B. Choudhury, R. Reginato, and S. Idso, “An analysis of infrared temperature observationsover wheat and calculation of latent heat flux,” Agric. For. Meteorol. 37(1), 75–88 (1986).
4. J. D. Kalma, T. R. McVicar, and M. F. McCabe, “Estimating land surface evaporation:a review of methods using remotely sensed surface temperature data,” Surv. Geophys.29(4–5), 421–469 (2008).
5. H. T. Brown et al., “VIII. Static diffusion of gases and liquids in relation to the assimilationof carbon and translocation in plants,” Philos. Trans. R. Soc. London B 193(185–193),223–291 (1900).
6. J. Monteith, “Coupling of plants to the atmosphere,” in Symp.-Br. Ecol. Soc. (1981).7. R. G. Allen et al., “Crop evapotranspiration-guidelines for computing crop water require-
ments-FAO irrigation and drainage paper 56,” FAO, Rome 300(9), D05109 (1998).8. A. Chamberlain, “Transport of gases to and from surfaces with bluff and wave-like rough-
ness elements,” Q. J. R. Meteorol. Soc. 94(401), 318–332 (1968).9. J. Ham and J. Heilman, “Aerodynamic and surface resistances affecting energy transport in
a sparse crop,” Agric. For. Meteorol. 53(4), 267–284 (1991).10. W. J. Shuttleworth and J. llace, “Evaporation from sparse crops-an energy combination
theory,” Q. J. R. Meteorol. Soc. 111(469), 839–855 (1985).11. L. Gu et al., “Micrometeorology, biophysical exchanges and nee decomposition in a two-
story boreal forest—development and test of an integrated model,” Agric. For. Meteorol.94(2), 123–148 (1999).
12. W. Brutsaert and M. Sugita, “Sensible heat transfer parameterization for surfaces withanisothermal dense vegetation,” J. Atmos. Sci. 53(2), 209–216 (1996).
13. W. Kustas and J. Norman, “Use of remote sensing for evapotranspiration monitoring overland surfaces,” Hydrol. Sci. J. 41(4), 495–516 (1996).
14. D. Troufleau et al., “Sensible heat flux and radiometric surface temperature over sparseSahelian vegetation. I. An experimental analysis of the KB−1 parameter,” J. Hydrol. 188,815–838 (1997).
15. A. Verhoef, H. De Bruin, and B. Van Den Hurk, “Some practical notes on the parameterKB−1 for sparse vegetation,” J. Appl. Meteorol. 36(5), 560–572 (1997).
Table 4 (Continued).
Year Key research contributions
2016 Sentinel-3A satellite (thermal sensor: SLSTR, spatial resolution 1000 m, and revisit: daily)
2016 Soil plant atmosphere and RS ET169
2016 Backward-averaged iterative two-source surface temperature and energy170 balance solution170
2016 TMEF85
2016 NOAA-20 or JPSS-1 (thermal sensor: VIIRS, spatial resolution 750 m, and revisit: daily)
2018 ECOSTRESS onboard ISS (spatial resolution 69 m, and revisit: daily)
2019 Contextual TSEB for component temperature estimation (TSEB-2T)95
Mohan, Kanchirapuzha, and Varma: Review of approaches for the estimation of sensible heat flux. . .
Journal of Applied Remote Sensing 041501-23 Oct–Dec 2020 • Vol. 14(4)
Downloaded From: https://www.spiedigitallibrary.org/journals/Journal-of-Applied-Remote-Sensing on 29 Mar 2022Terms of Use: https://www.spiedigitallibrary.org/terms-of-use
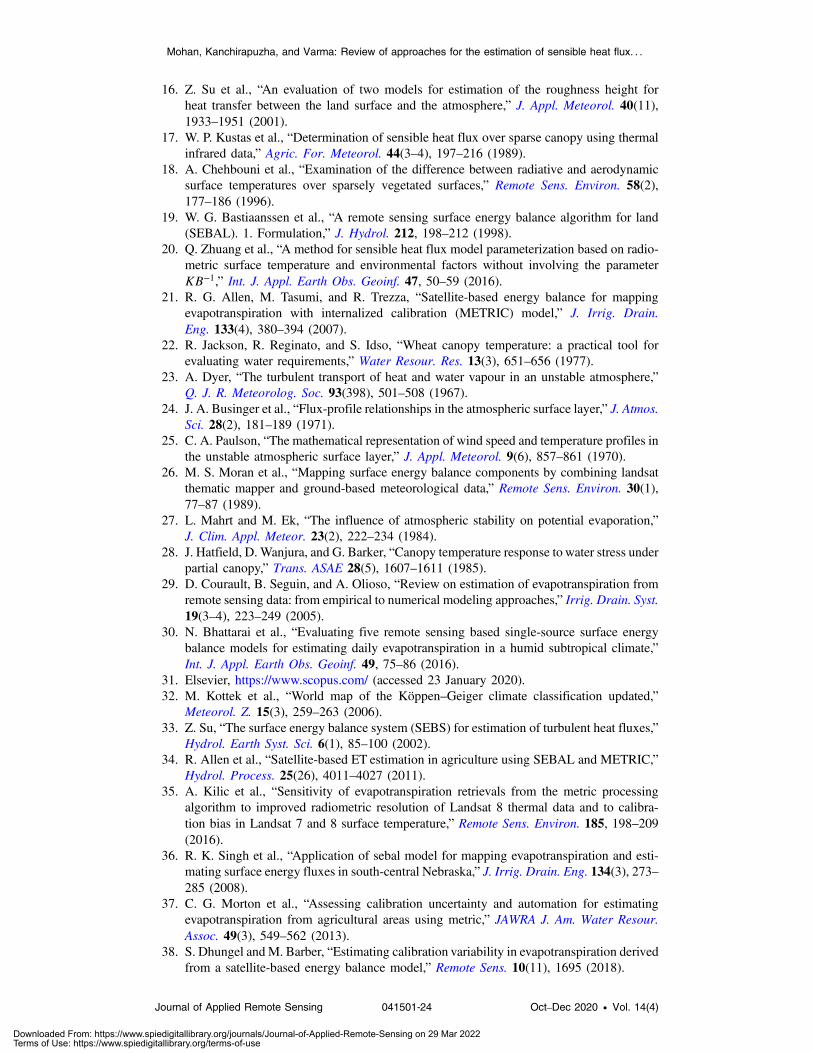
16. Z. Su et al., “An evaluation of two models for estimation of the roughness height forheat transfer between the land surface and the atmosphere,” J. Appl. Meteorol. 40(11),1933–1951 (2001).
17. W. P. Kustas et al., “Determination of sensible heat flux over sparse canopy using thermalinfrared data,” Agric. For. Meteorol. 44(3–4), 197–216 (1989).
18. A. Chehbouni et al., “Examination of the difference between radiative and aerodynamicsurface temperatures over sparsely vegetated surfaces,” Remote Sens. Environ. 58(2),177–186 (1996).
19. W. G. Bastiaanssen et al., “A remote sensing surface energy balance algorithm for land(SEBAL). 1. Formulation,” J. Hydrol. 212, 198–212 (1998).
20. Q. Zhuang et al., “A method for sensible heat flux model parameterization based on radio-metric surface temperature and environmental factors without involving the parameterKB−1,” Int. J. Appl. Earth Obs. Geoinf. 47, 50–59 (2016).
21. R. G. Allen, M. Tasumi, and R. Trezza, “Satellite-based energy balance for mappingevapotranspiration with internalized calibration (METRIC) model,” J. Irrig. Drain.Eng. 133(4), 380–394 (2007).
22. R. Jackson, R. Reginato, and S. Idso, “Wheat canopy temperature: a practical tool forevaluating water requirements,” Water Resour. Res. 13(3), 651–656 (1977).
23. A. Dyer, “The turbulent transport of heat and water vapour in an unstable atmosphere,”Q. J. R. Meteorolog. Soc. 93(398), 501–508 (1967).
24. J. A. Businger et al., “Flux-profile relationships in the atmospheric surface layer,” J. Atmos.Sci. 28(2), 181–189 (1971).
25. C. A. Paulson, “The mathematical representation of wind speed and temperature profiles inthe unstable atmospheric surface layer,” J. Appl. Meteorol. 9(6), 857–861 (1970).
26. M. S. Moran et al., “Mapping surface energy balance components by combining landsatthematic mapper and ground-based meteorological data,” Remote Sens. Environ. 30(1),77–87 (1989).
27. L. Mahrt and M. Ek, “The influence of atmospheric stability on potential evaporation,”J. Clim. Appl. Meteor. 23(2), 222–234 (1984).
28. J. Hatfield, D. Wanjura, and G. Barker, “Canopy temperature response to water stress underpartial canopy,” Trans. ASAE 28(5), 1607–1611 (1985).
29. D. Courault, B. Seguin, and A. Olioso, “Review on estimation of evapotranspiration fromremote sensing data: from empirical to numerical modeling approaches,” Irrig. Drain. Syst.19(3–4), 223–249 (2005).
30. N. Bhattarai et al., “Evaluating five remote sensing based single-source surface energybalance models for estimating daily evapotranspiration in a humid subtropical climate,”Int. J. Appl. Earth Obs. Geoinf. 49, 75–86 (2016).
31. Elsevier, https://www.scopus.com/ (accessed 23 January 2020).32. M. Kottek et al., “World map of the Köppen–Geiger climate classification updated,”
Meteorol. Z. 15(3), 259–263 (2006).33. Z. Su, “The surface energy balance system (SEBS) for estimation of turbulent heat fluxes,”
Hydrol. Earth Syst. Sci. 6(1), 85–100 (2002).34. R. Allen et al., “Satellite-based ET estimation in agriculture using SEBAL and METRIC,”
Hydrol. Process. 25(26), 4011–4027 (2011).35. A. Kilic et al., “Sensitivity of evapotranspiration retrievals from the metric processing
algorithm to improved radiometric resolution of Landsat 8 thermal data and to calibra-tion bias in Landsat 7 and 8 surface temperature,” Remote Sens. Environ. 185, 198–209(2016).
36. R. K. Singh et al., “Application of sebal model for mapping evapotranspiration and esti-mating surface energy fluxes in south-central Nebraska,” J. Irrig. Drain. Eng. 134(3), 273–285 (2008).
37. C. G. Morton et al., “Assessing calibration uncertainty and automation for estimatingevapotranspiration from agricultural areas using metric,” JAWRA J. Am. Water Resour.Assoc. 49(3), 549–562 (2013).
38. S. Dhungel and M. Barber, “Estimating calibration variability in evapotranspiration derivedfrom a satellite-based energy balance model,” Remote Sens. 10(11), 1695 (2018).
Mohan, Kanchirapuzha, and Varma: Review of approaches for the estimation of sensible heat flux. . .
Journal of Applied Remote Sensing 041501-24 Oct–Dec 2020 • Vol. 14(4)
Downloaded From: https://www.spiedigitallibrary.org/journals/Journal-of-Applied-Remote-Sensing on 29 Mar 2022Terms of Use: https://www.spiedigitallibrary.org/terms-of-use

39. M. P. Mohan, K. Rajitha, and M. R. Varma, “Integration of soil moisture as an auxiliaryparameter for the anchor pixel selection process in SEBAL using Landsat 8 and Sentinel-1aimages,” Int. J. Remote Sens. 41(3), 1214–1231 (2020).
40. R. G. Allen et al., “Automated calibration of the metric-landsat evapotranspiration proc-ess,” JAWRA J. Am. Water Resour. Assoc. 49(3), 563–576 (2013).
41. N. Bhattarai et al., “A new optimized algorithm for automating endmember pixel selectionin the SEBAL and METRIC models,” Remote Sens. Environ. 196, 178–192 (2017).
42. A. M. Silva, R. M. da Silva, and C. A. G. Santos, “Automated surface energy balancealgorithm for land (ASEBAL) based on automating endmember pixel selection for evapo-transpiration calculation in MODIS orbital images,” Int. J. Appl. Earth Obs. Geoinf. 79,1–11 (2019).
43. M. Raupach, “Simplified expressions for vegetation roughness length and zero-planedisplacement as functions of canopy height and area index,” Boundary Layer Meteorol.71(1-2), 211–216 (1994).
44. M. Gokmen et al., “Integration of soil moisture in SEBS for improving evapotranspirationestimation under water stress conditions,” Remote Sens. Environ. 121, 261–274 (2012).
45. A. Ghulam et al., “Modified perpendicular drought index (MPDI): a real-time droughtmonitoring method,” ISPRS J. Photogramm. Remote Sens. 62(2), 150–164 (2007).
46. C. Huang et al., “Improving estimation of evapotranspiration under water-limited condi-tions based on SEBS and MODIS data in arid regions,” Remote Sens. 7(12), 16795–16814(2015).
47. R. K. Singh and A. Irmak, “Treatment of anchor pixels in the metric model for improvedestimation of sensible and latent heat fluxes,” Hydrol. Sci. J. 56(5), 895–906 (2011).
48. M. Mkhwanazi, J. L. Chávez, and E. H. Rambikur, “Comparison of large aperture scin-tillometer and satellite-based energy balance models in sensible heat flux and crop evapo-transpiration determination,” Int. J. Remote Sens. Appl. 2(1), 24–30 (2012).
49. R. Madugundu et al., “Performance of the metric model in estimating evapotranspirationfluxes over an irrigated field in Saudi Arabia using Landsat-8 images,” Hydrol. Earth Syst.Sci. 21(12), 6135–6151 (2017).
50. J. Van der Kwast et al., “Evaluation of the surface energy balance system (SEBS) applied toaster imagery with flux-measurements at the sparc 2004 site (Barrax, Spain),” Hydrol.Earth Syst. Sci. Discuss. 6(1), 1165–1196 (2009).
51. K. Byun, U. W. Liaqat, and M. Choi, “Dual-model approaches for evapotranspirationanalyses over homo-and heterogeneous land surface conditions,” Agric. For. Meteorol.197, 169–187 (2014).
52. E. Webster, D. Ramp, and R. T. Kingsford, “Incorporating an iterative energy restraint forthe surface energy balance system (SEBS),” Remote Sens. Environ. 198, 267–285 (2017).
53. R. Allen et al., “Mapping evapotranspiration at high resolution, applications manual forlandsat satellite imagery,” Version 2(7), 248 (2010).
54. D. Long and V. P. Singh, “A modified surface energy balance algorithm for land(M-SEBAL) based on a trapezoidal framework,” Water Resour. Res. 48(2), 2528 (2012).
55. M. Choi et al., “An intercomparison of three remote sensing-based surface energy balancealgorithms over a corn and soybean production region (IOWA, US) during SMACEX,”Agric. For. Meteorol. 149(12), 2082–2097 (2009).
56. Y. Ma et al., “Estimations of regional surface energy fluxes over heterogeneous Oasis-des-ert surfaces in the middle reaches of the Heihe river during HiWATER-MUSOEXE,” IEEEGeosci. Remote Sens. Lett. 12(3), 671–675 (2015).
57. G. Roerink, Z. Su, and M. Menenti, “S-SEBI: a simple remote sensing algorithm toestimate the surface energy balance,” Phys. Chem. Earth Part B 25(2), 147–157 (2000).
58. M. Menenti et al., “Linear relationships between surface reflectance and temperatureand their application to map actual evaporation of groundwater,” Adv. Space Res. 9(1),165–176 (1989).
59. M. García et al., “Comparison of three operative models for estimating the surface waterdeficit using ASTER reflective and thermal data,” Sensors 7(6), 860–883 (2007).
60. C. Mattar et al., “Impacts of the broadband albedo on actual evapotranspiration estimatedby S-SEBI model over an agricultural area,” Remote Sens. Environ. 147, 23–42 (2014).
Mohan, Kanchirapuzha, and Varma: Review of approaches for the estimation of sensible heat flux. . .
Journal of Applied Remote Sensing 041501-25 Oct–Dec 2020 • Vol. 14(4)
Downloaded From: https://www.spiedigitallibrary.org/journals/Journal-of-Applied-Remote-Sensing on 29 Mar 2022Terms of Use: https://www.spiedigitallibrary.org/terms-of-use

61. N. Bhattarai et al., “Utility of remote sensing-based surface energy balance models to trackwater stress in rain-fed switchgrass under dry and wet conditions,” ISPRS J. Photogramm.Remote Sens. 133, 128–141 (2017).
62. R. D. Jackson et al., “Canopy temperature as a crop water stress indicator,” Water Resour.Res. 17(4), 1133–1138 (1981).
63. M. Menenti and B. Choudhury, “Parameterization of land surface evapotranspiration usinga location dependent potential evapotranspiration and surface temperature range,” inExchange Process. Land Surface Range Space and Time Scales, Vol. 212, pp. 561–568(1993).
64. L. Jia et al., “Evaluation of the surface energy balance index with the field and airbornedata collected at Hartheim and Colmar,” in Digital Airborne Spectrometer Exp., Vol. 499,p. 235 (2001).
65. G. B. Senay et al., “Operational evapotranspiration mapping using remote sensingand weather datasets: a new parameterization for the SSEB approach,” JAWRA J. Am.Water Resour. Assoc. 49(3), 577–591 (2013).
66. J. Lian and M. Huang, “Comparison of three remote sensing based models to estimateevapotranspiration in an oasis-desert region,” Agric. Water Manage. 165, 153–162 (2016).
67. R. Tang et al., “An intercomparison of three remote sensing-based energy balance modelsusing large aperture scintillometer measurements over a wheat–corn production region,”Remote Sens. Environ. 115(12), 3187–3202 (2011).
68. W. J. Timmermans et al., “An intercomparison of the surface energy balance algorithm forland (SEBAL) and the two-source energy balance (TSEB) modeling schemes,” RemoteSens. Environ. 108(4), 369–384 (2007).
69. J. M. Norman, W. P. Kustas, and K. S. Humes, “Source approach for estimating soil andvegetation energy fluxes in observations of directional radiometric surface temperature,”Agric. For. Meteorol. 77(3–4), 263–293 (1995).
70. P. D. Colaizzi et al., “Two-source energy balance model estimates of evapotranspirationusing component and composite surface temperatures,” Adv. Water Resour. 50, 134–151(2012).
71. N. Agam et al., “Application of the Priestley–Taylor approach in a two-source surfaceenergy balance model,” J. Hydrometeorol. 11(1), 185–198 (2010).
72. J. B. Fisher, K. P. Tu, and D. D. Baldocchi, “Global estimates of the land–atmosphere waterflux based on monthly AVHRR and ISLSCP-II data, validated at 16 fluxnet sites,” RemoteSens. Environ. 112(3), 901–919 (2008).
73. G. Gan and Y. Gao, “Estimating time series of land surface energy fluxes using optimizedtwo source energy balance schemes: model formulation, calibration, and validation,”Agric. For. Meteorol. 208, 62–75 (2015).
74. P. D. Colaizzi et al., “Two-source energy balance model to calculate E, T, and ET: com-parison of Priestley–Taylor and Penman–Monteith formulations and two time scalingmethods,” Trans. ASABE 57(2), 479–498 (2014).
75. Y. Yang et al., “Intercomparison of three two-source energy balance models for partitioningevaporation and transpiration in semiarid climates,” Remote Sens. 10(7), 1149 (2018).
76. M. Anderson et al., “A two-source time-integrated model for estimating surface fluxesusing thermal infrared remote sensing,” Remote Sens. Environ. 60(2), 195–216 (1997).
77. J. R. Mecikalski et al., “Estimating fluxes on continental scales using remotely senseddata in an atmospheric-land exchange model,” J. Appl. Meteorol. 38(9), 1352–1369(1999).
78. K. McNaughton and T. Spriggs, “A mixed-layer model for regional evaporation,”Boundary Layer Meteorol. 34(3), 243–262 (1986).
79. M. C. Anderson, W. P. Kustas, and J. M. Norman, “Upscaling and downscaling a regionalview of the soil–plant–atmosphere continuum,” Agron. J. 95(6), 1408–1423 (2003).
80. M. Moran et al., “Estimating crop water deficit using the relation between surface-airtemperature and spectral vegetation index,” Remote Sens. Environ. 49(3), 246–263 (1994).
81. T. Carlson, “An overview of the ‘triangle method’ for estimating surface evapotranspirationand soil moisture from satellite imagery,” Sensors 7(8), 1612–1629 (2007).
Mohan, Kanchirapuzha, and Varma: Review of approaches for the estimation of sensible heat flux. . .
Journal of Applied Remote Sensing 041501-26 Oct–Dec 2020 • Vol. 14(4)
Downloaded From: https://www.spiedigitallibrary.org/journals/Journal-of-Applied-Remote-Sensing on 29 Mar 2022Terms of Use: https://www.spiedigitallibrary.org/terms-of-use

82. T. N. Carlson, R. R. Gillies, and E. M. Perry, “A method to make use of thermal infraredtemperature and NDVI measurements to infer surface soil water content and fractionalvegetation cover,” Remote Sens. Rev. 9(1–2), 161–173 (1994).
83. D. Long and V. P. Singh, “A two-source trapezoid model for evapotranspiration (TTME)from satellite imagery,” Remote Sens. Environ. 121, 370–388 (2012).
84. J. Tian et al., “Impact of the spatial domain size on the performance of the TS-VI trianglemethod in terrestrial evapotranspiration estimation,” Remote Sens. 5(4), 1998–2013(2013).
85. H. Sun, “A two-source model for estimating evaporative fraction (TMEF) couplingPriestley–Taylor formula and two-stage trapezoid,” Remote Sens. 8(3), 248 (2016).
86. Y. Yang and S. Shang, “A hybrid dual-source scheme and trapezoid framework-basedevapotranspiration model (HTEM) using satellite images: algorithm and model test,”J. Geophys. Res. Atmos. 118(5), 2284–2300 (2013).
87. Y. Yang et al., “An enhanced two-source evapotranspiration model for land (ETEML):algorithm and evaluation,” Remote Sens. Environ. 168, 54–65 (2015).
88. D. S. Kimes et al., “View angle effects in the radiometric measurement of plant canopytemperatures,” Remote Sens. Environ. 10(4), 273–284 (1980).
89. L. Song et al., “Estimation of surface heat fluxes using multi-angular observations ofradiative surface temperature,” Remote Sens. Environ. 239, 111674 (2020).
90. W. P. Kustas and J. M. Norman, “A two-source approach for estimating turbulent fluxesusing multiple angle thermal infrared observations,”Water Resour. Res. 33(6), 1495–1508(1997).
91. L. Jia et al., “A practical algorithm to infer soil and foliage component temperatures frombi-angular ATSR-2 data,” Int. J. Remote Sens. 24(23), 4739–4760 (2003).
92. J. Sánchez et al., “Modelling surface energy fluxes over maize using a two-source patchmodel and radiometric soil and canopy temperature observations,” Remote Sens. Environ.112(3), 1130–1143 (2008).
93. S. Manfreda et al., “On the use of unmanned aerial systems for environmental monitoring,”Remote Sens. 10(4), 641 (2018).
94. H. Niu et al., “Evapotranspiration estimation with UAVs in agriculture: a review,” https://www.preprints.org/manuscript/201907.0124/v1 (2019).
95. H. Nieto et al., “Evaluation of TSEB turbulent fluxes using different methods for theretrieval of soil and canopy component temperatures from UAV thermal and multispectralimagery,” Irrig. Sci. 37(3), 389–406 (2019).
96. W. J. Timmermans, W. P. Kustas, and A. Andreu, “Utility of an automated thermal-based approach for monitoring evapotranspiration,” Acta Geophys. 63(6), 1571–1608(2015).
97. C. Brenner et al., “Estimation of evapotranspiration of temperate grassland based on high-resolution thermal and visible range imagery from unmanned aerial systems,” Int. J.Remote Sens. 39(15–16), 5141–5174 (2018).
98. J. Deardorff, G. Willis, and B. Stockton, “Laboratory studies of the entrainment zone ofa convectively mixed layer,” J. Fluid Mech. 100(1), 41–64 (1980).
99. T. Bonin et al., “Observations of the early evening boundary-layer transition using a smallunmanned aerial system,” Boundary Layer Meteorol. 146(1), 119–132 (2013).
100. M.-S. Kim and B. H. Kwon, “Estimation of sensible heat flux and atmospheric boundarylayer height using an unmanned aerial vehicle,” Atmosphere 10(7), 363 (2019).
101. D. E. Strebel et al., “The fife information system,” IEEE Trans. Geosci. Remote Sens.28(4), 703–710 (1990).
102. L. Z. Zhirong and M. McDonnell, “Atmospheric correction of thermal infrared images,”Int. J. Remote Sens. 9(1), 107–121 (1988).
103. T. Xu et al., “Mapping regional turbulent heat fluxes via variational assimilation ofland surface temperature data from polar orbiting satellites,” Remote Sens. Environ. 221,444–461 (2019).
104. T. Xu, S. M. Bateni, and S. Liang, “Estimating turbulent heat fluxes with a weak-constraintdata assimilation scheme: a case study (HiWATER-MUSOEXE),” IEEE Geosci. RemoteSens. Lett. 12(1), 68–72 (2015).
Mohan, Kanchirapuzha, and Varma: Review of approaches for the estimation of sensible heat flux. . .
Journal of Applied Remote Sensing 041501-27 Oct–Dec 2020 • Vol. 14(4)
Downloaded From: https://www.spiedigitallibrary.org/journals/Journal-of-Applied-Remote-Sensing on 29 Mar 2022Terms of Use: https://www.spiedigitallibrary.org/terms-of-use

105. F. Caparrini, F. Castelli, and D. Entekhabi, “Estimation of surface turbulent fluxes throughassimilation of radiometric surface temperature sequences,” J. Hydrometeorol. 5(1),145–159 (2004).
106. F. Sini et al., “Estimation of large-scale evaporation fields based on assimilation ofremotely sensed land temperature,” Water Resour. Res. 44(6), W06410 (2008).
107. A. Abdolghafoorian and L. Farhadi, “Estimation of surface turbulent fluxes from landsurface moisture and temperature via a variational data assimilation framework,” WaterResour. Res. 55(6), 4648–4667 (2019).
108. S. Bateni and D. Entekhabi, “Surface heat flux estimation with the ensemble Kalmansmoother: joint estimation of state and parameters,” Water Resour. Res. 48(8), 8521(2012).
109. R. Eswar, M. Sekhar, and B. Bhattacharya, “Comparison of three remote sensing basedmodels for the estimation of latent heat flux over India,” Hydrol. Sci. J. 62(16), 2705–2719(2017).
110. J. M. Hendrickx et al., “Scintillometer networks for calibration and validation of energybalance and soil moisture remote sensing algorithms,” Proc. SPIE 6565, 65650W (2007).
111. M. Tasumi et al., “Operational aspects of satellite-based energy balance models forirrigated crops in the semi-arid us,” Irrig. Drain. Syst. 19(3–4), 355–376 (2005).
112. B. G. Bezerra et al., “Actual evapotranspiration estimation using remote sensing: compari-son of SEBAL and SSEB approaches,” Adv. Remote Sens. 4(3), 234 (2015).
113. L. Jia et al., “Estimation of sensible heat flux using the surface energy balance system(SEBS) and ATSR measurements,” Phys. Chem. Earth Parts A/B/C 28(1–3), 75–88(2003).
114. Z. Su et al., “Assessing relative soil moisture with remote sensing data: theory, experimen-tal validation, and application to drought monitoring over the North China Plain,” Phys.Chem. Earth Parts A/B/C 28(1–3), 89–101 (2003).
115. G. B. Senay et al., “A coupled remote sensing and simplified surface energy balanceapproach to estimate actual evapotranspiration from irrigated fields,” Sensors 7(6),979–1000 (2007).
116. P. Gowda et al., “Lysimetric evaluation of simplified surface energy balance approach inthe Texas high plains,” Appl. Eng. Agric. 25(5), 665–669 (2009).
117. M. R. Lurtz et al., “Relationships between Riparian evapotranspiration and groundwaterdepth along a semiarid irrigated river valley,” Hydrol. Process. 34(8), 1714–1727 (2020).
118. A. M. Melesse and V. Nangia, “Estimation of spatially distributed surface energy fluxesusing remotely-sensed data for agricultural fields,” Hydrol. Process. 19(14), 2653–2670(2005).
119. J. Norman et al., “Remote sensing of surface energy fluxes at 101-m pixel resolutions,”Water Resour. Res. 39(8) (2003).
120. M. C. Anderson et al., “Mapping daily evapotranspiration at landsat spatial scales duringthe Bearex’08 field campaign,” Adv. Water Resour. 50, 162–177 (2012).
121. J. Sánchez et al., “Monitoring daily evapotranspiration at a regional scale from Landsat-TM and ETM+ data: application to the Basilicata region,” J. Hydrol. 351(1–2), 58–70(2008).
122. A. Andreu et al., “Influence of component temperature derivation from dual angle thermalinfrared observations on TSEB flux estimates over an irrigated vineyard,” Acta Geophys.63(6), 1540–1570 (2015).
123. Y. Yang, R. L. Scott, and S. Shang, “Modeling evapotranspiration and its partitioning overa semiarid shrub ecosystem from satellite imagery: a multiple validation,” J. Appl. RemoteSens. 7(1), 073495 (2013).
124. Z. Sun et al., “Development of a simple remote sensing evapotranspiration model(SIM-RESET): algorithm and model test,” J. Hydrol. 376(3–4), 476–485 (2009).
125. Z. Sun et al., “Further evaluation of the SIM-RESET model for et estimation driven by onlysatellite inputs,” Hydrol. Sci. J. 58(5), 994–1012 (2013).
126. R. Tang and Z.-L. Li, “An end-member-based two-source approach for estimating landsurface evapotranspiration from remote sensing data,” IEEE Trans. Geosci. Remote Sens.55(10), 5818–5832 (2017).
Mohan, Kanchirapuzha, and Varma: Review of approaches for the estimation of sensible heat flux. . .
Journal of Applied Remote Sensing 041501-28 Oct–Dec 2020 • Vol. 14(4)
Downloaded From: https://www.spiedigitallibrary.org/journals/Journal-of-Applied-Remote-Sensing on 29 Mar 2022Terms of Use: https://www.spiedigitallibrary.org/terms-of-use
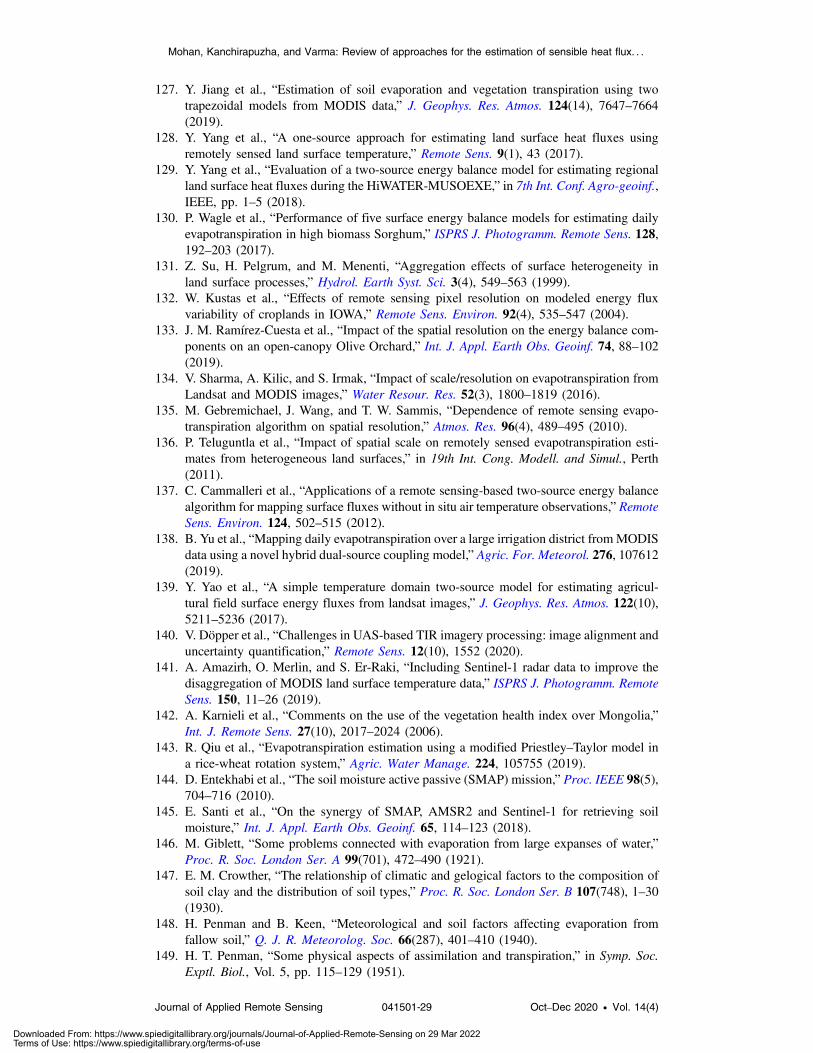
127. Y. Jiang et al., “Estimation of soil evaporation and vegetation transpiration using twotrapezoidal models from MODIS data,” J. Geophys. Res. Atmos. 124(14), 7647–7664(2019).
128. Y. Yang et al., “A one-source approach for estimating land surface heat fluxes usingremotely sensed land surface temperature,” Remote Sens. 9(1), 43 (2017).
129. Y. Yang et al., “Evaluation of a two-source energy balance model for estimating regionalland surface heat fluxes during the HiWATER-MUSOEXE,” in 7th Int. Conf. Agro-geoinf.,IEEE, pp. 1–5 (2018).
130. P. Wagle et al., “Performance of five surface energy balance models for estimating dailyevapotranspiration in high biomass Sorghum,” ISPRS J. Photogramm. Remote Sens. 128,192–203 (2017).
131. Z. Su, H. Pelgrum, and M. Menenti, “Aggregation effects of surface heterogeneity inland surface processes,” Hydrol. Earth Syst. Sci. 3(4), 549–563 (1999).
132. W. Kustas et al., “Effects of remote sensing pixel resolution on modeled energy fluxvariability of croplands in IOWA,” Remote Sens. Environ. 92(4), 535–547 (2004).
133. J. M. Ramírez-Cuesta et al., “Impact of the spatial resolution on the energy balance com-ponents on an open-canopy Olive Orchard,” Int. J. Appl. Earth Obs. Geoinf. 74, 88–102(2019).
134. V. Sharma, A. Kilic, and S. Irmak, “Impact of scale/resolution on evapotranspiration fromLandsat and MODIS images,” Water Resour. Res. 52(3), 1800–1819 (2016).
135. M. Gebremichael, J. Wang, and T. W. Sammis, “Dependence of remote sensing evapo-transpiration algorithm on spatial resolution,” Atmos. Res. 96(4), 489–495 (2010).
136. P. Teluguntla et al., “Impact of spatial scale on remotely sensed evapotranspiration esti-mates from heterogeneous land surfaces,” in 19th Int. Cong. Modell. and Simul., Perth(2011).
137. C. Cammalleri et al., “Applications of a remote sensing-based two-source energy balancealgorithm for mapping surface fluxes without in situ air temperature observations,” RemoteSens. Environ. 124, 502–515 (2012).
138. B. Yu et al., “Mapping daily evapotranspiration over a large irrigation district fromMODISdata using a novel hybrid dual-source coupling model,” Agric. For. Meteorol. 276, 107612(2019).
139. Y. Yao et al., “A simple temperature domain two-source model for estimating agricul-tural field surface energy fluxes from landsat images,” J. Geophys. Res. Atmos. 122(10),5211–5236 (2017).
140. V. Döpper et al., “Challenges in UAS-based TIR imagery processing: image alignment anduncertainty quantification,” Remote Sens. 12(10), 1552 (2020).
141. A. Amazirh, O. Merlin, and S. Er-Raki, “Including Sentinel-1 radar data to improve thedisaggregation of MODIS land surface temperature data,” ISPRS J. Photogramm. RemoteSens. 150, 11–26 (2019).
142. A. Karnieli et al., “Comments on the use of the vegetation health index over Mongolia,”Int. J. Remote Sens. 27(10), 2017–2024 (2006).
143. R. Qiu et al., “Evapotranspiration estimation using a modified Priestley–Taylor model ina rice-wheat rotation system,” Agric. Water Manage. 224, 105755 (2019).
144. D. Entekhabi et al., “The soil moisture active passive (SMAP) mission,” Proc. IEEE 98(5),704–716 (2010).
145. E. Santi et al., “On the synergy of SMAP, AMSR2 and Sentinel-1 for retrieving soilmoisture,” Int. J. Appl. Earth Obs. Geoinf. 65, 114–123 (2018).
146. M. Giblett, “Some problems connected with evaporation from large expanses of water,”Proc. R. Soc. London Ser. A 99(701), 472–490 (1921).
147. E. M. Crowther, “The relationship of climatic and gelogical factors to the composition ofsoil clay and the distribution of soil types,” Proc. R. Soc. London Ser. B 107(748), 1–30(1930).
148. H. Penman and B. Keen, “Meteorological and soil factors affecting evaporation fromfallow soil,” Q. J. R. Meteorolog. Soc. 66(287), 401–410 (1940).
149. H. T. Penman, “Some physical aspects of assimilation and transpiration,” in Symp. Soc.Exptl. Biol., Vol. 5, pp. 115–129 (1951).
Mohan, Kanchirapuzha, and Varma: Review of approaches for the estimation of sensible heat flux. . .
Journal of Applied Remote Sensing 041501-29 Oct–Dec 2020 • Vol. 14(4)
Downloaded From: https://www.spiedigitallibrary.org/journals/Journal-of-Applied-Remote-Sensing on 29 Mar 2022Terms of Use: https://www.spiedigitallibrary.org/terms-of-use
150. A. Monin and A. Obukhov, “Basic laws of turbulent mixing in the ground layer of theatmosphere (osnovne zakonomernosti turbulentnogo peremeshivaniya v prizemnom sloeatmosfery),” Tech. Rep., American Meteorological Society, Boston, MA (1959).
151. J. Businger, “Some remarks on Penman’s equations for the evapotranspiration,”Netherlands J. Agric. Sci 4, 77 (1956).
152. C. Tanner and W. Pelton, “Potential evapotranspiration estimates by the approximateenergy balance method of Penman,” J. Geophys. Res. 65(10), 3391–3413 (1960).
153. H. Penman and I. Long, “Weather in wheat: an essay in micro-meteorology,” Q. J. R.Meteorolog. Soc. 86(367), 16–50 (1960).
154. J. L. Monteith and G. Szeicz, “Radiative temperature in the heat balance of naturalsurfaces,” Q. J. R. Meteorolog. Soc. 88(378), 496–507 (1962).
155. D. M. Gates, “Leaf temperature and energy exchange,” Arch. Meteorol. Geophys.Bioklimatol. Ser. B 12(2), 321–336 (1962).
156. D. Q. Wark, G. Yamamoto, and J. H. Lienesch, “Methods of estimating infrared fluxand surface temperature from meteorological satellites,” J. Atmos. Sci. 19(5), 369–384(1962).
157. A. Dyer and B. Hicks, “Flux-gradient relationships in the constant flux layer,” Q. J. R.Meteorolog. Soc. 96(410), 715–721 (1970).
158. J. Bartholic, L. Namkem, and C. Wiegand, “Aerial thermal scanner to determine temper-atures of soils and of crop canopies differing in water stress 1,” Agron. J. 64(5), 603–608(1972).
159. C. Priestley and R. Taylor, “On the assessment of surface heat flux and evaporation usinglarge-scale parameters,” Mon. Weather Rev. 100(2), 81–92 (1972).
160. J. Heilman et al., “Thermal scanner measurement of canopy temperatures to estimateevapotranspiration,” Remote Sens. Environ. 5, 137–145 (1976).
161. A. Rosema et al., “Tellus: a combined surface temperature, soil moisture and evaporationmapping approach,” in Proc. Symp. Remote Sens., Environmental Research Institute ofMichigan, Vol. 3, pp. 2267–2276 (1978).
162. O. Taconet, R. Bernard, and D. Vidal-Madjar, “Evapotranspiration over an agricul-tural region using a surface flux/temperature model based on NOAA-AVHRR data,”J. Clim. Appl. Meteorol. 25(3), 284–307 (1986).
163. J. Wieringa, “Roughness-dependent geographical interpolation of surface wind speedaverages,” Q. J. R. Meteorolog. Soc. 112(473), 867–889 (1986).
164. J. Gash, “An analytical framework for extrapolating evaporation measurements by remotesensing surface temperature,” Int. J. Remote Sens. 8(8), 1245–1249 (1987).
165. W. Shuttleworth et al., “Fife: the variation in energy partition at surface flux sites,” in Proc.LAHS Third Int. Assembly, IAHS Publication, Vol. 186, No. 6, pp. 67–74 (1989).
166. W. Massman, “A model study of kbh-1 for vegetated surfaces using localized near-fieldLagrangian theory,” J. Hydrol. 223(1–2), 27–43 (1999).
167. R. Zhang et al., “An operational two-layer remote sensing model to estimate surface flux inregional scale: physical background,” Sci. China Ser. D 48(Suppl. 1), 225 (2005).
168. S. P. Loheide, II and S. M. Gorelick, “A local-scale, high-resolution evapotranspirationmapping algorithm (ETMA) with hydroecological applications at Riparian Meadow resto-ration sites,” Remote Sens. Environ. 98(2–3), 182–200 (2005).
169. G. Boulet et al., “The sparse model for the prediction of water stress and evapotranspirationcomponents from thermal infra-red data and its evaluation over irrigated and rainfedwheat,” Hydrol. Earth Syst. Sci. 19(11), 4653–4672 (2015).
170. R. Dhungel et al., “Evapotranspiration between satellite overpasses: methodology and casestudy in agricultural dominant semi-arid areas,” Meteorol. Appl. 23(4), 714–730 (2016).
M. M. Prakash Mohan is currently pursuing his PhD in the field of advanced remote sensingapplications for surface energy balance models at BITS Pilani-Hyderabad Campus. He has 10years of field experience as a designer for microirrigation systems for diverse environmental andterrain conditions. His expertise contributed relevant research publications in the domain ofmodification of approaches applied for remote sensing-based ET modeling using the SARdataset.
Mohan, Kanchirapuzha, and Varma: Review of approaches for the estimation of sensible heat flux. . .
Journal of Applied Remote Sensing 041501-30 Oct–Dec 2020 • Vol. 14(4)
Downloaded From: https://www.spiedigitallibrary.org/journals/Journal-of-Applied-Remote-Sensing on 29 Mar 2022Terms of Use: https://www.spiedigitallibrary.org/terms-of-use

Rajitha Kanchirapuzha received her PhD in remote sensing applications for water resourcesmanagement at IIT Kharagpur in 2007. She is currently working as an assistant professor atBITS Pilani-Hyderabad campus. Her expertise mainly includes remote sensing applications foragriculture, aquaculture, natural resources, and wetland management. She is currently involvedin the process of applying advanced remote sensing datasets for developing algorithms forvarious agriculture and allied areas.
Murari R. R. Varma received his PhD in watershed hydrology and management from theIndian Institute of Science, Bangalore, in 2010. He is currently working as an assistant professorat BITS Pilani-Hyderabad campus. He has expertise in the domains of experimental and fieldhydrology, hydrochemistry of watersheds, GIS applications in hydrology, and environmentalhydrology.
Mohan, Kanchirapuzha, and Varma: Review of approaches for the estimation of sensible heat flux. . .
Journal of Applied Remote Sensing 041501-31 Oct–Dec 2020 • Vol. 14(4)
Downloaded From: https://www.spiedigitallibrary.org/journals/Journal-of-Applied-Remote-Sensing on 29 Mar 2022Terms of Use: https://www.spiedigitallibrary.org/terms-of-use