review, evolution and optimization of the kansanshi mixed
TRANSCRIPT
Copper Cobalt Africa, incorporating the 8th Southern African Base Metals Conference Livingstone, Zambia, 6–8 July 2015 Southern African Institute of Mining and Metallurgy 69
Review, Evolution and Optimization of the Kansanshi Mixed Copper Ore Treatment
C. Ngulube,* C. Chongo and F. X. Paquot
First Quantum Minerals Ltd, Kansanshi Mine, Solwezi, Zambia
*Corresponding author: [email protected]
Over the last six years, the Kansanshi copper/gold mine has continued to process significant quantities of complex transitional mixed ores. The effect of the complex mineralogy on the flotation performance is depicted. Initially, ore treated came predominantly from accumulated stockpiles. In the ensuing years, ore treated shifted to primarily freshly mined ore that generally showed less tarnish with better float kinetics but with the downside of producing lower concentrate grades. A number of changes were made to improve the efficiency of the roughing circuit and quality of concentrate produced. These changes were as a result of initial mineralogical studies and laboratory float test work done and discussed at length in a previous paper. Salient among the adopted recommendations from previous work were increasing circuit capacity and modifying configuration to increase the residence time and the number of sulphidisation stages. These modifications were completed and commissioned in 2011. This, however, resulted in significantly low rougher concentrate grades and subsequently below-specification final concentrate product. This was primarily due to higher mass pulls resulting from the extended rougher bank with multiple concentrate discharge streams. This necessitated the need for an enlarged cleaning capability to offset this. The extra cleaning capacity came on-stream in 2014. Of note was the development of a recovery model, based on the strong correlation between the total copper and acid-soluble copper ratio, as a tool for monitoring plant performance.
INTRODUCTION
The Kansanshi mine, the largest copper mine in Africa, is 80% owned by Kansanshi Mining PLC, a First Quantum subsidiary. The remaining 20% is owned by the state through the parastatal ZCCM. The mine is located approximately 10 km north of the town of Solwezi and 180 km to the northwest of the Copperbelt town of Chingola. The mine has been in commercial operation since 2005. Prior to June 2009, Kansanshi mine treated only two ore types: oxide and sulphide. All transitional ores mined during the period leading up to 2009 were stockpiled. The treatment of the minerologically complex, transitional ores through a third train commenced in June 2009 but with numerous metallurgical challenges. This transitional ore (called mixed ores) could not be previously treated economically due to high gangue acid consumption (GAC) minerals association (making it unsuitable for the oxide float–leach circuit) and poor flotation response ruling out the conventional sulphide float circuit. The new novel circuit involved a conventional sulphide pre-float followed by flotation involving staged controlled potential sulphidisation (CPS).
70
All the copper minerals constituting the alteration sequence from primary sulphides to carbonates or silicates are present in various proportions (Table I) in the Kansanshi transitional ores. The alteration of primary sulfides starts with an impoverishment in iron to form covellite. Further oxidation generates an impoverishment in sulfur and enrichment in copper to form digenite then chalcocite (Dunn & Muzenda, 2001). The final steps of alteration leading to the formation of copper oxide minerals, such as malachite or chrysocolla (a silicate), depend mainly on the composition of gangue or fluid. The iron liberated during the alteration sequence can remobilize to form goethite or limonite. These iron oxides and hydroxides are particularly prejudicial for flotation if they precipitate on the surface of the copper minerals because they are not collectable with xanthates (Woods, 2003).
Table I. Copper minerals present at the Kansanshi Mine.
Mineral Mineral formula Mineral Mineral formula
Chalcopyrite Bornite Covellite Digenite Chalcocite Malachite
CuFeS2 Cu5FeS4 CuS Cu9S5 Cu2S CuCO3(OH)2
Azurite Cuprite Tenorite Chrysocolla Native copper
Cu2(CO3)2.Cu(OH)2 Cu2O CuO (Cu,Al)2H2Si2O5(OH)4.nH2O Cu
The traditional method applied for the flotation of copper oxide or mixed ores is sulphidisation, which was first developed with industrial success on Pb–Zn oxide ores in Australia (Crozier, 1991). The method involves multistage addition of sodium sulphide (Na2S), sodium hydrogen sulphide (NaHS), or ammonium sulphide (NH4)2S as a sulphidising agent, together with xanthate collectors, such as potassium amyl xanthate (PAX) (Kongolo et al., 2003; Mwema & Mpoyo, 2001). The effectiveness of sulphidisation for flotation of oxidized sulphides has also been demonstrated (Newell et al., 2006). When introduced in the slurry, the sulphidiser dissociates into the species H2S, HS- or S2
-, depending on the pH. These ions react with the copper oxide minerals to form a sulphide layer on the surface of the oxide minerals (Zhou & Chander, 1992).The sulphidiser concentration can be controlled by measuring the ES potential of the pulp using a sulphide ion-selective electrode. The reaction between the sulphidiser and malachite is optimum at a potential of –500 mV (Jones & Woodcock, 1978). However, xanthate flotation is depressed at this potential. Oxidation of sulphide ions in excess is then necessary to reach the optimal potential of –300 mV (Ferron & Manu, 1994). This leads to the formation of reducing agents, such as thiosulphates, which are not necessarily indifferent in the flotation process (Castro et al., 1974; Soto & Laskowski, 1973). Direct collectors, such as fatty acids and hydroxamates, have also been developed for the flotation of oxide minerals (Lee et al., 1998, 2009). The fatty acids have the drawback of being unselective over the carbonated gangue minerals and are therefore unsuitable for the Kansanshi mixed ores. Paquot et al. (2009) demonstrated the advantage of the sulphidisation route over the direct hydroxamates flotation. The original Kansanshi mixed circuit configuration had six 150 m3 flotation cells. With this configuration, a sulphides pre-flotation (referred to as a rougher stage) was designated to the first pair of cells. Sequentially, two sulphidisation stages, each comprising two 150 m3 flotation cells, immediately followed the rougher stage. These were referred to as CPS 1 and 2. Two series of sulphidisation conditioning tanks, to control sulphidiser addition against an Es/Eh potential and collector, preceded each sulphidisation stage. The sulphidiser used was sodium hydrogen sulphide (NaHS). Chief among the metallurgical challenges with the mixed float was loss of a certain class of copper minerals to the tails, despite indications that these minerals were fully liberated and floatable (Table II.). To investigate this copper loss to tails, Paquot et al. (2009) and Ngulube et al. (2011) conducted several investigations, collecting samples across the whole circuit to assess liberation and mineral
71
classes. Hundreds of laboratory flotation tests were also simultaneously conducted on flotation feed and final tails, under various plant conditions, in order to compare the performance of the plant with the ideal conditions of the laboratory.
Table II. Contribution of each mineralogical class to the copper losses in the final tails.
Mineralogical class Contribution to final Cu losses (%)
Chalcopyrite (Cp) Chalcocite (Cc) Covellite (Cv) Cp+Cv+Cc+Dg (digenite) Cp+Cv+Dg+Cc+FeOx (iron oxyhydroxides) Cp+gangue
Malachite (Mal) Mal+FeOx
Chrysocolla (Ch) Total
14.5 3.86 7.33 3.30 6.02 9.75
28.03 19.98 6.16 99
The salient points from these studies were:
During the sulphide pre-flotation (roughers), recoveries were generally predominantly in the particle size range –150 µm and +38 µm and, despite the fairly good mineral liberation, recovery was poor for the coarse (+150 µm) and fines (–38 µm). In the acid-insoluble copper range (sulphide mineralization), chalcocite and chalcopyrite showed the best flotation response (64 to 65% recovery) while covellite had the worst response for both primary and secondary sulphides. However, “porous” chalcocite also had poor recoveries, mainly attributable to higher amount of reagents required to activate surfaces that hardly contribute to hydrophobicity towards air bubbles. Less than half of liberated chalcopyrite (45%) was recovered in the rougher stage, mostly due to partial transformation of chalcopyrite to iron oxyhydroxides. The rimming of these oxyhydroxides was seen to lower floatability of normally floatable mineral species. Even after sulphidisation, liberated chalcopyrite and covellite are the sulphide species that displayed lower recovery.
In the first sulphidisation stage (CPS 1), best recoveries were observed in the size range –150 µm and +75 µm. There was, however, very low recovery in the fines fraction (–38 µm). Compared with the roughers, there was better flotation response in CPS 1 with regard to sulphide recovery compared with the oxides. This was mainly attributed to the sulphidiser (NaHS) activating the tarnished or rimmed sulphide components. Secondary sulphides also showed a superior response to sulphidisation.
Malachite recovery only started to show up significantly in the second sulphidising stage (CPS 2). Additionally, the coarse fraction sulphides were seen to be activated and recovered at this stage. However, only 50% of the liberated malachite was recovered. Malachite associated with iron oxides and hydroxides is not recovered.
Major losses in the cleaning circuit were the coarse but prior-activated particles in the CPS stages. However, chalcopyrite was seen to be better recovered compared with other secondary sulphides, malachite and oxidized native copper in the cleaning section.
The main copper losses in the final tails, attributed to liberated chalcopyrite and malachite that should be recovered, if properly sulphidised, represented 16% and 28%, respectively. Malachite associated with iron oxides and hydroxides also contributed to a significant proportion of losses (20%). These losses are mainly attributed to sulphidisation efficiency. Even lower recoveries were noticed in malachite stained by iron oxyhydroxides. Chalcopyrite had slow floating tendencies as well. With the exception of covellite, the remainder of secondary sulphides had the best flotation responses. There was no evidence of chrysocolla floating.
72
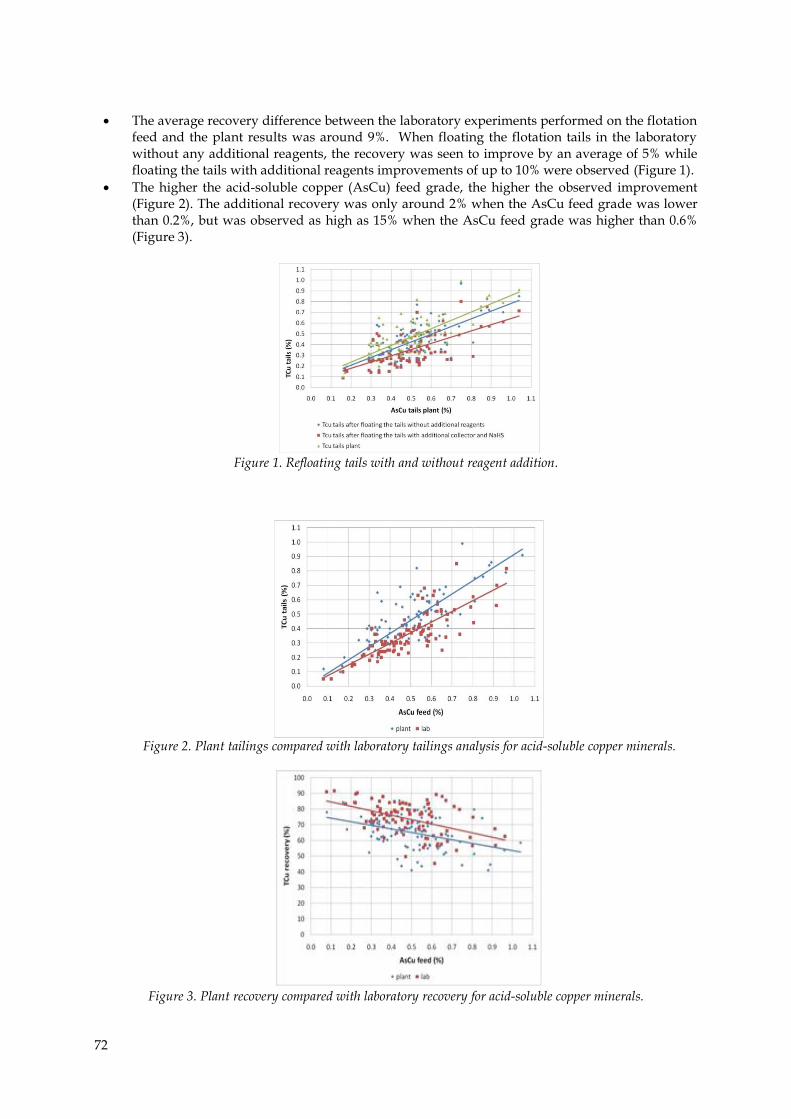
The average recovery difference between the laboratory experiments performed on the flotation feed and the plant results was around 9%. When floating the flotation tails in the laboratory without any additional reagents, the recovery was seen to improve by an average of 5% while floating the tails with additional reagents improvements of up to 10% were observed (Figure 1).
The higher the acid-soluble copper (AsCu) feed grade, the higher the observed improvement (Figure 2). The additional recovery was only around 2% when the AsCu feed grade was lower than 0.2%, but was observed as high as 15% when the AsCu feed grade was higher than 0.6% (Figure 3).
Figure 1. Refloating tails with and without reagent addition.
Figure 2. Plant tailings compared with laboratory tailings analysis for acid-soluble copper minerals.
Figure 3. Plant recovery compared with laboratory recovery for acid-soluble copper minerals.

73
In this paper, we review the subsequent circuit changes and modifications that were a result of the findings from this work undertaken up to 2011 and the various challenges that these changes introduced. Relevant points from the above work were:
The need for increased residence time and stages for both the roughers and the CPS stages to capture more of the slow-to-activate mineral species and size fractions. Findings of the mineralogical studies, coupled with test work, pointed to insufficient residence time and less- than-efficient sulphidisation. The slow-floating chalcopyrite needed more residence time and the fully liberated but lost malachite needed more sulphidisation stages and residence time.
The need to divert the mixed cleaner scavenger tails out of the mixed circuit because recirculating oxide mineral was increasing the possibility of this being lost to tails.
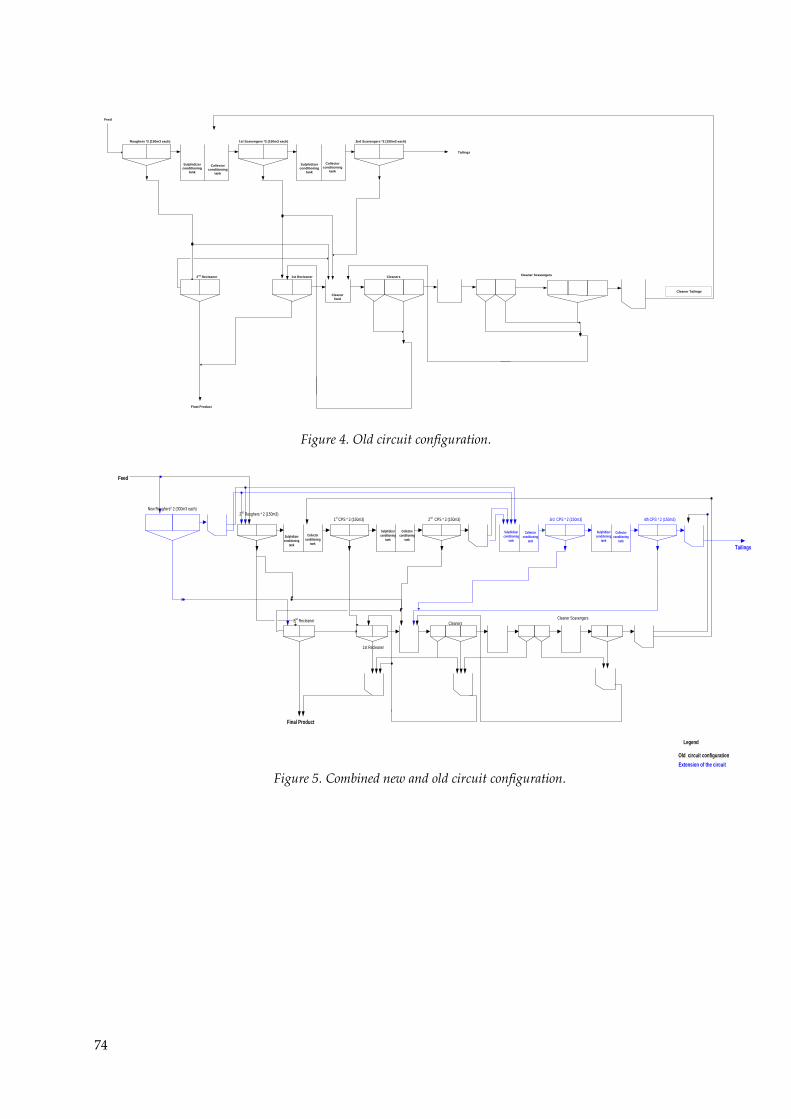
PLANT EXPANSIONS AND RESULTS Rougher/CPS Expansions
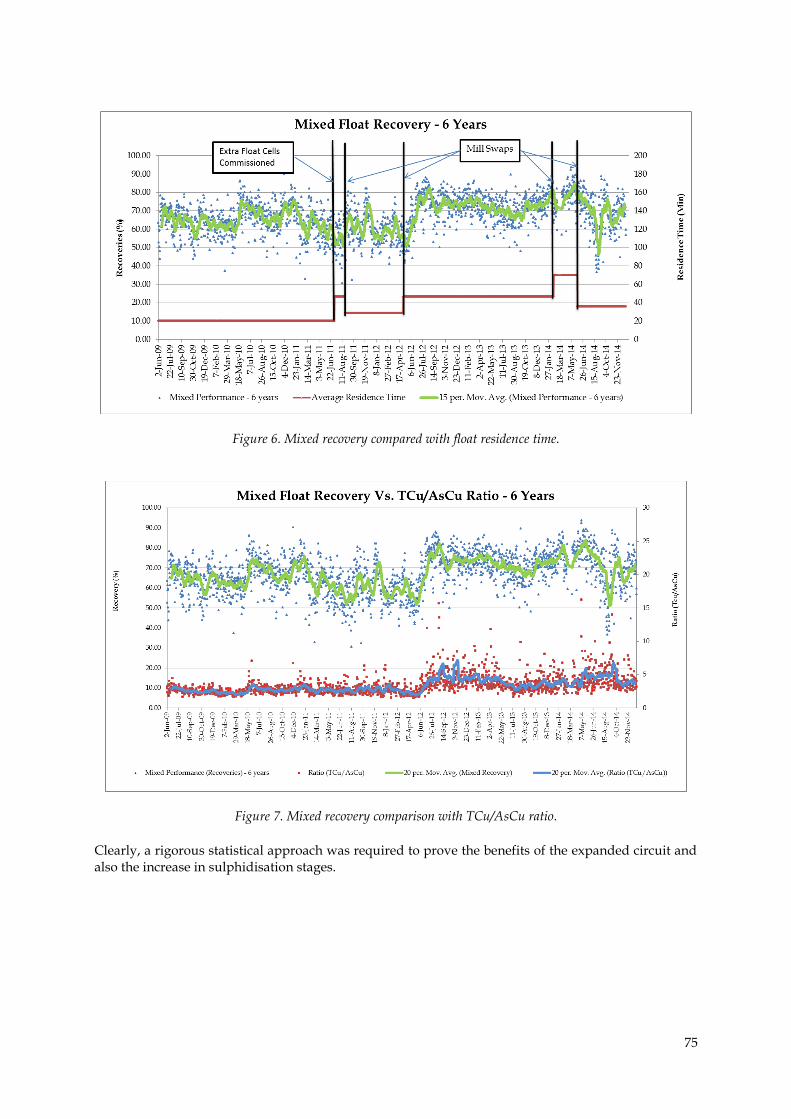
The results of the plant and laboratory test work and mineralogy analysis were used to justify and extend the mixed ore flotation plant, with the total changes costing around US$19 million. A more conservative recovery improvement of 5% was considered for the justification. In mid-2011, six 300 m3 float cells were commissioned, four cells dedicated to the sulphide flotation circuit and the other two being flexible between mixed and sulphide ore flotation, depending on milling circuit configuration. The volume capacity of the mixed ore flotation plant increased from 900 m3 to 1500 m3 or 2100 m3, depending on whether the 300 m3 cells are used for mixed ore flotation or not. In late 2011, an extension of the CPS plant was commissioned, to increase the number of sulphidisation intervals to the current four stages. From an initial 900 m3 total residence time and two sulphidisation stages, by the end of 2011 there was a total capacity of 2100 m3 and four sulphidisation stages available. Subsequently, residence time increased from an average 20 minutes to between 30-60 minutes depending on milling circuit configurations. Notably, during the same period in 2011, due to a shortfall of sulphide ore in the pit, it was decided that more of the mixed ores would be treated, utilizing the larger sulphide mills. This resulted in an 80% increase in daily throughput, effectively reducing the residence time through the mixed float circuit down to about 30 minutes from the expanded 45 minutes. Figure 4 and 5 depict the flowsheets before and after expansion, respectively. Figure 5 shows the additional float cells that were added.
Results from Mixed Circuit Expansions
From the results obtained after the mixed circuit expansions, it could, on first glance (Figure 6), be deduced that there was an immediate improvement, especially if the two periods of running the same mills on mixed ore (period before June 2011 and period after June 2012) are considered. However, as can be seen from Figure 7, recovery of the mixed ore through the Kansanshi circuit also has a very strong correlation with the TCu/AsCu ratio. The period 2011 and 2012 also coincided with the shift from treating predominantly stockpiled transitional ores to predominantly freshly mined ore from the pit. This ore was better grade-controlled for quality (AsCu grade which was found to be the best measure of weathering). Initially, classification of mixed ores was purely based on the amount of AsCu and GAC in the material. Freshly mined material also showed less characteristics of tarnishing. Figure 8 shows the progressive drop in sulphidiser consumption, especially during this same period of the circuit expansion.
74
Tailings
Cleaner
feed
Final Product
Feed
Sulphidizer
conditioning
tank
Collector
conditioning
tank
Collector
conditioning
tank
Sulphidizer
conditioning
tank
Cleaner Tailings
Roughers *2 (150m3 each) 1st Scavengers *2 (150m3 each) 2nd Scavengers *2 (150m3 each)
2nd
Recleaner 1st Recleaner CleanersCleaner Scavengers
Figure 4. Old circuit configuration.
Tailings
Final Product
Legend
Old circuit configuration
Extension of the circuit
Feed
New Roughers* 2 (300m3 each)2
nd Roughers * 2 (150m3)
1st CPS * 2 (150m3) 2
nd CPS * 2 (150m3) 3rd CPS * 2 (150m3) 4th CPS * 2 (150m3)
Sulphidizer
conditioning
tank
Collector
conditioning
tank
Collector
conditioning
tank
Collector
conditioning
tank
Collector
conditioning
tank
Sulphidizer
conditioning
tank
Sulphidizer
conditioning
tank
Sulphidizer
conditioning
tank
2nd
Recleaner
1st Recleaner
CleanersCleaner Scavengers
Figure 5. Combined new and old circuit configuration.
75
Figure 6. Mixed recovery compared with float residence time.
Figure 7. Mixed recovery comparison with TCu/AsCu ratio.
Clearly, a rigorous statistical approach was required to prove the benefits of the expanded circuit and also the increase in sulphidisation stages.
76
Figure 8. NaHS consumption over the six-year period.
The F-Test Results
As table III is illustrating, two sets of data recoveries were subjected to F-Tests. The first set of data was for 192 days (192 data points) taken from on either side of the mill swap which resulted in huge residence time changes. The new residence time was around 45 min, on average, compared with 20 min before the extension. A recovery difference of 7.45% (higher when residence time is 45 min) was noted with 100% confidence limits. Similarly, 204 data points were picked for before and after the mill swap in 2011/2012. This data set showed a 10% recovery drop when residence time is 30 min, again with 100% confidence limit.
Table III. F-test results.
Parameter
F-test results F-test two-sample for variance
Low residence time 1 (20 min)
High residence time 1 (45 min)
Low residence time 1 (20 min)
High residence time 1 (45 min)
Mean Variance Observations Df F P(F<=f) one-tail F Critical one-tail
68.43603 113.6457
204 203
2.451632 1.65E-10 1.260095
75.88294 46.3551
204 203
60.23057 63.02303
192 191
0.536166 9.88E-06 0.787708
70.30985 117.5439
192 191
Cleaner/Recleaner Flotation
The increase in roughing and CPS stages on the mixed circuit was therefore successful in reducing copper losses. However, the resulting multiple sub-concentrate discharge points caused a drop in final product (final concentrate) quality. The higher mass pulls, and consequently more volume reporting to the limited cleaner/recleaning flotation bank of only 288 m3 total volume, subdivided into nine float cells of 32 m3 each, led to higher insoluble component (silicates, aluminates, etc.) in the final combined concentrates. his resulted in significant smelter penalties. Figure 9 shows the trend of insolubles proportion in the mixed ore eventual final product, the recleaner concentrate. In August 2014, the cleaner/recleaning capacity was increased to offset this problem, to huge effect (Figure 9).
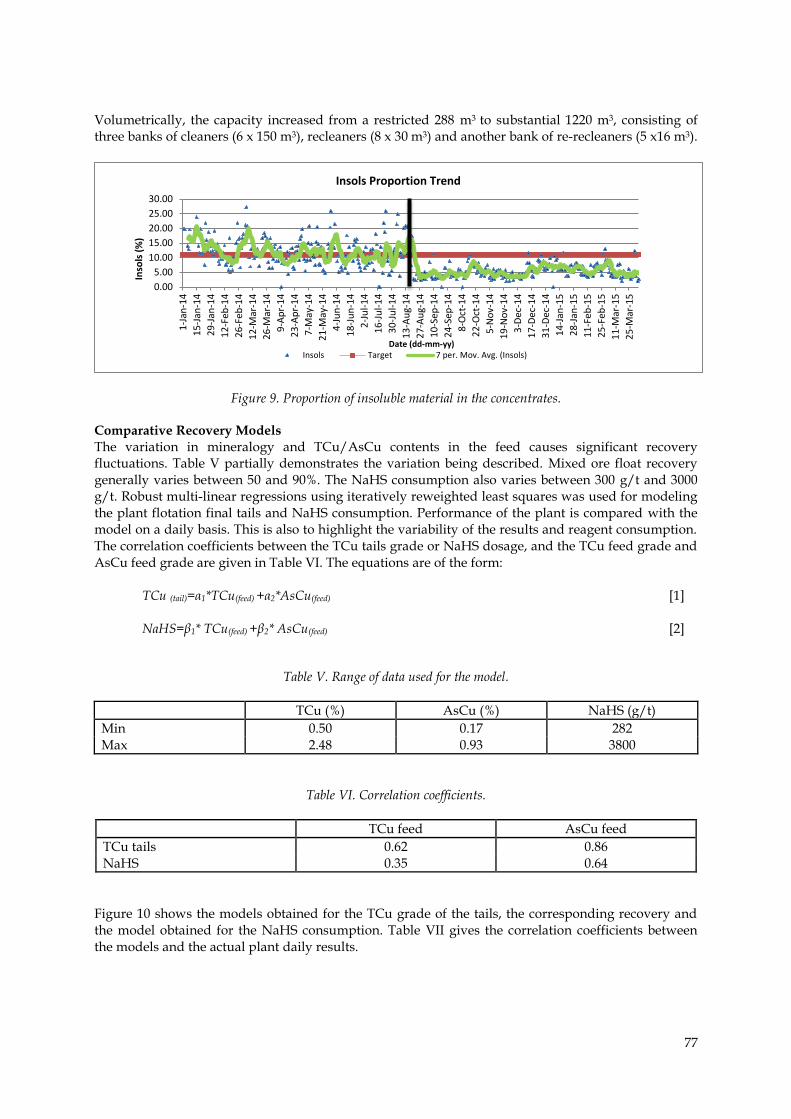
77
Volumetrically, the capacity increased from a restricted 288 m3 to substantial 1220 m3, consisting of three banks of cleaners (6 x 150 m3), recleaners (8 x 30 m3) and another bank of re-recleaners (5 x16 m3).
Figure 9. Proportion of insoluble material in the concentrates. Comparative Recovery Models
The variation in mineralogy and TCu/AsCu contents in the feed causes significant recovery fluctuations. Table V partially demonstrates the variation being described. Mixed ore float recovery generally varies between 50 and 90%. The NaHS consumption also varies between 300 g/t and 3000 g/t. Robust multi-linear regressions using iteratively reweighted least squares was used for modeling the plant flotation final tails and NaHS consumption. Performance of the plant is compared with the model on a daily basis. This is also to highlight the variability of the results and reagent consumption. The correlation coefficients between the TCu tails grade or NaHS dosage, and the TCu feed grade and AsCu feed grade are given in Table VI. The equations are of the form: TCu (tail)=α1*TCu(feed) +α2*AsCu(feed) [1] NaHS=β1* TCu(feed) +β2* AsCu(feed) [2]
Table V. Range of data used for the model.
TCu (%) AsCu (%) NaHS (g/t)
Min 0.50 0.17 282 Max 2.48 0.93 3800
Table VI. Correlation coefficients.
TCu feed AsCu feed
TCu tails 0.62 0.86 NaHS 0.35 0.64
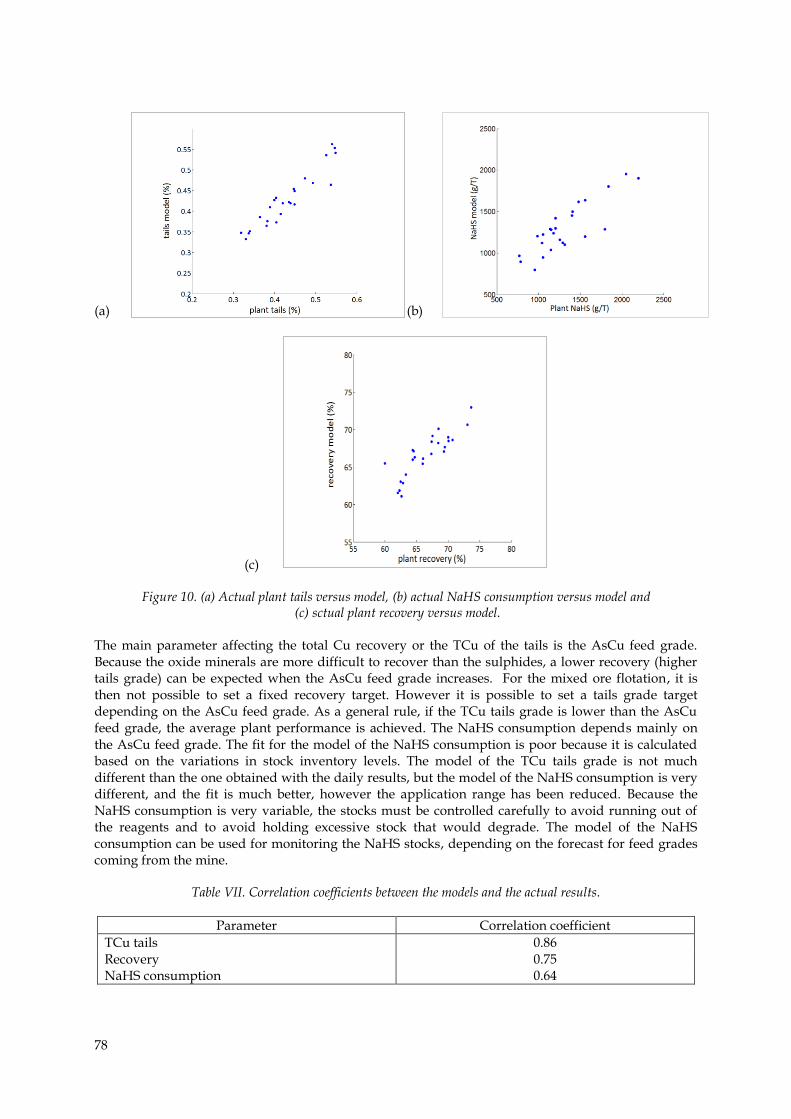
Figure 10 shows the models obtained for the TCu grade of the tails, the corresponding recovery and the model obtained for the NaHS consumption. Table VII gives the correlation coefficients between the models and the actual plant daily results.
0.00
5.00
10.00
15.00
20.00
25.00
30.00
1-J
an-1
4
15
-Jan
-14
29
-Jan
-14
12
-Feb
-14
26
-Feb
-14
12
-Mar
-14
26
-Mar
-14
9-A
pr-
14
23
-Ap
r-1
4
7-M
ay-1
4
21
-May
-14
4-J
un
-14
18
-Ju
n-1
4
2-J
ul-
14
16
-Ju
l-1
4
30
-Ju
l-1
4
13
-Au
g-1
4
27
-Au
g-1
4
10
-Sep
-14
24
-Sep
-14
8-O
ct-1
4
22
-Oct
-14
5-N
ov-
14
19
-No
v-1
4
3-D
ec-1
4
17
-Dec
-14
31
-Dec
-14
14
-Jan
-15
28
-Jan
-15
11
-Feb
-15
25
-Feb
-15
11
-Mar
-15
25
-Mar
-15
Inso
ls (
%)
Date (dd-mm-yy)
Insols Proportion Trend
Insols Target 7 per. Mov. Avg. (Insols)
78
(a) (b)
(c)
Figure 10. (a) Actual plant tails versus model, (b) actual NaHS consumption versus model and (c) sctual plant recovery versus model.
The main parameter affecting the total Cu recovery or the TCu of the tails is the AsCu feed grade. Because the oxide minerals are more difficult to recover than the sulphides, a lower recovery (higher tails grade) can be expected when the AsCu feed grade increases. For the mixed ore flotation, it is then not possible to set a fixed recovery target. However it is possible to set a tails grade target depending on the AsCu feed grade. As a general rule, if the TCu tails grade is lower than the AsCu feed grade, the average plant performance is achieved. The NaHS consumption depends mainly on the AsCu feed grade. The fit for the model of the NaHS consumption is poor because it is calculated based on the variations in stock inventory levels. The model of the TCu tails grade is not much different than the one obtained with the daily results, but the model of the NaHS consumption is very different, and the fit is much better, however the application range has been reduced. Because the NaHS consumption is very variable, the stocks must be controlled carefully to avoid running out of the reagents and to avoid holding excessive stock that would degrade. The model of the NaHS consumption can be used for monitoring the NaHS stocks, depending on the forecast for feed grades coming from the mine.
Table VII. Correlation coefficients between the models and the actual results.
Parameter Correlation coefficient
TCu tails 0.86 Recovery 0.75 NaHS consumption 0.64
79
CONCLUSIONS The envisaged improved recoveries from plant extensions and increasing the stage-wise addition of sulphidiser were achieved. Tarnished, and therefore slow-floating, chalcopyrite was given more residence time and opportunity to be recovered. In the same vein, the previously fully liberated but not recovered malachite was given better chance of recovery by a further two stages of sulphidisation at the tailings end of the old circuit. In the discussion of the mineralogical results, it is seen that most chalcopyrite was only recoverable after being activated by sulphidiser in the first stage of sulphidisation. Similarly, malachite recovery was only noticed in the second stage of sulphidisation. Another gain in having more sulphidisation stages is the recovery of liberated coarse-grained minerals. REFERENCES Castro, S., Soto, H., Goldfarb, J. and Laskowski J. (1973). Sulphidizing reactions in the flotation of
oxidized copper mineral II. Role of the adsorption and oxidation of sodium sulphide in the flotation of chrysocolla and malachite. International Journal of Mineral Processing, 1, 151–161.
Crozier, R.D. (1991). Flotation, Theory, Reagents and Ore Testing. Pergamon Press. Dunn, J.G. and Muzenda C. (2001). Thermal oxidation of covellite (CuS). Thermochimica Acta, 369 (1–2),
117–123. Ferron, C.J. and Manu, N.N. (1994). Recovery of copper oxide minerals by sulfidization flotation.
Lakefield Research, Canada. 11 pp. Lee, J.S., Nagaraj, D.R. and Coe, J.E. (1998). Practical aspects of oxide copper recovery with alkyl
hydroxamates. Minerals Engineering, 11 (10), 929–939. Lee, K., Archibald, D., Mclean, J., and Reuter, M.A. (2009). Flotation of mixed ore copper and sulphide
minerals with xanthate and hydroxamate collectors. Minerals Engineering, 22, 395–401. Jones, M.H. and Woodcock, J.T. (1978). Optimization and control of laboratory sulphidization of
oxidized copper ores with an ion selective electrode. Proceedings of the Australasian Institute of Mining and Metallurgy, (266), 11–17.
Kongolo, K., Kipoka, M., Minanga, K. and Mpoyo, M. (2003). Improving efficiency of oxide-cobalt ores flotation by combination of sulphidisers. Minerals Engineering, 16, 1023–1026.
Mwena, M.D. and Mpoyo, M. (2001). Improvements of cobalt recovery in flotation of curo-cobaltiferous ore at Gecamines. Proceedings of Copper Cobalt Nickel and Zinc Recovery. South African Institute of Mining and Metallurgy (Zimbabwe Branch), Johannesburg. pp. 1–9.
Ngulube, C, Paquot, FX (2012). Kansanshi Mixed Ore Treatment: Development and Optimization Presented at the SAIMM Conference 2012, Lubumbashi Congo.
Paquot, F.X., Bastin, D., Mukutuma, A. and Delaney, A. (2009). Metallurgical performances of the sulphidization route and the direct alkyl hydroxamates flotation of mixed carbonated copper-gold ores of the Kansanshi deposit. Presented at the Flotation 2009 Minerals Engineering Conference.

80