review article prognostic and clinicopathological...
TRANSCRIPT

Review ArticlePrognostic and Clinicopathological Significance ofDownregulated p16 Expression in Patients with Bladder Cancer:A Systematic Review and Meta-Analysis
Xiaoning Gan,1 Xiaomiao Lin,2 Rongquan He,3 Xinggu Lin,3 Hanlin Wang,1 Liyan Yan,1
Hong Zhou,1 Hui Qin,1 and Gang Chen1
1Department of Pathology, First Affiliated Hospital of Guangxi Medical University, Nanning,Guangxi Zhuang Autonomous Region 530021, China2Department of Children Rehabilitation Medicine, Guangxi Maternal and Child Health Hospital,225 Xinyang Road, Nanning, Guangxi Zhuang Autonomous Region 530003, China3Center of Genomic and Personalized Medicine, Guangxi Medical University, Nanning,Guangxi Zhuang Autonomous Region 530021, China
Correspondence should be addressed to Gang Chen; chen gang [email protected]
Received 15 September 2015; Accepted 27 March 2016
Academic Editor: Ja Hyeon Ku
Copyright © 2016 Xiaoning Gan et al. This is an open access article distributed under the Creative Commons Attribution License,which permits unrestricted use, distribution, and reproduction in any medium, provided the original work is properly cited.
p16, encoded by theCDKN2A gene, is a tumor suppressor that has beenwidely studied in cancer research. However, the relationshipof p16 with prognostic and clinicopathological parameters in patients with bladder cancer remains unclear. Data inclusion criteriawere articles reporting on the relationship between p16 expression and the prognosis or clinicopathology in patients with bladdercancer. Meta-analyses were performed with Stata software. Hazard ratios (HRs) or odds ratios (ORs) and 95% confidence intervals(95% CI) were calculated to evaluate the relative risks. The source of heterogeneity was analyzed by subgroup analysis. A totalof 37 studies with 2246 cases were included and analyzed. The results identified an important link between downregulated p16expression and poor prognosis in patients with bladder cancer in terms of recurrence-free survival (RFS), overall survival (OS),progression-free survival (PFS), and some clinicopathological parameters including clinical staging, pathological degree, and lymphnodemetastasis. Subgroup analysis also showed that lowp16 expression could function as awarning sign for RFS andPFS in patientswith early-stage (Ta–T1) bladder cancer. In conclusion, p16 might play an essential role in the deterioration of bladder cancer andcould serve as a biomarker for the prediction for patients’ progression and prognosis.
1. Introduction
Bladder cancer is the most frequent malignancy of theurinary tract and the ninth most common cancer world-wide [1]. About 95% of bladder cancers are histologicallytransitional cell carcinoma, with rare cases of squamous cellcarcinoma and adenocarcinoma. However, the pathogenesisof bladder cancer is still unclear, and its occurrence anddevelopment appear to be affected by multiple genes [2].Serrano et al. first cloned the cDNA of the gene encoding thetumor suppressor protein p16 (CDNK2A) in 1993; since thenit has been widely studied in the field of cancer research [3].
Previous studies have reported ubiquitous downregulationof p16 gene expression in bladder cancer, as a result of var-ious alterations including complete deletion, point muta-tion, or promoter methylation [4–6]. Furthermore, p16 couldcompete with cyclin D1 for binding to Cyclin DependentKinase (CDK) 4/6, thus blocking the phosphorylation ofretinoblastoma (Rb) protein and inhibiting release of thetranscription factor E2F, preventing cell conversion fromG1phase to S phase, and eventually suppressing cell pro-
liferation. These results suggest that abnormal expression ofthe p16 gene in cells might be associated with tumorigenesis[6, 7].
Hindawi Publishing CorporationDisease MarkersVolume 2016, Article ID 5259602, 13 pageshttp://dx.doi.org/10.1155/2016/5259602

2 Disease Markers
p53 p21
p16CDKN2Ap14
Rb
Cyclin D1
mdm2
Rb
E2F
Cell proliferation
PP
CDK4/CDK6
Chromosome 9
E2F
G1
S
HR? OR?
The occurrence and development of tumor
PFSOS RFS
Bladder cancerBladder cancer
Clinical parameter
Figure 1: Main molecular pathways of bladder cancer (adapted fromMitra et al. [7]).
Numerous studies to date have explored the clinico-pathological and prognostic significance of p16 in patientswith bladder cancer. However, as a result of differences insample sizes, accuracies of the statistical data, study popu-lations, and interventions, the results remain inconclusive,and evidence-based confirmation by large-scale clinical trialsis still lacking. We therefore conducted an in-depth system-atic review and meta-analysis to investigate the correlationbetween abnormal expression of p16 and clinicopathologicalfeatures, as well as prognosis in patients with bladder cancer.The specific mechanisms are shown in Figure 1.
2. Materials and Methods
2.1. Literature Search. The terms and combinations including“Cyclin Dependent Kinase Inhibitor p16,” “CDKN2A Pro-tein,” “p16INK4A Protein,” “MTS1 Protein,” “Cyclin Depen-dent Kinase Inhibitor 2A,” “Multiple Tumor Suppressor 1,”“Cdk4 Associated Protein p16,” “TP16,” and “urinary bladderneoplasms,” “bladder tumors,” “bladder cancers,” “bladdercarcinomas,” and “prognos∗,” “surviv∗,” “follow-up,” “mor-tality,” “predict,” “course,” “outcome,” and “clinicopatho-logical” were used to search the following domestic andinternational databases: PubMed, Wiley Online Library,Embase, Cochrane Central Register of Controlled Trials, Sci-ence Direct, EBSCO, Google Scholar, Ovid, LILACS, ChinaNational Knowledge Infrastructure (CNKI), China BiologyMedicine disc (CBMdisc), CQVIP, and Wan Fang, with uni-fied retrieval rules such as Boolean logic.The obtained searchresults were then analyzed, evaluated, reviewed, and manu-ally screened to determine their relevance.
2.2. Inclusion and Exclusion Criteria. Inclusion criteria wereas follows: (1) patients diagnosed with bladder cancer;(2) immunohistochemical (IHC) detection of p16 expres-sion levels in the tissues; (3) relationships between abnor-mal expression of p16 and prognostic indicators such asrecurrence-free survival (RFS), progression-free survival(PFS), and overall survival (OS) or associations betweenp16 and clinicopathological features that were evaluated;(4) hazard ratio (HR), odds ratio (OR), relative risk (RR),and 95% confidence intervals (CI) that could be obtaineddirectly from the full article or indirectly calculated withrelevant software based on the data provided in the graphicsand tables; (5) only the newest studies or the ones with higherquality were retained if the data were repeated in differentstudies; and (6) studies in English or Chinese.
Exclusion criteria were as follows: (1) cell or animal stud-ies, case reports, letters, reviews, and meta-analyses; (2) arti-cles with similar content or using the same data or thosewith small sample sizes (𝑛 ≤ 10) and those with no directlyor indirectly extractable HR, OR, and 95% CI data; and(3) articles that could not be understood because of languagebarriers.
2.3. Data Extraction. Two independent investigators (Xiaon-ing Gan and Rongquan He) reviewed the articles that metthe criteria and extracted data on author, year of publication,nationality, sample size, patient age, detection method ofp16, antibody source and dilution, clinical stage, pathologicaldegree, other costudied prognosis-associated genes, cut-offvalue, outcome, and extraction method of the study subjects.Discrepancies between the two independent investigators in

Disease Markers 3
364 potentially relevant studies identified on the basis of key searching terms
142 full-length articles assessed for eligibility
37 studies included for final analysis
222 studies were excluded by reviewing the title or abstract
105 studies were excluded:(1) Data overlapping or poor quality(2) No extractable HR/OR and 95%
CI data(3) Language barrier
Figure 2: Flow diagram of studies selection procedure.
terms of data extraction were resolved by discussion amongall the authors.
2.4. Statistical Analysis. Effects of p16 on the related prog-nostic indexes were detected by merging the HRs and 95%CI of the included literatures, which were evaluated throughthe Forest plot and related parameters after the merging. TheHRs and 95% CI values mainly came from direct extractionof the original text or survival curve through extraction andcalculation by software.
The relationships between p16 and the clinicopatho-logical parameters were derived from the binary variabledata extracted from the original articles. ORs and 95% CIvalues came from the binary variable data calculated by Statasoftware. The data were then combined, and their statisticalsignificance was evaluated by Forest plot and related param-eters, to clarify the relationship between p16 low-expressionand clinicopathological parameters.
Heterogeneity was measured by𝑄 statistics as follows: noheterogeneity: 0 < 𝐼2 < 25%; low heterogeneity: 25% ≤𝐼2< 50%; moderate heterogeneity: 50% ≤ 𝐼2 < 75%; high
heterogeneity: 75% ≤ 𝐼2 ≤ 100%. If 𝐼2 < 50% and 𝑃 >0.10, a fixed-effect model would be used in combination withHRs, ORs, and 95% CI; if 𝐼2 ≥ 50% and 𝑃 ≤ 0.10, then arandom-effect model would be selected. Heterogeneity anal-ysis was performed to assess the accuracy of the data, andsubgroup and sensitivity analyses were carried out based onprofessional knowledge.
Publication bias was detected by Begg’s funnel plot andEgger’s test with Stata software. A two-sided 𝑃 value < 0.05was considered to indicate statistical significance. Statisticalanalyses were carried out with StataSE 12.0, Engauge, Photo-shop CS5, and Microsoft Office 2007.
3. Results
3.1. Eligible Studies. A total of 364 articles were identifiedfrom the databases, including 190 English and 174 Chinesearticles, 222 of which were excluded because of discrepancies
between the study theme and their abstracts. The full textof the remaining 142 articles was then reviewed for theirfit with the current study, after which a further 105 articleswere excluded because they met one or more of the exclusioncriteria, such as the cell or animal studies, reviews, and lettersand studies with identical data and no extractable HR, OR,and 95% CI data from the full text or language barrier.The remaining 37 articles [4, 5, 8–42] with 2246 cases wereincluded in our study and consisted of 21 English [4, 5, 8–19, 21–25, 41, 42] and 16 Chinese [20, 26–40] articles. Thescreening process was demonstrated in Figure 2.
The basic features of the included studies were presentedin Table 1. Among the 37 articles, 26 studies [4, 5, 8–21, 28–34, 39, 41, 42] investigated the relationship betweenlow expression of p16 and prognostic parameters in bladdercancer patients (RFS, OS, PFS, and DSS/CSS), and 30 studies[4, 10–13, 15–19, 21–40] assessed the association betweenp16 and clinicopathological factors in patients with bladdercancer.
3.2. Relationship between Downregulated p16 Expression andRFS in Patients with Bladder Cancer. A total of 17 studieswith1032 subjects were included in the final analysis of RFS [4,5, 8, 10, 13–15, 19, 21, 28–34, 39]. Low expression of p16 wasrelated to poor RFS in patients with bladder cancer (HR =1.63, 95% CI = 1.36∼1.94, and 𝑃 < 0.001), with low observedheterogeneity (𝐼2 = 42.6%, 𝑃 = 0.029) (Figure 3(a)).
Cumulative meta-analysis based on year of publica-tion and sample size demonstrated that the results tendedto stabilize with increasing sample size, but there was noobvious relationship between the results and year of publi-cation.
Based on sensitivity analysis, the study by Yang et al.[13] was initially excluded because of a large difference inHR compared with the overall average, which was attributedto the selection of a different calculation method in theoriginal article. Binary variable data were extracted and theHR and 95% CI were therefore recalculated with Stata soft-ware.

4 Disease Markers
Table1:Mainfeatures
ofallstudies
inclu
dedin
them
eta-analysis.
Author
Year
Nation
No.b(M
/F)
Age
Stage
Grade
Cut-o
ffvalue
Outcome
Datae
xtraction
Other
costu
died
genes
Antibod
ysource
(dilu
tion)
Detectio
nmetho
dof
p16
Orlo
wetal.[4]
1999
Canada
120
NR
Ta–T
1G1–G3
Score=
3RF
S/CP
Repo
rted
P14
Vector
(1:500)
Immun
ohistochemistry
Bartolettietal.[8]
2007
Italy
56(50/6)
70.1(45–89)
Ta–T
1G1-G
210%
RFS
Repo
rted
9p21
Bio-Optica(
1:25)
Immun
ohistochemistry
Chakravartietal.[9]
2005
USA
50(36/14)
NR
T2–T
4High
20%
OS/FF
S/DSS
Repo
rted
Erb-1,Erb-2,P5
3,PR
BZy
med
(NR)
Immun
ohistochemistry
Hitching
setal.[10]
2004
UK
7866
(24–
90)
Ta–T
1G1–G3
10%
PFS/RF
S/CP
Repo
rted
P53,PR
BNovocastra(
1:50)
Immun
ohistochemistry
Kruger
etal.[5]
2005
Germany
73(60/13)
68(N
R)T1
G2-G3
10%
RFS/PF
SRe
ported
NR
Biocarta(1:50)
Immun
ohistochemistry
Leee
tal.[11]
2010
Korea
47(4/43)
NR
Ta–T
4Lo
wandhigh
Score=
5OS/CP
Repo
rted
P53,PR
BDAKO
(1:200)
Immun
ohistochemistry
Mhawechetal.[12]
2004
Switzerland
49(44/5)
70.3(52–90)
T1Lo
wandhigh
Score=
3PF
S/CP
Repo
rted
P21
DAKO
(1:20)
Immun
ohistochemistry
Yang
etal.[13]
2002
China
67NR
T1-T2
G1–G3
5%RF
S/CP
Binary
varia
ble
CyclinD1,CC
NE,
p27,p21,p53
SantaC
ruz(NR)
Immun
ohistochemistry
Brun
nere
tal.[14
]2008
Switzerland
99NR
Ta–T
4Lo
wandhigh
1.5%
or23%
OS/RF
SSurvivalcurve
MTS
NeoMarkers(1:50)
Immun
ohistochemistry
Friedrichetal.[15]
2001
Germany
40NR
Ta–T
1G1–G3
5%RF
S/CP
Survivalcurve
LOH
Pharmingen(1:100)
Immun
ohistochemistry
Korkolop
oulouetal.[16]
2001
Greece
2372
(35–92)
T3-T4
Lowandhigh
5%OS/CP
Survivalcurve
P53
SantaC
ruz(1:100)
Immun
ohistochemistry
Niehans
etal.[17]
1999
USA
7864
.7(48–82)
T1–T
4G2–G4
Score=
4DSS/CP
Survivalcurve
P53,PR
B,cyclinD1
Pharmingen(1:400)
Immun
ohistochemistry
Røtte
rudetal.[18]
2002
Norway
5964
(42–75)
T2–T
4G2-G3
Score=
3CS
S/CP
Survivalcurve
p21,p27
NeoMarkers(1:100)
Immun
ohistochemistry
Vallm
anya
Llenae
tal.[19
]200
6Spain
97NR
Ta–T
1Lo
wandhigh
15%
RFS/PF
S/OS/CP
Survivalcurve
p53,p21
DakoC
ytom
ation(N
R)Im
mun
ohistochemistry
Sunetal.[20]
2000
China
60NR
Tis–T4
G1–G3
Score=
4OS
Survivalcurve
PRb
SantaC
ruz(1:100)
Immun
ohistochemistry
Santos
etal.[21]
2003
Portugal
56(40/16)
70(43–83)
Ta–T
1G1-G
220%
RFS/CP
Binary
varia
ble
p27,pR
b,p53,Ki-67
Pharmingen(1:500)
Immun
ohistochemistry
Yinetal.[22]
2008
USA
18NR
T1–T
4Lo
wandhigh
Score=
4CP
Binary
varia
ble
9p21
Pharmingen(1:250)
Immun
ohistochemistry
Prim
dahl
etal.[23]
2002
Denmark
69(55/14)
71(42–83)
Ta–T
4G1–G4
Score=
4CP
Binary
varia
ble
Rb,p27,p21,L-m
ycNeoMarkers(1:50)
Immun
ohistochemistry
Jinetal.[24]
2006
USA
39(25/14)
65(42–84)
T2–T
4G1–G4
10%
CPBinary
varia
ble
P53,pR
BNR(1:50)
Immun
ohistochemistry
Tzaietal.[25]
2004
China(
Taiwan)
65(44/21)
61.5(41–84)
T2–T
4G2-G3
Score=
4CP
Binary
varia
ble
P53,pR
BSantaC
ruz(1:20)
Immun
ohistochemistry
Jinetal.[26]
2004
China
62(32/30)
61(18–80)
Tis–T4
G1–G3
OC
CPBinary
varia
ble
CyclinD1,PC
NA
NR
Immun
ohistochemistry
FuandLi
[27]
2011
China
50(39/11)
59.3(32–81)
Tis–T4
G1–G3
10%
CPBinary
varia
ble
E-cadh
erin
NR
Immun
ohistochemistry
Shietal.[28]
2001
China
62(52/10)
58.5(22–87)
Tis–T4
G1–G3
Score=
3RF
S/CP
Binary
varia
ble
PCNA
Zymed
(1:50)
Immun
ohistochemistry
Wang[29]
2001
China
49(39/10)
61(22–89)
NR
G1–G3
10%
RFS/CP
Binary
varia
ble
NR
NR
Immun
ohistochemistry
Miao[30]
1999
China
50NR
Tis–T4
G1–G3
OC
RFS/OS/CP
Binary
varia
ble
CyclinD1
SantaC
ruz(1:100)
Immun
ohistochemistry
Shietal.[31]
2003
China
82(65/17)
58.7(24–
72)
Tis–T4
G1–G3
OC
RFS/CP
Binary
varia
ble
CyclinD1
NR
Immun
ohistochemistry
Yang
[32]
2005
China
69(62/7)
61(42–75)
Tis–T4
G1–G3
5%RF
S/CP
Binary
varia
ble
P27/nm
23NR
Immun
ohistochemistry
Wangetal.[33]
2013
China
45(30/15)
65(38–80)
NR
H/L
5%RF
S/CP
Binary
varia
ble
PTEN
/P53
NR
Immun
ohistochemistry
Leng
etal.[34]
2000
China
51(43/8)
53.4(28–72)
Tis–T3
G1–G3
OC
RFS/OS/CP
Binary
varia
ble
bcl-2
SantaC
ruz(1:50)
Immun
ohistochemistry
Baiand
Xion
g[35]
2014
China
65(50/15)
(57.7±8.2)
Tis–T4
H/L
5%CP
Binary
varia
ble
mfn2
Zymed
(NR)
Immun
ohistochemistry
Wangetal.[36]
2000
China
75(62/13)
58.5(24–
81)
Tis–T4
G1–G3
OC
CPBinary
varia
ble
c-erbB
-2,p53
Maxim
(1:50)
Immun
ohistochemistry
Wangetal.[37]
2006
China
55(35/20)
63(24–
75)
Tis–T4
G1–G3
10%
CPBinary
varia
ble
hTER
T,cyclinD1,RB
NR
Immun
ohistochemistry
Luetal.[38]
2008
China
40(30/10)
54.2(37–79)
Tis–T4
G1–G3
10%
CPBinary
varia
ble
p53,PC
NA
NR(1:50)
Immun
ohistochemistry
Xiee
tal.[39]
2003
China
72(56/16)
NR(29–
78)
Tis–T4
G1–G3
5%RF
S/CP
Binary
varia
ble
Rb,cyclin
D1
Zymed
(1:50)
Immun
ohistochemistry
Qiu
etal.[40
]2006
China
53(46/7)
61(25–83)
Tis–T4
G1–G3
15%
CPBinary
varia
ble
NR
NR
Immun
ohistochemistry
Rebo
uissou
etal.[41]
2012
France
89NR
Ta–T
1G1–G3
Score=
3RF
S/PF
SSurvivalcurve
FGFR
3NR
FISH
Abatetal.[42]
2014
Turkey
34(30/4)
NR
T1–T
4Lo
wandhigh
OC
PFS
Repo
rted
p53
NR
FISH
M:m
ale;F:
female;RF
S:recurrence-fr
eesurvival;O
S:overallsurvival;PF
S:progression-fre
esurvival;D
SS:d
isease-specificsurvival;C
SS:cancer-specificsurvival;C
P:clinicopathologicalparameters;OC:
other
criteria
;NR:
notreported;No.b :nu
mbero
fpatients.

Disease Markers 5
Santos et al. (2003)
Hitchings et al. (2004)
Vallmanya Llena et al. (2006)
Yang (2005)
Xie et al. (2003)
Brunner et al. (2008)
Wang et al. (2013)
Wang et al. (2001)
Leng et al. (2000)
Brunner et al. (2008)
Orlow et al. (1999)
Miao et al. (1999)
Bartoletti et al. (2007)
Yang et al. (2002)
Shi et al. (2001)
Friedrich et al. (2001)
Shi et al. (2003)
Study ID
1.63 (1.36, 1.94)
4.65 (0.37, 59.04)
2.83 (1.01, 7.91)
0.96 (0.48, 1.90)
2.12 (1.19, 3.78)
HR (95% CI)
1.89 (0.77, 4.65)
1.71 (0.28, 10.43)
1.46 (0.51, 4.15)
0.88 (0.57, 1.34)
1.26 (0.81, 1.97)
1.67 (0.42, 6.60)
1.58 (0.77, 3.26)
1.94 (0.61, 6.24)
4.10 (2.45, 6.88)
3.00 (0.95, 9.48)
2.66 (0.95, 7.46)
1.04 (0.16, 6.93)
2.20 (0.89, 5.41)
1.34 (0.74, 2.44)
% weight
100.00
0.48
2.94
6.57
9.31
3.85
0.95
2.83
17.03
15.75
1.64
5.97
2.30
11.67
2.35
2.93
0.88
3.82
8.74
0.0169 1 59
Overall (I2 = 42.6%, P = 0.029)
et al. (2005)Kruger
(a)
Study ID % weightHR (95% CI)
Leng et al. (2000)
Brunner et al. (2008)
Korkolopoulou et al. (2001)
Lee et al. (2010)
Miao et al. (1999)
Vallmanya Llena et al. (2006)
Chakravarti et al. (2005)
Sun et al. (2000)
Brunner et al. (2008)
1.70 (1.16, 2.50)
2.86 (1.05, 7.81)
2.31 (0.13, 39.76)
4.22 (1.22, 14.64)
1.03 (0.53, 2.00)
4.17 (0.54, 31.88)
1.32 (0.19, 8.89)
1.41 (0.62, 3.17)
2.46 (0.56, 10.83)
1.41 (0.19, 11.36)
100.00
14.74
1.81
9.61
33.65
3.57
4.01
22.29
6.76
3.55
10.0252 39.8
Overall (I2 = 0.0%, P = 0.584)
(b)
Figure 3: Continued.

6 Disease Markers
Chakravarti et al. (2005)
Hitchings et al. (2004)
Mhawech et al. (2004)
Hitchings et al. (2004)
Vallmanya Llena et al. (2006)
1.84 (1.13, 3.01)
1.14 (0.39, 3.29)
2.92 (1.22, 7.07)
2.34 (0.55, 10.03)
1.86 (0.50, 6.90)
3.37 (0.67, 16.82)
0.70 (0.18, 2.69)
100.00
21.13
31.13
11.40
13.95
9.25
13.14
0.0595 1 16.8
Study ID % weightHR (95% CI)
Overall (I2 = 0.0%, P = 0.487)
et al. (2005)Kruger
(c)
Figure 3: Forrest plot of hazard ratio (HR) for the association of p16 with recurrence-free survival (RFS) (a), overall survival (OS) (b), andprogression-free survival (PFS) (c) in patients with bladder cancer.
Subgroup analysis based on geographic region showedthat low expression of p16 was associated with RFS in patientswith bladder cancer both in Asia (HR = 1.44, 95% CI = 1.15∼1.81, and 𝑃 = 0.002) and in Europe (HR = 1.90, 95% CI =1.13∼3.19, and 𝑃 < 0.001). The results of American studies(HR = 1.58, 95% CI = 0.77∼3.25, and 𝑃 = 0.214) need tobe confirmed with larger sample sizes. The heterogeneity ofAsian studies (𝐼2 = 30.7%, 𝑃 = 0.173) was lower than theoverall heterogeneity, while that of Europe (𝐼2 = 53.1%, 𝑃 =0.037) was higher, calculated with the random-effect model.
Subgroup analysis based on clinical stage suggested thatthe effect of p16 onRFSwas associatedwith clinical stage (Tis-T1 group: HR = 1.96, 95% CI = 1.23∼3.14, and 𝑃 < 0.001; 𝐼2 =55.5%, 𝑃 = 0.028; Tis–T4 group: HR = 1.41, 95% CI = 1.12∼1.77, and 𝑃 = 0.003; 𝐼2 = 10.2%, 𝑃 = 0.348).
Subgroup analysis based on histopathological gradeshowed that heterogeneity decreased fromG1-G2 (HR = 4.12,95% CI = 2.48∼6.83, and 𝑃 < 0.001; 𝐼2 = 0%, 𝑃 = 0.924), G1–G3 (HR= 1.44, 95%CI = 1.18∼1.75, and𝑃 < 0.001; 𝐼2 = 11.9%,𝑃 = 0.323), and G2-G3 (HR = 1.37, 95% CI = 0.78∼2.42, and𝑃 = 0.273; 𝐼2 = 0%, 𝑃 = 0.802), indicating that the effectsof p16 on RFS in patients with bladder cancer were closelyassociated with pathological grade.
Subgroup analysis also showed an effect of cut-off valueon the influence of p16 onRFS (cut-off value≤ 10%:HR= 1.83,95% CI = 1.34∼2.51, and 𝑃 < 0.001; 𝐼2 = 54.8%, 𝑃 = 0.009;cut-off > 10%: HR = 1.34, 95% CI = 0.86∼2.09, and 𝑃 = 0.003;𝐼2= 10.2%, 𝑃 = 0.348).In addition, subgroup analysis of early-stage data from
430 subjects from eight studies also demonstrated that lowexpression of p16 significantly affected RFS in patients withearly-stage (Ta–T1) bladder cancer (HR = 1.96, 95% CI =1.23∼3.14, and 𝑃 = 0.005; 𝐼2 = 47.9%, 𝑃 = 0.088).
3.3. Relationship between the Low Expression of p16 and OSin Patients with Bladder Cancer. A total of 425 subjects ineight studies were included in the final analysis of OS [9, 11,14, 16, 19, 20, 30, 34], which showed that low expression ofp16was associatedwith decreasedOS in patients with bladdercancer (HR = 1.70, 95% CI = 1.16∼2.50, and 𝑃 = 0.007), withno significant observed heterogeneity (𝐼2 = 0%, 𝑃 = 0.584)(Figure 3(b)).
Cumulative meta-analysis and sensitivity analysis indi-cated relatively low overall heterogeneity and no study withhigh sensitivity.
Subgroup analysis based on geographic area showed asubtle distinction between p16 expression and OS in patientswith bladder cancer in Asia (HR = 1.61, 95% CI = 0.97∼2.66,and 𝑃 = 0.065; 𝐼2 = 0%, 𝑃 = 0.703) and Europe (HR = 2.54,95% CI = 1.05∼6.15, and 𝑃 = 0.039; 𝐼2 = 27.0%, 𝑃 = 0.250).
Subgroup analysis was also performed based on clini-copathological stages. However, limitations of sample sizeled to the impossibility of determining if the effects of p16expression on OS were associated with these parameters inpatients with bladder cancer (Ta–T1 group: HR = 1.57, 95%CI =0.32∼7.75, and 𝑃 = 0.579; 𝐼2 = 0%, 𝑃 = 0.750; Ta–T4 group:HR = 1.59, 95% CI = 0.98∼2.60, and 𝑃 = 0.061; 𝐼2 = 3.1%,𝑃 = 0.389; T2–T4 group: HR = 1.96, 95% CI = 0.99∼3.88,and 𝑃 = 0.053; 𝐼2 = 52.1%, 𝑃 = 0.148; low-grade group:HR = 1.41, 95% CI = 0.18∼10.90, and 𝑃 = 0.742; 𝐼2 = 0.0%,𝑃 = 1.000; G1–G3 group: HR = 1.82, 95% CI = 1.16∼2.84, and𝑃 = 0.009; 𝐼2 = 3.9%, 𝑃 = 0.397; high-grade group: HR =1.41, 95% CI = 0.62–3.19, and 𝑃 = 0.409; 𝐼2 = 0%, 𝑃 = 1.000).
Subgroup analysis based on cut-off value indicated thatthe effects of p16 on OS in patients with bladder cancer wereassociated with cut-off value (cut-off value ≤ 10%: HR = 1.83,

Disease Markers 7
95%CI = 1.17∼2.86, and𝑃 = 0.008; 𝐼2 = 3.2%,𝑃 = 0.006; cut-off value > 10%: HR = 1.40, 95% CI = 0.66∼2.96, and 𝑃 =0.384; 𝐼2 = 0%, 𝑃 = 0.951).
3.4. Relationship between Low Expression of p16 and PFS inPatients with Bladder Cancer. A total of 470 subjects in sevenstudies were included in the ultimate analysis of PFS [5, 9,10, 12, 19, 41, 42]. The results showed a correlation betweenlow expression of p16 and poor PFS in patients with bladdercancer (HR = 2.18, 95% CI = 1.37∼3.48, and 𝑃 = 0.001), withlow heterogeneity detected (𝐼2 = 26.3%, 𝑃 = 0.219).
Cumulative meta-analysis revealed no obvious character-istics because of the limited range of publication dates and thesample sizes.
Sensitivity analysis identified two studies [41, 42] ashaving the highest heterogeneities. Further investigationrevealed that this heterogeneity was caused by differentmeth-ods of measuring p16 (fluorescence in situ hybridization)and studying the influence of hemizygous or homozygousdeletion of p16 on patient prognosis. These two studies werefinally excluded because of their incompatible study objec-tives, leaving a total of 347 subjects from six studies in the finalanalysis of PFS.The results showed that low expression of p16was correlated with poor PFS in patients with bladder cancer,and the heterogeneity was eliminated (HR = 1.84, 95% CI =1.13∼3.01, and 𝑃 = 0.015; 𝐼2 = 0%, 𝑃 = 0.487) (Figure 3(c)).
Despite a reduced sample size, subgroup analysis of the347 subjects from five studies [5, 9, 10, 12, 19] demonstratedthat the effects of p16 expression on PFS were affected byclinical stage (Ta–T1 group: HR = 2.09, 95% CI = 1.21∼3.63,and 𝑃 = 0.002; 𝐼2 = 0%, 𝑃 = 0.484; T2–T4 group: HR = 1.14,95% CI = 0.39∼3.31, and 𝑃 = 0.810; 𝐼2 = 0%, 𝑃 = 0.484) andgeographical location (Europe:HR=2.09, 95%CI= 1.21∼3.63,and 𝑃 = 0.002; 𝐼2 = 0%, 𝑃 = 0.484; America: HR = 1.14, 95%CI = 0.39∼3.31, and 𝑃 = 0.810).
Subgroup analysis based on cut-off value demonstratedsome relationship between cut-off value and the influence ofp16 expression on PFS (cut-off value ≤ 10%: HR = 2.61, 95%CI = 1.42∼4.77, and 𝑃 = 0.002; 𝐼2 = 0%, 𝑃 = 0.932; cut-offvalue > 10%: HR = 0.95, 95% CI = 0.41∼2.18, and 𝑃 = 0.896;𝐼2= 0%, 𝑃 = 0.579).The results from 297 subjects with early-stage (Ta–T1)
bladder cancer from four studies [5, 10, 12, 19] suggested thatlow expression of p16 was also significantly associated withpoor PFS in early-stage bladder cancer (HR = 2.09, 95% CI =1.21∼3.63, and 𝑃 = 0.002; 𝐼2 = 0%, 𝑃 = 0.484).
3.5. Relationship between Low Expression of p16 and DSS/CSSin Patients with Bladder Cancer. A total of 187 subjects fromthree studies were included in the DSS/CSS analysis [9, 17,18]; limitation of the sample size caused the impossibility ofdemonstrating an association between low expression of p16and DSS/CSS (HR = 1.52, 95% CI = 0.85∼2.71, and 𝑃 = 0.149;𝐼2= 0%, 𝑃 = 0.825).
3.6. Relationship between Low Expression of p16 and Clin-icopathological Parameters in Patients with Bladder Cancer.The relationship between low expression of p16 and clinico-pathological parameters [4, 10–13, 15–19, 21–40] was further
explored by analysis of 30 studies including 1785 subjects.Theresults of statistical analyses were as follows: T2–T4/Ta–T1:OR= 3.13, 95%CI = 2.42∼4.06, and𝑃 < 0.001; 𝐼2 = 1.4%,𝑃 =0.440; T1/Ta: OR = 1.55, 95% CI = 0.87∼2.76, and 𝑃 = 0.134;𝐼2= 40.5%, 𝑃 = 0.152; G3/G1-2 [43]: OR = 3.33, 95% CI =
2.51∼4.42, and 𝑃 < 0.001; 𝐼2 = 0%, 𝑃 = 0.519; and H/L [44]:OR = 1.20, 95% CI = 0.69∼2.33, and 𝑃 = 0.580; 𝐼2 = 61.8%,𝑃 = 0.011; because of the high heterogeneity, a random-effects model was therefore applied. Meanwhile, these resultsdemonstrated significant differences in the effects of low p16expression in patients with bladder cancer between the twoWHO clinical pathological grading methods in 1973 and2004.
Analysis of the results for lymph node metastasis showedOR = 2.20, 95% CI = 1.26∼3.83, and 𝑃 = 0.006; 𝐼2 = 27.2%,𝑃 = 0.240. The small sample size caused the impossibilityof demonstrating any significant influence of pathologicalparameters such as muscle invasion, tumor number (mul-tiple/single), and tumor size on the effect of p16 expression(Table 2).
3.7. Retrospective Review. Three studies [6, 24, 25] wereretrospectively reviewed because of differences between theirprognosis results and the data required by the meta-analysis.As shown in Table 3, low expression of p16 was associatedwith poor prognosis in patients with bladder cancer. How-ever, some of the 𝑃 values were <0.05 because of the smallsample sizes.
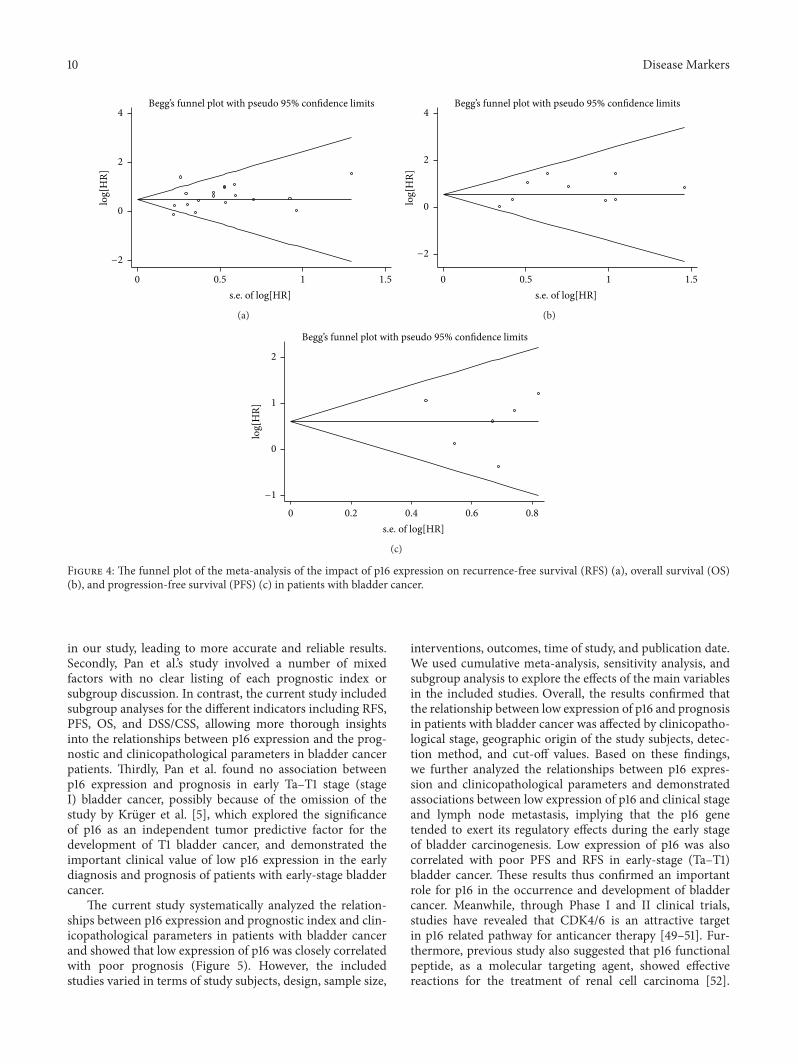
3.8. Publication Bias. Publication bias was detected by Begg’sfunnel plot and Egger’s test (Figure 4). The points represent-ing studies were symmetrically arranged in a funnel shape inthe funnel plot, and the 𝑃 values calculated from Egger’s testwith higher detection effectiveness were >0.05, indicating nopublication bias. The only exception was for RFS; the funnelplot was asymmetrical and with a few points outside thefunnel. Publication bias was also detected by Egger’s test (G1–G3 group: 𝑃 = 0.031; Asia group: 𝑃 = 0.020), indicatingpotential publication bias in terms of RFS.
4. Discussion
p16, also known as tumor suppressor gene I (multiple tumorsuppressor, MTS I), is located in 9p21 and is composed oftwo introns and three exons [45]. It is a key gene in cellcycle regulation, with its expression product being involvedin the negative regulation of cell proliferation. Studies haveshown that downregulation of p16 gene expression resultedin the loss of its inhibitory effects on CDK4/CDK6, which inturn may lead to malignant, abnormal cell proliferation andaccelerated tumor development [7, 46, 47]. Elucidation of therelationship between low expression of p16 and prognosis andclinicopathology in patients with bladder cancer is thereforeimportant for its early diagnosis, treatment, and prognosis.
Pan et al. performed a meta-analysis of the prognosticsignificance of abnormal p16 and p21 expression in bladdercancer in 2006 [48]. However, the current study analyzeda larger sample size; Pan et al.’s study included 12 articleswith 975 cases, compared with 37 articles and 2246 cases

8 Disease Markers
Table 2: Main meta-analysis results of p16 expression in patients with bladder cancer.
Analysis No.a (No.b) HR (95% CI) 𝑍 𝑃 Model Heterogeneity Publication bias𝐼2% 𝑃het Begg’s 𝑃 Egger’s 𝑃
RFS 18 (1032) 1.63 (1.36–1.94) 5.40 𝑃 < 0.001 F 42.6 0.029 0.405 0.246Europe 8 (365) 1.90 (1.13–3.19) 2.43 𝑃 = 0.003 R 53.1 0.037 1.000 0.749Asia 9 (547) 1.44 (1.15–1.81) 3.15 𝑃 = 0.002 F 30.7 0.173 0.348 0.020America 1 (120) 1.58 (0.77–3.25) 1.24 𝑃 = 0.214 F 0.0 / / /Ta–T1 8 (430) 1.96 (1.23–3.14) 2.82 𝑃 = 0.005 R 55.5 0.028 0.711 0.916Ta–T4 10 (602) 1.41 (1.12–1.77) 2.96 𝑃 = 0.003 F 10.2 0.348 1.000 0.062G1-G2 2 (75) 4.12 (2.48–6.83) 5.49 𝑃 < 0.001 F 0.0 0.924 1.000 /G1–G3 14 (762) 1.44 (1.18–1.75) 3.50 𝑃 < 0.001 F 11.9 0.323 0.584 0.031G2-G3 2 (95) 1.37 (0.78–2.42) 1.10 𝑃 = 0.273 F 0.0 0.802 1.000 /Cut-off value (≤10%) 13 (741) 1.83 (1.34–2.51) 3.79 𝑃 < 0.001 R 54.8 0.009 0.583 0.297Cut-off value (>10%) 5 (291) 1.34 (0.86–2.09) 1.28 𝑃 = 0.200 F 0.0 0.701 0.462 0.166OS 9 (425) 1.70 (1.16–2.50) 2.71 𝑃 = 0.007 F 0.0 0.584 0.602 0.165Europe 4 (167) 2.54 (1.05–6.15) 2.07 𝑃 = 0.039 F 27.0 0.250 1.000 0.289Asia 4 (208) 1.61 (0.97–2.66) 1.85 𝑃 = 0.065 F 0.0 0.703 0.734 0.166America 1 (50) 1.41 (0.62–3.19) 0.83 𝑃 = 0.409 F 0.0 / / /Ta–T4 5 (230) 1.59 (0.98–2.60) 1.87 𝑃 = 0.061 F 3.1 0.389 1.000 0.232Ta–T1 2 (122) 1.57 (0.32–7.75) 0.55 𝑃 = 0.579 F 0.0 0.750 1.000 /T2–T4 2 (73) 1.96 (0.99–3.88) 1.94 𝑃 = 0.053 R 52.1 0.148 1.000 /G1–G3 7 (353) 1.82 (1.16–2.84) 2.62 𝑃 = 0.009 F 3.9 0.397 / /L 1 (22) 1.41 (0.18–10.90) 0.33 𝑃 = 0.742 F / / / /H 1 (50) 1.41 (0.62–3.19) 0.83 𝑃 = 0.409 F / / / /Cut-off value (≤10%) 7 (278) 1.83 (1.17–2.86) 2.63 𝑃 = 0.008 F 3.2 0.402 0.764 0.185Cut-off value (>10%) 2 (147) 1.40 (0.66–2.96) 0.87 𝑃 = 0.384 F 0.0 0.951 1.000 /PFS 8 (470) 2.18 (1.37–3.48) 3.28 𝑃 < 0.001 F 26.3 0.219 0.174 0.325IHC 6 (347) 1.84 (1.13–3.01) 2.44 𝑃 = 0.015 F 0.0 0.487 1.000 0.754FISH 2 (123) 11.28 (2.45–51.83) 3.11 𝑃 = 0.002 F 0.0 0.718 1.000 /Europe 5 (297) 2.09 (1.21–3.63) 2.62 𝑃 = 0.009 F 0.0 0.484 1.000 0.607America 1 (50) 1.14 (0.39–3.31) 0.24 𝑃 = 0.810 F / / / /Ta–T1 5 (297) 2.09 (1.21–3.63) 2.62 𝑃 = 0.009 F 0.0 0.484 1.000 0.607T2–T4 1 (50) 1.14 (0.39–3.31) 0.24 𝑃 = 0.810 F / / / /G1–G3 5 (297) 2.09 (1.21–3.63) 2.62 𝑃 = 0.009 F 0.0 0.484 1.000 0.607H 1 (50) 1.14 (0.39–3.31) 0.24 𝑃 = 0.810 F / / / /Cut-off value (≤10%) 4 (200) 2.61 (1.42–4.77) 3.10 𝑃 = 0.002 F 0.0 0.932 1.000 0.746Cut-off value (>10%) 2 (147) 0.95 (0.41–2.18) 0.13 𝑃 = 0.896 F 0.0 0.579 1.000 /DSS/CSS 3 (187) 1.52 (0.85–2.71) 1.42 𝑃 = 0.155 F 0.0 0.825 0.296 0.517Clinicopathological parameters OR (95% CI)Stage (T2–T4 versus Ta–T1) 19 (1231) 3.13 (2.42–4.06) 8.63 𝑃 < 0.001 F 1.4 0.440 0.529 0.377Asia 14 (878) 3.41 (2.51–4.64) 7.87 𝑃 < 0.001 F 0.0 0.800 0.661 0.650Europe 3 (277) 3.17 (1.79–5.60) 3.96 𝑃 < 0.001 F 63.7 0.064 1.000 0.994America 2 (76) 1.15 (0.41–3.20) 0.26 𝑃 = 0.796 F 0.0 0.604 1.000 /Stage (T1 versus Ta) 5 (374) 1.55 (0.87–2.76) 1.50 𝑃 = 0.134 F 40.5 0.152 0.806 0.402Grade (G3 versus G1-2) 20 (1291) 3.33 (2.51–4.42) 8.32 𝑃 < 0.001 F 0.0 0.519 0.206 0.805Asia 15 (895) 3.36 (2.44–4.63) 7.41 𝑃 < 0.001 F 18.6 0.246 / /Europe 3 (196) 2.62 (1.23–5.57) 2.50 𝑃 = 0.013 F 0.0 0.984 / /America 2 (200) 4.51 (1.61–12.61) 2.87 𝑃 = 0.004 F 0.0 0.659 / /Grade (H versus L) 8 (688) 1.20 (0.62–2.33) 0.55 𝑃 = 0.580 R 61.8 0.011 0.063 0.080Lymph node metastasis (yes versus no) 5 (319) 2.20 (1.26–3.83) 2.77 𝑃 = 0.006 F 27.2 0.240 1.000 0.487Muscle Invasive (yes versus no) 4 (248) 2.18 (0.72–6.62) 1.38 𝑃 = 0.167 R 71.8 0.014 0.497 0.998Number of tumors (multiple versus single) 2 (166) 1.11 (0.43–2.85) 0.22 𝑃 = 0.823 F 0.0 0.984 1.000 /Tumor size (>3 versus ≤3) 2 (193) 2.93 (0.40–21.36) 1.06 𝑃 = 0.289 R 79.2 0.028 1.000 /RFS: recurrence-free survival; OS: overall survival; PFS: progression-free survival; DSS: disease-specific survival; CSS: cancer-specific survival; HR: hazardratio; OR: odds ratio; CI: confidence interval; No.a: number of studies; No.b: number of patients;𝑃het:𝑃 for the heterogeneity; F: fixed-effect model; R: random-effect model; L: low grade; H: high grade.

Disease Markers 9
Table3:Re
lationshipbetweenlowexpressio
nof
p16andotherp
rogn
ostic
factorsinpatie
ntsw
ithbladderc
ancer.
Author
Year
Nation
No.b(M
/F)
Age
Stage
Grade
Cut-o
ffvalue
Other
related
biom
arkers
Measurin
gmetho
dAntibod
ysource
(dilu
tion)
Outcome
𝑃value
Jinetal.[24]
2006
USA
39(25/14)
65(42–84)
T2–T
4G1–G4
10%
P53,pR
BIm
mun
ohistochemistry
NR(1:50)
OS/PF
S(2-yearsurvival)
0.001<0.001
Tzaietal.[25]
2004
China(
Taiwan)
65(44/21)
61.5(41–84)
T2–T
4G2-G3
Score=
4P5
3,pR
BIm
mun
ohistochemistry
SantaC
ruz(1:20)
PFS/DSS
0.74
0.49
Yurakh
etal.[6]
2006
Spain
55NR
Ta–T
4G1–G3
10%
9p21
(P14,P
15,P
16)
Immun
ohistochemistry
SantaC
ruz(1:500)
RFS/OS/PF
S(3-yearsurvival)
0.31
0.022
0.012
M:m
ale;F:female;RF
S:recurrence-fr
eesurvival;O
S:overallsurvival;PF
S:progression-fre
esurvival;DSS:dise
ase-specifics
urvival;NR:
notreported;No.b :nu
mbero
fpatients.
10 Disease Markers
Begg’s funnel plot with pseudo 95% confidence limits
−2
0
2
4lo
g[H
R]
0.5 1 1.50s.e. of log[HR]
(a)
Begg’s funnel plot with pseudo 95% confidence limits
−2
0
2
4
log[
HR]
0.5 1 1.50s.e. of log[HR]
(b)
Begg’s funnel plot with pseudo 95% confidence limits
−1
0
1
2
log[
HR]
0.2 0.4 0.6 0.80s.e. of log[HR]
(c)
Figure 4: The funnel plot of the meta-analysis of the impact of p16 expression on recurrence-free survival (RFS) (a), overall survival (OS)(b), and progression-free survival (PFS) (c) in patients with bladder cancer.
in our study, leading to more accurate and reliable results.Secondly, Pan et al.’s study involved a number of mixedfactors with no clear listing of each prognostic index orsubgroup discussion. In contrast, the current study includedsubgroup analyses for the different indicators including RFS,PFS, OS, and DSS/CSS, allowing more thorough insightsinto the relationships between p16 expression and the prog-nostic and clinicopathological parameters in bladder cancerpatients. Thirdly, Pan et al. found no association betweenp16 expression and prognosis in early Ta–T1 stage (stageI) bladder cancer, possibly because of the omission of thestudy by Kruger et al. [5], which explored the significanceof p16 as an independent tumor predictive factor for thedevelopment of T1 bladder cancer, and demonstrated theimportant clinical value of low p16 expression in the earlydiagnosis and prognosis of patients with early-stage bladdercancer.
The current study systematically analyzed the relation-ships between p16 expression and prognostic index and clin-icopathological parameters in patients with bladder cancerand showed that low expression of p16 was closely correlatedwith poor prognosis (Figure 5). However, the includedstudies varied in terms of study subjects, design, sample size,
interventions, outcomes, time of study, and publication date.We used cumulative meta-analysis, sensitivity analysis, andsubgroup analysis to explore the effects of the main variablesin the included studies. Overall, the results confirmed thatthe relationship between low expression of p16 and prognosisin patients with bladder cancer was affected by clinicopatho-logical stage, geographic origin of the study subjects, detec-tion method, and cut-off values. Based on these findings,we further analyzed the relationships between p16 expres-sion and clinicopathological parameters and demonstratedassociations between low expression of p16 and clinical stageand lymph node metastasis, implying that the p16 genetended to exert its regulatory effects during the early stageof bladder carcinogenesis. Low expression of p16 was alsocorrelated with poor PFS and RFS in early-stage (Ta–T1)bladder cancer. These results thus confirmed an importantrole for p16 in the occurrence and development of bladdercancer. Meanwhile, through Phase I and II clinical trials,studies have revealed that CDK4/6 is an attractive targetin p16 related pathway for anticancer therapy [49–51]. Fur-thermore, previous study also suggested that p16 functionalpeptide, as a molecular targeting agent, showed effectivereactions for the treatment of renal cell carcinoma [52].

Disease Markers 11
p53 p21
p16CDKN2Ap14
Rb
Cyclin D1
mdm2
Rb
E2F
Cell proliferation
PP
CDK4/CDK6
Chromosome 9
E2F
G1
S
The occurrence and development of tumor
Bladder cancer Bladder cancer
PFSOS RFS
1.70 1.841.63
Lymph node metastasisStage Grade
3.13 3.332.20
CDK4/CDK6
HR OR
Figure 5: Our results illustrated and improved the relationship between p16 and prognosis, as well as clinicopathological features.
The results of these researches and our current meta-analysis had the effect of mutual authentication. Therefore,a better understanding of the mechanism underlying thedevelopment and progression of bladder cancer may playa significant role in prevention, target therapy, and prog-nosis, particularly if more sensitive and specific correlativebiomarkers can be discovered and verified.
The current study had some limitations. First, tumorsare the result of both environmental and genetic factors,and p16 may thus be only one of several factors involvedin the whole process of bladder carcinogenesis. Secondly,heterogeneity may result from differences in interventionmeasures (surgery, radiotherapy, chemotherapy, or combi-nation), immunohistochemical techniques (different anti-bodies, evaluation standards, etc.), and the HR extractionmethods used in the included studies. Finally, the exclusion ofarticles because of language barriers and of studies that werenot published because of a lack of sufficient datamay have ledto potential publication bias.
In conclusion, the results of the current study provideevidence for a relationship between p16 expression andprognosis and clinicopathological features in patients withbladder cancer. The results of this meta-analysis will help toinform about the development of clinical guidelines promot-ing bestmedical care for patientswith bladder cancer. Furtherstudies are required to investigate the combined influence ofgenetic and environmental factors on the development andprogression of bladder cancer.
Abbreviations
RFS: Recurrence-free survivalOS: Overall survivalPFS: Progression-free survivalDSS: Disease-specific survivalCSS: Cancer-specific survivalHR: Hazard ratioOR: Odds ratioCI: Confidence interval.
Competing Interests
The authors declare that they have no competing interests.
Authors’ Contributions
Xiaoning Gan, Xiaomiao Lin, Rongquan He, Xinggu Lin,Hanlin Wang, Liyan Yan, Hong Zhou, and Hui Qin per-formed the literature search, data extraction, and statisticalanalysis and drafted the paper. Gang Chen supervised theliterature search, data extraction, and analysis and reviewedthe paper. Xiaoning Gan, Xiaomiao Lin, Rongquan He,Xinggu Lin, Hanlin Wang, Liyan Yan, Hong Zhou, Hui Qin,and Gang Chen read and approved the final paper.
References
[1] M. Ploeg, K. K. H. Aben, and L. A. Kiemeney, “The present andfuture burden of urinary bladder cancer in the world,” WorldJournal of Urology, vol. 27, no. 3, pp. 289–293, 2009.

12 Disease Markers
[2] D. S. Kaufman, W. U. Shipley, and A. S. Feldman, “Bladder can-cer,”The Lancet, vol. 374, no. 9685, pp. 239–249, 2009.
[3] M. Serrano, G. J. Hannon, and D. Beach, “A new regulatorymotif in cell-cycle control causing specific inhibition of cyclinD/CDK4,” Nature, vol. 366, no. 6456, pp. 704–707, 1993.
[4] I. Orlow, H. LaRue, I. Osman et al., “Deletions of the INK4Agene in superficial bladder tumors. Association with recur-rence,” The American Journal of Pathology, vol. 155, no. 1, pp.105–113, 1999.
[5] S. Kruger, A. Mahnken, I. Kausch, and A. C. Feller, “P16 immu-noreactivity is an independent predictor of tumor progressionin minimally invasive urothelial bladder carcinoma,” EuropeanUrology, vol. 47, no. 4, pp. 463–467, 2005.
[6] A. O. Yurakh, D. Ramos, S. Calabuig-Farinas et al., “Molecularand immunohistochemical analysis of the prognostic value ofcell-cycle regulators in urothelial neoplasms of the bladder,”European Urology, vol. 50, no. 3, pp. 506–515, 2006.
[7] A. P. Mitra, D. E. Hansel, and R. J. Cote, “Prognostic value ofcell-cycle regulation biomarkers in bladder cancer,” Seminars inOncology, vol. 39, no. 5, pp. 524–533, 2012.
[8] R. Bartoletti, T. Cai, G. Nesi, L. Roberta Girardi, G. Baroni, andM. Dal Canto, “Loss of P16 expression and chromosome 9p21LOH in predicting outcome of patients affected by superficialbladder cancer,” Journal of Surgical Research, vol. 143, no. 2, pp.422–427, 2007.
[9] A. Chakravarti, K. Winter, C.-L. Wu et al., “Expression of theepidermal growth factor receptor and Her-2 are predictorsof favorable outcome and reduced complete response rates,respectively, in patients with muscle-invading bladder cancerstreated by concurrent radiation and cisplatin-based chemother-apy: a report from the Radiation Therapy Oncology Group,”International Journal of Radiation Oncology Biology Physics, vol.62, no. 2, pp. 309–317, 2005.
[10] A. W. Hitchings, M. Kumar, S. Jordan, V. Nargund, J. Martin,and D. M. Berney, “Prediction of progression in pTa and pTlbladder carcinomas with p53, p16 and pRb,” British Journal ofCancer, vol. 91, no. 3, pp. 552–557, 2004.
[11] K. Lee, E. S. Jung, Y.-J. Choi, K. Y. Lee, and A. Lee, “Expressionof pRb, p53, p16 and cyclin D1 and their clinical implicationsin urothelial carcinoma,” Journal of KoreanMedical Science, vol.25, no. 10, pp. 1449–1455, 2010.
[12] P. Mhawech, V. Greloz, C. Oppikofer, I. Szalay-Quinodoz, andF. Herrmann, “Expression of cell cycle proteins in T1a andT1b urothelial bladder carcinoma and their value in predictingtumor progression,” Cancer, vol. 100, no. 11, pp. 2367–2375,2004.
[13] C.-C. Yang, K.-C. Chu, H.-Y. Chen, and W.-C. Chen, “Expres-sion of p16 and cyclin D1 in bladder cancer and correlation incancer progression,” Urologia Internationalis, vol. 69, no. 3, pp.190–194, 2002.
[14] A. Brunner, I. Verdorfer, M. Prelog, C. Mayerl, G. Mikuz, andA. Tzankov, “Large-scale analysis of cell cycle regulators inurothelial bladder cancer identifies p16 and p27 as potentiallyuseful prognostic markers,” Pathobiology, vol. 75, no. 1, pp. 25–33, 2008.
[15] M. G. Friedrich, C. Blind, K. Milde-Langosch et al., “Frequentp16/MTS1 inactivation in early stages of urothelial carcinoma ofthe bladder is not associated with tumor recurrence,” EuropeanUrology, vol. 40, no. 5, pp. 518–524, 2001.
[16] P. Korkolopoulou, P. Christodoulou, A. Lazaris et al., “Prog-nostic implications of aberrations in p16/pRb pathway inurothelial bladder carcinomas: a multivariate analysis includingp53 expression and proliferation markers,” European Urology,vol. 39, no. 2, pp. 167–177, 2001.
[17] G. A. Niehans, R. A. Kratzke, M. K. Froberg, D. M. Aeppli, P. L.Nguyen, and J. Geradts, “G1 checkpoint protein and p53 abnor-malities occur in most invasive transitional cell carcinomas ofthe urinary bladder,” British Journal of Cancer, vol. 80, no. 8, pp.1175–1184, 1999.
[18] R. Røtterud, E. O. Pettersen, A. Berner, R. Holm, D. R. Olsen,and S. D. Fossa, “Cell cycle inhibitors and outcome after radio-therapy in bladder cancer patients,”Acta Oncologica, vol. 41, no.5, pp. 463–470, 2002.
[19] F. R. Vallmanya Llena, A. Laborda Rodrıguez, J. Lloreta Trull,R. Cortadella Angel, J. Placer Santos, and A. Gelabert Mas,“Immunohistochemical expression of p53, p21, p16, and cyclinD1 in superficial bladder cancer. A tissue microarray study,”Actas Urologicas Espanolas, vol. 30, no. 8, pp. 754–762, 2006.
[20] G. Sun, Z. W. Chen, S. M. Zhang, and T. R. Ma, “Expressionof tumor suppressor gene Rb, MTS1 and prognosis of bladdercancer,” Chinese Journal of Clinical Oncology, vol. 27, pp. 177–179, 2000.
[21] L. L. Santos, T. Amaro, S. A. Pereira et al., “Expression of cell-cycle regulatory proteins and their prognostic value in super-ficial low-grade urothelial cell carcinoma of the bladder,” Euro-pean Journal of Surgical Oncology, vol. 29, no. 1, pp. 74–80, 2003.
[22] M. Yin, S. Bastacky, A. V. Parwani, T. McHale, and R. Dhir,“p16ink4 immunoreactivity is a reliable marker for urothelialcarcinoma in situ,”Human Pathology, vol. 39, no. 4, pp. 527–535,2008.
[23] H. Primdahl, H. Von der Maase, F. B. Sørensen, H. Wolf, andT. F. Ørntoft, “Immunohistochemical study of the expressionof cell cycle regulating proteins at different stages of bladdercancer,” Journal of Cancer Research and Clinical Oncology, vol.128, no. 6, pp. 295–301, 2002.
[24] J. O. Jin, J. Lehmann, J. Taxy et al., “Phase II trial of adjuvantgemcitabine plus cisplatin-based chemotherapy in patientswith locally advanced bladder cancer,” Clinical GenitourinaryCancer, vol. 5, no. 2, pp. 150–154, 2006.
[25] T.-S. Tzai, Y.-S. Tsai, and N.-H. Chow, “The prevalence andclinicopathologic correlate of p16INK4a, retinoblastoma and p53immunoreactivity in locally advanced urinary bladder cancer,”Urologic Oncology: Seminars and Original Investigations, vol. 22,no. 2, pp. 112–118, 2004.
[26] T. X. Jin, W. Y. Wu, X. G. Li, and D. M. Piao, “Expression andsignificance of cyclinD1, PCNA and p16 in transitional cell-carcinoma of the bladder,” Journal of Medical Science YanbianUniversity, vol. 27, pp. 279–282, 2004 (Chinese).
[27] Z. Q. Fu and W. Li, “The expression and significance of E-CD and p16 in transitional cell carcinoma of bladder,” ChineseJournal of Experimental Surgery, vol. 28, pp. 284–285, 2011(Chinese).
[28] H. L. Shi, R. J. Zhou, J. Y. Cheng et al., “Expression and signifi-cance of p16 and PCNA in bladder transitional cell carcinoma,”Shandong Medical Journal, vol. 41, pp. 12–14, 2001 (Chinese).
[29] H. W. Wang, “Expression of p16 gene in carcinoma of bladderand cystitis glandularis,”Modern Practical Medicine, vol. 13, pp.169–170, 2001 (Chinese).
[30] S. M. Miao, “p16 and cyclin D1 gene expressions in bladdertransition cell carcinoma,” Chinese Journal of Urology, vol. 20,pp. 419–421, 1999 (Chinese).

Disease Markers 13
[31] H. Q. Shi, S. X. Lou, and Q. W. Liu, “Significance of p16 andcyclin D1 expressions in human bladder transitional cell carci-noma,”Chinese Journal of Cancer Prevention and Treatment, vol.10, pp. 1174–1176, 2003 (Chinese).
[32] H. M. Yang, “p16 and nm23 expression in bladder carcinoma,”Journal of Oncology Practice, vol. 19, pp. 344–345, 2005 (Chi-nese).
[33] X. H. Wang, Y. Cui, and X. J. Meng, “The expression andsignificance of PTEN, p16 and mutant p53 in bladder cancer,”Shandong Medical Journal, vol. 53, pp. 37–39, 2013 (Chinese).
[34] J. Y. Leng, Y. Z. Zhang, X. D. Yao, and K. S. Wen, “Expression ofbcl-2 and p16 in transitional cell carcinoma of urinary bladder,”Chinese Journal of Surgery, vol. 38, no. 1, pp. 40–43, 2000(Chinese).
[35] Y. Bai and Y. J. Xiong, “Expression and significance of mfn2 andp16 in bladder cancer,” Shandong Medical Journal, vol. 54, pp.61–62, 2014 (Chinese).
[36] C. Y. Wang, X. J. Liu, L. G. Wang et al., “p16, p53 and c-erbB-2 gene expression in bladder carcinoma,” Chinese Journal ofPathology, vol. 29, no. 1, pp. 20–23, 2000 (Chinese).
[37] Y. C. Wang, H. K. Lu, and D. J. Gao, “Clinical significance ofhTERT and p16, cyclinD1, Rb expression in the transitionalcell carcinoma of urinary bladder,” Acta Academiae MedicinaeWeifang, vol. 28, pp. 103–106, 2006 (Chinese).
[38] T. Lu, W. M. Yang, and Z. Q. Ye, “The expression of p16, p53and PCNA proteins in transitional cell carcinoma of bladderand their significance,” Journal of Clinical Urology, vol. 23, pp.58–60, 2008 (Chinese).
[39] Q. X. Xie, F. D. Lin, Z. X. Hang, and X. Z. Lin, “Correlation andexpression of p16, pRb and cyclinD1 in bladder cancer,” ChinaJournal of Modern Medicine, vol. 13, pp. 25–27, 2003 (Chinese).
[40] X. F. Qiu, E. S. Han, and F. B. Chen, “Expression and clinicalsignificance of p16 protein in transitional cell carcinoma of thebladder,” Ningxia Medical Journal, vol. 28, pp. 578–579, 2006(Chinese).
[41] S. Rebouissou, A.Herault, E. Letouze et al., “CDKN2Ahomozy-gous deletion is associated with muscle invasion in FGFR3-mutated urothelial bladder carcinoma,” Journal of Pathology,vol. 227, no. 3, pp. 315–324, 2012.
[42] D. Abat, O. Demirhan, N. Inandiklioglu et al., “Genetic alter-ations of chromosomes, p53 and p16 genes in low- and high-grade bladder cancer,” Oncology Letters, vol. 8, no. 1, pp. 25–32,2014.
[43] F. K. Mostofi, L. H. Sobin, and H. Torloni, “Histological typingof urinary bladder tumours,” International Classification ofTumours 10, World Health Organization, Geneva, Switzerland,1973.
[44] J. Eble, G. Sauter, J. Epstein et al., Pathology and Genetics ofTumours of the Urinary System and Male Genital Organs, IARCPress, Lyon, France, 2004.
[45] A. Kamb, N. A. Gruis, J. Weaver-Feldhaus et al., “A cell cycleregulator potentially involved in genesis of many tumor types,”Science, vol. 264, no. 5157, pp. 436–440, 1994.
[46] V.H.Nargund, C. K. Tanabalan, andM.N. Kabir, “Managementof non-muscle-invasive (Superficial) bladder cancer,” Seminarsin Oncology, vol. 39, no. 5, pp. 559–572, 2012.
[47] D. G. Johnson and J. DeGregori, “Putting the oncogenic andtumor suppressive activities of E2F into context,” CurrentMolecular Medicine, vol. 6, no. 7, pp. 731–738, 2006.
[48] J. G. Pan, R. F. Han, and Y. Wang, “Significance of p16 gene andp21 gene expression abnormality in the prognosis of bladdercarcinoma: a meta-analysis,” Chinese Journal of Urology, vol. 27,pp. 400–403, 2006 (Chinese).
[49] K. T. Flaherty, P.M. LoRusso,A.DeMichele et al., “Phase I, dose-escalation trial of the oral cyclin-dependent kinase 4/6 inhibitorPD 0332991, administered using a 21-day schedule in patientswith advanced cancer,” Clinical Cancer Research, vol. 18, no. 2,pp. 568–576, 2012.
[50] M. A. Dickson, W. D. Tap, M. L. Keohan et al., “Phase II trialof the CDK4 inhibitor PD0332991 in patients with advancedCDK4-amplified well-differentiated or dedifferentiated liposar-coma,” Journal of Clinical Oncology, vol. 31, no. 16, pp. 2024–2028, 2013.
[51] G. Eilers, J. T. Czaplinski, M. Mayeda et al., “CDKN2A/p16 lossimplicates CDK4 as a therapeutic target in imatinib-resistantdermatofibrosarcoma protuberans,” Molecular Cancer Thera-peutics, vol. 14, no. 6, pp. 1346–1353, 2015.
[52] K. Zennami, K. Yoshikawa, E. Kondo et al., “A new moleculartargeted therapeutic approach for renal cell carcinoma witha p16 functional peptide using a novel transporter system,”Oncology Reports, vol. 26, no. 2, pp. 327–333, 2011.

Submit your manuscripts athttp://www.hindawi.com
Stem CellsInternational
Hindawi Publishing Corporationhttp://www.hindawi.com Volume 2014
Hindawi Publishing Corporationhttp://www.hindawi.com Volume 2014
MEDIATORSINFLAMMATION
of
Hindawi Publishing Corporationhttp://www.hindawi.com Volume 2014
Behavioural Neurology
EndocrinologyInternational Journal of
Hindawi Publishing Corporationhttp://www.hindawi.com Volume 2014
Hindawi Publishing Corporationhttp://www.hindawi.com Volume 2014
Disease Markers
Hindawi Publishing Corporationhttp://www.hindawi.com Volume 2014
BioMed Research International
OncologyJournal of
Hindawi Publishing Corporationhttp://www.hindawi.com Volume 2014
Hindawi Publishing Corporationhttp://www.hindawi.com Volume 2014
Oxidative Medicine and Cellular Longevity
Hindawi Publishing Corporationhttp://www.hindawi.com Volume 2014
PPAR Research
The Scientific World JournalHindawi Publishing Corporation http://www.hindawi.com Volume 2014
Immunology ResearchHindawi Publishing Corporationhttp://www.hindawi.com Volume 2014
Journal of
ObesityJournal of
Hindawi Publishing Corporationhttp://www.hindawi.com Volume 2014
Hindawi Publishing Corporationhttp://www.hindawi.com Volume 2014
Computational and Mathematical Methods in Medicine
OphthalmologyJournal of
Hindawi Publishing Corporationhttp://www.hindawi.com Volume 2014
Diabetes ResearchJournal of
Hindawi Publishing Corporationhttp://www.hindawi.com Volume 2014
Hindawi Publishing Corporationhttp://www.hindawi.com Volume 2014
Research and TreatmentAIDS
Hindawi Publishing Corporationhttp://www.hindawi.com Volume 2014
Gastroenterology Research and Practice
Hindawi Publishing Corporationhttp://www.hindawi.com Volume 2014
Parkinson’s Disease
Evidence-Based Complementary and Alternative Medicine
Volume 2014Hindawi Publishing Corporationhttp://www.hindawi.com