review article a review of optical nondestructive … review of optical nondestructive visual and...
TRANSCRIPT

Hindawi Publishing CorporationInternational Journal of SpectroscopyVolume 2013, Article ID 341402, 36 pageshttp://dx.doi.org/10.1155/2013/341402
Review ArticleA Review of Optical Nondestructive Visual and Near-InfraredMethods for Food Quality and Safety
Jarmo T. Alander,1 Vladimir Bochko,1 Birgitta Martinkauppi,1
Sirinnapa Saranwong,2 and Timo Mantere1
1 Department of Electrical and Energy Engineering, University of Vaasa, 65101 Vaasa, Finland2 Bruker Optics KK, 1-4-1 Shinkawa, Chuo-ku, Tokyo 104-0033, Japan
Correspondence should be addressed to Jarmo T. Alander; [email protected]
Received 3 October 2012; Revised 24 December 2012; Accepted 31 January 2013
Academic Editor: Jaan Laane
Copyright © 2013 Jarmo T. Alander et al. This is an open access article distributed under the Creative Commons AttributionLicense, which permits unrestricted use, distribution, and reproduction in any medium, provided the original work is properlycited.
This paper is a review of optical methods for online nondestructive food quality monitoring. The key spectral areas are the visualand near-infrared wavelengths. We have collected the information of over 260 papers published mainly during the last 20 years.Many of them use an analysis method called chemometrics which is shortly described in the paper. The main goal of this paperis to provide a general view of work done according to different FAO food classes. Hopefully using optical VIS/NIR spectroscopygives an idea of how to better meet market and consumer needs for high-quality food stuff.
1. Introduction
Consumers are the driving force in the food market. Theyhave become more health conscious, demanding and willingto pay for the “good quality.” The consumers’ trust for foodindustry has been diminished due to food scandals thusmaking it important to improve the safety monitoring.
The “quality” and “safety” have different meanings andaspects which depend on the food class, target market,criteria, and application. In some sense, the safety is part ofthe quality but here we separate these two because we like toemphasize the difference between how a human perceive thefood and how we can evaluate threats of health. Some unsafefood cannot be detected by manual inspection. The foodquality and safety evaluation has become more importantand the need for more comprehensive assessment for all foodbatches is adequate.
Even though a lot of research and development workhas been done on food safety and quality, more needs tobe done to find economic ways of monitoring food safety.In this paper, our purpose is to go through the subjectaccording to Food and Agriculture Organizations of the
United Nations (FAO) categories (http://www.fao.org/) andpublications related to quality and safety. These two factorscan be evaluated in many different methods and techniques.
The traditional methods are sensory evaluation, chem-ical analysis, and microbiological analysis. A more recentapproach in technical sense is optical techniques, especiallythe multispectral methods in visual and near-infrared wave-lengths. The optical methods can be used for nondestructive,fast, real-time, online monitoring of all samples (Huang et al.[1]). Table 1 gives a general comparison of these fourapproaches.
The sensory evaluation is the oldest method and still usedevery day. The evaluation is done by both consumers andprofessional food observers. It is relatively fast but hardlysuitable for a large amount of samples due to many reasonslike observer’s fatiguing. The reliability varies with food itemgroup and by person.The results are typically very subjective,depending onmany non-food-related factors, and difficult toevaluate quantitatively.
The chemical analysis is an objective technique whichoften provides reliable results if the monitored batch isrepresented well by the samples measured. It has some

2 International Journal of Spectroscopy
Table 1: Comparison of method properties.
Method Subjective/objective Sample/allSensory Subjective AllChemical Objective SampleMicrobiological Objective SampleNIR Objective All
limitations—the processes may not work correctly due tosome substances, the need of accurate and correct calibra-tions, the need of complex multiphased processing, and theneed of experts for the analysis. It might not be suitable ifthe distribution of the substance content is nonuniform. Itcannot provide a point measurement of the sample, only anaverage over the whole sample. Since the sample is destroyed,chemical analysis cannot be used for monitoring all foodunits. In addition, the price of the analysis per measurementmay be quite high and it produces toxic waste; thus, thenumber of samples for monitoring must be limited due toeconomic and ecological reasons. It is generally not very wellsuited for fast, online product management.
The microbiological analysis is usually applied to detectbiological organism like fungi or bacteria but not somuch foridentifying other content. It gives often objective and reliableresults provided that, for example, the culture do grow, thegrowth is detectable, or the sample is not contaminated bysome other sources. The analysis is typically slow and moretedious and expensive than the previous two methods. Themicrobiological analysis is suitable only for low speed, offlinemonitoring using a representative sample set of the batch.The main problem is that it allows defective products to bemanufactured even though the cheapest solution might be toimmediately stop processing and clean up the manufacturingunit.
To overcome the disadvantages and limitations of theprevious methods, new economic, fast, and environmentfriendly techniques are sought after. As a result, optical mul-tispectral measurements and imaging have recently becomemore and more popular in food measurements becausethey lend themselves easily to online monitoring of allsamples even without touching the samples. The price ofthe measurement instruments has also decreased so theyprovide a viable option for the traditional methods. However,analysis of spectral measurements is often not easy andrequires expertise. The mathematical and statistical modelscreated might not be general and need to be adjusted to newconditions and products. Nowadays, a typical optical systememploys ultraviolet (fluorescence) and visible wavelengths(VIS), near-infrared (NIR) or infrared (IR) areas or a com-binations of them. The near-infrared spectrum is especiallyinteresting since it is related to overtones and combinationsof such chemical bonds as C–H, O–H, and N–H which haveinfluence on many properties of food.
1.1. History. Food and agriculture have been subjects fornear-infrared (NIR) applications from the beginning ofNIR measurement history. The earliest work which involved
nondestructive moisture content determination of grain andseeds is published in [2] of the United State Department ofAgriculture (USDA). Later, the success of NIR spectroscopyis marked by the establishment of wheat protein analysisthroughout Canada by Phil Williams of the Canadian GrainCommission in 1975 [3]. In this area of application, at first,NIR was restricted to quality evaluation of low-moistureproducts such as cereal grains including wheat, corn, andsoybean due to interference of water absorption in thelong-wavelength region, especially in the combination areaof 1900–2500 nm. In the latter stages of NIR applications,the development of silicon sensors allowed acquisition inthe short-wavelength region of 700–1100 nm, leading to theanalysis of thicker and higher-moisture samples such as fruit,fish,meat, and intact kernels.The use of the short-wavelengthregion allows nondestructive measurement of relatively thicksamples since the electromagnetic wave in this region hasbetter penetration because the absorption of water in thisthird overtone band becomes weak.
According to Osborne [4], the major limitation of usingNIR spectroscopy for food analysis is its dependence on lessprecise reference methods. Since the chemical informationof sample is analyzed from the changes in spectra, in mostfood samples NIR spectroscopy needs calibration against areference method with the ingredient of interest.
Other optical methods have been studied for food qualitylately by many researchers, for example, Farkas and Dalmadi[5], Kaffka [6], and Huang et al. [7]. The optical methodscould alleviate these problems although they are not soaccurate. Another advantage of optics is that it can be imagingand thus characterizing the sample better. A popular spectralarea for food research has been near-infrared (NIR) in whichmany publications can be found like Huang et al. [7], Pallavet al. [8], Ozaki et al. [9], and Osborne [4].
Berrueta et al. [10] have recently made a review of super-vised pattern recognition methods in food analysis. Reid etal. [11] have made a review of different food authenticationmethods including NIRS. Cen and He [12] give a reviewof NIR reflectance spectroscopy in determination of foodquality.
Du and Sun [13] give a review of machine learningtechniques such as neural networks and evolutionary opti-mization in computer vision for food quality.
1.2. Optical NIR Measurements for Food
1.2.1. NIR Measurement Modes. There are four standardmeasurement modes for the acquisition of NIR spectrafrom a sample: transmission, reflection, transflection, andinteraction (interactance). Illustrations of these are shownin Figure 1. The selection of measurement mode dependson many factors like sample type or installment location.Generally, the design and implementation of measurementsystem and the selection of measurement mode require atleast some expertise.
In the transmission measurement mode (Figure 1(a)),incident light propagates through the sample and ismeasuredas it exits the sample at a point directly opposite to the light

International Journal of Spectroscopy 3
SampleD N
Sample
D
N
(a) Transmission
Sample
D
N
Sample
D
N
DD
(b) Reflection
Sample
N
Sample
D
N
DDD
CoverReflector
Reflector
(c) Transflection
Sample
D
N
Interactanceprobe
(d) Interaction
Figure 1: Sample presentation for near-infrared (NIR) spectroscopy. N: NIR light source, D: detector.
source. Occasionally, in the case of transmission for solidsamples, the detector is placed at an angle of 90 degrees tothe source.
For the reflectionmode (Figure 1(b)), the light source andthe detector are placed on the same side of sample. To avoidsurface reflection, detectors are usually placed at an angle of45 degrees to the sample plane. In some cases, an integratingsphere is used to concentrate light reflected from the samplebefore it reaches the detector by capturing and integratinglight from various directions.
Transflection (Figure 1(c)) is the combination of trans-mission and reflection modes. The sample is positionedas if for reflection mode measurement, but a reflector issituated opposite to the light source on the far side of thesample, reflecting light that is transmitted through the sampleback through the sample again to the detector. The samples,generally in liquid form, are placed in a holder of 0.1–0.3mmwidth along the direction of light propagation. Therefore,the physical path length of transflection mode is double thesample thickness. Transflection is often used to reduce pathlength as the thinnest cuvette (standard sample holder fortransmission measurements) is generally 1.0mm thick. Insome cases, transflection is employed for NIR instrumentswithout transmission capability.
The fourth configuration, the interactance mode(Figure 1(d)), is also a combination of transmission andreflection but for solid samples. In this mode, the sample isilluminated by a fiber-optic cable(s) in direct contact withthe sample surface or the sample holder. Light propagatesinside the sample and interacts with the interior through
reflection, transmission, and/or absorption. Fibre bundlesthat are placed on the same side as the source subsequentlyreturn the light that propagates inside the sample to thedetector. The direct contact between the fibre bundles (forboth the source and the detector) and the sample eliminatesthe effect of surface reflection andmaximizes the penetrationdepth.
1.2.2. Types of Food Samples. From the product viewpoint,NIR applications in food and agriculture could be classifiedinto three groups by the state of the sample: (i) liquidsamples, (ii) ground and relatively small solid samples, and(iii) relatively large samples that require nondestructive ornoninvasive measurement.
A benefit in working with samples from the first group(liquid samples) is the handling of optical path length. In thecase of a clear liquid such as soy sauce, filtrated fruit juice, orvegetable oil, samples can be contained in a quartz cuvette,a disposable glass vial, or a transflectance sample holder,all of which would provide a relatively high consistency ofoptical path length due to the low scattering characteristicsof the samples. The measurements used are transmission ortransflection. The sample thickness can be adjusted based onthe absorptivity of major composition(s) and the constituentof interest.
Figure 2 shows NIR spectra in the long-wavelengthregion of water and oil acquired in various physical pathlengths. According to the figure, if the sample analyzed iswater-rich and the constituent of interest has absorption

4 International Journal of Spectroscopy
5
4
3
2
1
0
1000 1200 1400 1600 1800 2000 2200 2400
10 mm
5 mm
2 mm
1 mm
Abso
rban
ce u
nits
(nm)
(a) Water measured at 1, 2, 5, and 10mm path length
2.4
2.2
2
1.8
1.6
1.4
800 1000 1200 1400 1600 1800 2000 2200 2400
Abso
rban
ce u
nits
(nm)
(b) Water measured at 0.2mm path length
5
4
3
2
1
0800 1000 1200 1400 1600 1800 2000 2200 2400
22 mm
8 mm
1 mm
Abso
rban
ce u
nits
(nm)
(c) Vegetable oil measured at 1, 8, and 22mm path length
Figure 2: NIR spectra of water and oil measured at different path lengths. (a)Water spectra when the path length is 1, 2, 5, or 10mm. (b)Waterspectra when the path length is 0.2mm. (c) Vegetable oil spectra when the path length is 1, 8, or 22mm. The shape and level of measuredspectra depend on the path length.
bands overlapped with water absorption, the appropriatephysical path length would be 0.2mm for the combinationregion measurement (1800–2100 nm), 1.0mm for the firstovertone region (1400–1500 nm), and 10mm for the secondovertone region (900–1000 nm). However, as a foremen-tioned, the decision for optical path length is also dependenton the molar absorptivity, that is, the ability of a particularsubstance to absorb light at a given wavelength, and theconcentration of that constituent of interest. In many cases,the constituent of interest has absorption bands on theshoulder of water bands such as in the region of 2100–2300 nm. In such cases, sample cells with longer physical pathlength, say 1mm, could be more appropriate than the 0.2mmsample cell due to lower absorptivity of substances in thisregion.
On the other hand, if the sample is oil-based, sample cellswith significant longer path length could be used due to thelower absorptivity of oil compared to water. In the case wherethe constituent of interest has very low absorptivity and/orconcentration, for example, acid value or peroxide value infresh vegetable oil, increasing physical path length to obtainadequate information is necessary.
However, one should keep in mind that the analysisof clear samples typically differs from that of the analysisof scattering samples. When colloids or suspensions areanalyzed, the scattering characteristics of the samples arestronger, and thus the optical path length, that is, the actual
distance that NIR wave travels, is much longer than that ofclear samples. Due to this, the path length would have tobe reduced. Figure 3 shows the NIR spectra of homogenizedmilk (colloid) and vegetable-mix juice (suspension) using a4mmpath length. In this case, milk has a stronger absorptiondue to its composition and the scattering characteristics ofthe constituent small fat globules. Vegetable-mix juice hasless absorbance compared to milk but stronger than that ofwater at 5mmpath length (for water, see Figure 2).This is dueto the scattering characteristics of the constituent suspendedparticles.
1.2.3. Some Important Considerations for Measurements.Another point to be aware of for liquid samples with water asa major constituent is the importance of temperature control.It is well documented [14–17] that water absorption bandsin the NIR region shift in both peak position and amplitudeaccording to sample temperature, as the number of hydrogenbonds in the water molecules is temperature dependent.Increasing temperature results in a higher percentage of watermolecules with fewer hydrogen bonds due to the higherkinetic energy.Therefore, in many cases, temperature controlis necessary to perform precise NIR measurements. Sincemany oil-based samples are in solid or opaque form at roomtemperature, temperature control is required not mainlyto maintain spectral consistency but to increase sampletransparency.

International Journal of Spectroscopy 5
800 1000 1200 1400 1600 1800 2000
Abso
rban
ce u
nits
54.5
43.5
32.5
21.5
1
Milk (colloid)
Vegetable-mix juice(suspension)
(nm)
Figure 3: NIR of milk (colloid) and vegetable-mix juice (sus-pension) measured with 4mm physical path length. Note: thepreamplifier gain used for milk was stronger than that of vegetable-mix juice due to very weak transmitted light.
For ground or small-particle samples, NIR spectra areusually acquired in reflection mode due to strong scatteringcharacteristics. Such samples are generally placed in sam-ple holders with quartz or glass windows. Quartz is moreexpensive but has lower OH absorption compared to glassresulting in better precision in some constituents, especiallythose with OH functional groups. However, in the casewhere the absorption of the constituent of interest occursat different wavelength region than the OH absorption inglass and there is enough concentration of those constituents,it is possible to use glass-window sample holder or glassPetri dish. For many food manufacturers, the use of glassor quartz is prohibited and plastic such as a polystyrenedish is used as a sample holder. In that case, the absorptionband of the constituent would fall within the absorptionbands for polystyrene, especially in the combination regionbeyond 2000 nm. If the absorption bands of the constituentcan be precisely measured in the shorter-wavelength regionby arranging an adequate path length and detector, the useof plastic dish would be applicable. For samples with arelatively coarse particle size, there is the possibility that lightcould pass through the space between samples and be lost.One way to reduce this problem is to place a reflector onthe back side of the sample cell. During the measurement,spinning the sample cell will increase the acquisition area,thus reducing error due to sample nonuniformity especiallyin relatively coarse or large-particle samples. Examples ofsamples belonging to this group include ground and intactcereal grains, cereal meals such as soy bean meals or corngluten meals, crushed processed foods/snacks, and powdermilk or drink.
Finally, we consider samples that require nondestructivemeasurement. Samples in this group includemeat, fish, intactfruit, and intact nut kernels. For the most part, these samplesare sold intact and the constituent of interest is not evenlydistributed between the surface and the sample core. Toobtain information from deep inside the sample, two modesof measurement are used for this group: the interactionmodeand the transmission mode. As mentioned earlier, most ofthe applications in this group use silicon detectors that allow
spectral acquisition in the short-wavelength region of 700–1100 nm.Themeasurement parameters could bemoisture andsugar contents for intact fruit and fat, protein, and moisturecontent in meat and kernels, as well as detection of variousinternal disorders or pest in agricultural products.
To employ NIR spectroscopy for routine quality control,it is not enough to develop calibration equations. A systemdeveloper needs to consider various factors affecting cali-bration results including instrument status (source strength,detector responses, and wavelength selection mechanism),atmospheric effects (temperature and humidity), and phys-ical conditions (dust, vibration, and stray light) as well astransferability of the equations developed between variousinstrument in the same period of time and the transferabilityto the newer version of instrument and software upon the endof instrument life span.
1.3. Chemometrics. Optical measurement results connectedwith chemical analysis and statistics are called chemometrics.Chemometrics has become an established technique forhandling chemical data. Good reviews of chemometrics areprovided by Geladi and Grahn [18], and Workman andSpringsteen [19], and Koljonen et al. [20], which present areview of genetic algorithmoptimization in chemometry.Thenext text is a short introduction for the subject, and for adeeper insight, the previous reviews are recommended.
The first step of chemometrics is to collect the data.This includes sample selection, measurements, and chemicalanalysis. The measurement geometry, measurement condi-tions, number of samples, and ingredients need to be verycarefully designed and determined. The samples need to berepresentative of the food batches because interpolation orgeneralization of the model most probably does not work.The samples are first subjected to optical measurement andafter that chemical analysis. One should also notice thatthe chemical analysis might sometimes provide unreliableresults. Sometimes even the samplesmay change during time.The data should be divided into a training and test sets.
After the measurements, the equations to transformoptical data to chemical data should be set up. Since manyfunctions and equations are available, it might be useful totest a couple of them to select the best results. After theselection, the equations need to be solved and coefficientsto be determined with the training set. A typical approachfor modeling is regression. The training of the model canbe understood as a “calibration.” The optical methods arecalibrated to produce the amount of a given substance orsubstances.
The training data should be subjected to detection ofresiduals, outliers, and nonlinearity. The outliers should beexcluded and nonlinearity corrected if present. Otherwisethe results might be distorted. Typically the number ofwavelengths from the optical measurements needs to bereduced due to their high amount and interdependence.Many techniques are available for wavelength reduction (e.g.,splines or Savitzky-Golay filtering).
Maybe the most often used regression models are mul-tiple linear regression (MLR) or “ordinary” least squares
6 International Journal of Spectroscopy
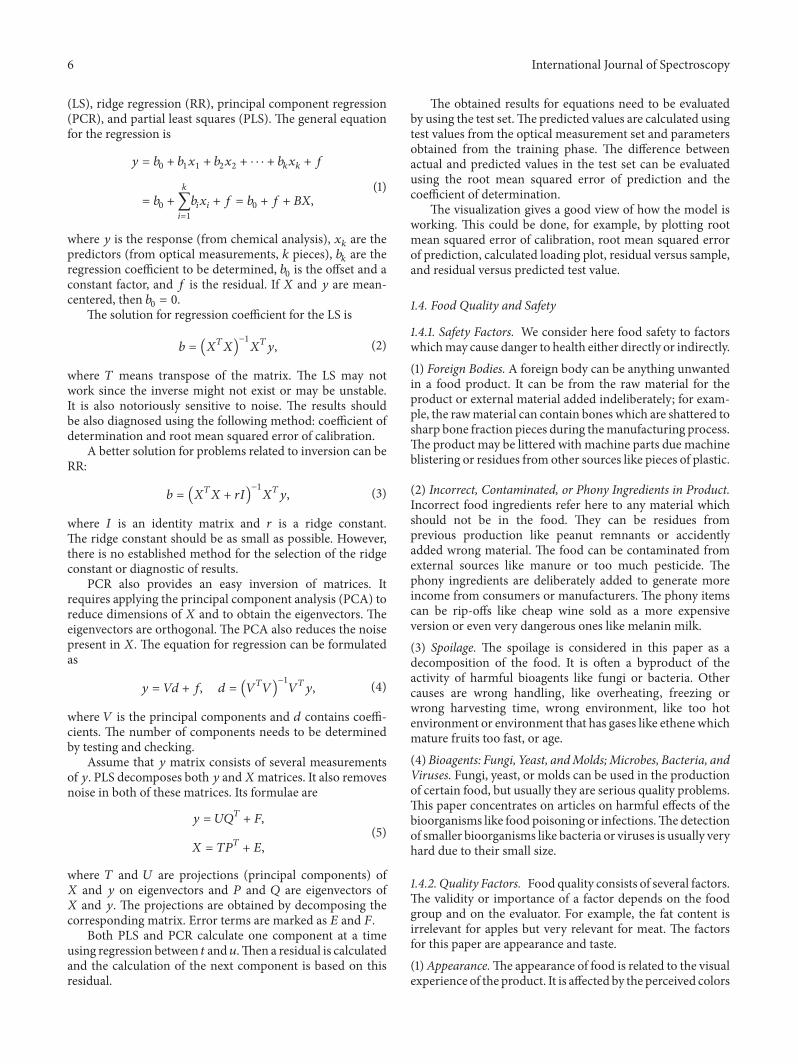
(LS), ridge regression (RR), principal component regression(PCR), and partial least squares (PLS). The general equationfor the regression is
𝑦 = 𝑏0+ 𝑏1𝑥1+ 𝑏2𝑥2+ ⋅ ⋅ ⋅ + 𝑏
𝑘𝑥𝑘+ 𝑓
= 𝑏0+
𝑘
∑
𝑖=1
𝑏𝑖𝑥𝑖+ 𝑓 = 𝑏
0+ 𝑓 + 𝐵𝑋,
(1)
where 𝑦 is the response (from chemical analysis), 𝑥𝑘are the
predictors (from optical measurements, 𝑘 pieces), 𝑏𝑘are the
regression coefficient to be determined, 𝑏0is the offset and a
constant factor, and 𝑓 is the residual. If 𝑋 and 𝑦 are mean-centered, then 𝑏
0= 0.
The solution for regression coefficient for the LS is
𝑏 = (𝑋𝑇𝑋)−1
𝑋𝑇𝑦, (2)
where 𝑇 means transpose of the matrix. The LS may notwork since the inverse might not exist or may be unstable.It is also notoriously sensitive to noise. The results shouldbe also diagnosed using the following method: coefficient ofdetermination and root mean squared error of calibration.
A better solution for problems related to inversion can beRR:
𝑏 = (𝑋𝑇𝑋 + 𝑟𝐼)
−1
𝑋𝑇𝑦, (3)
where 𝐼 is an identity matrix and 𝑟 is a ridge constant.The ridge constant should be as small as possible. However,there is no established method for the selection of the ridgeconstant or diagnostic of results.
PCR also provides an easy inversion of matrices. Itrequires applying the principal component analysis (PCA) toreduce dimensions of 𝑋 and to obtain the eigenvectors. Theeigenvectors are orthogonal. The PCA also reduces the noisepresent in 𝑋. The equation for regression can be formulatedas
𝑦 = 𝑉𝑑 + 𝑓, 𝑑 = (𝑉𝑇𝑉)−1
𝑉𝑇𝑦, (4)
where 𝑉 is the principal components and 𝑑 contains coeffi-cients. The number of components needs to be determinedby testing and checking.
Assume that 𝑦 matrix consists of several measurementsof 𝑦. PLS decomposes both 𝑦 and𝑋matrices. It also removesnoise in both of these matrices. Its formulae are
𝑦 = 𝑈𝑄𝑇+ 𝐹,
𝑋 = 𝑇𝑃𝑇+ 𝐸,
(5)
where 𝑇 and 𝑈 are projections (principal components) of𝑋 and 𝑦 on eigenvectors and 𝑃 and 𝑄 are eigenvectors of𝑋 and 𝑦. The projections are obtained by decomposing thecorresponding matrix. Error terms are marked as 𝐸 and 𝐹.
Both PLS and PCR calculate one component at a timeusing regression between 𝑡 and𝑢.Then a residual is calculatedand the calculation of the next component is based on thisresidual.
The obtained results for equations need to be evaluatedby using the test set.The predicted values are calculated usingtest values from the optical measurement set and parametersobtained from the training phase. The difference betweenactual and predicted values in the test set can be evaluatedusing the root mean squared error of prediction and thecoefficient of determination.
The visualization gives a good view of how the model isworking. This could be done, for example, by plotting rootmean squared error of calibration, root mean squared errorof prediction, calculated loading plot, residual versus sample,and residual versus predicted test value.
1.4. Food Quality and Safety
1.4.1. Safety Factors. We consider here food safety to factorswhichmay cause danger to health either directly or indirectly.(1) Foreign Bodies. A foreign body can be anything unwantedin a food product. It can be from the raw material for theproduct or external material added indeliberately; for exam-ple, the rawmaterial can contain bones which are shattered tosharp bone fraction pieces during themanufacturing process.The product may be littered with machine parts due machineblistering or residues from other sources like pieces of plastic.
(2) Incorrect, Contaminated, or Phony Ingredients in Product.Incorrect food ingredients refer here to any material whichshould not be in the food. They can be residues fromprevious production like peanut remnants or accidentlyadded wrong material. The food can be contaminated fromexternal sources like manure or too much pesticide. Thephony ingredients are deliberately added to generate moreincome from consumers or manufacturers. The phony itemscan be rip-offs like cheap wine sold as a more expensiveversion or even very dangerous ones like melanin milk.(3) Spoilage. The spoilage is considered in this paper as adecomposition of the food. It is often a byproduct of theactivity of harmful bioagents like fungi or bacteria. Othercauses are wrong handling, like overheating, freezing orwrong harvesting time, wrong environment, like too hotenvironment or environment that has gases like ethene whichmature fruits too fast, or age.(4)Bioagents: Fungi, Yeast, andMolds;Microbes, Bacteria, andViruses. Fungi, yeast, or molds can be used in the productionof certain food, but usually they are serious quality problems.This paper concentrates on articles on harmful effects of thebioorganisms like food poisoning or infections.The detectionof smaller bioorganisms like bacteria or viruses is usually veryhard due to their small size.
1.4.2. Quality Factors. Food quality consists of several factors.The validity or importance of a factor depends on the foodgroup and on the evaluator. For example, the fat content isirrelevant for apples but very relevant for meat. The factorsfor this paper are appearance and taste.(1)Appearance.The appearance of food is related to the visualexperience of the product. It is affected by the perceived colors

International Journal of Spectroscopy 7
and textures as well as personal preferences and opinions.The environment in which the food is presented has its owneffect. Since the color perceived depends on the prevailingillumination, for example, there are already available speciallamps to emphasize the color of meat. Good texture can beachieved with proper processing.(2) Taste. Taste is composed of several ingredients and isaffected greatly by smell and also appearance. In this paper,we limit the taste to the actual food ingredients or state-likeamount of sugar or acidity.Smell. The smell can be used to separate bad food from goodfood. It is also essential to make food more delicious.Juiciness. One attribute especially for fruit is juiciness. It isrelated to the water content and distribution of fruits.Noise. Consumers often expect certain noise when eatingfood like cereals.Freshness. Freshness is important especially for fish and othersea products.Authentication. Some food products have been falsified. Anexample of this kind of products is wine. Spectral methodscan be used to separate authentic wine from nonauthenticwine. The NIR spectra is used for food authentication by Sun[21].Essential Ingredients. Food can contain many elements whichhave positive effects on health. These elements include, forexample, flavonoids and vitamins in plants flavonoids andvitamins or omega-6 fatty acid in fish. It is generally thoughtthat the higher the amount obtained from food the betterthe effect on health. Ingredients can be correlated usingchemometrics.Unwanted Ingredients. Food contains also ingredients whichconsumers want to avoid for real or imaginary reasons.Theseingredients can be preservatives which can in fact makethe food safer. Other harmful ingredients include excessiveamount of fat or salt.Unwanted Objects. Although food can be perfectly safe andedible, it can still contain unwanted objects. This kind ofobjects can range from machine parts to stones and insectparts.
In their book, Workman and Weyer [22] explain theoret-ical backgrounds on how different qualities can be analyzedand found from NIR spectra; these qualities include alkanesand cycloalkanes, methylene groups, alkenes and alkynes,aromatic compounds, hydroxyls, water, carbonyls, aminesand amides, carbohydrates, amino acids, peptides, and pro-teins.High Quality. Affordable price consistently.Chemometric Models. None known.
1.5. Optimization. Optimization with NIR spectroscopy ismostly connected with the selection of optimal wavelengthsthat correlate best with the object of interest. Usually we wantto use as few wavelengths as possible, since the less the dataneeds to be analyzed the faster it is. However, we need to besure that the selected wavelengths are adequate for reliableresults.
A special type of genetic algorithms is called geneticprogramming (GP). It uses genetic algorithms to find afunction or a program to solve a given problem. GP hasbeen demonstrated to find solutions to problems that havebeen found by the most skilled engineers as patents andother inventions [23]. Another view of GP is to say that it issymbolic regression, that is, a method to find a function thatbest satisfies the given constraints. Yet another usage of GPis to find rules to explain data. GP is an extremely flexiblemethod to solve computational intelligence problems. Themain drawback of GP is its slow processing which preventsits usage inmost online applications. However, in the systemsdesign or similar phase, GP can be a nice tool to find goodsolutions automatically after the proper fitness function isimplemented.
While spectroscopy produces huge amounts of raw data,there is a strong need to automatically process this data tocompress it and to find the features that are relevant or corre-late to those that are looked for.Norris andWilliams [24] usedwavelength selection so that they selected 12 wavelengths thatproduced the closest prediction with the required constituentin wheat measurements, particle size, and protein content.Goodacre and Kell [25] have demonstrated spectroscopicalimaging GP applications related directly or indirectly tofood quality. More specifically the application was to findthe algebraic formula of the wavelengths that give the bestdiscrimination between the bacterial samples examined.More generally the authors claim that GP is one potential toolto decrypt metabolomic data for biomedical applications.
With several materials, the VIS/NIR reflectance worksbest if the wavelengths used are optimized between 400and 1800 nm [26]. This was also true with wholegrainmeasurement, where they found wavelengths between 1100and 1400 nm giving the highest correlations with most ofthe constituents of interest with wholegrain measurements.However, the protein content was best determined from the1700 to 2500 nm wavelength band.
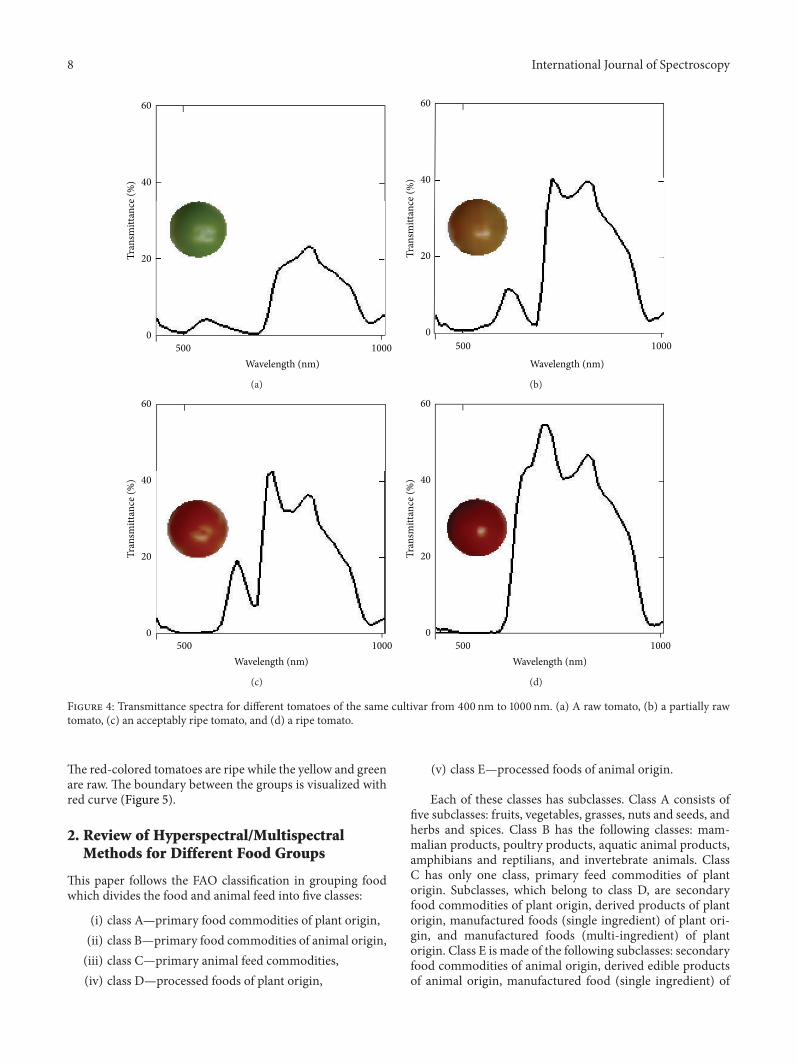
1.5.1. Illustrative Example of Tomato Classification. The spec-tralmethods lend themselves very well to fruit quality inspec-tion. In this example, the transmittance spectra of tomatoeswere measured using a spectrophotometer (Ocean optics).The spectra were further handled: they were smoothed toreduce noise and then downsampled by splines. An exampleof tomato spectra is shown in Figure 4. The transmittance ismeasured from 400 nm to 1000 nm.The spectra differ in bothvisible andNIR areas.The difference is caused by the ripeningprocess.
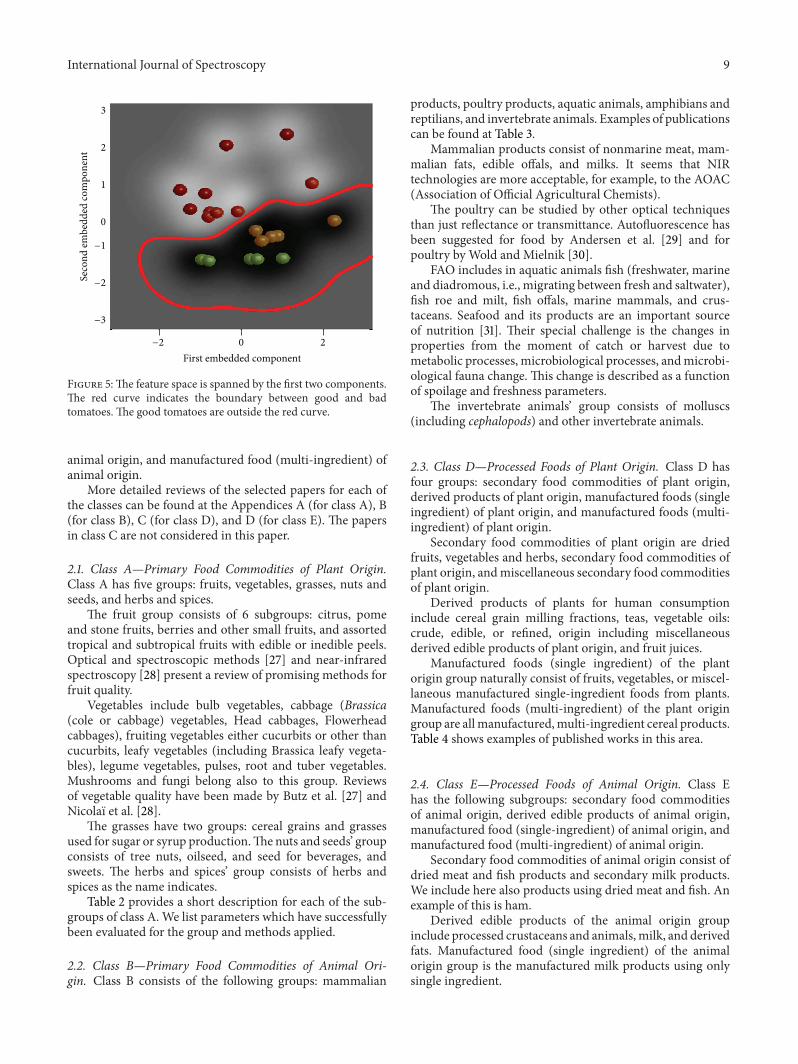
The spectral data itself contains a lot of information,part of which is in some cases irrelevant or redundant. Thedimensionality of data can therefore be reduced. Here thelocally linear embedding was used for this purpose in anonlinear manner. The visualization of results can be seen inFigure 5, in which the feature space is spanned by the first twoembedded components.
The kernel Fisher discriminant (KFD)was used to classifytomatoes into good and bad ones. As shown in Figure 5, thetomatoes are classified 100% correctly into these two groups.
8 International Journal of Spectroscopy
Tran
smitt
ance
(%)
60
40
20
0500 1000
Wavelength (nm)
(a)
Tran
smitt
ance
(%)
Wavelength (nm)
500 1000
60
40
20
0
(b)
Tran
smitt
ance
(%)
Wavelength (nm)500 1000
60
40
20
0
(c)
Tran
smitt
ance
(%)
Wavelength (nm)500 1000
60
40
20
0
(d)
Figure 4: Transmittance spectra for different tomatoes of the same cultivar from 400 nm to 1000 nm. (a) A raw tomato, (b) a partially rawtomato, (c) an acceptably ripe tomato, and (d) a ripe tomato.
The red-colored tomatoes are ripe while the yellow and greenare raw. The boundary between the groups is visualized withred curve (Figure 5).
2. Review of Hyperspectral/MultispectralMethods for Different Food Groups
This paper follows the FAO classification in grouping foodwhich divides the food and animal feed into five classes:
(i) class A—primary food commodities of plant origin,(ii) class B—primary food commodities of animal origin,(iii) class C—primary animal feed commodities,(iv) class D—processed foods of plant origin,
(v) class E—processed foods of animal origin.
Each of these classes has subclasses. Class A consists offive subclasses: fruits, vegetables, grasses, nuts and seeds, andherbs and spices. Class B has the following classes: mam-malian products, poultry products, aquatic animal products,amphibians and reptilians, and invertebrate animals. ClassC has only one class, primary feed commodities of plantorigin. Subclasses, which belong to class D, are secondaryfood commodities of plant origin, derived products of plantorigin, manufactured foods (single ingredient) of plant ori-gin, and manufactured foods (multi-ingredient) of plantorigin. Class E is made of the following subclasses: secondaryfood commodities of animal origin, derived edible productsof animal origin, manufactured food (single ingredient) of
International Journal of Spectroscopy 9
3
2
1
0
−1
−2
−3
−2 0 2
Seco
nd em
bedd
ed co
mpo
nent
First embedded component
Figure 5: The feature space is spanned by the first two components.The red curve indicates the boundary between good and badtomatoes. The good tomatoes are outside the red curve.
animal origin, and manufactured food (multi-ingredient) ofanimal origin.
More detailed reviews of the selected papers for each ofthe classes can be found at the Appendices A (for class A), B(for class B), C (for class D), and D (for class E). The papersin class C are not considered in this paper.
2.1. Class A—Primary Food Commodities of Plant Origin.Class A has five groups: fruits, vegetables, grasses, nuts andseeds, and herbs and spices.
The fruit group consists of 6 subgroups: citrus, pomeand stone fruits, berries and other small fruits, and assortedtropical and subtropical fruits with edible or inedible peels.Optical and spectroscopic methods [27] and near-infraredspectroscopy [28] present a review of promising methods forfruit quality.
Vegetables include bulb vegetables, cabbage (Brassica(cole or cabbage) vegetables, Head cabbages, Flowerheadcabbages), fruiting vegetables either cucurbits or other thancucurbits, leafy vegetables (including Brassica leafy vegeta-bles), legume vegetables, pulses, root and tuber vegetables.Mushrooms and fungi belong also to this group. Reviewsof vegetable quality have been made by Butz et al. [27] andNicolaı et al. [28].
The grasses have two groups: cereal grains and grassesused for sugar or syrup production.The nuts and seeds’ groupconsists of tree nuts, oilseed, and seed for beverages, andsweets. The herbs and spices’ group consists of herbs andspices as the name indicates.
Table 2 provides a short description for each of the sub-groups of class A. We list parameters which have successfullybeen evaluated for the group and methods applied.
2.2. Class B—Primary Food Commodities of Animal Ori-gin. Class B consists of the following groups: mammalian
products, poultry products, aquatic animals, amphibians andreptilians, and invertebrate animals. Examples of publicationscan be found at Table 3.
Mammalian products consist of nonmarine meat, mam-malian fats, edible offals, and milks. It seems that NIRtechnologies are more acceptable, for example, to the AOAC(Association of Official Agricultural Chemists).
The poultry can be studied by other optical techniquesthan just reflectance or transmittance. Autofluorescence hasbeen suggested for food by Andersen et al. [29] and forpoultry by Wold and Mielnik [30].
FAO includes in aquatic animals fish (freshwater, marineand diadromous, i.e., migrating between fresh and saltwater),fish roe and milt, fish offals, marine mammals, and crus-taceans. Seafood and its products are an important sourceof nutrition [31]. Their special challenge is the changes inproperties from the moment of catch or harvest due tometabolic processes, microbiological processes, andmicrobi-ological fauna change. This change is described as a functionof spoilage and freshness parameters.
The invertebrate animals’ group consists of molluscs(including cephalopods) and other invertebrate animals.
2.3. Class D—Processed Foods of Plant Origin. Class D hasfour groups: secondary food commodities of plant origin,derived products of plant origin, manufactured foods (singleingredient) of plant origin, and manufactured foods (multi-ingredient) of plant origin.
Secondary food commodities of plant origin are driedfruits, vegetables and herbs, secondary food commodities ofplant origin, andmiscellaneous secondary food commoditiesof plant origin.
Derived products of plants for human consumptioninclude cereal grain milling fractions, teas, vegetable oils:crude, edible, or refined, origin including miscellaneousderived edible products of plant origin, and fruit juices.
Manufactured foods (single ingredient) of the plantorigin group naturally consist of fruits, vegetables, or miscel-laneous manufactured single-ingredient foods from plants.Manufactured foods (multi-ingredient) of the plant origingroup are allmanufactured,multi-ingredient cereal products.Table 4 shows examples of published works in this area.
2.4. Class E—Processed Foods of Animal Origin. Class Ehas the following subgroups: secondary food commoditiesof animal origin, derived edible products of animal origin,manufactured food (single-ingredient) of animal origin, andmanufactured food (multi-ingredient) of animal origin.
Secondary food commodities of animal origin consist ofdried meat and fish products and secondary milk products.We include here also products using dried meat and fish. Anexample of this is ham.
Derived edible products of the animal origin groupinclude processed crustaceans and animals,milk, and derivedfats. Manufactured food (single ingredient) of the animalorigin group is the manufactured milk products using onlysingle ingredient.

10 International Journal of Spectroscopy
Table 2: Different food groups, their parameters and methods applied for class A.
Food group/appendix Examples of parameters evaluated and one of related research articles Methods applied
Fruit/A.1
QualityTaste (Mehinagic et al. [46])Content(i) Sugar (Walsh et al. [47])
MLR, PCR, PLS, PCAGenetic algorithms forwavelength and calibrationmodel selection
(ii) Soluble solid (Carlini et al. [48])(iii) acid content (Leon et al. [51])(iv) water/moisture (Blakey et al. [50])(v) titratable acidity and ph (Ying and Liu [56])(vi) vitamin C and polyphenol (Pissard et al. [57])Translucency (Terdwongworakul et al. [53])Internal quality (Magwaza et al. [54])Maturity (Tanaka and Kojima [58])Defects (Blasco et al. [262])SafetyInternal insect detection (Xing et al. [60])Fecal and other contaminations (Kim et al. [61] and Mehl et al. [263])Storage (Veraverbeke et al. [63])
Vegetables/A.2
Quality
Texture metrics, wavelengthselection, PLS, MLR, PCA
Appearance (Flores Rojas [65] and Gowen et al. [84])Content(i) Cyst nematode (Fernandez Pierna et al. [64])(ii) Sugar (Tsuta et al. [67])(iii) Soluble solid content, lycopene, 𝛽-carotene,and carotenoid (Pedro and Ferreira [68])(Iv) Protein (Liu et al. [69])(v) Phytic acid (Delwiche et al. [73])(vi) Dry matter (Van Dijk et al. [70])(vii) Protein (Pazdernik et al. [75])(viii) Freshness (Esquerre et al. [81])(ix) Moisture (Lamb and Hurburgh Jr. [78])Structural characteristics (Siska and Hurburgh Jr. [83])Damage (Esquerre et al. [81])SafetyIncorrect ingredients (Roggo et al. [72])Bioagents (Pearson and Wicklow [85] )
Grasses/A.3
Quality
PLS, MLR, PCA
Content(i) Moisture, gluten, alveograph parameters, and protein (Miralbes [90])(ii) Scab, vomitoxin, and ergosterol (Dowell et al. [89])(iii) Rutin and D-chiro-inositol (Yang and Ren [91])(iv) Carotenoids (Brenna and Berardo [92])(v) Phenolics and antioxidant capacity (Zhang et al. [94])(vi) Neutral acid detergent fibers and acid detergent lignin (Stubbs et al.[95])(vii) Nitrogen and protein (Wiley et al. [96])structural characteristics(i) Softness/hardness (Manley et al. [98])(ii) Density (Siska and Hurburgh Jr. [83])Taste (Kawamura et al. [99])Safetymany impurities like plastics or faeces (Fernandez Pierna et al. [64])

International Journal of Spectroscopy 11
Table 2: Continued.
Food group/appendix Examples of parameters evaluated and one of related research articles Methods applied
Nuts and seeds/A.4
Quality
PLS
Content(i) Moisture, fat, stearic acid, and oleic acids (Davrieux et al. [100])(ii) Sinigrin, gluconapin, and glucosinolate (Font et al. [101])(iii) Lipids, water, protein, and chlorophyll (Font et al. [102])(iv) Oil and fatty acid content (Kim et al. [103])(v) Starch (Hacisalihoglu et al. [104])(vi) Amino acids (Wang et al. [105])Authentication (Downey et al. [107])
Herbs and spices/A.5
Quality:
PLS
Content(i) Kava pyrones (Gautz et al. [110])(ii) Moisture, volatile content, and coloring strength (Zalacain et al. [111](iii) Curcuminoids (Tanaka et al. [112])(iv) Ginsenosides (Ren and Chen [113])(v) Lignans (Kwan et al. [114])Origin (Zalacain et al. [111])
Manufactured milk products using multi-ingredientbelong to manufactured food (single ingredient) of theanimal origin group. Here we consider dairy products likecheese or yogurts. Some publications has been listed inTable 5.
2.5. Other Foods Not Included in FAO Criteria. Some foodsare not included in FAO classification although they arecommonly used. For example, honey is not included. Thereis no clear category for processed foods like hamburgersor sausages. Some of the research done for these foods isintroduced here.
2.5.1. Authentication. There have been cases in which theingredients of manufactured food have been replaced bya cheaper version. For example, beef hamburger can beadulterated with mutton, pork, skim milk powder, or wheatflour. Ding and Xu [32] used near-infrared for detectingand evaluating the adulteration level in the adulteratedhamburgers with 5–25% phony ingredients. The accuracyincreases as a function of adulteration rate since there weremore ingredients to be detected. The highest detection ratewas 92.7%.
ElMasry et al. [33] have applied hyperspectral imaging(Imspector N17E, Specim, Spectral Imaging Ltd., Oulu, Fin-land) in the region 900–1700 nm for predicting colour, pH,and tenderness of fresh beef. With more improvement interms of speed and processing, their approach has potentialfor nondestructive quality measurements.
Liao et al. [34] have used VIS/NIR reflectance spec-troscopy for the online assessment of the pH value in freshpork. Their result show that VIS/NIR spectroscopy can beused for the online prediction of pH and that wavelengthselection can provide a cost-effective calibration model. Forwavelength selection, they compared variable importance in
projection (VIP), uninformative varible elimination (UVE),genetic algorithms, and success project algorithm (SPA).
Collell et al. [35] have used NIR reflectance spectroscopyto predict moisture, water activity, and salt content on thesurface of dry-cured ham during the process. Their resultsshow that the proposed method could be used in the dry-curing process of ham. However, the optical properties of themeat surface seem to strongly affect the measured spectra.
Authenticity and origin are also important issues forhoney especially when it is claimed to be collected by beesfrom certain flowers. One example is avocado honey. Dvashet al. [36] applied near-infrared reflectance spectroscopy toobtain the concentration of specific sugar (perseitol) for thishoney.
Downey and Kelly [37] studied sulfited strawberry andraspberry purees which have been adulterated with cookedapples (10–75% w/w). They applied VIS and NIR tran-sreflectance measurement on 0.1mm thick samples. Thebest wavelength bands were 400–1098 nm with 75% correctclassification rate for strawberry and 750–1098 nm with 95%rate for raspberry. PLS regression was used for the predictionof apple content with 400–1880 nm range for raspberry andwith 1100–1880 nm range for strawberry.They concluded thatapple adulteration can be detected if its content exceeds 25%for raspberry and 20% for strawberry purees.
Fugel et al. [38] made a review about authenticity controlof fruit purees, fruit preparations, and jams.
2.5.2. Content. Qiu et al. [39] applied near-infrared trans-mittance to quantify the chemical content of honey. Theyfound that 1mm optical path length was the best for thispurpose. Modified partial least squares were applied forthe determination of content except for moisture. Moisturewas determined using just partial least squares. The modelswere successful for fructose, glucose, sucrose, and maltose

12 International Journal of Spectroscopy
Table 3: Class B groups.
Food group/appendix Examples of parameters evaluated and one of related research articles Methods applied
Mammalian products/B.1
Quality
Color, geometrical features,textureMultivariate data analysis, ratios,MLR, PCA, PLS
Taste (Byrne et al. [120])Color (Van den Oord and Wesdorp [124])Diet (Prieto et al. [130])Content(i) pH (Andres et al. [128])(ii) Moisture (Chan et al. [135])(iii) Fat (Sierra et al. [136])(iv) Iron (Hong and Yasumoto [139])(v) Protein and dry content (Prieto et al. [140])Maturity (Prieto et al. [154])Shear force (Yancey et al. [155])Tenderness (Shackelford et al. [126])Texture (Byrne et al. [[120])Sensory characteristics (Prieto et al. [159])Structural properties (Shackelford et al. [126])Drip loss (Geesink et al. [160])Authentication (Dian et al. [168] and Arvanitoyannis andHouwelingen-Koukaliaroglou [264])Freshness (Downey and Beauchene [173])SafetySpoilage (Horvath et al. [116])Contamination (Windham et al. [118])Bioagents (Ellis et al. [117])Adulteration of milk (Sato et al. [181])
Poultry products/B.2
Quality
Wavelength selectionPLSCorrelation
Content (fat, protein, iron)Authenticity/origin (Hong and Yasumoto [139])Storage and handling (Liu et al. [192])SafetySafety in general (Chen et al. [182])Fecal contamination (Park et al. [188])Spoilage (Lin et al. [190])
Aquatic animal products/B.3
Quality
WavelengthPCA, linear discriminant analysisPLS
TemperatureAppearance (olsen [195])Identification/authentication (Cozzolino et al. [197])Freshness (Uddin et al. [198])Content(i) Water, fat, and protein (Gjerde and Martens [204])(ii) Free fatty acids (Zhang and Lee [203])(iii) Salt and moisture (Huang et al. [7])(iv) Crude lipid (Mathias et al. [209])Defects like bruises (Lin et al. [211])SafetyIncorrect ingredients (Font et al. [212])Spoilage (Lin et al. [202])
Invertebrate animals andspices/B.5
QualityPLC, PCAAuthenticity (Gayo and Hale [213])
Content (Brown [215])

International Journal of Spectroscopy 13
Table 4: Class D food groups, their parameters, and methods applied.
Food group/appendix Examples of parameters evaluated and one of related researcharticles Methods applied
Secondary food commodities ofplant origin/D.1
Content
Wavelength selectionPLSPCA
(i) Starch, sugar, nitrogen, and ash (Lebot et al. [216])(ii) Hollow heart (Dacal-Nieto et al. [217])(iii) Bioactive components (Jourbert et al. [218])(iv) Glucan and protein (Bellato et al. [219])Adulteration (Laasonen et al. [224])
Derived products of plantorigin/D.2
Content
Multivariate calibrationPLS, MLR
(i) Dry extract and sugars (Li et al. [225])(ii) Acids (Chen et al. [226])(iii) Alcohol (Gonzalez-Saiz et al. [227])(iv) Soluble solids and pH (Liu and He [229])(v) Oils (Ng et al. [230])
Manufactured foods (singleingredient) of plant originaquatic animal products/D.3
Content
Wavelength selectionPLS, LS, PCA
(i) Carbohydrate (Chen and Lei [232])(ii) Soluble solids and pH (Liu et al. [238])(iii) Methanol (Dambergs et al. [233])(iv) Acids (Fan et al. [236])Protein-lipid-carbohydrate interactions (Bruun [237])Authentication (Cozzolino et al. [239])Age
manufactured foods(multi-ingredient) of plantorigin/D.4
Content
PLSWavelength selection
Fat (Vines et al. [243])Moisture (Kays et al. [245])Impurity (Fernandez Pierna et al. [64])Total fiber amount (Kays et al. [246])Structural properties (de Alencar Figueiredo et al. [253])Handling and fermentation (Bruun et al. [254])
Table 5: Different food groups, their parameters, and methods applied for class E.
Food group/appendix Examples of parameters evaluated and one of related researcharticles Methods applied
Secondary food commodities ofanimal origin/E.1 Appearance (Garcıa-Rey et al. [257]) Wavelength
Manufactured food (multi-ingredient)of animal origin/E.5
Appearance (Lucas et al. [258])Smell and taste (Celik [259])Content (Lucas et al. [258], Arvanitoyannis and VanHouwelingen-Koukaliaroglou [264])pH (Navratil et al. [260])Origin (Cozzi et al. [261])Authenticity (Woodcock et al. [265])
PLS, wavelengthdiscriminant analysis
content but poor and unreliable for free acid, lactone, andhydroxymethylfurfural.
NIR spectroscopy is applicable also for wholemeals.Fontaine et al. [40] used near-infrared for detecting essentialamino acids for different meals. They concluded that theNIRS calibration model was good for evaluating the contentof protein-rich feed ingredient for amino acids methionine,
cystine, lysine, and threonine, tryptophan with 85–98% vari-ation explained and was better than crude protein regression.The protein and moisture contents were also evaluated.
Kim et al. [41] used NIR reflectance (400–2498 nm) andpartial least-square modeling to detect the total dietary fiberin meals. Meals have different handling alternatives: homog-enization, homogenization and drying, and homogenization,

14 International Journal of Spectroscopy
drying, and defatting. The reference method for total dietaryfiber evaluation was AOAC 991.43. The predictions weregood. The main advantage over the NIR-based method wasfaster evaluation. The traditional method takes 4 days.
Zeng et al. [42] developed a NIR transmission systemfor determining the amount of starch in liquid gravies withlow concentration. The best wavelengths were 605, 623,919, 1017, and 1031 nm for the regression model. The starchcontent makes possibility to evaluate the viscosity of liquidgravies.
2.5.3. Authenticity. Sausages can be made with different fats.In some cases, sausages can be identified based on their fatsubstitutes [43]. The quality of them has been studied, forexample, by Gaitan-Jurado et al. [44] and Ortiz-Somovilla etal. [45].
3. Conclusions
Nondestructive methods for food quality measurement arewarmly welcomed by the food industry. Optical engineeringprovides a large variety of measurement techniques, someof which, like optical and near-infrared spectroscopy andimaging, have especially high potential for various food-quality-related measurements. And indeed, during the lastfew decades, it has seen an increasing number of applications,not only in food quality laboratories, but also in factories,and even in farm fields and orchards, where the food qualityarises. In this paper, we have shortly described the mostprominent application examples in this rapidly growing areaof food quality techniques. Unfortunately there are alreadyso many important works in this area that we were able toconsider only a small fraction of the total literature existing,which means that too many important contributions hadto be omitted from this paper. However, the authors hopethat even in its current imperfect state this paper could helpthose who are trying to find solutions or model approachesto their food quality problems from optics, imaging, andspectroscopy.
Appendices
A.
A.1. Class A, Type 01: Fruits
A.1.1. Taste. Taste is an elemental parameter for fruits. Mehi-nagic et al. [46] demonstrated promising results in combiningtaste and spectra for apples.
A.1.2. Content and Factors Related to Content. A popularingredient sought after for a fruit is sugar, for example, Walshet al. [47]. Another important content is soluble solid content.Carlini et al. [48] evaluated the soluble solid content usingVIS/NIR spectra. They modeled spectra using partial least-square regression.
The time-of-flight technique with NIR was applied todetect sugar and acid contents of apples [49]. The modeling
used multiple linear regression, principal component regres-sion, and partial least squares. The prediction precision washigh and especially superior for acid content.
NIR has been used to predict water content of severaldifferent fruits. The water content of avocados was used byBlakey et al. [50] to predict ripening of the fruit. The watercontent was predicted using PLS (partial least squares) modelwith 14 factors in the region of 1100–2000 nm.
Leon et al. [51] studied the intact olive VIS/NIR spectra(400–1700 nm) for evaluation of oil, moisture, oleic acid, andlinoleic acid contents. They compared spectra from differentfemale parent trees and harvest year. The partial least-squarecalibration models were not transferable across year.
Zhang et al. [52] have recently used partial least-square(PLS) calibration model for the measurement of solublesolids content (SSC) of fresh jujube (Ziziphus zizyphus L.).The device used was FieldSpec3 (Analytical Spectral Device,USA). The correlation found was over 0.88 indicating thefeasibility of the method for SSC measurement.
Terdwongworakul et al. [53] have used NIR transmit-tance spectroscopy for the quality assessment of mangosteenfruits. The goal was to develop a method for nondestructivedetection of translucency inmangosteen fruit.Thewater peakabsorbance at 955 nm seems to be an important factor fordiscriminating translucent and normal fruits.
Magwaza et al. [54] give a recent review of NIRS inexternal and internal quality analysis of citrus fruits.
Shi et al. [55] have used the genetic algorithm (GA) forwavelength selection for the determination of SSC in Fujiapples. They used NIRS in the range from 1065 to 1625 nmand were able to reduce the number of wavelengths from 88to 17 with their GA approach.
Ying and Liu [56] have used FT-NIR spectroscopy for theinternal quality assessment of pears. For wavelength selec-tion, they also used genetic algorithms (GAs). The qualityfactors tested were sugar content (SC), titratable acidity (TA),and pH. Despite the complexity of the spectral data, theGA found calibrationmodels that significantly outperformedthose based on full-spectrum analyses.
Pissard et al. [57] suggested the use of NIR spectroscopyandmultivariate calibration to determine the levels of vitaminC, total polyphenol, or sugar content. They stated that theprediction performance was very good.
A.1.3. Maturity. Maturity or fruit ripeness affects the qualityand taste of the fruit. Tanaka and Kojima [58] studied thegrowth stages and maturity of Japanese pear fruit using thesugar concentration as an indicator. Pear juice from differentmaturity stages produced different spectra, the absorptionbands of which were related to carbohydrate. Multiple linearregression models were applied to determine the contentof sucrose, fructose, sorbitol, and glucose sugars with 3–7wavelength variables. Sirisomboon et al. [59] used NIR withprincipal component analysis (PCA) to classify tomatoes.Themodel provided a prediction for maturity.
A.1.4. Unwanted Objects. Insects cause damage to fruits inmany ways. Some of them can grow inside the fruit like in
International Journal of Spectroscopy 15
tart cherry. Xing et al. [60] have used genetic algorithms tofind the optimal wavelengths for detection of internal insect(plum curculio (Coleoptera: Curculionidae)) infestation thatin tart cherry. Based on the GA wavelength selection on thereflectance spectra (580–980 nm), three to four wavelengthregions were selected. The results were checked using par-tial least-squared discriminant analysis (PLSDA) and theyshowed that thewavelengths selected resulted in classificationefficiency similar to that of the full spectral range. DifferentGA runs resulted in somewhat different results, which aretypical for the wavelength selection problem.
A.1.5. Contamination. Fruit skin can be contaminated byfecal material which can have pathogens like E. coli. Kim etal. [61] applied multispectral imaging 450–851 nm to detectfecal with thin and thick layer on apples with differentgreen and red colorations. This was somehow successfulfor thick patches. Apple coloration caused problems withthin layer. Kim et al. [62] studied also fluorescence spectralinformation. They identified four optimal bands (450, 530,685, and 735 nm) for fecal detection and suggested the useof a simple ratio.
A.1.6. Storage. Veraverbeke et al. [63] utilized NIR trans-mission spectra to solutions of single wax components andextracted apple wax. The wax was collected from apples withdifferent parameters: apple cultivar (Jonagold, Jonagored, andElshof), picking data (early, commercial, and late), storagetime (0, 4, or 8 months in controlled atmosphere), andshelf life periods (0, 1, and 2 weeks). They applied canonicaldiscriminant analysis on the first derivative of spectra. Theproposed NIR technique could identify cultivar and storageduration but not very well the picking date or shelf lifeperiod. It seems that storage time and cultivars are related todifferences in the number of aliphatic chains, like alkanes andesters, and the presence of 𝛼-farnesene.
A.2. Class A, Type 002: Vegetables. Fernandez Pierna et al.[64] have usedNIR hyperspectral imaging and chemometricsfor the detection of cyst nematode (Heterodera schachtii)infected sugar beets. They used a pushbroom system (SWIRXEVA CL 2.5 320 TE4 camera from XENICS using anImspector N25E spectrograph with a cooled, temperature-stabilised mercury-cadmium-telluride (MCT) detector fromSpecim Ltd., Oulu, Finland) combined with HyperPro andHyperSee software (BurgerMetrics SIA, Riga, Latvia). Thesamples were moved with a conveyor belt at 2mm/s speed.The result of the study was that NIR imaging has potential for,for example, plant breeders to select cyst-nematode-resistanttraits.
A.2.1. Appearance. The quality of a vegetable is sometimesevaluated by its texture. One of these kinds of vegetablesis Asparagus, the texture of which has been evaluated byFlores Rojas [65]. The textural quality parameters consideredin their research were maximum shear force and cuttingenergy. The evaluation was based on results from a scanning
monochromator of 400–2500 nmand a combination of diodearray and scanning monochromator of 350–2500 nm.
A.2.2. Content. Sugar concentration is important for manyvegetables because it affects their sensory evaluation andstorage ability. Sugar content of melon was evaluated andvisualized using NIR absorption spectra by the autor in [66].His paper indicated a strong inverse correlation for a melonbetween sugar content and specific wavelength (676 nm) nearto the chlorophyll absorption band. The visualization wasimplemented by taking an image through a filter with bandaround 676 nm and converting the pixel values to anotherunit (absorbance) to assign themwith a color. However, therewas still a bias caused by melon color. Later, they developedanother visualization method using deeper NIR region toprevent bias from melon color [67]. They noticed that thetwo 2nd derivative absorbances in 874 nm and 902 correlatedstrongly to the sugar content. For this visualization, two band-pass filters were employed.
Pedro and Ferreira [68] applied NIR and multivariatecalibration to evaluate soluble solid, lycopene, 𝛽-carotene,and carotenoid contents of tomato. The PLS-1 was used forcalibration. Prediction accuracy 𝑟 values were over 0.99.
Protein content of edible fungi (Auricularia auricular)was studied by Liu et al. [69] They applied partial least-square, multiple linear regression, and least square supportvector machine on data and compared performances ofdifferent preprocessing including Savitzky-Golay smoothing,standard normal variate, multiplicative scatter correction,first derivative, second derivative, and direct orthogonal sig-nal correction.Wavelength selection was based on successiveprojections algorithm. Liu et al. [69] concluded that the bestfull spectrum partial least-square model was obtained using“raw” data whereas optimal successive projection algorithmwith multiple linear regression, successive projection algo-rithm with partial least squares, and successive projectionalgorithm with least-square support vector machine mod-els were achieved with spectra preprocessed multiplicativescatter correction. The optimal model was produced bysuccessive projection algorithm with least-square supportvector machine combination.
For cooked potatoes, dry matter content is important.Van Dijk et al. [70] studied three potato cultivars, cv. Nicola(a firm cooking potato), cv. Irene (a mealy cooking potato),and cv. Bintje (intermediate between firm andmealy cookingpotato). They related NIR spectra to dry mater content andsensory perceived texture of steam cooked potatoes. The drymater content affected most on the texture while the effect ofchosen cultivar is minimal. Storage did not have any effect onthe relationships.
Dacal-Nieto et al. [71] have used genetic algorithm (GA)for feature selection in potato classification done by the helpof computer vision.
Roggo et al. [72] applied NIR for sucrose content withvery small sucrose ester of fatty acid (SEF, fresh beet) andgot satisfactory results for brix, marc, sugar in molasses, andjuice purity but lower accuracy results for glucose, nitrogen,sodium, and potassium.

16 International Journal of Spectroscopy
Soybean is an important vegetable in many countries.Soybeans have phytic acid which has nutritional and envi-ronmental importance. To evaluate the levels of the phyticacid, Delwiche et al. [73]measured its complement, inorganicphosphorus, using diffuse reflectance of near-infrared (1100–2500 nm) for groundmeal and transmittance (600–1900 nm)for single beans. The results were not very good with partialleast-square regression but give an indication. Kovalenko etal. [74] developed calibration equations for estimating aminoacid composition of whole soybeans from near-infraredspectra. They also concluded that cysteine and tryptophancould not be estimated from spectra while leucine and lysinehave a high correlation.
Pazdernik et al. [75] applied near-infrared reflectancespectroscopy to evaluate crude glycinin fraction of soybeanprotein. They find that the fraction was positively corre-lated to crude protein concentration and negatively to oilconcentration. The high crude protein and fraction contentwas related to higher growing temperatures while the lowergrowing temperature produced higher oil concentration.Pazdernik et al. [76] studied also amino and fatty acidcompositions. Hollung et al. [77] applied NIR reflectance onsoybeans to find samples with a low content of oligosac-charides and nonstarch polysaccharides. They were able topredict that total content of nonstarch polysaccharides couldbe predicted using partial least-square regression.
The moisture content of whole soybean in the range of 5to 22% can be determined with great accuracy using near-infrared transmittance (800 to 1100 nm) and difference inabsorbance, stepwise multiple linear regression, or partialleast-square modeling [78].
The classification based on soybean position can beuseful, too. Bennett et al. [79] analyzed field-grown soybeanseeds with different nodal positions with NIR. They foundthat seed protein content varied as a function of place: thosefrom plant basal region have higher oil content and lowerprotein content while the opposite was true for the apex.Later in [80], they studied the seed quality traits (protein, oil)utilizingNIR to determine percentage of oil and protein.Theynoticed that early-planted crop has increased the amountof oil (3–8%) while there was not much change in proteincontent.
A.2.3. Freshness. Quality of mushroom can decrease if toolong time elapsed from harvest. Esquerre et al. [81] used VISand NIR absorption spectra to detect bruises and evaluatethe freshness. The partial least-square model was employedand it was mostly influenced by changes in water matrix andenzymatic browning.
A.2.4. Authentication. Li et al. [82] have recently testedclassificationmethods for the authentication of pure camelliaoil NIR spectra. Sample authenticities were confirmed bygas chromatography. The classification methods were unsu-pervised principal component analysis (PCA), hierarchicalcluster analysis (HCA), supervised classification techniquesbased on discriminant analysis (DA), and radical basisfunction neural network (RBFNN). The classification rate of
all methods reached 98.3% when smoothing, first derivative,and autoscaling were used. The good performance showedthat NIR spectroscopy could be successfully used as a rapid,simple, and nondestructive method to discriminate purecamellia oil.
A.2.5. Structural Characteristics. The physical and chemicalproperties of soybean and corn are correlated with size anddensity. However, the change on size and density has noeffect in accuracy of determination of soybean protein andoil content. The effect is very small for determining protein,oil, and starch contents for corn [83].
A.2.6. Damage. Vegetables, mushrooms, and fungi can sufferphysical damages for too rough handling. VIS/NIR absorp-tion seems to be useful for quantifying bruise damages formushrooms [81, 84].
A.2.7. Incorrect Ingredients. Roggo et al. [72] suggested theuse of NIR spectroscopy for decreasing pollution of heavymetals, lead acetate, caused by the legal methods, polari-metric measurement for sucrose content, and wet chemicalanalysis for quality control.
A.2.8. Bioagents. The detection of fungi from food assumesthose the spectra of fungi differ from that of the food itself.This assumption has been shown to be valid, for example, byPearson and Wicklow [85] who detected the fungi in cornkernels, Gordon et al. [86] for food grain, and Berardo et al.[87] for maize.
Jin et al. [88] have used GAs to find the optimalwavelengthswhen trying to discriminate aflatoxin-producingAspergillus flavus (AF13) fungi and non-toxin-producingAspergillus strains (AF2038, AF283, and AF38). Their hyper-spectral image was taken of several strains cultured 7 dayson potato dextrose agar using both broad-spectrum UVlight source and tungsten halogen bulbs. GA was used tofind the most important principal components (PCs) amongthe first 40 PCs. The selected PCs were given to a supportvector machine (SVM) for training for classification betweentoxigenic and atoxigenic fungi species. The discriminationaccuracy varied between the strains and the light source usedranging from 70% to 95% pixel-wise.
Berardo et al. [87] appliedNIR for the detection and iden-tification of mycotoxigenic fungi and their toxic metabolites.They analyzed the samples for fungi infection, ergosterol,and fumonisin B
1content. They concluded that NIR is
suitable for monitoring mold contamination and separatingthe contaminated lots from clean lots.
A.3. Class A, Type 003: Grasses
A.3.1. Content. Cereal grains have many important ingre-dients which are searched in many studies. Also moistureis an important parameter. Dowell et al. [89] have appliedNIRS for scab, vomitoxin, and ergosterol determination insingle-wheat kernels.The results obtained show that theNIRS

International Journal of Spectroscopy 17
method was able to find all scab-damaged kernels that wereidentified by official inspectors.
Miralbes [90] measured NIR transmittance 850–1048 nmof whole wheat from different countries and evaluated theirmoisture, protein, wet gluten, dry gluten, and alveographparameters (W, P, and P/L) using partial least squares. Thealveograph parameters required division of wheat samplesinto two groups according to their deformation energyvalues.
Tartary buckwheat has beneficial ingredients, rutin andD-chiro-inositol, against hemorrhagic diseases and insulin-resistant diseases. Yang and Ren [91] applied NIR reflectanceto evaluate their content. They developed a partial least-square method and used the results from HPLC as a refer-ence. A good chemometric correlation existed.
Brenna and Berardo [92] studied maize whose antioxi-dant compounds like carotenoids are useful against reactiveoxygen substances. They combined NIR and HPLC resultsfor determining carotenoid concentration of grinded maizeusing modified partial least squares.
Rice is another very important food plant. Kawamuraet al. [93] used NIR transmittance and PLS for successfulevaluation of moisture and protein contents of undriedrough rice. However, they found that their method was notapplicable to determine amylase content. Zhang et al. [94]suggested use of NIR to predict total phenolics, flavonoidcontent and antioxidant capacity of dehulled grain of brownrice. The phenolic content, and antioxidant capacity weresuccessfully determined usingmPLS andPLSwhile this failedfor flavonoids.
Stubbs et al. [95] measured residue from cultivars ofspringwheat (Triticum aestivum L.), winter wheat, and springbarley (Hordeum vulgare) with NIR and made models toestimate neutral detergent fiber (NDF), acid detergent fiber(ADF), acid detergent lignin (ADL), carbon (C), sulfur (S),nitrogen (N), and C :N. The models were successful forneutral acid detergent fibers and acceptable for acid detergentlignin, for others less successful.
Wiley et al. [96] studied barley mutants. They evaluatedgrain nitrogen and protein composition. The grains weremeasured with NIR reflectance spectra, which were resolu-tionally enhanced by derivative spectroscopy. The advantageof derivative spectroscopy is to allow wavelengths to beidentified with clear differences in contribution from theassociated chemical bonds. They compare the 4th deriva-tive of wholemeal flour with high and low 𝑁 containinggrains.
A.3.2. Structural Characteristics. Structural characteristicslike hardness have effect on quality. For maize, the hardnesswas evaluated using NIR spectra in [97]. Manley et al. [98]used hyperspectral images of 1000 to 2498 nm wavelengthrange to classify yellow maize kernels. They found clustersfor different endosperms (vitreous, floury, and 3rd type)which present varying ratios of soft and hard kernels. Cerealcomposition reveals the properties of inner structure. Siskaand Hurburgh Jr. [83] applied NIR transmittance and PLS toobtain corn density which is related to starch and protein.
A.3.3. Taste. Taste from cereal food is affected by the grainsthemselves. The study of Kawamura et al. [99] indicates thatVIS/NIR reflectance could be useful for rough classificationof wholegrain milled rice using multiple linear regression(MLR) analysis into three groups: poor, better, and best taste.
A.3.4. Safety. Fernandez Pierna et al. [64] applied near-infrared hyperspectral images for separating impurities fromcereal grains. The cereal grains were wheat, spelt, and barleywhile the contaminants were a variety of different matters(straw, broken grains, grains from other crops, weed seeds,insects, plastic, stones, pieces of wood and paintings, andanimal feces) classified into different categories. For eachcategory, a discriminant model was developed. The methodwas based on PCA and support vector machine.
A.4. Class A, Type 004: Nuts and Seeds
A.4.1. Content. Nuts of shea tree can be used as a source ofnut butter. The moisture, fat, stearic acid, and oleic acid canbe determined using NIRS [100].
Front et al. [101] studied the sinigrin, gluconapin, 4-hydroxyglucobrassicin, and total glucosinolate of Indianmustard seed. They modeled the NIR spectra with modifiedpartial least-square regression for chemometrics. The coef-ficients of determination were over 0.8 for all other exceptfor 4-hydroxyglucobrassicin which was only 0.33. Font et al.[102] measured intact and ground seed of Indian mustard,Ethiopian mustard, and rapeseed and applied modified par-tial least-square regression to combine near-infrared spectraand acid detergent fiber values. The sample type did not haveany significance on the evaluation. According to them, themost important factors for modeling were C–H and O–Hgroups of lipids, water, protein, and chlorophyll.
Kwan et al. [103] determined the oil and fatty acidcontents of intact perilla seed using NIR reflectance. Theyconcluded thatmPLS produced good predictions for oil, oleicacid, and linolenic acid contents whereas the predictionsfor palmitic, stearic, and linoleic acid were unsuitable forscreening purposes.
The content of intact common bean was subjected toNIR reflectance in order to determine seed weight, protein,and starch for 91 genotypes [104]. PLS model was able topredict protein content with high accuracy (SEP) = 1.6% andreasonable accuracy for weight and starch. Seed color had acorrelation to spectra; black seed has very different spectra.Color did not affect model accuracy.
Wang et al. [105] used near-infrared and PLS to studyproteins and amino acids in peanuts. They found the resultsacceptable. Yang and Sun [106] demonstrated that the hard-ness of licorice seeds can be done with NIR.
A.4.2. Authentication. Downey et al. [107] applied near- andmid-infrared spectra for authentication of lyophilized coffeesamples of Arabica and Robusta cultivars.They used factorialdiscriminant analysis and partial least-square models.
Downey et al. [108] applied VIS and NIR transflectancespectra to detect adulteration of pure extra virgin olive oils.

18 International Journal of Spectroscopy
The adulteration rates for the olive oil were 1% (w/w) and5% (w/w) sunflower oil. The best classification was obtainedusing 1st derivative of 400–2498 nm spectra. The adulterantcontent was predicted with 0.8% standard error accuracy.
Woodcock et al. [109] studied European olive oil samplesto specify their geographical origins with near-infrared trans-flectance spectroscopy (1100–2498 nm). The samples werecollected fromharvests of 2005, 2006, and 2007.Thedetectionrate for Ligurian ones was 92.8% and non-Ligurian ones81.5% when using the first-derivative data pretreatment anddiscriminant partial least-square regression.
A.5. Class A, Type 005: Herbs and Spices
A.5.1. Content. The herbs and spices contain many charac-teristic ingredients, the amount of which is often a concern.Often the goal is to find an alternative method for HPLC.Theherbs and spices can come in many forms like leaves, roots,or powders. Chemometrics can be applied to all these forms.
Another example is kava which is an herb with anxiolyticproperties caused by active compounds called kavalactonesor kava pyrones. As a natural product, the amounts of activecompounds vary between specimens. The NIR reflectanceand partial least squares can be used to detect these com-pounds reliablly [110].The results from the developedmethodare reproducible and have repeatability comparable to HPLCmethods.
NIR reflectance can be used to determine several factorsof the chemical composition of saffron according to Zalacainet al. [111]: moisture and volatile content, coloring strength,𝐸1%1 cm(250 nm), and 𝐸1%
1 cm(330 nm), established on the ISO3632 Technical Specification Normative and used to certifysaffron quality in the internationalmarket.They also analysedfive main crocetin glycosides (compounds causing saffroncolor). The best correlations obtained for trans-crocetin di(𝛽-d-gentibiosyl) ester was 𝑅2 = 0.93, for trans-crocetin (𝛽-d-glucosyl)-(𝛽-d-gentibiosyl) 𝑅2 = 0.94, and for picrocrocin(saffron bitterness) 𝑅2 = 0.92.
Tanaka et al. [112] quantified curcuminoids (total cur-cuminoid content, curcumin, demethoxycurcumin, and bis-demethoxycurcumin) of turmeric. They applied 2nd deriva-tive preprocessing and standard normal variate to NIR dataand after that partial least-square regression. Characteristicabsorption of curcuminoids was detected in approximately1700 nm and 2300 nm–2320 nm. The results obtained have ahigh correlation with HPLC.
Many herbs and spices are often milled to powder-likeGinseng. Chemical methods like HPLC are expensive andsometimes they can be replaced by NIR/VIS spectroscopy400–2500 nm. The authors in [113] studied it for AmericanGinseng root powder to detect ginsenosides. They found thatit is applicable formajor ginsenosides, Rb
1, Re, andm-Rb and
total ginsenosides.Sesame has some antioxidative-activity-related ingredi-
ents like lignans (including lipid-soluble lignans sesamin andsesamolin) and water-soluble lignin glycosides (sesaminoltriglucoside and sesaminol diglucoside). Kim et al. [114]developed a NIR reflectance method for evaluating the lignin
content of intact sesame seeds. The modeling was done usingmPLS regression using results from high-performance liquidchromatography analysis as reference values.The results weregood ingredients except for sesaminol diglucoside owning toits small amount.
Xin et al. [115] suggested a method to separate raw andprocessed herbs. They measured the herbs in the NIR areaand used support vector machine, random forests, and lineardiscriminant analysis in analysing and classification. Theobtained results were excellent.
A.5.2. Origin. Sometimes the origin is important for con-sumers. Zalacain et al. [111] suggested the use of near-infraredto determine the origin of saffron (Iran, Greece, and Spain).
B.
B.1. Class B, Type 06: Mammalian Products
B.1.1. Spoilage. Meat spoils very easily and thus producesa health risk not to mention unpleasantness. So excludingcertain delicacies, the spoilage should be avoided or at leastthe spoilt meat should be removed before going to consumer.The spoilage for different meats has been studied for porkmeat [116] and beef [117]. These papers considered alsobacteria and microbiological factors.
B.1.2. Contamination. The fecal material is sometimes foundon animal carcasses. Windham et al. [118] suggested the useof four optimal wavelengths: 434, 517, 565, and 628 nm.Thesewavelengths were selected using multivariate data analysisand VIS/NIR reflectance data. Different spectral ratios weretested to find optimal classification.The ratios 565 nm/517 nmprovide 100% detection rate in carcasses of broilers fed acorn or soybeanmeal diet. Another ratio, 574 nm/588 nmwasshown to be optimal for a larger variety of diets.
B.1.3. Taste (including Juiciness). One of the earliest refer-ences to taste of meat was already published in 1969 [119].Byrne et al. [120] used NIR reflectance (750–1098 nm) toexamine the taste of heifer cow. The samples from thelongissimus dorsi (2.5 cm thick) were taken at 2, 7, and 14 dayspost mortem.Theywere vacuum-packaged in plastic bags andstored at −20∘C.
The results from taste panel and chemical processes forlamb meat were evaluated against NIR reflectance by Andreset al. [121]. They evaluated a set of 232 muscle samples fromTexel and Scottish Blackface lambs. They concluded thatabsorbance is correlated to juiciness, flavour, abnormal flavor,and overall liking of lamb meat, but the correlation doesnot provide very clear classification. It was applicable forseparating extreme samples.
B.1.4. Appearance. The appearance consists of color, geomet-rical features, and texture of meat. Texture of meat here is thegeneral surface appearance.
Color of meat depends on water content and concen-trations of myoglobin and also the relative proportions of
International Journal of Spectroscopy 19
myoglobin’s different forms, oxymyoglobin, myoglobin, andferric myoglobin [122, 123].
Meat color has been studied for decades and severalmethods have been suggested. For example, Van den Oordand Wesdorp [124] suggested the use of reflectance differ-ences at 630 and 580 nm. Later, beef color prediction hasbeen studied by Leroy et al. [125] and Shackelford et al. [126].Shackelford et al. [126] showed that the best color predictionwith NIR was obtained in reflectance mode. Leroy et al. [125]studied also beef, longissimus thoracis, and obtained similarresults. For pork, color is an especially important parameterfor customers which make their buy/not buy partially basedon it. Cozzolino et al. [127] applied VIS/NIR for prediction.
Andres et al. [128] applied VIS/NIR (400–2500 nm)for determining L∗a∗b∗ colour parameters. The results forluminosity at 0 and 60min had a good predictability.
B.1.5. Diet. The diet affects the composition of beef: theirsubcutaneous fat and its fatty acid composition [129]. Prietoet al. [130] report that NIR can be used to separate whetheror not the beef cows has been fed with flaxseed.
B.1.6. pH. pH is affected by light scattering [131–133] studyproduced over 0.8 values for coefficient of correlation whenusing first derivative and multiplicative scatter correctionfor calibration and validation sets. The obtained precision isgood; only 4.27% of predictions had difference more than 0.2pH. Andres et al. [128] predicted pH of beef with NIR withgood accuracy.
B.1.7. Content. Important factors for meat are lean-to-fatratio, meat percentage, intramuscular fat, marbling, protein,water contents and muscle area. Certain ingredient, or theiramount can be used as a guarantee for quality and used as amark of quality.
Moisture of meat has been evaluated by Liao et al. [133]with coefficient of correlation near 0.8 for validation setusing the first derivative and multiplicative scatter correc-tion. Tornberg et al. [134] with no processing showed verypoor predictability (0.21) for both VIS (400–800 nm) andNIR (800–2500). Chan et al. [135] used first derivate andpreprocessing of spectra (400–1700 nm) and obtained resultsover 0.7 for the validation set.
Liao et al. [133] showed over 0.75 values for the cali-bration, and the validation sets for protein content. Valuesaround 0.7 were obtained by Chan et al. [135].
The intramuscular fat is important quality factor whichhas been studied for beef [130, 136, 137] and pork [133, 137].Sierra et al. [136] studied the composition and content ofintramuscular fat has been studied by using NIR transmit-tance 850 to 1050 nm. They evaluated the fatty acid profilefor samples of ground beef from the longissimus thoracis ofyearling bulls. The study indicates that it is possible withrelatively good accuracy to evaluate saturated, branched,and monounsaturated fatty acids. NIR transmittance alsoprovides information about conjugated linoleic acids. Prietoet al. [130] used NIR reflectance 400 to 2498 nm for deter-mining concentration of polyunsaturated fatty acids and their
biohydrogenation products in beef cows which have been fedon special diet (flaxseed).
Studies of intramuscular fat for pork [132–135, 137, 138]have dissimilar results. The best results were from Prevolniket al. [137] where the coefficient of determination value wasover 0.9. Very poor results were obtained by Tornberg etal. [134] when no preprocessing was used with VIS (400–800 nm) whereas NIR (800–2500 nm) provided almost twiceas good results. The first derivative of spectra with prepro-cessing provided further improvement [135]. One reason fordifference could be different wavelength areas: Tornberg etal. [134] used visible range 400–800 nm, Barlocco et al. [138]used NIR (800–2500 nm), Savenije et al. [132] used VIS/NIR(400–2500 nm), and Liao et al. [133] used VIS/NIR (350–1100 nm). The homogeneity of samples varies [133, 137, 138];for example, Liao et al. [133] and Savenije et al. [132] usedintact pork samples. Minced pork samples were used, forexample, in [137, 138]. Liao et al. [133] studied in addition tointramuscular fat protein and water content for pork in 350–1100 nm.
The intramuscular fat and water for lamb meat werepredicted at a higher accuracy and they seem to correlate tothe sensory parameters [121].
Iron-related substances can also be evaluated from meat.Hong and Yasumoto [139] used NIR diffuse reflectance from1100 to 2500 nm to study heme and nonheme iron in rawmeats: beef, pork, chicken, rabbit, duck, horse, lamb, andmutton. The second derivate was taken from data and afterthat multiple regression equations were applied. The resultindicates that the multiple correlation coefficients are over0.9 for both hemes and total iron. Hong and Yasumoto [139]obtained the best results with multiple regression equation atwavelengths where NH groups in proteinmolecules and C–Cand CH in the porphyrin ring of heme have absorption.
The same NIR wavelength range (1100–2500 nm) hasbeen tested for evaluating crude protein (CP), myoglobin,collagen, ether extract (EE), gross energy (GE), dry matter(DM), and ash content of oxen meat [140]. Prieto et al. [140]found that myoglobin, collagen, and ash contents could beevaluated with poor predictability. They speculate that thiswas due to lack of correlation between these parametersand ether extract content. However, ether extract evaluationwas successful and important since this parameter is highlyrelated to the organoleptic characteristics (like juiciness, fla-vor, and texture) in oxenmeat samples. Also other parameterslike crude protein, dry matter, and gross energy, which havea high correlation with ether extract content, were predictedwith an acceptable degree of accuracy.
Perez-Marın et al. [141] applied NIR for all stages of pigs:the live animal, carcass in slaughterhouse, subcutaneous fatsample with skin, skin-free subcutaneous fat sample, andtransverse section. They develop prediction model for thefour main fatty acids in Iberian pig fat, obtaining for palmiticacid SECV values of 1.24% for in vivo analysis and 0.82%for carcass analysis, for stearic acid 0.67% and 0.94%, foroleic acid 1.42% and 1.48%, and for linoleic 0.36% and 0.55%.The model proved the feasibility of NIR because it accountedfor between 60% and 74% of the variation of spectra of liveanimals and between 31% and 87% of variation of carcasses.

20 International Journal of Spectroscopy
For Iberian pigs, also intact fat or adipose tissues are studied[142–144].
Lamb muscles appear to have special absorption bandsat 424 nm and 550 nm. These bands are related to the Soretband and the oxymyoglobin absorption band [145, 146]. Theabsorption bands (at 540 nm and at 580 nm) correlate withboth myoglobin and oxymyoglobin [145, 147, 148], but myo-globin has also another absorption band at 555 nm [145–150]with the absorption band at 574 nm with oxyhaemoglobinabsorption.
According to Murray [151], an absorption band at 762 nmis caused by the OH third overtone or according to Swatland[145] and Delpy and Cope [149], an absorption band pro-duced by the oxidation of the myoglobin (deoxymyoglobin).Pigments and other characteristics (intramuscular fat, fatty-acids, and moisture) cause most of the spectral informationused for the VIS region (400–700 nm) and the NIR regionaround 1400–2300 nm.
Similar results are reported by others like Downey et al.[152]; Lomiwes et al. [153] predicted glycogen concentrationof prerigor muscle.
B.1.8. Maturity. The age of animal can affect the meat qualitysince there can be differences in intramuscular fat andwater contents. Prieto et al. [154] applied successfully NIRreflectance 1100–2500 nm to separate adult, over 4 years oldcastrated steers and young, under 14 months old cattle. Thesamples were taken from longissimus thoracis muscle.
B.1.9. Shear Force. Shear force value indicates how muchforce is needed to cut the meat and it is related to ten-derness. In fact, Yancey et al. [155] studied the connectionbetween shear force (Warner-Bratzler shear force (WBSF),and Meullenet-Owens razor shear (MORS)) and tenderness(consumer evaluation, also with overall impression) forbeef ribeye rolls taken from Select, low Choice, top (upper2/3) Choice, and Prime quality grade carcasses with visibleand near-infrared spectroscopy reflectance. Steaks were cut2.54 cm thick and put to aging for 14 or 28 days. The longeraging of samples was related to increased tenderness. The2nd derivatives of VIS/NIR measurements were found to becapable for predicting tenderness and overall impression thanshear force measures.
Many studies for shear force have beenmade, for example,Byrne et al. [120] 1998, Park et al. [156] Rodbøtten [157]and Venel et al. [158]. Byrne et al. [120] evaluated Warner-Bratzler shear force using NIR 750–1098 nm for Heifer cows.They obtained over 0.7 value of correlation coefficient forboth groups, for samples taken at 2, 7 and 14 days postmortem, vacuum-packaged in plastic bags and stored at−20∘C. However, the results seem to vary. Prieto et al. [159]studied beef and cooked pork and suggest significant varia-tion as a function of position. Shackelford et al. [126] appliedshear force detection online for beef. The NIR transmissionmeasurement provided better results than reflectance mea-surements [125]. The ability was limited longissimus thoracisat 2 or 8 days post mortem. Venel et al. [158] suggest using
additional features (age, grade, pH, and sex) to improveresults.
The results for pork meat have different conclusions.Study of Geesink et al. [160] indicates poor predictability.Liao et al. [133] obtained relatively good prediction for thecalibration set but over 2.5 times poorer for the validationset. It has been discussed that the problem is the significantvariations at different positions of the samples.
B.1.10. Tenderness. Tenderness of a beef describes the resis-tance to bite or shear meat and is related to the hardness. Itshould be noted that the characteristics can correlate to eachother, like tenderness of meat that has a positive correlationto flavor and juiciness [161].
Generally the customers prefer beef with low effortneeded and thus tenderness is an important factor related toquality. NIR models have predictions rating fair to good forthe tenderness of postrigor longissimusmuscle inmany publi-cations [120, 148, 156, 162], and [157]. Commonmeasurementranges were 1100–2500 nm and 750–1100 nm. It seems thatabsorption increases when the meat becomes tougher. Ten-derness predictions for prerigor longissimus muscle were notso good [134, 157] which may indicate that the change frombefore rigor to after rigor and parameters related to it mightbe critical for tenderness. The applicability of techniques isdifferent: extracted part of a muscle sample [156, 162–164]or a very small area (4 cm2) [120]. Shackelford et al. [165]have extended the technique for exposed longissimus cross-section of ribbed beef. Later, an online detection of tendernesshas been tested by Shackelford et al. [126].
B.1.11. Texture of Meat. Byrne et al.’s [120] results showedcorrelation coefficient values of 0.5 and 0.7 for heifer meattexture by NIR. Texture of lamb meat has been evaluated byAndres et al. [121], but although absorbance does correlate totexture, it was not suitable for classification.
B.1.12. Acceptability. The acceptability of heifer meat seemsto be very poorly predicted by NIR according to Byrne et al.[120]. The correlation coefficient values were under 0.5.
B.1.13. Sensory Characteristics other than Appearance. Itwould be advantageous to classify the beef based on itsquality directly in the abattoir. Prieto et al. [159] appliedVIS/NIR fiber optics measurements (350 to 1800 nm) to veryfresh beef muscle to correlate it with lab color, cookingloss, instrumental texture (Volodkevitch, 10-day aged meat;slice shear force, 3 and 14-day aged meat), and sensorycharacteristics. However, the results indicated that only thesensory characteristics correlation was useful.
B.1.14. Structural Properties. Structural properties are relatedto functional quality. They can be water holding capacity,isometric tension, muscle fiber shortening, pH, and cookingloss.
Shackelford et al. [126] evaluated NIR for water-holdingcapacity and cooking loss for beef. The average reflectanceshowed higher absorbance for samples with highest cooking

International Journal of Spectroscopy 21
loss with meat 2 days post mortem. The difference betweenspectra diminished when the meat was 8 days post mortem.The transmission spectra improved the results. The drip lossprediction was not very high. It was best for reflectance at day8 with a correlation coefficient of 0.54. Tornberg et al. [134]studied the drip loss for porcine meat using wavelength 802–2500 nm. They obtained a correlation coefficient of 0.64.
The study of Prieto et al. [159] suggest that VIS/NIR maynot be very useful for determining cooking loss. Drip lossand shear force for pork were studied by Geesink et al. [160].The data (reflectance spectra (1000–2500 nm), water-holdingcapacity, shear force, ultimate pH, and colour (L∗, a∗, b∗-value) of 96 pork longissimus) were obtained two days postmortem and subjected to stepwise multiple linear regression(SMLR) and partial least-square regression (PLSR). Thedrip loss was predicted successfully while shear force wasnot.
B.1.15. Other Subjects. Shackelford et al. [165] studied optimalmeasurement for NIR and VIS. They recommended foronline VIS/NIR studies of longissimus quality traits of ribbedbeef carcasses: a high-intensity probe (with a 50mmdiameterhole in the limiter plate), data acquirement was done withaveraging 20 spectra per observation, measurement placelongissimus from one side per carcass, and at a standardizedbloom time for spectra taking. Offline measurement appli-cation to lamb and pork and smaller muscles may require areduction in the size of the opening in the limiter plate.
Information about sample characteristics, process, andslaughter conditions can be found, for example, in Cozzolinoet al. [166], Cozzolino et al. [146], Cozzolino et al. [167],Mitsumoto et al. [148] 1991, Swatland [145], and Cozzolinoand Murray [150].
B.1.16. Authentication. Authenticity ofmeet has several view-points. One viewpoint is the origin, another adulteration,and the last one ecological point. The common factor is thatconsumers should get what they intend to buy, even whenthe food bought is otherwise acceptable. Some people preferorganic food for their perceived superiority.The compositionofmeat, flavor, color, and fatty acid composition [168] of cattleand sheep depend heavily on diet.
Dian et al. [168] used VIS 400–700 nm and VIS/NIR400–2500 nmwith laboratorymonochromator for separatingpasture-fed and concentrate-fed lamb carcasses. They evalu-ate for this purpose three methods: (1) composition based oncarotenoid absorption and perirenal fat reflectance at 450–510 nm, (2) composition based on perirenal fat reflectanceat 400–700 nm, and (3) full spectrum of 400–2500 nm. Themeasured target was especially the perirenal fat because itis always present and can be removed without affectingcarcass quality, and it provides better results than subcuta-neous caudal fat [169]. The methods assessed the pasture-fed lambs by classification rates of 89.1%, 90.8%, and 97.5%and for concentrate-fed lambs by 98.6%, 98.6%, and 97.8%,respectively.
Cozzolino and Murray [170] applied VIS/NIR 400–2500 nm spectra for classifying the meat from beef, lamb,
pork, and chicken. The achieved accuracy was over 80% withPCA and PLS.
Ding and Xu [171] obtained ideal results while separatingbeef and kangaroo samples. All kangaroo samples wereidentified with 100% accuracy.
B.1.17. Drip Loss/Water Holding Capacity. The water-holdingcapacity is amajor pigmeat technological property. Prevolniket al. [172] used artificial neural network to predict proteindrip loss from NIR with error of 2.5–2.6%.
B.1.18. Meat Freshness. The meat freshness can be thought tobe related to its butchery date and possible freezing/thawing.Downey and Beauchene [173] successfully applied VIS/NIRfor separating the fresh meat from frozen/thawed beef usingfactorial discriminant procedure. Another study to separatefrozen and unfrozen beef was done by Thyoldt and Isaksson[174].
B.1.19. Spoilage. Spoilage of beef has been studied by Ellis etal. [117]; Horvath et al. [116] appliedNIR spectroscopy to porkmeet.
B.1.20. Bioagents. Hobson et al. [175] suggested the useof spectral methods for detecting the metabolic state ofmicroorganisms.
B.1.21. Milks
General Quality. Milk quality measured using NIR has beensuggested by Kawasaki et al. [176]. Al-Qadiri et al. [177]studied the quality with visible (starting at 600 nm) andshort infrared NI Karoui and De Baerdemaeker [178] give areview of analytical methods including NIRS coupled withchemometric tools for the quality determination and identityof dairy products.Content. Laporte and Paquin [179] used partial and overallPLS calibration of near-infrared transmission data to evaluateits fat, crude protein, true protein, and casein content. Theresults indicated that NIR provides reliable results for theevaluation purposes and overall PLS calibration can improvethe results.
Sasic and Ozaki [180] subjected raw milk to SW-NIR(800–1100 nm) measurements. They predicted the fat, pro-tein, and lactose contents using PLS regression and bandassignment. The correlation of spectra and milk protein wassufficiently high. Fat content prediction needed pretreatment.Prediction of lactose content was limited.Adulteration. Milks are also subject to adulteration. Somecases of the adulteration can be subtle like adding foreign fat.Sato et al. [181] used NIR analysis to detect these fats.
B.2. Class B, Type 07: Poultry Products. Chicken meat prod-ucts need to be controlled because of their safety risk andquality. These issues have been considered in many paperssuch as Chen et al. [182], Chen and Marks [183], Chen and

22 International Journal of Spectroscopy
Marks [184], Chen et al. [185], McElhinney et al. [186], andRannou and Downey et al. [187].
Park et al. [188] have recently constructed a prototypemultispectral imaging system for online poultry carcass fecalcontamination detection. They used a line-scan imaging sys-tem using 517, 565, 600, and 802 nm. The longest wavelengthwas used for removing artifacts caused by cuticle.
B.2.1. Incorrect Ingredients. The poultry meat can be con-taminated by many things. One of the most dangerousthings is the manure which contains many disease-causingmicroorganisms.
B.2.2. Content. The poultry meat is evaluated for ash, drymatter (DM), crude protein (CP), and fat content. Themeat can be in different formats-like fresh or dried. Freezedried ostrich meat tenderloin (M. ambiens), big drum (M.iliofibularis), and fan fillet (M. gastrocnemius) were evaluatedby Viljoen et al. (2005) using NIR 1100–2500 nm and PLS0. The results were accurate for crude protein and fat,but the prediction of ash and dry matter was not verysuccessful.
Iron-related substances can also be evaluated from meat.Hong and Yasumoto [139] studied heme and nonheme ironin raw meats (e.g., chicken and duck) using NIR diffusereflectance. They applied multiple regression equations, thesecond derivative data (1100 to 2500 nm) with multiplecorrelation coefficients over 0.9 for both hemes and total iron.The best MREs were obtained with the NIR data recorded atwavelengths where NH groups in proteinmolecules and C–Cand CH in the porphyrin ring of heme give absorption.
B.2.3. Authenticity/Origin. The origin of chickenmeat affectsits value. Ding et al. [189] applied VIS/NIR (750–1100 nm) toseparate broilers from Chinese local chickens using pieces ofchicken meat cut.
B.2.4. Spoilage. Lin et al. [190] used chicken as a materialfor investigating spoilage. Poultry can be spoilt with toomuch heating. It seems that the intensity of wavelength bandsaround 445 nm and 560 nm decreases with cooking timewhen using correlation analysis [191]. After this decrease, theintensity begins to vary at 475, 520, and 585 nm.
B.2.5. Storage and Handling. It has been indicated thatthawing may swallow the reabsorption of certain fluidslike soluble proteins, vitamins, and salts by the meat.However, there is a risk of meat discoloration and lipidoxidation if the time for thawing is too long. Liu et al.[192] studied the effect of chilled and frozen storages (tem-perature, time) and shear force on chicken breasts usinggeneralized 2D correlation analysis of VIS and NIR spec-tra. They noticed that the temperature of frozen storagechanged intensities at 445 and 560 nm. The NIR spectradecreased. Tender and tough muscles caused difference inNIR spectral intensity. Liu et al. [193] examined the thawingbehavior of frozen chicken meat with 2D VIS/NIR correla-tion.
B.3. Class B, Type 08: Aquatic Animal Products. Visiblespectroscopy may sometimes be more useful than NIRS asfound by Stormo et al. [194] who used visible spectroscopyfor assessing endpoint temperature of heat-treated surimi.Their method shows potential for use in the food processingindustry.
B.3.1. Appearance. Blood in fish is sometimes an unwantedcharacteristic. Olsen [195] and Olsen et al. [196] suggestedthat it might be possible to develop a method using VIS/NIRto access residual blood in intact cod muscle.
B.3.2. Identification and Authentication. Fishmeal batchescan be made from different fish species. Cozzolino et al. [197]used NIR reflectance (1100 nm–2500 nm) and chemometricsto identify and authenticate the patches. They concludedthat dummy partial least-square regression achieves 80–82% correct classification. Linear discriminant analysis basedon principal component analysis scored achieved over 80%correct rate.
B.3.3. Freshness. Fish quality is largely determined by fresh-ness. The freshness parameter can be linked to the time ofcatch or harvest or freezing. It can refer to instrumentalanalysis or sensory evaluation.
Uddin et al. [198] suggest using of VIS/NIR spectroscopyto determine whether the fish were frozen-thawed or fresh.Bøknaes et al. [199] used NIR spectroscopy and sensoryquality evaluation to rate the freshness of thawed and chilledcod fillets packed in modified atmosphere. They studied theestimation of storage temperature, storage period, and chillstorage period for fish. The storage time for cod and salmonwas also investigated with VIS/NIR spectra by Nilsen et al.[200]. Several techniques like visible spectroscopy, texture,and image analysis can be combined to improve results [201].The spoilage of rainbow trout has been studied by Lin et al.[202].
Zhang and Lee [203] used near-infrared for determiningfree fatty acids content of fish oil and mackerel. Since thechange in free fatty acids is related to hypoxanthine, theysuggested it to be used as an indicator of freshness. Theyfound that the partial least-square model produced betterresults than multiple linear regression.
B.3.4. Content. Earliest fish study seems to be by Gjerde andMartens [204], they demonstrated that NIR can be used topredict water, fat, and protein contents in rainbow trout.Theyused reflectance spectroscopy to minced and freeze-driedsamples. Since then, a lot of fish studies have been publishedand some at-line and online food quality controls. However,the technique is not yet a standard everyday instrumentaltool.This might be due to high instrumentation costs and theneed of models between spectroscopic reading and qualityparameters in order to analyze them [31].
The fat content of fish has and still is under research. It hasbeen applied on different species and different forms of fish:frozen and thawed glazed bigeye tuna [205], albacore [206],frozen skipjack [207, 208], raw and frozen horse mackerel

International Journal of Spectroscopy 23
[206], frozen and thawed mackerel. Fish are sometimesranked by their fat using visual inspection which seems to bean inaccurate method [205].
Mathias et al. [209] suggested the use of NIR for proteincontent analysis of freeze-dried freshwater fish. The standarddeviation between results fromNIR (mean lipid content) andchemical analysis was 3.7%. Mathias et al. [209] suggestedalso the use of NIR for lipid content analysis of freeze-driedfreshwater fish. The standard deviation between results fromNIR (mean lipid content) and chemical analysis was 10%.
Application of short-wavelength near-infrared spectra(600–1100 nm) can be used to determine the salt andmoisturecontents of salmon roe [7].
Lee et al. [210] applied diffusive reflectance of short-wavelength near-infrared in the range of 700–1000 for pre-dicting the amount of crude lipid of intact, whole rainbowtrout. The best correlation between measured and referencevalues was obtained from measurements at a midpositionbetween dorsal and adipose fins above the lateral line. Themodeling was done using multivariate calibration models,multiple linear regression, and partial least squares.
B.3.5. Defects. Lin et al. [211] used VIS and SW-NIR (600–1100 nm) to find bruises in intact, whole Pacific pink salmon.The measurements were done in diffuse reflectance modeand without removing skin or scales. The spectral resultswere compared against digital images of filleted fish withpartial least-square model. The correct classification rate fornonbruised fish spectrawas 84%,while for bruised it was 81%.
B.3.6. Incorrect Ingredients. Inorganic arsenic is an unwantedand unhealthy ingredient. Font et al. [212] subjected freeze-dried samples of red crayfish to inorganic arsenic contentanalysis. They applied a modified partial least-square regres-sion for modeling with acid-digestion solvent-extractedhydride generation atomic absorption spectrometry mea-surements. The data was standardized by applying standardnormal variate and detrending algorithms and preprocessedwith 2nd derivative.
B.3.7. Bioagents. Fish can contain parasites which rangefrom plain ugly appearance to dangerous for human health.Some food-borne illnesses caused by microorganisms can beprevented by proper handling like cooking.
B.3.8. Spoilage. Fish is spoiled easily and the spoiled fishis usually unsuitable for human consumption. Lin et al.[202] studied the spoilage for rainbow trout. They used600–1100 nm region which may be applicable to detect var-ious fundamental molecular vibrations of several functionalgroups like CH, O–H, N–H, and C=O. The absorption,reflectance, and transmittance of biochemical componentshelp to determine the chemical composition and thusspoilage.
B.4. Class B, Type 009: Amphibians and Reptilians. Theamphibians and reptilians group includes frogs, lizards,
snakes, and turtles. This area seems to be lacking researchpapers.
B.5. Class B, Type 010: Invertebrate Animals. The invertebrateanimals group consists of molluscs (including cephalopods)and other invertebrate animals.
B.5.1. Authenticity. Some edible invertebrate animals aremore valuable and sought after than others.The processing ofseafood causes appearance changes which make it very hardfor a consumer to separate between authentic and adulteratedproducts. This increases the risk of adulteration. Gayo andHale [213] appliedVIS andNIR spectra to find adulteration ofcrab meat. The crab meats (Atlantic blue and blue swimmer)were mixed with surimi-based adulterant in 10% increase.The adulterant increase caused decreasing water absorbance.They concluded that both PLC and principal componentanalysis can detect successfully adulteration. In anotherstudy, by Gayo et al. [214], VIS/NIR was applied to separatethe Atlantic blue crabmeat adulterated with blue swimmercrabmeat (10% increment). Adulteration of meat changed thewater absorption bands which could be used for adulterationdetection.
B.5.2. Content. Brown [215] applied VIS and NIR (350–2500 nm) for homogenized oystermeat and analyzed the dataquantitatively and qualitatively.The results for moisture (𝑟2 =0.92, SEP = 0.53% wet weight), protein (𝑟2 = 0.97, SEP =0.18% wet weight), fat (𝑟2 = 0.97, SEP = 0.11% wet weight),and glycogen (𝑟2 = 0.94, SEP = 0.24% weight) indicate thatVIS/NIR is useful for oyster evaluations.
C.
C.1. Class D, Type 12: Secondary Food Commodities ofPlant Origin
C.1.1. Content. Lebot et al. [216] applied NIR spectra (350–2500 nm) for flours from tropical root and tuber crops(cassava, sweet potato, taro, and yam). They evaluated starch,total sugars, cellulose, total nitrogen, and ash (total minerals)contents of the flours. The prediction accuracy achieved over85% confidence for starch, sugar, and nitrogen, while forash (minerals) it was 71%. The method was unsuitable forcellulose. The advantage of NIR is its cheapness.
Dacal-Nieto et al. [217] have recently used NIR multi-spectral imaging to detect the hollow heart of potato tubers.The camera used is sensitive from 900 nm to 1700 nm andused Specim Imspector N17E (Specim Oy, Oulu, Finland)spectrograph. Several wavelength selection methods wereused, out of which the genetic algorithm was marginallythe best, that is, gave the best classification accuracy in theclassification step.
Green honeybush contains mangiferin and hesperidinwhich are bioactive components. Jourbert et al. [218] pre-dicted content of these ingredients in dried plant material
24 International Journal of Spectroscopy
using diffuse NIR reflectance with results suitable for screen-ing purposes.
Bellato et al. [219] studied wholegrains and flour ofoats. The purpose was to determine 𝛽-glucan and proteincontent.They appliedNIR reflectance for flour and grains andNIR transmittance for flours. The model for chemometricrelationship was a partial robust M-regression, a version ofpartial least squares. The models using reflectance valuesstood out best.
For example, Schimleck et al. [220] evaluated successfullyair-dried leaves from Melaleuca cajuputi tree for their 1.8-cineole (Eucalyptol) content and oil concentrations usingNIR.
Evaluating roots provides an attractive possibility to selectthe individual containing the highest amount of ingredientsor classify the roots in different groups according to somepreset content classes. It is also possible to compare differentroot processing methods. Joubert et al. [221] studied Devil’sclaw root for evaluating iridoids (harpagoside and 8-𝜌-coumaroyl harpagide (8𝜌CHG)) and moisture content fromdifferent drying conditions. The NIR study indicates that theharpagoside retention was lower in sun-dried samples thantunnel dried or freeze-dried samples. They concluded thatthe best retention was obtained from tunnel-drying at 50∘C.NIRS was very suitable for predicting moisture and suitablefor semiquantitative classification using the iridoids.
Leaves of green tea were subjected to NIR reflectancemeasurement and PLS modeling to predict polyphenol andalkaloid compounds (Schulz et al. [222]). The prediction ofparameters of green tea was very successful for gallic acid,epicatechin, epigallocatechin, epicatechin gallate, epigallocat-echin gallate, caffeine, and theobromine, but a lower accuracywas obtained for total polyphenol content probably due to thecolorimetric method (lack of specificity).
The dry matter of leaves can be evaluated very precisely(Schulz et al. [222]) for green tea 𝑅2 = 0.94; SD/SECV =4.12. Furthermore, it is possible to discriminate tea leaves ofdifferent age by principal component analysis on the basis ofthe received NIR spectra.
Hernandez-Hierro et al. [223] examined visible-NIRspectroscopy for freeze-dried broccoli. They concluded thatit is potentially usable for screening of almost all individualglucosinolates and total glucosinolates.
C.1.2. Adulteration. Laasonen et al. [224] used PLS andpretreated NIR reflectance spectra to identify fast Echi-nacea purpurea dried and milled root from samples adul-terated/substituted by other species (Echinacea angustifolia,Echinacea pallida, or Parthenium integrifolium). Minimumadulteration rate for detection was 10%.
C.2. Class D, Type 13: Derived Products of Plant Origin
C.2.1. Content. Juices contain many important ingredientswhose concentration needs to be evaluated. Li et al. [225]measured transmission spectra of orange juice dry extractin the range of 1100–2500 nm. They used multivariate cali-bration to evaluate the amount of sugars (glucose, fructose,
and sucrose) and acids (citric and malic acids). The referencevalues were obtained using enzymatic assays. The best modelwas obtained using partial least-square regression. Fruit juicefrom raw Japanese apricot which is also known as Japaneseplum was also subjected to evaluation of citric andmalic acidcontents. Chen et al. [226] used NIR spectra of 1100–1850 nmand partial least-square regression for producing acceptableprediction results for the evaluation.
Sometimes the concentration of juice is important andone needs to get a high yield. For example, Gonzalez-Saiz etal. [227] applied successfullyNIR andmultivariate calibrationfor monitoring alcoholic fermentation of onion juice. Thegoal was the valorization of worthless onions.
Cen et al. [228] used VIS/NIR (325–1075 nm) for deter-mining the soluble solids contents and pH in orange juice.The data was preprocessed with Wavelet packet transform,standard normal variate transformation (SNV), and Savitzky-Golay first-derivative transformation. Partial least-square(PLS) regressionwas applied and it produced best results withSNV.
We include in this juice group also cola beverages. For acola beverage, important parameters are, for example, pH. Liuand He [229] applied chemometrics to VIS/NIR spectra toget the soluble solid content and pH of cola beverage withexcellent prediction precision. Least squares with supportvector machine provided better results than partial leastsquares.
Different oils have also ingredients which need to beevaluated. Ng et al. [230] used NIR (1100–2500 nm) for theevaluation of degradation products (including total polarmaterial and free fatty acids) of frying oils. According totheir results, partial least-square regression is better in 700–1100 nm area than forward stepwise multiple linear regres-sion, while in the whole range, they are equal. The bestcorrelations were over 0.98.
C.3. Class D, Type 014:Manufactured Foods (Single Ingredient)of Plant Origin
C.3.1. Content. Cozzolino et al. [231] did a review about near-infrared spectroscopy applied to grapes and wine.
Chen and Lei [232] applied VIS and NIR spectra toobtain the amount of carbohydrate in soy milk powder.Their goal was to find a high speed method for this. Theysearched optimal wavelength band in spectra using simulatedannealing and wavelet packet transform tree. After this,different partial least-square models were tested using 20variables.
Dambergs et al. [233] determined the methanol contentof wine-fortifying spirit. They developed partial least-squaremodel for NIR spectra with results from gas chromatographyused as a reference.
Saiz-Abajo et al. [234] used NIR to classify the samplesinto red/white wine vinegar and alcohol vinegar samples.They used orthogonal signal correction (OSC) method toremove information related to tartaric acid. Saiz-Abajo etal. [235] studied 14 parameters which are important for thequality of wine vinegar.

International Journal of Spectroscopy 25
Fan et al. [236] have recently used NIRS with severalwavelength selection methods to predict the total acid ofvinegar.Their main conclusion was that wavelength selectionis essential for the creation of better regression models foracid prediction.
Bruun [237] has studied protein-lipid-carbohydrate inter-actions and their importance to the food quality.
Feng Liu et al. [238] have recently used VIS/NIR spec-troscopy and least-square support vector machine (LS-SVM)for the soluble solid content (SSC) and pH determination offruit vinegar. The results indicate that the method could beused in the online monitoring of vinegar fermentation.
C.3.2. Authenticity. Cozzoline et al. [239] used VIS and NIRspectra to classify Chardonnay and Riesling white winesaccording to their Australian varietal origins. Discriminantpartial least-square (DPLS) regression was the most success-ful model tested; achieving 100% correct labeling for Riesling.Later, Liu et al. [240] classified Tempranillo wines fromAustralia and Spain according to their geographical origins.They accompanied both VIS and NIR data (400–2500 nm)formultivariate analysis PCA,DPLS, PLS-DA, and LDA fromwhich PLS-DA was the best with high correct classificationrate.
Buratti et al. [241] have tested NIR and IR spectroscopycombined with electronic nose and tongue for the offlinemonitoring of wine fermentation. The results are promisingfor the development of an online fermentation monitoringmethod based on these techniques.
C.3.3. Age. Yu et al. [242] applied LS-support vector machine(SUM) to NIR spectra to determine age and oenologicalparameters of rice wine. The inputs to LS-SVM applied werescores of ten principal components (PCs) and radial basisfunctions. LS-SVM was a little better than PLS for alcoholcontent, titratable acidity, and pH.
C.4. Class D, Type 015:Manufactured Foods (Multi-Ingredient)of Plant Origin
C.4.1. Content. Information about fat is often searched byconsumer, for example, in cereals. However, the informationis typically an estimate because the methods used likecalorimetry destroy samples. Vines et al. [243] predicted thetotal amount of fat using near-infrared and modified partialleast-square regression with good results when comparedagainst reference values from the AOAC 996.01 method.Windham et al. [244] tested the effect of moisture to thecalibration models and found that it has a significant effect.However, they developed a new partial least-square regres-sionmodel to be robust enough to provide good prediction ina wide range of residual moistures. Kays et al. [245] used NIRreflectance (1100 to 2498 nm) to determine the total dietaryfiber in cereal and grain products. AOAC (991.43) enzymatic-gravimetric method produced the reference samples.
Fernandez Pierna et al. [64] have recently used NIRhyperspectral imaging and chemometrics for the detectionof impurities in cereals. They used a whiskbroom system
MatrixNIR Chemical Imaging instrument (Malvern instru-ments, Analytical Imaging, Columbia, MD, USA)) with anInGaAs FPA along with two liquid crystal tuneable filters(LCTF) for wavelength selection. The results show potentialfor NIR imaging in impurity detection. However, the whiskb-room systemmight not be as good in this task as a pushbroomsystem that they used in another case study with sugar beets.
C.4.2. Total Fiber Amount. Kays et al. [246] evaluated thetotal fiber amount of cereals using NIR spectra. The sampleswith high sugar and crystalline sugar were selected because aunique spectrum of crystalline sugar affects NIR spectra.Thedeveloped partial least-square model predicted the contentwell. Kays et al. [247] extended the NIR model to cerealswith high fat or sugar and fat. The extension was necessarilybecause high fat or sugar may differ substantially fromspectral properties.
Kays and Barton II [248] used NIR reflectance (1104–2494 nm) to determine the chemometric model for predict-ing gross energy and available energy of cereals.The referencevalues were obtained from bomb calorimetry. In anotherstudy, Kays andBarton II [249] determined accurately solubleand insoluble dietary fiber using NIR reflectance spectra(NIRSystems 6500 monochromator) and reference valuesfrom the AOAC Method 991.43. The modeling was doneusing modified PLS models.
Another aspect is how much energy comes from fat ofground cereals. Kays and Barton II [250] applied successfullynear-infrared in the range of 1104–2494 nm to determine thisusing a version of PLS regressionmodel.The sample referencewas obtained using calorimetry. Archibald and Kays [251]analyzed whole intact breakfast cereals, snack foods, whole-grains, and milled products. They found that total dietaryfiber could be evaluated from NIR reflectance spectra andmoisture has not any effect on the results. Transmissionand reflectance 700–1100 nm NIR spectra of cookies weremeasured by Ozanich et al. [252] to determine moisture andoil contents. Moisture content has highest correlation (andabsorbance) with 965 nm wavelength (a combination bandof H2O) while oil content with 930 nm (a 3rd overtone CH
stretch of methylene) in the normalized spectra.
C.4.3. Structural Properties. deAlencar Figueiredo et al. [253]studied a wide range of sorghum cores with high geneticdiversity. They used NIR reflectance to determine amylase,protein, and lipid contents, endosperm texture, and hardness.
C.4.4. Handling/Fermentation. Bruun et al. [254] used NIRfor analyzing gluten powder with different handling (heat,moisture). The NIR data was processed with second-derivative transformation and extended multiplicative signalcorrection. The moisture caused shifts and intensity changesin the protein bands. Bruun et al. [254] assumed this to be dueto changes in water binding and microenvironments of theamino acid side chains. Heat caused an increase at 2209 nmand decrease at 2167–2182 nm which could be due to an 𝛼-helix to 𝛽-sheet transformation. Next, in [255] different saltswere added to the hydrated gluten. The same preprocessing

26 International Journal of Spectroscopy
was used and PCA was applied on this data. The resultsshowed a correlation between spectra and salt type andconcentration.
Sinelli et al. [256] used NIR (750–1100 nm) and MIR(4000–600 cm−1) with a fiberoptic surface interactance fordough proofing. Dough proofing is a phase during which thedough starts to ferment after the mixture of ingredients, itaffects the quality of bread, and it was also noticed that NIRspectra changed.
D.
D.1. Class E, Type 016: Secondary Food Commodities of Ani-mal Origin. Secondary food commodities of animal originconsist of dried meat and fish products and secondary milkproducts.We include here also products using driedmeat andfish. An example of this is ham.
D.1.1. Appearance. Garcıa-Rey et al. [257] studied appearance(texture and color) of sliced samples fromdeboned and cross-sectioned dry-cured in VIS/NIR 400–2200 nm with a fiber-optic probe. The classification accuracy for pastiness was88.5% and 79.7% when compared against sensory evaluation.They classified into two classes: defect class and no-defectclass.
D.2. Class E, Type 017: Derived Edible Products of AnimalOrigin. Derived edible products of the animal origin groupinclude processed crustaceans and animals,milk, and derivedfats.
D.3. Class E, Type 018: Manufactured Food (Single Ingredient)of Animal Origin. Manufactured food (single ingredient) ofthe animal origin group is the manufactured milk productsusing only single ingredient.
D.4. Class E, Type 019: Manufactured Food (Multi-Ingredient)of Animal Origin. Manufactured milk products using multi-ingredient belong to manufactured food (single ingredient)of the animal origin group. Here we consider dairy productslike cheese or yogurts.
D.4.1. Appearance. Lucas et al. [258] applied VIS and NIRfor estimating color parameters (brightness, redness, andyellowness) with good results.
D.4.2. Smell. NIR seems to be suitable. Celik [259] used NIRto evaluate yogurts’ aroma and its fermentation [260].
D.4.3. Taste. Taste depends on the goodness of the fermen-tation process. NIR can be combined with electric nose as amethod for online fermentation monitoring and visualizingthe state of the fermentation [260].
D.4.4. Content. The titratable acidity of the cultures foryogurt and sour milk can be predicted by forming a modelusing PLS with NIRS signals [260].
Lucas et al. [258] applied VIS/NIR (400–2500 nm) for 4cheese varieties. They estimated the content of cheese for thefollowing items: dry matter, fat, pH, retinol, 𝛼-tocopherol, 𝛽-carotene, xanthophylls, sodium chloride, calcium, potassium,magnesium, zinc, and total antioxidant capacity.The data washandled with modified partial least squares. The coefficientof determination and residual predictive deviation indicatedthat the spectra provided a good estimate for dry matter,fat, 𝛽-carotene, sodium chloride, calcium, and zinc in freshcheeses while it was poor for the rest (pH, retinol, 𝛼-tocopherol, xanthophylls, potassium, magnesium, and totalantioxidant capacity).
D.4.5. pH. pH of the dairy product is important. Navratil etal. [260] predicted its value using NIR.
D.4.6. Origin. Cozzi et al. [261] developed a NIR- (1100–2500 nm) based method using discriminant analysis to dis-criminate Asiago d’Allevo cheese from different productionchains (alpine farms, mountain, and lowland factories).Alpine products were discriminable from factory productsdue to their different fatty acids profile and color. The resultswere confirmed by chemical data.
Abbreviations
ADF: Acid detergent fiberADL: Acid detergent ligninAM: Amylose contentAOAC: Association of Official Agricultural
ChemistsCH: Carbon-hydrogenCP: Crude proteinDA: Discriminant analysisDM: Dry matterDPLS: Discriminant partial least squaresEE: Ether extractET: Endosperm textureFAO: Food and Agriculture OrganizationFPA: Focal plane arrayGA: Genetic algorithmsGE: Gross energyGP: Genetic programmingHCA: Hierarchical cluster analysisHD: HardnessHPLC: High-performance liquid
chromatographyIR: InfraredKDF: Kernel Fisher discriminantL∗, a∗, b∗: Lab color spaceLCTF: Liquid crystal tuneable filterLDA: Linear discriminant analysisLI: Lipid contentLS: Least squaresMCT: Mercury-cadmium-tellurideMIR: Mid-infraredMORS: Meullenet-Owens razor shearmPLS: Modified partial least squares

International Journal of Spectroscopy 27
MRE: Multiple regression equationsNDF: Neutral detergent fiberNIR: Near-infraredNIRS: Near-infrared spectroscopyOSC: Orthogonal signal correctionPC: Principal componentsPCA: Principal component analysispH: Potential hydrogenPLS: Partial least squaresPLSDA: Partial least-squared discriminant analysisPLSR: Partial least-square regressionPR: Protein content𝑅2: Coefficient of determination of a linear
regressionRPFNN: Radical basis function neural networkSC: Sugar contentSMLR: Stepwise multiple linear regressionSEF: Sucrose ester of fatty acidSPA: Successiveprojection algorithmSSC: Soluble solid contentSVM: Support vector machinesSW-NIR: Short wavelength near-infraredTA: Titratable acidityUV: UltravioletUVE: Uninformative variable eliminationVIP: Variable importance in projectionVIS: Visible wavelengthsVIS/NIR: Visual and near-infraredWBSF: Warner-Bratzler shear force.
Acknowledgments
The authors want to acknowledge Tekes (the Finnish Fund-ing Agency for Technology and Innovation) and industrialpartners Riitan Herkku, Oy Ari Green Plant Ltd., JepuanPeruna Oy, Etnovia Oy, and Specim, Spectral Imaging Ltd.,for funding this research in a project called TarhaNIRSo(FruitForce) in Sapuska Research Program of Tekes. Theyalso like to acknowledge Professor Paul Geladi for his manyadvices on NIRS applications.
References
[1] H. Huang, H. Yu, H. Xu, and Y. Ying, “Near infrared spec-troscopy for on/in-line monitoring of quality in foods andbeverages: a review,” Journal of Food Engineering, vol. 87, no. 3,pp. 303–313, 2008.
[2] K. H. Norris and J. R. Hart, “Direct spectrophotometric deter-mination ofmoisture content of grain and seeds,” in Proceedingsof the International Symposium onHumidity andMoisture, 1965.
[3] P.Williams, “Grains and seeds,” inNear-Infrared Spectroscopy inFood Science and Technology, Y. Ozaki,W. F.McClure, and A. A.Christy, Eds., chapter 7.1, pp. 165–217, John Wiley & Sons, 2007.
[4] B. G. Osborne, “Near-infrared spectroscopy in food analysis,” inEncyclopedia of Analytical Chemistry, John Wiley & Sons, 2006.
[5] J. Farkas and I. Dalmadi, “Near infrared and fluorescencespectroscopic methods and electronic nose technology for
monitoring foods,”Progress in Agricultural Engineering Sciences,vol. 5, no. 1, pp. 1–29, 2009.
[6] K. Kaffka, “How the NIR technology came to and spread inEurope for quality assessment and control in the food industry,”Acta Alimentaria, vol. 37, no. 2, pp. 141–145, 2008.
[7] Y. Huang, T.M. Rogers,M. A.Wenz et al., “Detection of sodiumchloride in cured salmon roe by SW-NIR spectroscopy,” Journalof Agricultural and Food Chemistry, vol. 49, no. 9, pp. 4161–4167,2001.
[8] P. Pallav, G. G. Diamond, D. A. Hutchins, R. J. Green, and T.H. Gan, “A near-infrared (NIR) technique for imaging foodmaterials,” Journal of Food Science, vol. 74, no. 1, pp. E23–E33,2009.
[9] Y. Ozaki, W. F. McClure, and A. A. Christy, Eds., Near-Infrared Spectroscopy in Food Science and Technology, Wiley-Interscience, 2006.
[10] L. A. Berrueta, R. M. Alonso-Salces, and K. Heberger, “Super-vised pattern recognition in food analysis,” Journal of Chro-matography A, vol. 1158, no. 1-2, pp. 196–214, 2007.
[11] L.M. Reid, C. P. O’Donnell, andG.Downey, “Recent technolog-ical advances for the determination of food authenticity,”Trendsin Food Science and Technology, vol. 17, no. 7, pp. 344–353, 2006.
[12] H. Cen and Y. He, “Theory and application of near infraredreflectance spectroscopy in determination of food quality,”Trends in Food Science and Technology, vol. 18, no. 2, pp. 72–83,2007.
[13] C.-J. Du andD.-W. Sun, “Learning techniques used in computervision for food quality evaluation: a review,” Journal of FoodEngineering, vol. 72, no. 1, pp. 39–55, 2006.
[14] M. Iwamoto, J. Uozumi, and K. Nishinari, “Preliminary inves-tigation of the state of water in foods by near infrared spec-troscopy,” in NIR/NIT Conference, Budapest, Hungary, 1987.
[15] M. Iwamoto, S. Kawano, and H. Abe, “Water in foods. Analysisof hydrogen bonding related to water in foods,” NIR News, vol.6, no. 3, pp. 10–12, 1995.
[16] H. Maeda, Y. Ozaki, M. Tanaka, N. Hayashi, and T. Kojima,“Near infrared spectroscopy and chemometrics studies oftemperature-dependent spectral variations of water: relation-ship between spectral changes and hydrogen bonds,” Journal ofNear Infrared Spectroscopy, vol. 3, pp. 191–201, 1995.
[17] H. Buning-Pfaue, “Analysis of water in food by near infraredspectroscopy,” Food Chemistry, vol. 82, no. 1, pp. 107–115, 2003.
[18] P.Geladi andH.Grahn,Multivariate ImageAnalysis, JohnWiley& Sons, 1996.
[19] J. Workman Jr. and A. Springsteen, Applied Spectroscopy: ACompact Reference for Practitioners, Academic Press, 1998.
[20] J. Koljonen, T. E. M. Nordling, and J. T. Alander, “A review ofgenetic algorithms in near infrared spectroscopy and chemo-metrics: past and future,” Journal of Near Infrared Spectroscopy,vol. 16, no. 3, pp. 189–197, 2008.
[21] D.-W. Sun, Modern Techniques for Food Authentication, Else-vier/Academic Press, 2008.
[22] J. Workman Jr. and L. Weyer, Practical Guide to InterpretiveNear-Infrared Spectroscopy, CRC Press, Boca Raton, Fla, USA,2008.
[23] J. R. Koza, “Genetic programming as a means for programmingcomputers by natural selection,” Statistics and Computing, vol.4, no. 2, pp. 87–112, 1994.
[24] K. Norris and P. Williams, “Optimization of mathematicaltreatment of raw near-infrared signal in the measurement of
28 International Journal of Spectroscopy
protein in hard red spring wheat. I. Influence of particle size,”Cereal Chemistry, vol. 61, pp. 158–165, 1983.
[25] R. Goodacre and D. B. Kell, “Evolutionary computing for thecharacterisation and qualification of microbial systems fromhyperspectral data,” in FT-IR Meeting in Berlin, 2000.
[26] P. Williams and D. Sobering, “Comparison of commercial nearinfrared transmittance and reflectance instruments for analysisof whole grains and seeds,” Journal Near Infrared Spectroscopy,vol. 1, no. 1, pp. 25–32, 1993.
[27] P. Butz, C. Hofmann, and B. Tauscher, “Recent developmentsin noninvasive techniques for fresh fruit and vegetable internalquality analysis,” Journal of Food Science, vol. 70, no. 9, pp. R131–R141, 2005.
[28] B. M. Nicolaı, K. Beullens, E. Bobelyn et al., “Nondestructivemeasurement of fruit and vegetable quality by means of NIRspectroscopy: a review,” Postharvest Biology and Technology, vol.46, no. 2, pp. 99–118, 2007.
[29] C. M. Andersen, J. P. Wold, and S. B. Engelsen, “Autofluo-rescence spectroscopy in food analysis,” in Handbook of FoodAnalysis Instruments, chapter 15, pp. 347–364, CRC Press, 2009.
[30] J. P. Wold and M. Mielnik, “Nondestructive assessment oflipid oxidation in minced poultry meat by autofluorescencespectroscopy,” Journal of Food Science, vol. 65, no. 1, pp. 87–95,2000.
[31] L. Nollet and F. Toldra, Handbook of Seafood and SeafoodProducts Analysis, CRC Press, Boca Raton, Fla, USA, 2010.
[32] H. B. Ding and R. J. Xu, “Near-infrared spectroscopic techniquefor detection of beef hamburger adulteration,” Journal of Agri-cultural and Food Chemistry, vol. 48, no. 6, pp. 2193–2198, 2000.
[33] G. ElMasry, D.-W. Sun, and P. Allen, “Near-infrared hyperspec-tral imaging for predicting colour, pH and tenderness of freshbeef,” Journal of Food Engineering, vol. 110, no. 1, pp. 127–140,2012.
[34] Y. Liao, Y. Fan, and F. Cheng, “On-line prediction of pH valuesin fresh pork using visible/near-infrared spectroscopy withwavelet de-noising and variable selection methods,” Journal ofFood Engineering, vol. 109, no. 4, pp. 668–675, 2012.
[35] C. Collell, P. Gou, J. Arnau, and J. Comaposada, “Non-destructive estimation of moisture, water activity and NaCl atham surface during resting and drying usingNIR spectroscopy,”Food Chemistry, vol. 129, no. 2, pp. 601–607, 2011.
[36] L. Dvash, O. Afik, S. Shafir et al., “Determination by near-infrared spectroscopy of perseitol used as a marker for thebotanical origin of avocado (Persea americana Mill.) honey,”Journal of Agricultural and Food Chemistry, vol. 50, no. 19, pp.5283–5287, 2002.
[37] G. Downey and J. D. Kelly, “Detection and quantificationof apple adulteration in diluted and sulfited strawberry andraspberry purees using visible and near-infrared spectroscopy,”Journal of Agricultural and Food Chemistry, vol. 52, no. 2, pp.204–209, 2004.
[38] R. Fugel, R. Carle, and A. Schieber, “Quality and authenticitycontrol of fruit purees, fruit preparations and jams-a review,”Trends in Food Science & Technology, vol. 16, no. 10, pp. 433–441, 2005.
[39] P. Y. Qiu, H. B. Ding, Y. K. Tang, and R. J. Xu, “Determinationof chemical composition of commercial honey by near-infraredspectroscopy,” Journal of Agricultural and Food Chemistry, vol.47, no. 7, pp. 2760–2765, 1999.
[40] J. Fontaine, J. Horr, and B. Schirmer, “Near-infrared reflectancespectroscopy enables the fast and accurate prediction of the
essential amino acid contents in soy, rapeseed meal, sunflowermeal, peas, fishmeal, meat meal products, and poultry meal,”Journal of Agricultural and Food Chemistry, vol. 49, no. 1, pp.57–66, 2001.
[41] Y. Kim, M. Singh, and S. E. Kays, “Near-infrared spectroscopyfor measurement of total dietary fiber in homogenized meals,”Journal of Agricultural and Food Chemistry, vol. 54, no. 2, pp.292–298, 2006.
[42] W. Zeng, H. Zhang, and T. Lee, “Direct determination of thestarch content in gravy by near-infrared spectroscopy,” Journalof Agricultural and FoodChemistry, vol. 44, no. 6, pp. 1460–1463,1996.
[43] M. R. Ellekjaer, T. Naes, T. Isaksson, and R. Solheim, “Iden-tification of sausages with fat-substitutes using near infraredspectroscopy,” in Near Infrared Spectroscopy: Bridging the GapBetween Data Analysis and NIR Applications, pp. 320–326, EllisHorwood, London, UK, 1992.
[44] A. J. Gaitan-Jurado, V. Ortiz-Somovilla, F. Espana-Espana, J.Perez-Aparicio, and E. J. De Pedro-Sanz, “Quantitative analysisof pork dry-cured sausages to quality control by NIR spec-troscopy,” Meat Science, vol. 78, no. 4, pp. 391–399, 2008.
[45] V. Ortiz-Somovilla, F. Espana-Espana, A. J. Gaitan-Jurado, J.Perez-Aparicio, and E. J. De Pedro-Sanz, “Proximate analysis ofhomogenized andmincedmass of pork sausages byNIRS,” FoodChemistry, vol. 101, no. 3, pp. 1031–1040, 2006.
[46] E. Mehinagic, G. Royer, D. Bertrand, R. Symoneaux, F. Laurens,and F. Jourjon, “Relationship between sensory analysis, pen-etrometry and visible-NIR spectroscopy of apples belonging todifferent cultivars,” Food Quality and Preference, vol. 14, no. 5-6,pp. 473–484, 2003.
[47] Walsh, J. Guthrie, and J. Burney, “Application of commerciallyavailable, low-cost, miniaturised NIR spectrometers to theassessment of the sugar content of intact fruit,” AustralianJournal of Plant Physiology, vol. 27, no. 12, pp. 1175–1186, 2000.
[48] P. Carlini, R. Massantini, and F. Mencarelli, “Vis-NIR measure-ment of soluble solids in cherry and apricot by PLS regressionand wavelength selection,” Journal of Agricultural and FoodChemistry, vol. 48, no. 11, pp. 5236–5242, 2000.
[49] S. Tsuchikawa and T. Hamada, “Application of time-of-flightnear infrared spectroscopy for detecting sugar and acid contentsin apples,” Journal of Agricultural and Food Chemistry, vol. 52,no. 9, pp. 2434–2439, 2004.
[50] R. J. Blakey, J. P. Bower, and I. Bertling, “Influence of waterand ABA supply on the ripening pattern of avocado (Perseaamericana Mill.) fruit and the prediction of water contentusing Near Infrared Spectroscopy,” Postharvest Biology andTechnology, vol. 53, no. 1-2, pp. 72–76, 2009.
[51] L. Leon, A. Garrido-Varo, and G. Downey, “Parent and harvestyear effects on near-infrared reflectance spectroscopic analysisof olive (Olea europaea L.) fruit traits,” Journal of Agriculturaland Food Chemistry, vol. 52, no. 16, pp. 4957–4962, 2004.
[52] S. Zhang, Y. Zhao, W. Guo et al., “Robust model of fresh jujubesoluble solids content with near-infrared (NIR) spectroscopy,”African Journal of Biotechnology, vol. 11, no. 32, pp. 8133–8140,2012.
[53] A. Terdwongworakul, N. Nakawajana, S. Teerachaichayut, andA. Janhiran, “Determination of translucent content in mangos-teen by means of near infrared transmittance,” Journal of FoodEngineering, vol. 109, no. 1, pp. 114–119, 2012.
[54] L. S.Magwaza,U. L.Opara,H.Nieuwoudt, P. J. Cronje,W. Saeys,and B. Nicolaı, “NIR spectroscopy applications for internal
International Journal of Spectroscopy 29
and external quality analysis of citrus fruit-a review,” Food andBioprocess Technology, vol. 5, no. 2, pp. 425–444, 2012.
[55] B. Shi, B. Ji, D. Zhu, Z. Tu, and Z. Qing, “Study on geneticalgorithms-based NIR wavelength selection for determinationof soluble solids content in fuji apples,” Journal of Food Quality,vol. 31, no. 2, pp. 232–249, 2008.
[56] Y. Ying and Y. Liu, “Nondestructive measurement of internalquality in pear using genetic algorithms and FT-NIR spec-troscopy,” Journal of Food Engineering, vol. 84, no. 2, pp. 206–213, 2008.
[57] A. Pissard, J. A. Fernandez Pierna, V. Baeten et al., “Non-destructive measurement of vitamin C, total polyphenol andsugar content in apples using near-infrared spectroscopy,”Journal of the Science of Food and Agriculture, vol. 93, no. 2, pp.238–244, 2013.
[58] M. Tanaka and T. Kojima, “Near-infrared monitoring of thegrowth period of Japanese pear fruit based on constituent sugarconcentrations,” Journal of Agricultural and FoodChemistry, vol.44, no. 8, pp. 2272–2277, 1996.
[59] P. Sirisomboon, M. Tanaka, T. Kojima, and P. Williams, “Non-destructive estimation of maturity and textural properties ontomato “Momotaro” by nearinfrared spectroscopy,” Journal ofFood Engineering, vol. 112, no. 3, pp. 218–226, 2012.
[60] J. Xing, D. Guyer, D. Ariana, and R. Lu, “Determining optimalwavebands using genetic algorithm for detection of internalinsect infestation in tart cherry,” Sensing and Instrumentationfor Food Quality and Safety, vol. 2, no. 3, pp. 161–167, 2008.
[61] M. Kim, A. Lefcourt, K. Chao, Y. Chen, I. Kim, and D. Chan,“Multispectral detection of fecal contamination on apples basedon hyperspectral imagery: part I application of visible and near-infrared reflectance imaging,” Transactions of the ASABE, vol.45, no. 6, pp. 2027–2037, 2002.
[62] M. Kim, A. Lefcourt, Y. Chen, I. Kim, D. Chan, and K. Chao,“Multispectral detection of fecal contamination on apples basedon hyperspectral imagery: part II application of hyperspectralfluorescence imaging,” Transactions of the American Society ofAgricultural Engineers, vol. 45, no. 6, pp. 2039–2047, 2002.
[63] E. A. Veraverbeke, J. Lammertyn, B. M. Nicolaı, and J. Iruda-yaraj, “Spectroscopic evaluation of the surface quality of apple,”Journal of Agricultural and Food Chemistry, vol. 53, no. 4, pp.1046–1051, 2005.
[64] J. A. Fernandez Pierna, P. Vermeulen, O. Amand, A. Tossens,P. Dardenne, and V. Baeten, “NIR hyperspectral imaging spec-troscopy and chemometrics for the detection of undesirablesubstances in food and feed,” Chemometrics and IntelligentLaboratory Systems, vol. 117, pp. 233–239, 2012.
[65] K. U. Flores Rojas, Determinacion no destructiva de parametrosde calidad de frutas y hortalizas mediante espectroscopıa dereflectancia en el infrarrojo cercano [doctoral thesis], Universidadde Cordoba, Cordoba, Spain, 2009.
[66] J. Sugiyama, “Visualization of sugar content in the flesh of amelon by near-infrared imaging,” Journal of Agricultural andFood Chemistry, vol. 47, no. 7, pp. 2715–2718, 1999.
[67] M. Tsuta, J. Sugiyama, and Y. Sagara, “Near-infrared imagingspectroscopy based on sugar absorption band for melons,”Journal of Agricultural and Food Chemistry, vol. 50, no. 1, pp.48–52, 2002.
[68] A. M. K. Pedro and M. M. C. Ferreira, “Nondestructivedetermination of solids and carotenoids in tomato productsby near-infrared spectroscopy and multivariate calibration,”Analytical Chemistry, vol. 77, no. 8, pp. 2505–2511, 2005.
[69] F. Liu, Y. He, and G. Sun, “Determination of protein con-tent of Auricularia auricula using near infrared spectroscopycombined with linear and nonlinear calibrations,” Journal ofAgricultural and Food Chemistry, vol. 57, no. 11, pp. 4520–4527,2009.
[70] C. Van Dijk, M. Fischer, J. Holm, J. Beekhuizen, T. Tolle-Smits,and C. Boeriu, “Texture of cooked potatoes (Solanum tubero-sum). 1. Relationships between dry matter content, sensory-perceived texture, and near-infrared spectroscopy,” Journal ofAgricultural and Food Chemistry, vol. 50, no. 18, pp. 5082–5088,2002.
[71] A. Dacal-Nieto, E. Vazquez-Fernandez, A. Formella, F. Martin,S. Torres-Guijarro, andH.Gonzalez-Jorge, “A genetic algorithmapproach for feature selection in potatoes classification bycomputer vision,” in Proceedings of the 35th Annual Conferenceof the IEEE Industrial Electronics Society (IECON ’09), pp. 1955–1960, November 2009.
[72] Y. Roggo, L. Duponchel, and J. Huvenne, “Quality evaluationof sugar beet (Beta vulgaris) by near-infrared spectroscopy,”Journal of Agricultural and Food Chemistry, vol. 52, no. 5, pp.1055–1061, 2004.
[73] S. R. Delwiche, L. O. Pordesimo, A. M. Scaboo, and V. R.Pantalone, “Measurement of inorganic phosphorus in soybeanswith near-infrared spectroscopy,” Journal of Agricultural andFood Chemistry, vol. 54, no. 19, pp. 6951–6956, 2006.
[74] I. V. Kovalenko, G. R. Rippke, and C. R. Hurburgh Jr., “Deter-mination of amino acid composition of soybeans (Glycine max)by near-infrared spectroscopy,” Journal of Agricultural and FoodChemistry, vol. 54, no. 10, pp. 3485–3491, 2006.
[75] D. L. Pazdernik, S. J. Plehn, J. L. Halgerson, and J. H. Orf, “Effectof temperature and genotype on the crude glycinin fraction(11s) of soybean and its analysis by near-infrared reflectancespectroscopy (near-IRS),” Journal of Agricultural and FoodChemistry, vol. 44, no. 8, pp. 2278–2281, 1996.
[76] D. L. Pazdernik, A. S. Killam, and J. H. Orf, “Analysis of aminoand fatty acid composition in soybean seed, using near infraredreflectance spectroscopy,” Agronomy Journal, vol. 89, no. 4, pp.679–685, 1997.
[77] K. Hollung, M. Øverland, M. Hrustic et al., “Evaluation of non-starch polysaccharides and oligosaccharide content of differentsoybean varieties (Glycine max) by near-infrared spectroscopyand proteomics,” Journal of Agricultural and Food Chemistry,vol. 53, no. 23, pp. 9112–9121, 2005.
[78] D. T. Lamb and C. R. Hurburgh Jr., “Moisture determination insingle soybean seeds by near-infrared transmittance,” Transac-tions of the American Society of Agricultural Engineers, vol. 34,no. 5, pp. 2123–2129, 1991.
[79] J.O. Bennett, A.H.Krishnan,W. J.Wiebold, andH. B.Krishnan,“Positional effect on protein and oil content and composition ofsoybeans,” Journal of Agricultural and Food Chemistry, vol. 51,no. 23, pp. 6882–6886, 2003.
[80] J. O. Bennett, O. Yu, L. G. Heatherly, and H. B. Krishnan,“Accumulation of genistein and daidzein, soybean isoflavonesimplicated in promoting human health, is significantly elevatedby irrigation,” Journal of Agricultural and Food Chemistry, vol.52, no. 25, pp. 7574–7579, 2004.
[81] C. Esquerre, A. A. Gowen, C. P. O’donnell, and G. Downey,“Initial studies on the quantitation of bruise damage and fresh-ness in mushrooms using visible-near-infrared spectroscopy,”Journal of Agricultural and Food Chemistry, vol. 57, no. 5, pp.1903–1907, 2009.
30 International Journal of Spectroscopy
[82] S. Li, X. Zhu, J. Zhang, G. Li, D. Su, and Y. Shan, “Authenticationof pure camellia oil by using near infrared spectroscopy andpattern recognition techniques,” Journal of Food Science, vol. 77,no. 4, pp. C374–C380, 2012.
[83] J. Siska and C. R. Hurburgh Jr., “Corn density measurementby near-infrared transmittance,” Transactions of the AmericanSociety of Agricultural Engineers, vol. 38, no. 6, pp. 1821–1824,1995.
[84] A. A. Gowen, C. P. O’Donnell, M. Taghizadeh, P. J. Cullen, J. M.Frias, and G. Downey, “Hyperspectral imaging combined withprincipal component analysis for bruise damage detection onwhite mushrooms (Agaricus bisporus),” Journal of Chemomet-rics, vol. 22, no. 3-4, pp. 259–267, 2008.
[85] T. C. Pearson and D. T. Wicklow, “Detection of corn kernelsinfected by fungi,” Transactions of the ASABE, vol. 49, no. 4, pp.1235–1245, 2006.
[86] S. H. Gordon, B. C. Wheeler, R. B. Schudy, D. T. Wicklow,and R. V. Greene, “Neural network pattern recognition ofphotoacoustic FTIR spectra and knowledge-based techniquesfor detection of mycotoxigenic fungi in food grains,” Journal ofFood Protection, vol. 61, no. 2, pp. 221–230, 1998.
[87] N. Berardo, V. Pisacane, P. Battilani, A. Scandolara, A. Pietri,andA.Marocco, “Rapid detection of kernel rots andmycotoxinsin maize by near-infrared reflectance spectroscopy,” Journal ofAgricultural and Food Chemistry, vol. 53, no. 21, pp. 8128–8134,2005.
[88] J. Jin, L. Tang, Z.Hruska, andH. Yao, “Classification of toxigenicand atoxigenic strains of Aspergillus flavus with hyperspectralimaging,” Computers and Electronics in Agriculture, vol. 69, no.2, pp. 158–164, 2009.
[89] F. E. Dowell, S. E. Ram, and L. M. Seitz, “Predicting scab,vomitoxin, and ergosterol in single wheat kernels using near-infrared spectroscopy,”Cereal Chemistry, vol. 76, no. 4, pp. 573–576, 1999.
[90] C. Miralbes, “Prediction chemical composition and alveographparameters on wheat by near-infrared transmittance spec-troscopy,” Journal of Agricultural and Food Chemistry, vol. 51,no. 21, pp. 6335–6339, 2003.
[91] N. Yang and G. Ren, “Application of near-infrared reflectancespectroscopy to the evaluation of rutin and D-chiro-inositolcontents in tartary buckwheat,” Journal of Agricultural and FoodChemistry, vol. 56, no. 3, pp. 761–764, 2008.
[92] O. V. Brenna and N. Berardo, “Application of near-infraredreflectance spectroscopy (NIRS) to the evaluation ofcarotenoids content in maize,” Journal of Agricultural andFood Chemistry, vol. 52, no. 18, pp. 5577–5582, 2004.
[93] S. Kawamura, M. Natsuga, and K. Itoh, “Determination ofundried rough rice constituent content using near-infraredtransmission spectroscopy,” Transactions of the American Soci-ety of Agricultural Engineers, vol. 42, no. 3, pp. 813–818, 1999.
[94] C. Zhang, Y. Shen, J. Chen, P. Xiao, and J. Bao, “Nondestructiveprediction of total phenolics, flavonoid contents, and antioxi-dant capacity of rice grain using near-infrared spectroscopy,”Journal of Agricultural and Food Chemistry, vol. 56, no. 18, pp.8268–8272, 2008.
[95] T. L. Stubbs, A. C. Kennedy, and A. Fortuna, “Using NIRS topredict fiber and nutrient content of Dryland cereal cultivars,”Journal of Agricultural and Food Chemistry, vol. 58, no. 1, pp.398–403, 2010.
[96] P. R. Wiley, G. J. Tanner, P. M. Chandler, and R. S. Ander-ssen, “Molecular classification of barley (Hordeum vulgare
L.) mutants using derivative NIR spectroscopy,” Journal ofAgricultural and Food Chemistry, vol. 57, no. 10, pp. 4042–4050,2009.
[97] G. Fox and M. Manley, “Hardness methods for testing maizekernels,” Journal of Agricultural and Food Chemistry, vol. 57, no.13, pp. 5647–5657, 2009.
[98] M. Manley, P. Williams, D. Nilsson, and P. Geladi, “Nearinfrared hyperspectral imaging for the evaluation of endospermtexture inwhole yellowmaize (Zeamaize L.) Kernels,” Journal ofAgricultural and Food Chemistry, vol. 57, no. 19, pp. 8761–8769,2009.
[99] S. Kawamura, M. Natsuga, and K. Itoh, “Visual and near-infrared reflectance spectroscopy for rice taste evaluation,”Transactions of the American Society of Agricultural Engineers,vol. 40, no. 6, pp. 1755–1759, 1997.
[100] F. Davrieux, F. Allal, G. Piombo et al., “Near infrared spec-troscopy for high-throughput characterization of shea tree(Vitellaria paradoxa) nut fat profiles,” Journal of Agricultural andFood Chemistry, vol. 58, no. 13, pp. 7811–7819, 2010.
[101] R. Font, M. del Rıo, J. M. Fernandez-Martınez, and A. de Haro-Bailon, “Use of near-infrared spectroscopy for screening theindividual and total glucosinolate contents in indian mustardseed (Brassica juncea L. Czern. & Coss.),” vol. 52, no. 11, pp.3563–3569, 2004.
[102] R. Font, M. del Rıo, J. M. Fernandez, and A. de Haro, “Aciddetergent fiber analysis in oilseed brassicas by near-infraredspectroscopy,” Journal of Agricultural and Food Chemistry, vol.51, no. 10, pp. 2917–2922, 2003.
[103] S. Kim, H. Park, and G. Choung, “Nondestructive determina-tion of oil content and fatty acid composition in perilla seedsby near-infrared spectroscopy,” Journal of Agricultural and FoodChemistry, vol. 55, no. 5, pp. 1679–1685, 2007.
[104] G. Hacisalihoglu, B. Larbi, and Mark Settles, “Near-infraredreflectance spectroscopy predicts protein, starch, and seedweight in intact seeds of common bean (Phaseolus vulgaris L.),”Journal of Agricultural and Food Chemistry, vol. 58, no. 2, pp.702–706, 2010.
[105] L. Wang, Q. Wang, H. Liu, L. Liu, and Y. Du, “Determiningthe contents of protein and amino acids in peanuts using near-infrared reflectance spectroscopy,” Journal of the Science of Foodand Agriculture, vol. 93, no. 1, pp. 118–124, 2013.
[106] L. Yang and Q. Sun, “Recognition of the hardness of licoriceseeds using a semi-supervised learning method and near-infrared spectral data,”Chemometrics and Intelligent LaboratorySystems, vol. 114, pp. 109–115, 2012.
[107] G. Downey, R. Briandet, R. H. Wilson, and E. K. Kemsley,“Near- andmid-infrared spectroscopies in food authentication:coffee varietal identification,” Journal of Agricultural and FoodChemistry, vol. 45, no. 11, pp. 4357–4361, 1997.
[108] G. Downey, P. McIntyre, and A. N. Davies, “Detecting andquantifying sunflower oil adulteration in extra virgin olive oilsfrom the Eastern Mediterranean by visible and near-infraredspectroscopy,” Journal of Agricultural and Food Chemistry, vol.50, no. 20, pp. 5520–5525, 2002.
[109] T. Woodcock, G. Downey, and C. P. O’Donnell, “Confirmationof declared provenance of European extra virgin olive oilsamples by NIR spectroscopy,” Journal of Agricultural and FoodChemistry, vol. 56, no. 23, pp. 11520–11525, 2008.
[110] L. D. Gautz, P. Kaufusi, M. C. Jackson, H. C. Bittenbender,and C. Tang, “Determination of kavalactones in dried kava(Piper methysticum) powder using near-infrared reflectance

International Journal of Spectroscopy 31
spectroscopy and partial least-squares regression,” Journal ofAgricultural and Food Chemistry, vol. 54, no. 17, pp. 6147–6152,2006.
[111] A. Zalacain, S. A. Ordoudi, E. M. Dıaz-Plaza et al., “Near-infrared spectroscopy in saffron quality control: determinationof chemical composition and geographical origin,” Journal ofAgricultural and Food Chemistry, vol. 53, no. 24, pp. 9337–9341,2005.
[112] K. Tanaka, Y. Kuba, T. Sasaki, F. Hiwatashi, and K. Komatsu,“Quantitation of curcuminoids in curcuma rhizome by near-infrared spectroscopic analysis,” Journal of Agricultural andFood Chemistry, vol. 56, no. 19, pp. 8787–8792, 2008.
[113] G. Ren and F. Chen, “Simultaneous quantification of ginseno-sides in American ginseng (Panax quinquefolium) root powderby visible/near-infrared reflectance spectroscopy,” Journal ofAgricultural and Food Chemistry, vol. 47, no. 7, pp. 2771–2775,1999.
[114] S. Kim, H. Park, and G. Choung, “Nondestructive determina-tion of lignans and lignan glycosides in sesame seeds by nearinfrared reflectance spectroscopy,” Journal of Agricultural andFood Chemistry, vol. 54, no. 13, pp. 4544–4550, 2006.
[115] N. Xin, X. Gu, H. Wu, Y. Hu, and Z. Yang, “Discrimination ofraw and processed Dipsacus asperoides by near infrared spec-troscopy combined with least squares-support vector machineand random forests,” Spectrochimica Acta—Part A, vol. 89, pp.18–24, 2012.
[116] K. Horvath, Z. Seregely, E. Andrassy, I. Dalmadi, and J. Farkas,“A preliminary study using near infrared spectroscopy toevaluate freshness and detect spoilage in sliced porkmeat,”ActaAlimentaria, vol. 37, no. 1, pp. 93–102, 2008.
[117] D. I. Ellis, D. Broadhurst, D. B. Kell, J. J. Rowland, and R.Goodacre, “Rapid and quantitative detection of the microbialspoilage ofmeat by fourier transform infrared spectroscopy andmachine learning,” Applied and Environmental Microbiology,vol. 68, no. 6, pp. 2822–2828, 2002.
[118] W. R. Windham, D. P. Smith, B. Park, K. C. Lawrence, and P.W. Feldner, “Algorithm development with visible/near-infraredspectra for detection of poultry feces and ingesta,” Transactionsof the American Society of Agricultural Engineers, vol. 46, no. 6,pp. 1733–1738, 2003.
[119] H. L. A. Tarr, “Flavor of flesh foods,”Advances in Chemistry, vol.56, pp. 190–202, 1969.
[120] C. E. Byrne, G. Downey, D. J. Troy, and D. J. Buckley, “Non-destructive prediction of selected quality attributes of beefby near-infrared reflectance spectroscopy between 750 and1098 nm,” Meat Science, vol. 49, no. 4, pp. 399–409, 1998.
[121] S. Andres, I. Murray, E. A. Navajas, A. V. Fisher, N. R. Lambe,and L. Bunger, “Prediction of sensory characteristics of lambmeat samples by near infrared reflectance spectroscopy,” MeatScience, vol. 76, no. 3, pp. 509–516, 2007.
[122] M. Renerre and R. Labas, “Biochemical factors influencingmetmyoglobin formation in beef muscles,”Meat Science, vol. 19,no. 2, pp. 151–165, 1987.
[123] M. Renerre, “Factors involved in the discoloration of beefmeat,”International Journal of Food Science and Technology, vol. 25, no.6, pp. 613–630, 1990.
[124] A. H. A. Van den Oord and J. J. Wesdorp, “Colour rating andpigment composition of beef: relation between colour mea-surement by reflectance spectrophotometry, subjective colourevaluation, and the relative concentration of oxymyoglobin andferric myoglobin in chilled retail-packed beef,” Journal of FoodTechnology, vol. 6, no. 1, pp. 15–20, 1971.
[125] B. Leroy, S. Lambotte, O. Dotreppe, H. Lecocq, L. Istasse, andA. Clinquart, “Prediction of technological and organolepticproperties of beef Longissimus thoracis from near-infraredreflectance and transmission spectra,”Meat Science, vol. 66, no.1, pp. 45–54, 2004.
[126] S. D. Shackelford, T. L. Wheeler, and M. Koohmaraie, “On-lineclassification of US Select beef carcasses for longissimus tender-ness using visible and near-infrared reflectance spectroscopy,”Meat Science, vol. 69, no. 3, pp. 409–415, 2005.
[127] D. Cozzolino, N. Barlocco, A. Vadell, F. Ballesteros, and G.Gallieta, “The use of visible and near-infrared reflectancespectroscopy to predict colour on both intact and homogenisedpork muscle,” LWT—Food Science and Technology, vol. 36, no.2, pp. 195–202, 2003.
[128] S. Andres, A. Silva, S. L. Soares-Pereira, C. Martins, A. M.Bruno-Soares, and L. Murray, “The use of visible and nearinfrared reflectance spectroscopy to predict beefM. longissimusthoracis et lumborum quality attributes,” Meat Science, vol. 78,no. 3, pp. 217–224, 2008.
[129] J. D. Wood, M. Enser, A. V. Fisher et al., “Fat deposition, fattyacid composition and meat quality: a review,”Meat Science, vol.78, no. 4, pp. 343–358, 2008.
[130] N. Prieto, M. E. R. Dugan, O. Lopez-Campos, T. A. McAllister,J. L. Aalhus, and B. Uttaro, “Near infrared reflectance spec-troscopy predicts the content of polyunsaturated fatty acids andbiohydrogenation products in the subcutaneous fat of beef cowsfed flaxseed,” Meat Science, vol. 90, no. 1, pp. 43–51, 2012.
[131] J. R. Anderson, C. Borggaard, A. J. Rasmussen, and L. P.Houmoller, “Optical measurements of pH in meat,” MeatScience, vol. 53, no. 2, pp. 135–141, 1999.
[132] B. Savenije, G. H. Geesink, J. G. P. van der Palen, and G.Hemke, “Prediction of pork quality using visible near infraredreflectance spectroscopy,” Meat Science, vol. 73, no. 1, pp. 181–184, 2006.
[133] Y. Liao, Y. Fan, and F. Cheng, “On-line prediction of fresh porkquality using visible/near-infrared reflectance spectroscopy,”Meat Science, vol. 86, no. 4, pp. 901–907, 2010.
[134] E. Tornberg, M. Wahlgren, J. Brøndum, and S. B. Engelsen,“Pre-rigor conditions in beef under varying temperature- andpH-falls studied with rigometer, NMR and NIR,” Food Chem-istry, vol. 69, no. 4, pp. 407–418, 2000.
[135] D. E. Chan, P. N. Walker, and E. W. Mills, “Prediction ofpork quality characteristics using visible and near-infraredspectroscopy,” Transactions of the ASAE, vol. 45, no. 5, pp. 1519–1527, 2002.
[136] V. Sierra, N. Aldai, P. Castro, P. Osoro, A. Coto-Montes, and M.Olivan, “Prediction of the fatty acid composition of beef by nearinfrared transmittance spectroscopy,” Meat Science, vol. 78, no.3, pp. 248–255, 2008.
[137] M. Prevolnik, M. Candek-Potokar, D. Skorjanc et al., “Predict-ing intramuscular fat content in pork and beef by near infraredspectroscopy,” Journal of Near Infrared Spectroscopy, vol. 13, no.2, pp. 77–85, 2005.
[138] N. Barlocco, A. Vadell, F. Ballesteros, G. Galietta, and D. Coz-zolino, “Predicting intramuscular fat, moisture and Warner-Bratzler shear force in pork muscle using near infraredreflectance spectroscopy,” Animal Science, vol. 82, no. 1, pp. 111–116, 2006.
[139] J. Hong andK. Yasumoto, “Near-infrared spectroscopic analysisof heme and nonheme iron in raw meats,” Journal of FoodComposition and Analysis, vol. 9, no. 2, pp. 127–134, 1996.

32 International Journal of Spectroscopy
[140] N. Prieto, S. Andres, F. J. Giraldez, A. R. Mantecon, and P.Lavın, “Potential use of near infrared reflectance spectroscopy(NIRS) for the estimation of chemical composition of oxenmeatsamples,” Meat Science, vol. 74, no. 3, pp. 487–496, 2006.
[141] D. Perez-Marın, E. De Pedro Sanz, J. E. Guerrero-Ginel, and A.Garrido-Varo, “A feasibility study on the use of near-infraredspectroscopy for prediction of the fatty acid profile in liveIberian pigs and carcasses,”Meat Science, vol. 83, no. 4, pp. 627–633, 2009.
[142] E. De Pedro, N. Nunez, J. Garcıa et al., “Implementing nearinfrared spectroscopy in the Iberian pig industry,” OPtionsMediterraneennes, Series A, no. 76, pp. 225–227, 2007.
[143] J. Garcıa-Olmo, A. Garrido, and E. De Pedro, “Methodologicalaspects on near infrared analysis of Iberian pig fat usinginteractance-reflectance fiber optic mode,” Journal of NearInfrared Spectroscopy, vol. 6, no. 1–4, pp. A307–A312, 1998.
[144] I. Gonzalez-Martın, C. Gonzalez-Perez, J. Hernandez-Mendez,and N. Alvarez-Garcıa, “Determination of fatty acids in thesubcutaneous fat of Iberian breed swine by near infraredspectroscopy (NIRS)with a fibre-optic probe,”Meat Science, vol.65, no. 2, pp. 713–719, 2003.
[145] H. J. Swatland,On-Line Evaluation ofMeat, Technomic Publish-ing, Lancaster, UK, 1995.
[146] D. Cozzolino, I. Murray, J. R. Scaife, and R. Paterson, “Study ofdissected lamb muscles by visible and near infrared reflectancespectroscopy for composition assessment,” Animal Science, vol.70, no. 3, pp. 417–423, 2000.
[147] R. A. Lawri, Meat Science, Pergamon Press, Oxford, UK, 1985.[148] M. Mitsumoto, S. Maeda, T. Mitsuhashi, and S. Ozawa, “Near-
infrared spectroscopy determination of physical and chemicalcharacteristics in beef cuts,” Journal of Food Science, vol. 56, no.6, pp. 1493–1496, 1991.
[149] D. T.Delpy andM.Cope, “Quantification in tissue near-infraredspectroscopy,” Philosophical Transactions of the Royal Society B,vol. 352, no. 1354, pp. 649–659, 1997.
[150] D. Cozzolino and I. Murray, “Effect of sample presentation andanimal muscle species on the analysis of meat by near infraredreflectance spectroscopy,” Journal of Near Infrared Spectroscopy,vol. 10, no. 1, pp. 37–44, 2002.
[151] I. Murray, “The NIR spectra of homologous series of organiccompounds,” in Proceedings of the International NIR/NIT Con-ference, Budapest, Hungary, 1986.
[152] G. Downey, J. McElhinney, and T. Fearn, “Species identificationin selected raw homogenizedmeats by reflectance spectroscopyin the mid-infrared, near-infrared, and visible ranges,” AppliedSpectroscopy, vol. 54, no. 6, pp. 894–899, 2000.
[153] D. Lomiwes, M. M. Reis, E. Wiklund, O. A. Young, and M.North, “Near infrared spectroscopy as an on-line method toquantitatively determine glycogen and predict ultimate pH inpre rigor bovineM. longissimus dorsi,”Meat Science, vol. 86, no.4, pp. 999–1004, 2010.
[154] N. Prieto, S. Andres, F. J. Giraldez, A. R. Mantecon, and P.Lavın, “Discrimination of adult steers (oxen) and young cattleground meat samples by near infrared reflectance spectroscopy(NIRS),” Meat Science, vol. 79, no. 1, pp. 198–201, 2008.
[155] J. W. S. Yancey, J. K. Apple, J. F. Meullenet, and J. T. Sawyer,“Consumer responses for tenderness and overall impressioncan be predicted by visible and near-infrared spectroscopy,Meullenet-Owens razor shear, and Warner-Bratzler shearforce,” Meat Science, vol. 85, no. 3, pp. 487–492, 2010.
[156] B. Park, Y. R. Chen, W. R. Hruschka, S. D. Shackelford, and M.Koohmaraie, “Near-infrared reflectance analysis for predictingbeef longissimus tenderness,” Journal of Animal Science, vol. 76,no. 8, pp. 2115–2120, 1998.
[157] R. Rødbotten, Prediction of beef tenderness by NIR spectroscopy,and examination of the influence of ante- and post-mortemfactors on tenderness [Ph.D. thesis], Agricultural University ofNorway, Bergen, Norway, 2001.
[158] C. Venel, A. M. Mullen, G. Downey, and Troy, “Prediction oftenderness and other quality attributes of beef by near infraredreflectance spectroscopy between 750 and 1100 nm; furtherstudies,” Journal of Near Infrared Spectroscopy, vol. 9, no. 3, pp.185–198, 2001.
[159] N. Prieto, D. W. Ross, E. A. Navajas et al., “On-line applicationof visible and near infrared reflectance spectroscopy to predictchemical-physical and sensory characteristics of beef quality,”Meat Science, vol. 83, no. 1, pp. 96–103, 2009.
[160] G. H. Geesink, F. H. Schreutelkamp, R. Frankhuizen et al., “Pre-diction of pork quality attributes from near infrared reflectancespectra,” Meat Science, vol. 65, no. 1, pp. 661–668, 2003.
[161] R. J. Winger and C. J. Hagyard, “Juiciness—its importanceand some contributing factors,” in Quality Attributes and TheirMeasurement inMeat, Poultry and Fish Products, A. M. Pearsonand T. R. Dutson, Eds., vol. 9 of Advances in Meat Research,chapter 4, pp. 94–124, Aspen Publisher, Frederick, Md, USA,1994.
[162] K. I. Hildrum, B. N. Nilsen, M. Mielnik, and T. Næs, “Pre-diction of sensory characteristics of beef by near-infraredspectroscopy,” Meat Science, vol. 38, no. 1, pp. 67–80, 1994.
[163] K. I. Hildrum, T. Isaksson, T. T. Naes, B. N. Nilsen, M.Rodbotten, and P. Lea, “Near infrared reflectance spectroscopyin the prediction of sensory properties of beef,” Journal of NearInfrared Spectroscopy, vol. 3, no. 2, pp. 81–87, 1995.
[164] T. Næs and K. I. Hildrum, “Comparison of multivariate calibra-tion and discriminant analysis in evaluating NIR spectroscopyfor determination of meat tenderness,” Applied Spectroscopy,vol. 51, no. 3, pp. 350–357, 1997.
[165] S. D. Shackelford, T. L. Wheeler, and M. Koohmaraie, “Devel-opment of optimal protocol for visible and near-infraredreflectance spectroscopic evaluation of meat quality,” MeatScience, vol. 68, no. 3, pp. 371–381, 2004.
[166] D. Cozzolino, I. Murray, and R. Paterson, “Visible and nearinfrared reflectance spectroscopy for the determination ofmoisture, fat and protein in chicken breast and thigh muscle,”Journal of Near Infrared Spectroscopy, vol. 4, no. 1–4, pp. 213–223, 1996.
[167] D. Cozzolino, D. De Mattos, and D. Vaz Martins, “Visible/nearinfrared reflectance spectroscopy for predicting compositionand tracing system of production of beef muscle,” AnimalScience, vol. 74, no. 3, pp. 477–484, 2002.
[168] P. H.M. Dian, D. Andueza, M. Jestin, I. N. Prado, and S. Prache,“Comparison of visible and near infrared reflectance spec-troscopy to discriminate between pasture-fed and concentrate-fed lamb carcasses,” Meat Science, vol. 80, no. 4, pp. 1157–1164,2008.
[169] P. H. M. Dian, D. Andueza, C. M. P. Barbosa, S. Amoureux,M. Jestin, and P. C. F. Carvalho, “Methodological developmentsin the use of visible reflectance spectroscopy for discriminatingpasture-fed from concentrate-fed lamb carcasses,” Animal, vol.1, no. 8, pp. 1198–1208, 2007.
[170] D. Cozzolino and I. Murray, “Identification of animal meatmuscles by visible and near infrared reflectance spectroscopy,”

International Journal of Spectroscopy 33
Lebensmittel-Wissenschaft und-Technologie, vol. 37, no. 4, pp.447–452, 2004.
[171] H. B. Ding and R. J. Xu, “Differentiation of beef and kangaroomeat by visible/near-infrared reflectance spectroscopy,” Journalof Food Science, vol. 64, no. 5, pp. 814–817, 1999.
[172] M. Prevolnik, M. Candek-Potokar, M. Novic, and D. Skorjanc,“An attempt to predict pork drip loss from pH and colourmeasurements or near infrared spectra using artificial neuralnetworks,” Meat Science, vol. 83, no. 3, pp. 405–411, 2009.
[173] G. Downey and D. Beauchene, “Discrimination between freshand frozen-then-thawed beefm. longissimus dorsi by combinedvisible-near infrared reflectance spectroscopy: a feasibilitystudy,” Meat Science, vol. 45, no. 3, pp. 353–363, 1997.
[174] K. Thyholt and T. Isaksson, “Differentiation of frozen andunfrozen beef using near-infrared spectroscopy,” Journal of theScience of Food and Agriculture, vol. 73, no. 4, pp. 525–532, 1997.
[175] N. S. Hobson, I. Tothill, and A. P. Turner, “Microbial detection,”Biosensors and Bioelectronics, vol. 11, no. 5, pp. 455–477, 1996.
[176] M. Kawasaki, S. Kawamura, H. Nakatsuji, and M. Natsuga,“Online real-time monitoring of milk quality during milkingby near infrared spectroscopy,” in ASABEMeeting Presentation,2005.
[177] H. M. Al-Qadiri, M. Lin, M. A. Al-Holy, A. G. Cavinato, andB. A. Rasco, “Monitoring quality loss of pasteurized skim milkusing visible and short wavelength near-infrared spectroscopyand multivariate analysis,” Journal of Dairy Science, vol. 91, no.3, pp. 950–958, 2008.
[178] R. Karoui and J. De Baerdemaeker, “A review of the analyticalmethods coupledwith chemometric tools for the determinationof the quality and identity of dairy products,” Food Chemistry,vol. 102, no. 3, pp. 621–640, 2007.
[179] M. Laporte and P. Paquin, “Near-infrared analysis of fat,protein, and casein in cow’s milk,” Journal of Agricultural andFood Chemistry, vol. 47, no. 7, pp. 2600–2605, 1999.
[180] S. Sasic and Y. Ozaki, “Short-wave near-infrared spectroscopyof biological fluids. 1. Quantitative analysis of fat, protein, andlactose in raw milk by partial least-squares regression and bandassignment,”Analytical Chemistry, vol. 73, no. 1, pp. 64–71, 2001.
[181] T. Sato, S. Kawano, and M. Iwamoto, “Detection of foreign fatadulteration of milk by near infrared spectroscopic method,”Journal of Dairy Science, vol. 73, no. 12, pp. 3408–3413, 1990.
[182] Y. R. Chen, R. W. Huffman, B. Park, and M. Nguyen, “Trans-portable spectrophotometer system for on-line classification ofpoultry carcasses,” Applied Spectroscopy, vol. 50, no. 7, pp. 910–916, 1996.
[183] H. Chen and B. P. Marks, “Evaluating previous thermal treat-ment of chicken patties by visible/near-infrared spectroscopy,”Journal of Food Science, vol. 62, no. 4, pp. 753–780, 1997.
[184] H. Chen and B. P. Marks, “Visible/near-infrared spectroscopyfor physical characteristics of cooked chicken patties,” Journalof Food Science, vol. 63, no. 2, pp. 279–282, 1998.
[185] Y. R. Chen, B. Park, R. W. Huffman, and M. Nguyen, “Classifi-cation of on-line poultry carcasses with backpropagation neuralnetworks,” Journal of Food Process Engineering, vol. 21, no. 1, pp.33–48, 1998.
[186] J. McElhinney, G. Downey, and T. Fearn, “Chemometric pro-cessing of visible and near infrared reflectance spectra forspecies identification in selected raw homogenised meats,”Journal of Near Infrared Spectroscopy, vol. 7, no. 3, pp. 145–154,1999.
[187] H. Rannou and G. Downey, “Discrimination of raw pork,chicken and turkey meat by spectroscopy in the visible, near-and mid-infrared ranges,” Analytical Communications, vol. 34,no. 12, pp. 401–404, 1997.
[188] B. Park, S. Yoon, W. R. Windham, K. C. Lawrence, M. S. Kim,and K. Chao, “Line-scan hyperspectral imaging for real-timein-line poultry fecal detection,” Sensing and Instrumentation forFood Quality and Safety, vol. 5, no. 1, pp. 25–32, 2011.
[189] H. Ding, R.-J. Xu, and D. K. O. Chan, “Identification ofbroiler chickenmeat using a visible/near-infrared spectroscopictechnique,” Journal of the Science of Food and Agriculture, vol.79, no. 11, pp. 1382–1388, 1999.
[190] M. Lin, M. Al-Holy, M. Mousavi-Hesary, H. Al-Qadiri, A. G.Cavinato, and B. A. Rasco, “Rapid and quantitative detectionof the microbial spoilage in chicken meat by diffuse reflectancespectroscopy (600-1100 nm),” Letters in Applied Microbiology,vol. 39, no. 2, pp. 148–155, 2004.
[191] Y. Liu and Y. Chen, “Two-dimensional correlation spectroscopystudy of visible and near-infrared spectral variations of chickenmeats in cold storage,” Applied Spectroscopy, vol. 54, no. 10, pp.1458–1470, 2000.
[192] Y. Liu, F. E. Barton II, B. G. Lyon, W. R. Windham, and C.E. Lyon, “Two-dimensional correlation analysis of visible/near-infrared spectral intensity variations of chicken breasts withvarious chilled and frozen storages,” Journal of Agricultural andFood Chemistry, vol. 52, no. 3, pp. 505–510, 2004.
[193] Y. Liu, Y. Chen, and Y. Ozaki, “Two-dimensional visible/near-infrared correlation spectroscopy study of thermal treatment ofchicken meats,” Journal of Agricultural and Food Chemistry, vol.48, no. 3, pp. 901–908, 2000.
[194] S. K. Stormo, A. H. Sivertsen, K. Heia, and D. Skipnes,“Endpoint temperature of heat-treated surimi can be measuredby visible spectroscopy,” Food Control, vol. 26, no. 1, pp. 92–97,2012.
[195] S.H.Olsen,Quantification and characterisation of residual bloodin fish muscle—impact of slaughtering methods [Ph.D. thesis],University of Tromsø UIT, Tromsø, Norway, 2011.
[196] S. H. Olsen, N. K. Sørensen, R. Larsen, E. O. Elvevoll, and H.Nilsen, “Impact of pre-slaughter stress on residual blood in filletportions of farmed Atlantic cod (Gadus morhua)—measuredchemically and by Visible and Near-infrared spectroscopy,”Aquaculture, vol. 284, no. 1–4, pp. 90–97, 2008.
[197] D. Cozzolino, A. Chree, J. R. Scaife, and I. Murray, “Usefulnessof Near-infrared reflectance (NIR) spectroscopy and chemo-metrics to discriminate fishmeal batches made with differentfish species,” Journal of Agricultural and Food Chemistry, vol. 53,no. 11, pp. 4459–4463, 2005.
[198] M. Uddin, E. Okazaki, S. Turza, Y. Yumiko, M. Tanaka,and Y. Fukuda, “Non-destructive visible/NIR spectroscopy fordifferentiation of fresh and frozen-thawed fish,” Journal of FoodScience, vol. 70, no. 8, pp. C506–C510, 2005.
[199] N. Bøknaes, K. N. Jensen, C. M. Andersen, and H. Martens,“Freshness assessment of thawed and chilled cod fillets packedin modified atmosphere using near-infrared spectroscopy,”Lebensmittel-Wissenschaft und-Technologie, vol. 35, no. 7, pp.628–634, 2002.
[200] H. Nilsen, M. Esaiassen, K. Heia, and F. Sigernes, “Visible/near-infrared spectroscopy: a new tool for the evaluation of fishfreshness?” Journal of Food Science, vol. 67, no. 5, pp. 1821–1826,2002.

34 International Journal of Spectroscopy
[201] G. Olafsdottir, P. Nesvadba, C. Di Natale et al., “Multisensorfor fish quality determination,” Trends in Food Science andTechnology, vol. 15, no. 2, pp. 86–93, 2004.
[202] M. Lin, M. Mousavi, M. Al-Holy, A. G. Cavinato, and B.A. Rasco, “Rapid near infrared spectroscopic method for thedetection of spoilage in rainbow trout (Oncorhynchus mykiss)fillet,” Journal of Food Science, vol. 71, no. 1, pp. S18–S23, 2006.
[203] H. Zhang and T. Lee, “Rapid near-infrared spectroscopicmethod for the determination of free fatty acid in fish and itsapplication in fish quality assessment,” Journal of Agriculturaland Food Chemistry, vol. 45, no. 9, pp. 3515–3521, 1997.
[204] B. Gjerde and H. Martens, “Predicting carcass compositionof rainbow trout by near-infrared reflectance spectroscopy,”Journal of Animal Breeding and Genetics, vol. 104, pp. 137–148,1987.
[205] J. Shimamoto, K. Hasegawa, S. Hattori, Y. Hattori, and T.Mizuno, “Non-destructive determination of the fat content inglazed bigeye tuna by portable near infrared spectrophotome-ter,” Fisheries Science, vol. 69, no. 6, pp. 1247–1256, 2003.
[206] J. Shimamoto, K. Hasegawa, K. Ide, and S. Kawano, “Nonde-stractive determination of the fat content in raw and frozenhorse mackerel by near infrared spectroscopy,” Nippon SuisanGakkaishi, vol. 67, no. 4, pp. 717–722, 2001.
[207] S. Yamauchi, T. Sawada, and S. Kawano, “Nondestructivedetermination of fat content in frozen skipjack by near infrared(NIR) spectroscopy with fiber optics in interactance mode,”Nippon Suisan Gakkaishi, vol. 65, no. 4, pp. 747–752, 1999.
[208] J. Shimamoto, S. Hiratsuka, K. Hasegawa, M. Sato, and S.Kawano, “Rapid non-destructive determination of fat contentin frozen skipjack using a portable near infrared spectropho-tometer,” Fisheries Science, vol. 69, no. 4, pp. 856–860, 2003.
[209] J. A. Mathias, P. C. Williams, and D. C. Sobering, “Thedetermination of lipid and protein in freshwater fish using near-infrared reflectance spectroscopy,” Aquaculture, vol. 61, no. 3-4,pp. 303–311, 1987.
[210] M. H. Lee, A. G. Cavinato, D. M.Mayes, and B. A. Rasco, “Non-invasive short-wavelength near-infrared spectroscopic methodto estimate the crude lipid content in the muscle of intactrainbow trout,” Journal of Agricultural and Food Chemistry, vol.40, no. 11, pp. 2176–2180, 1992.
[211] M. Lin, A. G. Cavinato, D. M. Mayes et al., “Bruise detectionin Pacific pink salmon (Oncorhynchus gorbuscha) by visible andshort-wavelength near-infrared (SW-NIR) spectroscopy (600-1100 nm),” Journal of Agricultural and Food Chemistry, vol. 51,no. 22, pp. 6404–6408, 2003.
[212] R. Font, M. Del Rıo-Celestino, D. Velez, A. De Haro-Bailon,and R. Montoro, “Visible and near-infrared spectroscopy as atechnique for screening the inorganic arsenic content in the redcrayfish (Procambarus clarkii Girard),” Analytical Chemistry,vol. 76, no. 14, pp. 3893–3898, 2004.
[213] J. Gayo and S. A. Hale, “Detection and quantification of speciesauthenticity and adulteration in crabmeat using visible andnear-infrared spectroscopy,” Journal of Agricultural and FoodChemistry, vol. 55, no. 3, pp. 585–592, 2007.
[214] J. Gayo, S. A. Hale, and S. M. Blanchard, “Quantitative analysisand detection of adulteration in crab meat using visible andnear-infrared spectroscopy,” Journal of Agricultural and FoodChemistry, vol. 54, no. 4, pp. 1130–1136, 2006.
[215] M. R. Brown, “Rapid compositional analysis of oysters usingvisible-near infrared reflectance spectroscopy,” Aquaculture,vol. 317, no. 1–4, pp. 233–239, 2011.
[216] V. Lebot, A. Champagne, R. Malapa, and D. Shiley, “NIRdetermination of major constituents in tropical root and tubercrop flours,” Journal of Agricultural and Food Chemistry, vol. 57,no. 22, pp. 10539–10547, 2009.
[217] A. Dacal-Nieto, A. Formella, P. Carrion, E. Vazquez-Fernandez,and M. Fernandez-Delgado, “Non-destructive detection ofhollow heart in potatoes using hyperspectral imaging,” inComputer Analysis of Images and Patterns: 14th InternationalConference (CAIP ’11), P. Real, D. Dıaz-Pernil, H. Molina-Abril,A. Berciano, and W. Kropatsch, Eds., vol. 6855 of Lecture Notesin Computer Science, pp. 180–187.
[218] E. Joubert, M. Manley, and M. Botha, “Use of NIRS forquantification of mangiferin and hesperidin contents of driedgreen honeybush (Cyclopia genistoides) plant material,” Journalof Agricultural and Food Chemistry, vol. 54, no. 15, pp. 5279–5283, 2006.
[219] S. Bellato, V. Del Frate, R. Redaelli et al., “Use of near infraredreflectance and transmittance coupled to robust calibration forthe evaluation of nutritional value in naked oats,” Journal ofAgricultural and Food Chemistry, vol. 59, no. 9, pp. 4349–4360,2011.
[220] L. R. Schimleck, J. C. Doran, and A. Rimbawanto, “Nearinfrared spectroscopy for cost effective screening of foliar oilcharacteristics in a Melaleuca cajuputi breeding population,”Journal of Agricultural and Food Chemistry, vol. 51, no. 9, pp.2433–2437, 2003.
[221] E. Joubert, M. Manley, B. R. Gray, and H. Schulz, “Rapid mea-surement and evaluation of the effect of drying conditions onharpagoside content in Harpagophytum procumbens (devil’sclaw) root,” Journal of Agricultural and Food Chemistry, vol. 53,no. 9, pp. 3493–3502, 2005.
[222] H. Schulz, U. H. Engelhardt, A. Wegent, H. Drews, and S.Lapczynski, “Application of near-infrared reflectance spec-troscopy to the simultaneous prediction of alkaloids and phe-nolic substances in green tea leaves,” Journal of Agricultural andFood Chemistry, vol. 47, no. 12, pp. 5064–5067, 1999.
[223] J. M. Hernandez-Hierro, J. Valverde, S. Villacreces et al., “Feasi-bility study on the use of visible-near-infrared spectroscopy forthe screening of individual and total glucosinolate contents inbroccoli,” Journal of Agricultural and Food Chemistry, vol. 60,no. 30, pp. 7352–7358, 2012.
[224] M. Laasonen, T. Harmia-Pulkkinen, C. L. Simard, E. Michiels,M. Rasanen, and H. Vuorela, “Fast identification of Echinaceapurpurea dried roots using near-infrared spectroscopy,”Analyt-ical Chemistry, vol. 74, no. 11, pp. 2493–2499, 2002.
[225] W. Li, P. Goovaerts, and M. Meurens, “Quantitative analysis ofindividual sugars and acids in orange juices by near-infraredspectroscopy of dry extract,” Journal of Agricultural and FoodChemistry, vol. 44, no. 8, pp. 2252–2259, 1996.
[226] Y. C. Chen, H. Zhang, and R.Matsunaga, “Rapid determinationof the main organic acid composition of raw Japanese apricotfruit juices using near-infrared spectroscopy,” Journal of Agri-cultural and Food Chemistry, vol. 54, no. 26, pp. 9652–9657,2006.
[227] J. M. Gonzalez-Saiz, C. Pizarro, I. Esteban-Dıez et al., “Mon-itoring of alcoholic fermentation of onion juice by NIR spec-troscopy: valorization of worthless onions,” Journal of Agricul-tural and Food Chemistry, vol. 55, no. 8, pp. 2930–2936, 2007.
[228] H. Cen, Y. He, and M. Huang, “Measurement of soluble solidscontents and pH in orange juice using chemometrics andVis−NIRS,” Journal of Agricultural and Food Chemistry, vol. 54,no. 20, pp. 7437–7443, 2006.

International Journal of Spectroscopy 35
[229] F. Liu and Y. He, “Use of visible and near infrared spectroscopyand least squares-support vector machine to determine solublesolids content and pH of cola beverage,” Journal of Agriculturaland Food Chemistry, vol. 55, no. 22, pp. 8883–8888, 2007.
[230] C. L. Ng, R. L. Wehling, and S. L. Cuppett, “Method for deter-mining frying oil degradation by near-infrared spectroscopy,”Journal of Agricultural and Food Chemistry, vol. 55, no. 3, pp.593–597, 2007.
[231] D. Cozzolino, R. G. Dambergs, L. Janik, W. U. Cynkar, andM. Gishen, “Analysis of grapes and wine by near infraredspectroscopy,” Journal of Near Infrared Spectroscopy, vol. 14, no.5, pp. 279–289, 2006.
[232] X. Chen and X. Lei, “Application of a hybrid variable selectionmethod for determination of carbohydrate content in soy milkpowder using visible and near infrared spectroscopy,” Journalof Agricultural and Food Chemistry, vol. 57, no. 2, pp. 334–340,2009.
[233] R. G. Dambergs, A. Kambouris, L. Francis, and M. Gishen,“Rapid analysis of methanol in grape-derived distillation prod-ucts using near-infrared transmission spectroscopy,” Journal ofAgricultural and Food Chemistry, vol. 50, no. 11, pp. 3079–3084,2002.
[234] M.-J. Saiz-Abajo, J.-M. Gonzalez-Saiz, and C. Pizarro, “Classi-fication of wine and alcohol vinegar samples based on near-infrared spectroscopy. Feasibility study on the detection ofadulterated vinegar samples,” Journal of Agricultural and FoodChemistry, vol. 52, no. 25, pp. 7711–7719, 2004.
[235] M. J. Saiz-Abajo, J. M. Gonzalez-Saiz, and C. Pizarro, “Pre-diction of organic acids and other quality parameters of winevinegar by near-infrared spectroscopy. A feasibility study,” FoodChemistry, vol. 99, no. 3, pp. 615–621, 2006.
[236] W. Fan, Y. Shan, G. Li, H. Lv, H. Li, and Y. Liang, “Applica-tion of competitive adaptive reweighted sampling method todetermine effective wavelengths for prediction of total acid ofvinegar,” Food Analytical Methods, vol. 5, no. 3, pp. 585–590,2012.
[237] S. W. Bruun, Protein-lipid-carbohydrate interactions and impor-tance to food quality—spectroscopic detection of macromolecularinteractions [Ph.D. thesis], Technical University of Denmark,Lyngby, Denmark, 2006.
[238] F. Liu, W. Kong, and Y. He, “Quality determination of fruitvinegars using visible/near infrared spectroscopy and leastsquares-support vector machine,” African Journal of Agricul-tural Research, vol. 7, no. 15, pp. 2395–2404, 2012.
[239] D. Cozzolino, H. E. Smyth, and M. Gishen, “Feasibility studyon the use of visible and near-infrared spectroscopy togetherwith chemometrics to discriminate between commercial whitewines of different varietal origins,” Journal of Agricultural andFood Chemistry, vol. 51, no. 26, pp. 7703–7708, 2003.
[240] L. Liu, D. Cozzolino, W. U. Cynkar, M. Gishen, and C. B.Colby, “Geographic classification of Spanish and Australiantempranillo redwines by visible and near-infrared spectroscopycombined with multivariate Analysis,” Journal of Agriculturaland Food Chemistry, vol. 54, no. 18, pp. 6754–6759, 2006.
[241] S. Buratti, D. Ballabio, G. Giovanelli et al., “Monitoring ofalcoholic fermentation using near infrared and mid infraredspectroscopies combined with electronic nose and electronictongue,” Analytica Chimica Acta, vol. 697, no. 1-2, pp. 67–74,2011.
[242] H. Yu, H. Lin, H. Xu, Y. Ying, B. Li, and X. Pan, “Predictionof enological parameters and discrimination of rice wine ageusing least-squares support vector machines and near infrared
spectroscopy,” Journal of Agricultural and Food Chemistry, vol.56, no. 2, pp. 307–313, 2008.
[243] L. L. Vines, S. E. Kays, and P. E. Koehler, “Near-infraredreflectance model for the rapid prediction of total fat in cerealfoods,” Journal of Agricultural and Food Chemistry, vol. 53, no.5, pp. 1550–1555, 2005.
[244] Windham, S. E. Kays, and F. E. Barton II, “Effect of cerealproduct residual moisture content on total dietary fiber deter-mined by near-infrared reflectance spectroscopy,” Journal ofAgricultural and FoodChemistry, vol. 45, no. 1, pp. 140–144, 1997.
[245] S. E. Kays, Windham, and F. E. Barton II, “Prediction of totaldietary fiber in cereal products using near-infrared reflectancespectroscopy,” Journal of Agricultural and Food Chemistry, vol.44, no. 8, pp. 2266–2271, 1996.
[246] S. E. Kays, F. E. Barton II, W. R. Windham, and D. S. Him-melsbach, “Prediction of total dietary fiber by near-infraredreflectance spectroscopy in cereal products containing highsugar and crystalline sugar,” Journal of Agricultural and FoodChemistry, vol. 45, no. 10, pp. 3944–3951, 1997.
[247] S. E. Kays, Windham, and F. E. Barton II, “Prediction oftotal dietary fiber by near-infrared reflectance spectroscopy inhigh-fat- and high-sugar-containing cereal products,” Journalof Agricultural and Food Chemistry, vol. 46, no. 3, pp. 854–861,1998.
[248] S. E. Kays and F. E. Barton II, “Rapid prediction of grossenergy, and utilizable energy in cereal food products using near-infrared reflectance spectroscopy,” Journal of Agricultural andFood Chemistry, vol. 50, no. 5, pp. 1284–1289, 2002.
[249] S. E. Kays and F. E. Barton II, “Near-infrared analysis of solubleand insoluble dietary fiber fractions of cereal food products,”Journal of Agricultural and Food Chemistry, vol. 50, no. 10, pp.3024–3029, 2002.
[250] S. E. Kays and F. E. Barton II, “Energy from fat determined bynear-infrared reflectance spectroscopy,” Journal of Agriculturaland Food Chemistry, vol. 52, no. 6, pp. 1669–1674, 2004.
[251] D. D. Archibald and S. E. Kays, “Determination of total dietaryfiber of intact cereal food products by near-infrared reflectance,”Journal of Agricultural and Food Chemistry, vol. 48, no. 10, pp.4477–4486, 2000.
[252] R. M. Ozanich, M. L. Schrattenholzer, and J. B. Callis, “Nonin-vasive determination of moisture and oil content of wheat-flourcookies—near-infrared spectroscopy in the wavelength range700-1100 nm,” in Biosensor Design and Application, vol. 511 ofACS Symposium Series, chapter 12, pp. 137–164, 1992.
[253] L. F. de Alencar Figueiredo, F. Davrieux, G. Fliedel et al.,“Development of NIRS equations for food grain quality traitsthrough exploitation of a core collection of cultivated sorghum,”Journal of Agricultural and Food Chemistry, vol. 54, no. 22, pp.8501–8509, 2006.
[254] S. W. Bruun, I. Søndergaard, and S. Jacobsen, “Analysis ofprotein structures and interactions in complex food by near-infrared spectroscopy. 1. Gluten powder,” Journal of Agriculturaland Food Chemistry, vol. 55, no. 18, pp. 7234–7243, 2007.
[255] S. W. Bruun, I. Søndergaard, and S. Jacobsen, “Analysis ofprotein structures and interactions in complex food by near-infrared spectroscopy. 2. Hydrated gluten,” Journal of Agricul-tural and Food Chemistry, vol. 55, no. 18, pp. 7244–7251, 2007.
[256] N. Sinelli, E. Casiraghi, and G. Downey, “Studies on proofingof yeasted bread dough using near- and mid-infrared spec-troscopy,” Journal of Agricultural and Food Chemistry, vol. 56,no. 3, pp. 922–931, 2008.

36 International Journal of Spectroscopy
[257] R.M. Garcıa-Rey, J. Garcıa-Olmo, E. De Pedro, R. Quiles-Zafra,andM. D. Luque de Castro, “Prediction of texture and colour ofdry-cured ham by visible and near infrared spectroscopy usinga fiber optic probe,” Meat Science, vol. 70, no. 2, pp. 357–363,2005.
[258] A. Lucas, D. Andueza, E. Rock, and B. Martin, “Predictionof dry matter, fat, pH, vitamins, minerals, carotenoids, totalantioxidant capacity, and color in fresh and freeze-dried cheesesby visible-near-infrared reflectance spectroscopy,” Journal ofAgricultural and Food Chemistry, vol. 56, no. 16, pp. 6801–6808,2008.
[259] E. S. Celik,Determination of aroma compounds and exopolysac-charides formation by lactic acid bacteria isolated from tradi-tional yogurts [M.S. thesis], Izmir Institute of Technology, Izmir,Turkey, 2007.
[260] M. Navratil, C. Cimander, and C. Mandenius, “On-line mul-tisensor monitoring of yogurt and filmjolk fermentations onproduction scale,” Journal of Agricultural and Food Chemistry,vol. 52, no. 3, pp. 415–420, 2004.
[261] G. Cozzi, J. Ferlito, G. Pasini, B. Contiero, and F. Gottardo,“Application of near-infrared spectroscopy as an alternative tochemical and color analysis to discriminate the productionchains of Asiago d’Allevo cheese,” Journal of Agricultural andFood Chemistry, vol. 57, no. 24, pp. 11449–11454, 2009.
[262] J. Blasco, N. Aleixos, J. Gomez, and E. Molto, “Citrus sorting byidentification of the most common defects using multispectralcomputer vision,” Journal of Food Engineering, vol. 83, no. 3, pp.384–393, 2007.
[263] P. M. Mehl, K. Chao, M. Kim, and Y. R. Chen, “Detection ofdefects on selected apple cultivars using hyperspectral andmul-tispectral image analysis,” Applied Engineering in Agriculture,vol. 18, no. 2, pp. 219–226, 2002.
[264] I. S. Arvanitoyannis and M. Van Houwelingen-Koukaliaroglou,“Implementation of chemometrics for quality control andauthentication of meat and meat products,” Critical Reviews inFood Science and Nutrition, vol. 43, no. 2, pp. 173–218, 2003.
[265] T. Woodcock, C. C. Fagan, C. P. O’Donnell, and G. Downey,“Application of near and mid-infrared spectroscopy to deter-mine cheese quality and authenticity,” Food and BioprocessTechnology, vol. 1, no. 2, pp. 117–129, 2008.

Submit your manuscripts athttp://www.hindawi.com
Hindawi Publishing Corporationhttp://www.hindawi.com Volume 2014
Inorganic ChemistryInternational Journal of
Hindawi Publishing Corporation http://www.hindawi.com Volume 2014
International Journal ofPhotoenergy
Hindawi Publishing Corporationhttp://www.hindawi.com Volume 2014
Carbohydrate Chemistry
International Journal of
Hindawi Publishing Corporationhttp://www.hindawi.com Volume 2014
Journal of
Chemistry
Hindawi Publishing Corporationhttp://www.hindawi.com Volume 2014
Advances in
Physical Chemistry
Hindawi Publishing Corporationhttp://www.hindawi.com
Analytical Methods in Chemistry
Journal of
Volume 2014
Bioinorganic Chemistry and ApplicationsHindawi Publishing Corporationhttp://www.hindawi.com Volume 2014
SpectroscopyInternational Journal of
Hindawi Publishing Corporationhttp://www.hindawi.com Volume 2014
The Scientific World JournalHindawi Publishing Corporation http://www.hindawi.com Volume 2014
Medicinal ChemistryInternational Journal of
Hindawi Publishing Corporationhttp://www.hindawi.com Volume 2014
Chromatography Research International
Hindawi Publishing Corporationhttp://www.hindawi.com Volume 2014
Applied ChemistryJournal of
Hindawi Publishing Corporationhttp://www.hindawi.com Volume 2014
Hindawi Publishing Corporationhttp://www.hindawi.com Volume 2014
Theoretical ChemistryJournal of
Hindawi Publishing Corporationhttp://www.hindawi.com Volume 2014
Journal of
Spectroscopy
Analytical ChemistryInternational Journal of
Hindawi Publishing Corporationhttp://www.hindawi.com Volume 2014
Journal of
Hindawi Publishing Corporationhttp://www.hindawi.com Volume 2014
Quantum Chemistry
Hindawi Publishing Corporationhttp://www.hindawi.com Volume 2014
Organic Chemistry International
ElectrochemistryInternational Journal of
Hindawi Publishing Corporation http://www.hindawi.com Volume 2014
Hindawi Publishing Corporationhttp://www.hindawi.com Volume 2014
CatalystsJournal of