review applied gas chromatography coupled to …...journal of chromatography a, 842 (1999) 351–371...
TRANSCRIPT
Journal of Chromatography A, 842 (1999) 351–371
Review
Applied gas chromatography coupled to isotope ratio massspectrometry
*W. Meier-AugensteinDepartment of Anatomy and Physiology, University of Dundee, Small’s Wynd, Dundee DD1 4HN, Scotland, UK
Abstract
Compound-specific isotope analysis (CSIA) by isotope ratio mass spectrometry (IRMS) following on-line combustion (C)of compounds separated by gas chromatography (GC) is a relatively young analytical method. Due to its ability to measureisotope distribution at natural abundance level with great accuracy and high precision, GC–C–IRMS has increasinglybecome the method of choice in authenticity control of foodstuffs and determination of origin in archaeology, geochemistry,and environmental chemistry. In combination with stable isotope labelled compounds, GC–C–IRMS is also used more andmore in biochemical and biomedical application as it offers a reliable and risk-free alternative to the use of radioactivetracers. The literature on these topics is reviewed from the advent of commercial GC–C–IRMS systems in 1990 up to thebeginning of 1998. Demands on sample preparation and quality of GC separation for GC–C–IRMS are discussed also. 1999 Elsevier Science B.V. All rights reserved.
Keywords: Reviews; Food analysis; Mass spectrometry; Isotope analysis; Environmental analysis; Geochemistry; Detection,GC
Contents
1. Introduction ............................................................................................................................................................................ 3522. Principles of IRMS and GC–C–IRMS...................................................................................................................................... 353
2.1. IRMS............................................................................................................................................................................. 3532.2. GC–C–IRMS ................................................................................................................................................................. 353
2.2.1. Sample preparation.............................................................................................................................................. 3552.2.1.1. Derivatization .................................................................................................................................................. 3562.2.2. Isotopic calibration .............................................................................................................................................. 3562.2.3. HRcGC .............................................................................................................................................................. 357
133. High-precision CSIA of C isotopic abundance ........................................................................................................................ 3583.1. GC–C–IRMS at natural abundance level .......................................................................................................................... 358
3.1.1. Authenticity ........................................................................................................................................................ 3593.1.1.1. Flavours and fragrances .................................................................................................................................... 3593.1.1.2. Wine, fruit juice and honey ............................................................................................................................... 3603.1.1.3. Vegetable oils................................................................................................................................................... 361
*Fax: 144 1382 345514.E-mail address: [email protected] (W. Meier-Augenstein)
0021-9673/99/$ – see front matter 1999 Elsevier Science B.V. All rights reserved.PI I : S0021-9673( 98 )01057-7
352 W. Meier-Augenstein / J. Chromatogr. A 842 (1999) 351 –371
3.1.1.4. Drugs .............................................................................................................................................................. 3623.1.2. Origin ................................................................................................................................................................ 3623.1.2.1. Geochemistry ................................................................................................................................................... 3623.1.2.2. Archaeology .................................................................................................................................................... 3633.1.2.3. Environmental chemistry .................................................................................................................................. 363
3.2. Tracer studies ................................................................................................................................................................. 364154. Compound-specific isotope analysis of N isotopic abundance .................................................................................................. 365
5. Hyphenated techniques ............................................................................................................................................................ 3666. Conclusions ............................................................................................................................................................................ 368Acknowledgements ...................................................................................................................................................................... 368References .................................................................................................................................................................................. 368
1. Introduction highly precise compound-specific isotope analysis(CSIA), especially at natural isotopic abundance
During the 14 years that followed the first publi- level. High-precision CSIA at natural abundancecations reporting the coupling of gas chromatography level can provide information on biogenetic relation(GC) to on-line combustion of GC separated com- and origin of a given organic compound. Comparedpounds to yield CO and N for isotope ratio with authentic reference data, subtle differences in2 2
2 13 15 18analysis by a single collector mass spectrometer the isotopic abundance of H, C, N, or O can[1,2], hardly any work was published that made use thus help uncover adulteration of foodstuff or drugof this new technique. Drawing on this work, in abuse in sports to name but a few.1984, Barrie et al. [3] coupled a dual collector mass There is also an increasing interest in the applica-spectrometer to a GC via an on-line combustion tion of high-precision CSIA in tracer studies. Oneinterface, thus permitting continuous recording of area of application is concerned with quantitative(m11) /m isotope ratios by detecting two successive studies of biochemical processes such as assimila-masses at the same time. Their instrument was the tion / incorporation of nutrients, turnover rates offirst genuine GC–combustion interfaced–isotope biologically important molecules, and quantitation ofratio mass spectrometry (GC–C–IRMS) system and protein synthesis. The other area aims to improveproduced isotope ratios that were an order of mag- detection limits of bio-organic molecules by usingnitude more precise than obtained from an optimised labelled precursor compounds at high enrichmentsingle collector instrument. levels.
However, it was not until 1990 that GC–C–IRMS In either case, high-resolution capillary gas chro-instruments became commercially available. Since matography (HRcGC) is a prerequisite for high-then, GC–C–IRMS instrumentation has experienced precision CSIA by on-line IRMS. Peak overlap andseveral advances and its application has increased to peak distortion have a detrimental effect on bothsuch an extent that it ‘‘could almost be considered a accuracy and precision of isotope ratio measure-conventional technique’’ [4]. ments. It is therefore not surprising that scientists
Tom Brenna of Cornell University’s Division of working on high-precision CSIA by on-line IRMSNutritional Sciences, once said ‘‘IRMS is probably invariably employ HRcGC methods.the first form of analytical mass spectrometry’’ (see It is the aim of this article to provide a review overRef. [166]). IRMS is certainly a very sensitive the current spectrum of applied GC–C–IRMS indetector, able to yield highly precise measurements conjunction with the HRcGC aspects involved. Toof isotope ratios with a standard deviation in the illustrate as to why the two are inextricably linked,range of four to six significant figures. When coupled the first section of this review will deal with theto a GC system, it enables the analyst to conduct characteristics of IRMS and GC–C–IRMS.

W. Meier-Augenstein / J. Chromatogr. A 842 (1999) 351 –371 353
2. Principles of IRMS and GC–C–IRMS ferred to the host computer. Here, the peak area foreach isotopomer is integrated quantitatively and thecorresponding ratios are calculated.
2.1. IRMS In both application areas of IRMS (low levelenrichment and natural abundance work), small
In order to understand why HRcGC is quintessen- variations in very small amounts of the heaviertial for high precision CSIA one needs to appreciate isotope are detected in the presence of large amountsexactly how IRMS works. In contrast to so-called of the lighter isotope. The abundance A of thes
organic mass spectrometers (MS) that yield structur- heavier isotope n in a sample s, given in at.%, is2
al information by scanning a mass range (typically defined as:over several hundred amu) for characteristic frag-
A 5 R /(1 1 R ) 3 100 (at.%) (1)s s sment ions, IRMS instruments achieve highly precisemeasurement of isotopic abundance at the expense of where R is the ratio n /n of the two isotopes fors 2 1the flexibility of scanning MS. the sample. The enrichment of an isotope in a sample
For isotope ratio measurement, the analyte must as compared to a standard value (A ) is given instdbe converted into a simple gas, isotopically repre- at.% excess (APE):sentative of the original sample, before entering the
APE 5 A 2 A (2)ion source of an IRMS. Continuous flow isotope s std2 1 15 14 13 12ratio measurements of H/ H, N/ N, C/ C,
Since the small variations of the heavier isotope18 16 34 32O/ O and S/ S are performed on gases of H ,2 habitually measured by IRMS are of the order of13N , CO , CO and SO , respectively, with C2 2 2 0.001–0.05 at.%, the d-notation in units of per milabundance measurements accounting for almost 70%
(‰) has been adopted to report changes in isotopicof all gas isotope ratio analyses made. One also has
abundance as a per mil deviation compared to ato bear in mind that IRMS, in fact, determines the
designated isotopic standard:difference in isotope ratio with great precision andaccuracy rather than the absolute isotope ratio. IRMS d 5 (R /R 2 1) 3 1000 (‰) (3)s s stdmeasurements yield the information of isotopic
where R is the measured isotope ratio for the samplesabundance of the analyte gas relative to the measuredand R is the measured isotope ratio for thestdisotope ratio of a standard or reference gas. This isstandard.done to compensate for mass discriminating effects
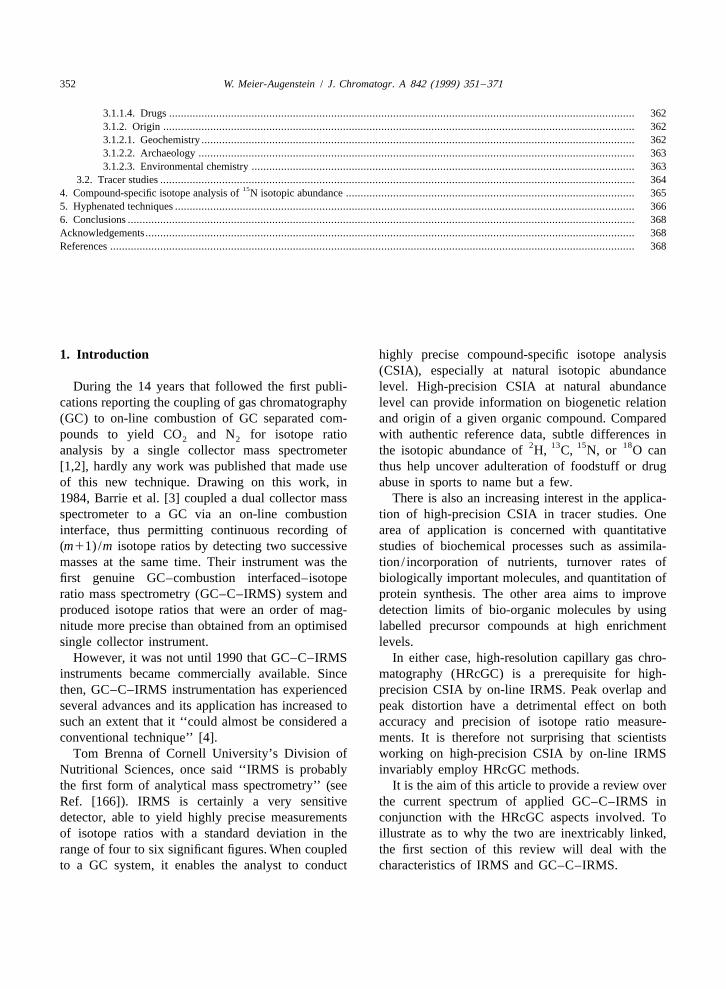
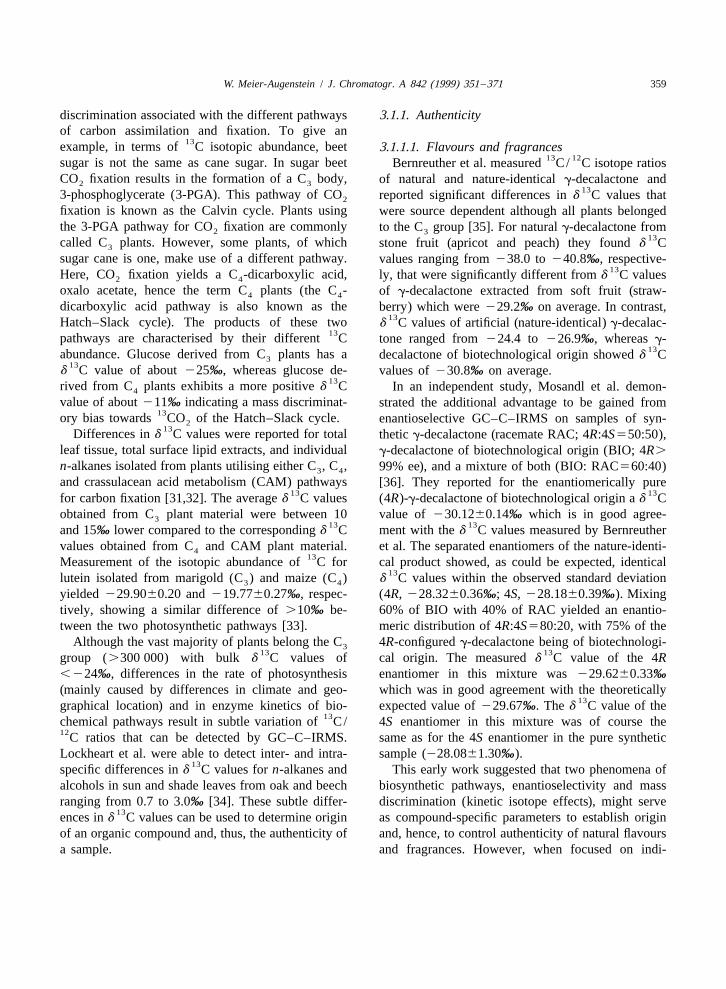
that may fluctuate with time and from instrument toinstrument. In dual-inlet IRMS systems, sample gas 2.2. GC–C–IRMSand standard gas are introduced into two separate gasreservoirs (bellows) and a changeover valve array is From the above it is obvious that a GC cannot beused to toggle bellow effluents between the ion directly coupled to an IRMS. The need for samplesource and a waste line, thus maintaining constant conversion into simple gases has prompted theviscous flow. design of a combustion interface where the GC
To achieve accurate and highly precise measure- effluent is fed into a combustion reactor (Fig. 1).ment of isotope ratios, obviously great care must be This reactor, either a quartz glass or ceramic tube, istaken to ensure that no part of the analyte data is filled with CuO/Pt or CuO/NiO/Pt and maintainedlost. In the case of CO , the data comprise three ion at a temperature of approximately 820 or 9408C,2
12 16 13 16traces for the different isotopomers C O , C O respectively [5,6]. The influence of combustion tube2 212 18 16and C O O with their corresponding masses at packing on analytical performance of GC–C–IRMS
m /z 44, 45 and 46, respectively. The three ion beams has been reported by Eakin et al. [7]. To removeare registered simultaneously by a multiple Faraday water vapour generated during combustion, a watercup (FC) arrangement with a dedicated FC for each trap is required. Most instrument manufacturersisotopomer. The resulting ion currents are continu- employ a Nafion tube for this purpose. Nafion is aously monitored, subsequently digitised and trans- fluorinated polymer that acts as a semi-permeable
354 W. Meier-Augenstein / J. Chromatogr. A 842 (1999) 351 –371
13 12Fig. 1. Set-up of an isotope ratio mass spectrometer coupled to a gas chromatograph via a combustion interface to measure C/ C (carbon15 14mode) or N/ N ratios (nitrogen mode). This schematic shows the reference gas set-up used for automated internal isotopic calibration
[24].
membrane through which water passes freely while fore, loss of peak data due to unsuitably set timeall the other combustion products are retained in the windows for peak detection and, hence, partial peakcarrier gas stream. Quantitative water removal prior integration will severely compromise the quality ofto admitting the combustion gases into the ion source the isotope ratio measurement by GC–C–IRMS, asis essential because any water residue would lead to will traces of peak data from another sample com-
1protonation of CO to produce HCO , which inter- pound due to close proximity resulting in peak2 213feres with analysis of CO (isobaric interference). overlap with the sample peak to be analysed. Due to2
Very recently, a detailed study of this effect has been the fact that isotope ratios cannot be determinedreported by Lecktrone and Hayes [8]. accurately from the partial examination of a GC
In dual-inlet systems, the analyte gas comes from peak, HRcGC resulting in true baseline separationa reservoir and only travels a short distance prior to for adjacent peaks is of paramount importance forentering the ion source. For this reason, the gas high-precision CSIA.pulses result in rectangularly shaped signals. In It should be noted, that the chromatographiccontrast, in continuous flow IRMS (CF–IRMS) isotope effect is not caused by a vapour pressuresystems used for gas isotope analysis on-line gas effect but is the result of different solute / stationarypurification steps and overall interface length lead to phase interactions that are dominated by Van derGaussian-shaped signals. This is evidently even more Waals dispersion forces leading to an earlier elutionpronounced in GC–C–IRMS systems, where analyte of the heavier isotopomer [11]. This difference inpeaks eluting from the GC column are fed into an chromatographic solute / stationary phase interactionon-line microchemical reactor to produce, e.g., CO is caused by lower molar volumes of the labelled,2
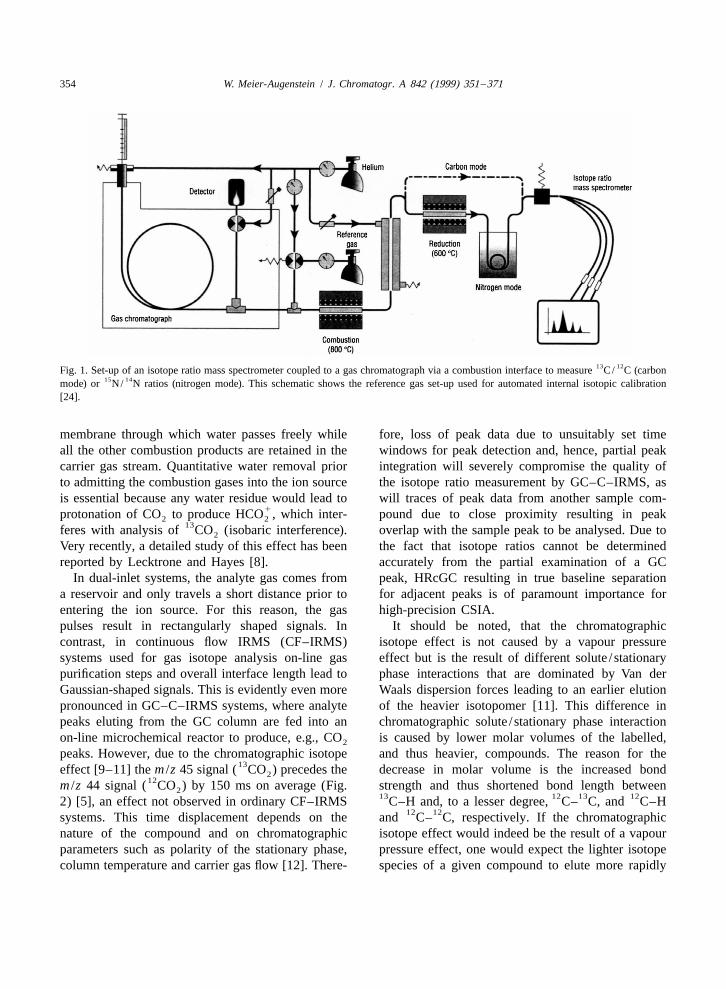
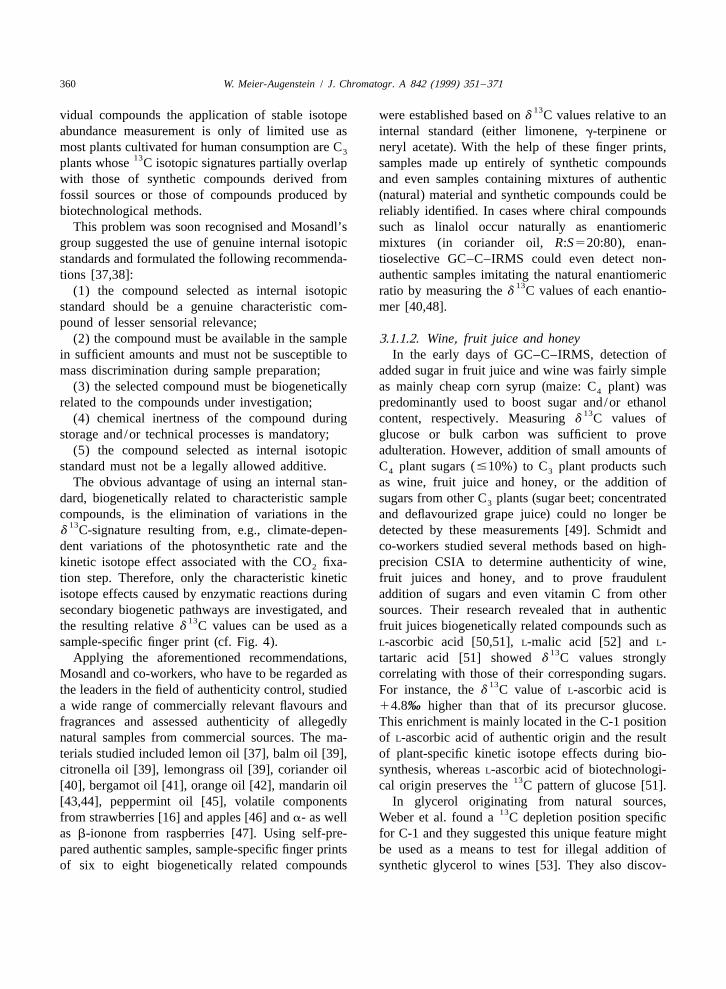
peaks. However, due to the chromatographic isotope and thus heavier, compounds. The reason for the13effect [9–11] the m /z 45 signal ( CO ) precedes the decrease in molar volume is the increased bond2
12m /z 44 signal ( CO ) by 150 ms on average (Fig. strength and thus shortened bond length between213 12 13 122) [5], an effect not observed in ordinary CF–IRMS C–H and, to a lesser degree, C– C, and C–H
12 12systems. This time displacement depends on the and C– C, respectively. If the chromatographicnature of the compound and on chromatographic isotope effect would indeed be the result of a vapourparameters such as polarity of the stationary phase, pressure effect, one would expect the lighter isotopecolumn temperature and carrier gas flow [12]. There- species of a given compound to elute more rapidly

W. Meier-Augenstein / J. Chromatogr. A 842 (1999) 351 –371 355
standard) using combinations of exponentially modi-fied Gaussian (E) and Harhoff /Van-der-Linde (H )functions and were tested on up to 70% valley peakoverlap. When the adjacent peaks were of equalabundance (leading peak:trailing peak, 1:1) combina-tions of HE and HH appeared to provide the bestrecovery of isotope ratios. In the case of unequalabundance in favour of the leading peak (10:1), theHH combination gave the best accuracy. When theabundance was reversed (1:10), the EH combinationprovided the best accuracy but only for peak overlapup to 40% valley. Despite these encouraging results,curve-fitting algorithms for restoring lost accuracyhave not been incorporated into any commercialIRMS data reduction software by IRMS manufactur-ers. It could be argued that the potential of curve-fitting algorithms was only demonstrated on twocompounds, methyl tridecanoate and butylated hy-droxytoluene, which were of almost identical carbonisotope ratios and that any curve-fitting softwareshould also be able to extract accurate and preciseisotope ratios of two overlapping compound peakswith different carbon isotope ratios. However, anyprogress in this direction needs to be aided by fullevaluation of new algorithms for routine use (under‘real life conditions’), thus requiring wide useraccess to such algorithms which in turn depends onthe support from IRMS manufacturers.
13Fig. 2. Illustration of the time displacement between CO and212CO that causes the S-shaped 45/44 ratio signal [5]. From Ref.2 2.2.1. Sample preparation[5], Intercept 1990.
To achieve high-precision CSIA by GC–C–IRMSthe following points must be considered:
from the column because of its higher vapour (1) Every step of the sample preparation protocolpressure and, hence, lower boiling point as compared (collection, work up, derivatization) must be scrutin-to the heavier isotope species. ised for potential mass discriminatory effects to
Although baseline separated peaks should be the avoid isotopic fractionation of the target compounds.ultimate goal in GC–C–IRMS, there is many an (2) If the potential of isotopic fractionation cannotapplication where overlapping peaks simply cannot be ruled out conclusively, an internal standard, of abe avoided. In addition, CO and N disperse more similar chemical nature (but not requiring derivatiza-2 2
freely within the carrier gas stream than their parent tion) and of known isotopic composition, should beorganic compounds resulting in overlapping CO added to the sample prior to sample preparation.2
peaks for barely baseline resolved GC peaks. To (3) Signal size and isotopic composition of theextract the valuable information obscured by such standard(s) must match those of the analyte(s) [15].peak overlaps, Goodman and Brenna [13,14] sug- (4) The potential of all GC parameters (polarity ofgested software algorithms for improved data pro- stationary phase, carrier gas management, tempera-cessing. These algorithms were based on curve ture programme) and techniques should be exploitedfitting rather than the summation (the industrial to their fullest to achieve HRcGC.

356 W. Meier-Augenstein / J. Chromatogr. A 842 (1999) 351 –371
2.2.1.1. Derivatization 2.2.2. Isotopic calibrationDespite their importance for high-precision CSIA, For reasons mentioned before, it is not possible in
dedicated studies addressing issues of sample prepa- GC–C–IRMS to calibrate target compounds againstration are few and far between. Schumacher et al. a standard of known isotopic composition, intro-compared different sample preparation methods for ducing the standard in exactly the same way as theisotopic analysis of volatile organic compounds analyte. There are only three feasible means of(VOCs) from strawberries [16]. Khalfallah et al. introducing a standard: (a) addition of reference
13reported a correction method to compensate for C compounds to the sample, (b) introduction of refer-tracer dilution by carbon added during derivatization ence gas pulses to the carrier gas stream, or (c)[17], and a carbon balance equation was described introduction of reference gas pulses directly into the
13by Demmelmair and Schmidt to calculate d C ion source.13values of free amino acids from d C values of their Caimi et al. comprehensively listed all the desir-
derivatives at natural abundance level [18]. Kinetic able properties internal reference compounds shouldisotope effects associated with derivatization re- possess: (1) high chemical stability; (2) convenientlyactions and resulting theoretical considerations for available in high purity; (3) readily soluble in high-
13calculating d C values have been discussed by purity solvents; (4) low vapour pressure at roomRieley [19]. temperature and atmospheric pressure; (5) environ-
Of course, one way of avoiding the problems with mentally rare; (6) ideally useful for GC and liquidderivatization is not to derivatize the sample at all. chromatography (LC) techniques; and (7) sufficient-This approach involves the use of moderately polar ly different chromatographic characteristics to avoidto polar stationary phases and high-temperature GC. partial or complete co-elution with sample analytesHowever, not all polar compounds are amenable to [21].these techniques (e.g., amino acids) and high-tem- The results of an extensive study into methods ofperature capability of polar stationary phases is isotopic calibration by Merritt et al. emphasisedlimited even when oxygen free helium is used as these demands [22]. Comparing the use of internalcarrier gas. reference compounds with the introduction of refer-
13In addition to changes in C isotopic signature by ence gas pulses directly in the ion source of thederivatization, its effects on GC separation and IRMS, Merritt et al. found an offset of .2‰sample conversion into CO and N have to be between the two methods in the case of incomplete2 2
considered. Derivatization by silylation might combustion and other systematic errors affectinghamper GC separation as the apolar nature of only the analytes. These systematic errors affectedtrimethylsilyl (TMS) and tert.-butyldimethylsilyl both the analytes and the co-injected reference(tBDMS) derivatives can obscure compound charac- compounds but were not reflected by the externalteristics that could otherwise be chromatographically reference gas pulses. Similar observations were madeexploited. Furthermore, an excessive carbon load by other groups interested in isotopic calibrationintroduced by derivatization might result in incom- [12,21,23]. In the absence of such systematic errors,plete combustion thus compromising accurate iso- Merritt et al. found that both methods of isotopictopic analysis. For reasons of non-quantitative sam- calibration gave consistent results as long as multipleple conversion, the use of trifluoroacetates (TFA) or reference peaks were used to permit drift correction.heptafluorobutyrates (HFB) is not advisable as Only one reference peak for isotopic calibration,fluorine forms extremely stable fluorides with Cu and albeit from an internal reference compound, is notNi, thus irreversibly reducing combustion efficacy of enough to compensate for the influence of GCthe CuO/NiO system. In addition, fluorine poisons parameters, such as analyte / stationary phase inter-the combustion catalyst platinum. Experiments with action, column temperature on measured isotopeN-TFA, O-propylates of alanine and leucine have ratios [12].shown that only 50% of the expected CO yield was Within the GC–C–IRMS system, seven potential2
produced [20]. sources for mass discrimination and, hence, sys-
W. Meier-Augenstein / J. Chromatogr. A 842 (1999) 351 –371 357
tematic errors can be identified: (1) isotopic frac- column length (the longer the column, the slower thetionation during sample injection (which can be temperature rise per minute; cf. Table 1) [25].overcome by on-column or time programmed split- Further to these principles, HRcGC techniquesless injection); (2) chromatographic isotope effect; such as multi-dimensional capillary GC (MDcGC),(3) chromatographic peak distortion (leading and enantio-selective GC, porous layer open tubulartrailing peak tail); (4) combustion process; (5) peak (PLOT) column GC for analysis of VOCs and high-distortion of N /CO gas peak during passage of the temperature capillary GC (HTcGC) are powerful2 2
combustion interface; (6) changing flow conditions tools for high-precision CSIA when used in combi-at the open split prior to the IRMS; and (7) the nation with GC–C–IRMS. Nitz et al. were the firstIRMS itself. Obviously, the external reference gas to report the advantages of using MDcGC in GC–C–pulses only compensate for item (7), whereas inter- IRMS [26]. MDcGC is now, often in combinationnal reference compounds reflect all of the afore- with enantioselective GC, almost exclusively used inmentioned. Recently, a method for isotopic cali- authenticity control of flavours and fragrances bybration was reported that, provided a combustible CSIA [27,28]. In a similar fashion, HTcGC isgas was used, could reflect the systematic errors strongly associated with CSIA of steroids and long-caused by items (4–7) [24]. This method combines chain fatty acids (e.g., Ref. [29]).the convenience and practicability of external refer- Regrettably, the achievements of HRcGC in termsence gas calibration with the advantage of reflecting of well-defined peak shape and baseline separationthe majority of physical influences to which analytes are likely to be impaired during combustion and theare subjected in a GC–C–IRMS system. subsequent passage through the interface. Changes in
tubing diameter and frequent use of unions toconnect the various parts of tubing lead to a loss in
2.2.3. HRcGC peak definition (peak broadening; peak distortion)As pointed out earlier, baseline separated gas and even to partial peak overlap, all of which have a
chromatographic peaks are the basis for high-preci- detrimental effect on accuracy and precision ofsion CSIA. To achieve this goal, in the first instance, isotope ratio measurement [12]. Very recently, Good-basic gas chromatographic rules must be observed: man reported a single-capillary interface design(1) the polarity of the stationary phase should meet (SCID) which he developed to overcome thesethe polarity of the analytes; (2) column head pres- problems [30]. As the name suggests, a singlesure and, hence, carrier gas velocity, should be set to capillary was used to connect the GC column to thesuit column diameter; and (3) temperature gradients open-split in front of the IRMS. This capillary wasshould be chosen to exploit the maximum of the threaded through a furnace and accommodated two
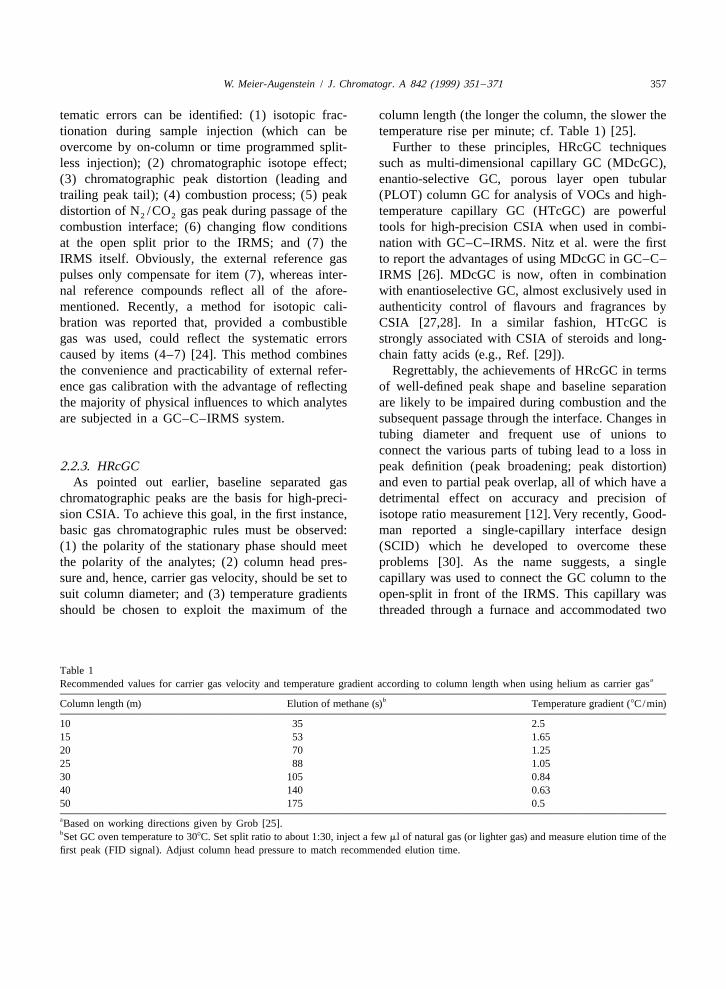
Table 1aRecommended values for carrier gas velocity and temperature gradient according to column length when using helium as carrier gas
bColumn length (m) Elution of methane (s) Temperature gradient (8C/min)
10 35 2.515 53 1.6520 70 1.2525 88 1.0530 105 0.8440 140 0.6350 175 0.5aBased on working directions given by Grob [25].bSet GC oven temperature to 308C. Set split ratio to about 1:30, inject a few ml of natural gas (or lighter gas) and measure elution time of thefirst peak (FID signal). Adjust column head pressure to match recommended elution time.

358 W. Meier-Augenstein / J. Chromatogr. A 842 (1999) 351 –371
13CuO wires positioned thus as to coincide with the level can yield measurements of d C values with afurnace dimensions. So far, this design has been precision of 0.3‰ on average. Thanks to this high
13 13tested for C isotopic abundance analysis of n- precision, even small changes in C isotopic abun-alkanes. dance of 1‰ can be reliably detected. For this reason
GC–C–IRMS has become the method of choice todetermine the origin of a given organic compound by
133. High-precision CSIA of C isotopic measuring its characteristic isotope ‘finger print’.abundance In contrast to the generally held opinion, the
natural abundance of stable isotopes is not a fixed3.1. GC–C–IRMS at natural abundance level constant but displays a considerable, yet subtle,
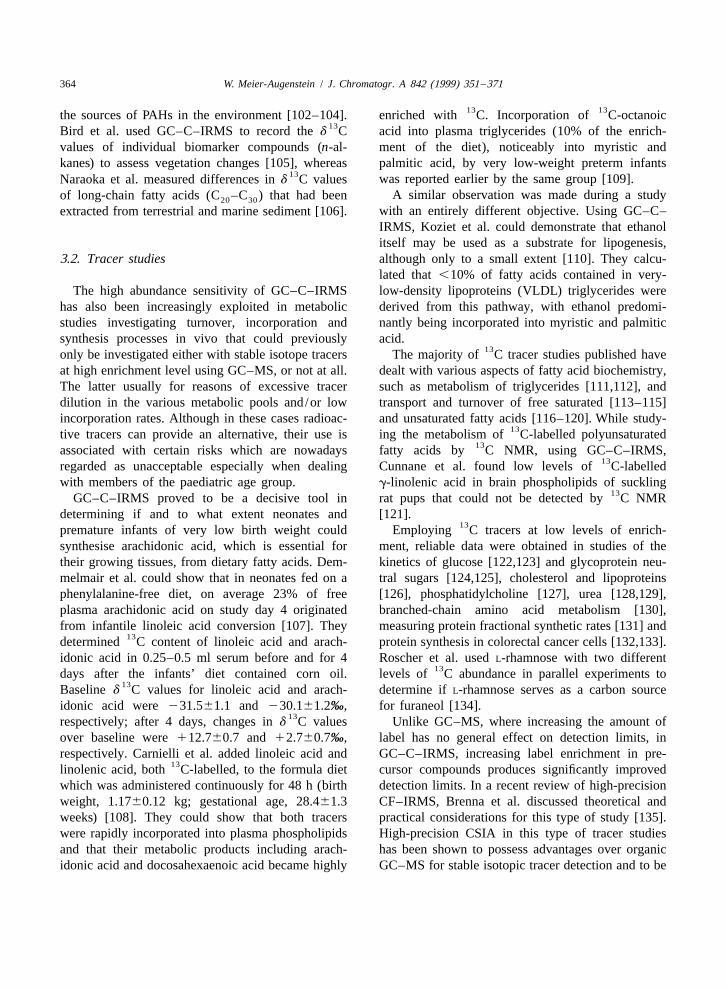
degree of variation. The variation on the natural13 13High-precision CSIA of C isotopic abundance at abundance of C can be as high as 0.1 at.% (Fig. 3).
both natural abundance (NA) and low enrichment This wide range reflects the varying degree of mass
13 13Fig. 3. Some typical examples of natural d C values grouped according to origin along the scale of C natural abundance.
W. Meier-Augenstein / J. Chromatogr. A 842 (1999) 351 –371 359
discrimination associated with the different pathways 3.1.1. Authenticityof carbon assimilation and fixation. To give an
13example, in terms of C isotopic abundance, beet 3.1.1.1. Flavours and fragrances13 12sugar is not the same as cane sugar. In sugar beet Bernreuther et al. measured C/ C isotope ratios
CO fixation results in the formation of a C body, of natural and nature-identical g-decalactone and2 3133-phosphoglycerate (3-PGA). This pathway of CO reported significant differences in d C values that2
fixation is known as the Calvin cycle. Plants using were source dependent although all plants belongedthe 3-PGA pathway for CO fixation are commonly to the C group [35]. For natural g-decalactone from2 3
13called C plants. However, some plants, of which stone fruit (apricot and peach) they found d C3
sugar cane is one, make use of a different pathway. values ranging from 238.0 to 240.8‰, respective-13Here, CO fixation yields a C -dicarboxylic acid, ly, that were significantly different from d C values2 4
oxalo acetate, hence the term C plants (the C - of g-decalactone extracted from soft fruit (straw-4 4
dicarboxylic acid pathway is also known as the berry) which were 229.2‰ on average. In contrast,13Hatch–Slack cycle). The products of these two d C values of artificial (nature-identical) g-decalac-
13pathways are characterised by their different C tone ranged from 224.4 to 226.9‰, whereas g-13abundance. Glucose derived from C plants has a decalactone of biotechnological origin showed d C3
13d C value of about 225‰, whereas glucose de- values of 230.8‰ on average.
13rived from C plants exhibits a more positive d C In an independent study, Mosandl et al. demon-4
value of about 211‰ indicating a mass discriminat- strated the additional advantage to be gained from13ory bias towards CO of the Hatch–Slack cycle. enantioselective GC–C–IRMS on samples of syn-2
13Differences in d C values were reported for total thetic g-decalactone (racemate RAC; 4R:4S550:50),leaf tissue, total surface lipid extracts, and individual g-decalactone of biotechnological origin (BIO; 4R.
n-alkanes isolated from plants utilising either C , C , 99% ee), and a mixture of both (BIO: RAC560:40)3 4
and crassulacean acid metabolism (CAM) pathways [36]. They reported for the enantiomerically pure13 13for carbon fixation [31,32]. The average d C values (4R)-g-decalactone of biotechnological origin a d C
obtained from C plant material were between 10 value of 230.1260.14‰ which is in good agree-313 13and 15‰ lower compared to the corresponding d C ment with the d C values measured by Bernreuther
values obtained from C and CAM plant material. et al. The separated enantiomers of the nature-identi-413Measurement of the isotopic abundance of C for cal product showed, as could be expected, identical
13lutein isolated from marigold (C ) and maize (C ) d C values within the observed standard deviation3 4
yielded 229.9060.20 and 219.7760.27‰, respec- (4R, 228.3260.36‰; 4S, 228.1860.39‰). Mixingtively, showing a similar difference of .10‰ be- 60% of BIO with 40% of RAC yielded an enantio-tween the two photosynthetic pathways [33]. meric distribution of 4R:4S580:20, with 75% of the
Although the vast majority of plants belong the C 4R-configured g-decalactone being of biotechnologi-313 13group (.300 000) with bulk d C values of cal origin. The measured d C value of the 4R
,224‰, differences in the rate of photosynthesis enantiomer in this mixture was 229.6260.33‰(mainly caused by differences in climate and geo- which was in good agreement with the theoretically
13graphical location) and in enzyme kinetics of bio- expected value of 229.67‰. The d C value of the13chemical pathways result in subtle variation of C/ 4S enantiomer in this mixture was of course the
12C ratios that can be detected by GC–C–IRMS. same as for the 4S enantiomer in the pure syntheticLockheart et al. were able to detect inter- and intra- sample (228.0861.30‰).
13specific differences in d C values for n-alkanes and This early work suggested that two phenomena ofalcohols in sun and shade leaves from oak and beech biosynthetic pathways, enantioselectivity and massranging from 0.7 to 3.0‰ [34]. These subtle differ- discrimination (kinetic isotope effects), might serve
13ences in d C values can be used to determine origin as compound-specific parameters to establish originof an organic compound and, thus, the authenticity of and, hence, to control authenticity of natural flavoursa sample. and fragrances. However, when focused on indi-
360 W. Meier-Augenstein / J. Chromatogr. A 842 (1999) 351 –371
13vidual compounds the application of stable isotope were established based on d C values relative to anabundance measurement is only of limited use as internal standard (either limonene, g-terpinene ormost plants cultivated for human consumption are C neryl acetate). With the help of these finger prints,3
13plants whose C isotopic signatures partially overlap samples made up entirely of synthetic compoundswith those of synthetic compounds derived from and even samples containing mixtures of authenticfossil sources or those of compounds produced by (natural) material and synthetic compounds could bebiotechnological methods. reliably identified. In cases where chiral compounds
This problem was soon recognised and Mosandl’s such as linalol occur naturally as enantiomericgroup suggested the use of genuine internal isotopic mixtures (in coriander oil, R:S520:80), enan-standards and formulated the following recommenda- tioselective GC–C–IRMS could even detect non-tions [37,38]: authentic samples imitating the natural enantiomeric
13(1) the compound selected as internal isotopic ratio by measuring the d C values of each enantio-standard should be a genuine characteristic com- mer [40,48].pound of lesser sensorial relevance;
(2) the compound must be available in the sample 3.1.1.2. Wine, fruit juice and honeyin sufficient amounts and must not be susceptible to In the early days of GC–C–IRMS, detection ofmass discrimination during sample preparation; added sugar in fruit juice and wine was fairly simple
(3) the selected compound must be biogenetically as mainly cheap corn syrup (maize: C plant) was4
related to the compounds under investigation; predominantly used to boost sugar and/or ethanol13(4) chemical inertness of the compound during content, respectively. Measuring d C values of
storage and/or technical processes is mandatory; glucose or bulk carbon was sufficient to prove(5) the compound selected as internal isotopic adulteration. However, addition of small amounts of
standard must not be a legally allowed additive. C plant sugars (#10%) to C plant products such4 3
The obvious advantage of using an internal stan- as wine, fruit juice and honey, or the addition ofdard, biogenetically related to characteristic sample sugars from other C plants (sugar beet; concentrated3
compounds, is the elimination of variations in the and deflavourized grape juice) could no longer be13
d C-signature resulting from, e.g., climate-depen- detected by these measurements [49]. Schmidt anddent variations of the photosynthetic rate and the co-workers studied several methods based on high-kinetic isotope effect associated with the CO fixa- precision CSIA to determine authenticity of wine,2
tion step. Therefore, only the characteristic kinetic fruit juices and honey, and to prove fraudulentisotope effects caused by enzymatic reactions during addition of sugars and even vitamin C from othersecondary biogenetic pathways are investigated, and sources. Their research revealed that in authentic
13the resulting relative d C values can be used as a fruit juices biogenetically related compounds such assample-specific finger print (cf. Fig. 4). L-ascorbic acid [50,51], L-malic acid [52] and L-
13Applying the aforementioned recommendations, tartaric acid [51] showed d C values stronglyMosandl and co-workers, who have to be regarded as correlating with those of their corresponding sugars.
13the leaders in the field of authenticity control, studied For instance, the d C value of L-ascorbic acid isa wide range of commercially relevant flavours and 14.8‰ higher than that of its precursor glucose.fragrances and assessed authenticity of allegedly This enrichment is mainly located in the C-1 positionnatural samples from commercial sources. The ma- of L-ascorbic acid of authentic origin and the resultterials studied included lemon oil [37], balm oil [39], of plant-specific kinetic isotope effects during bio-citronella oil [39], lemongrass oil [39], coriander oil synthesis, whereas L-ascorbic acid of biotechnologi-
13[40], bergamot oil [41], orange oil [42], mandarin oil cal origin preserves the C pattern of glucose [51].[43,44], peppermint oil [45], volatile components In glycerol originating from natural sources,
13from strawberries [16] and apples [46] and a- as well Weber et al. found a C depletion position specificas b-ionone from raspberries [47]. Using self-pre- for C-1 and they suggested this unique feature mightpared authentic samples, sample-specific finger prints be used as a means to test for illegal addition ofof six to eight biogenetically related compounds synthetic glycerol to wines [53]. They also discov-

W. Meier-Augenstein / J. Chromatogr. A 842 (1999) 351 –371 361
13Fig. 4. d C fingerprint of biogenetically related compounds in lemon oils of different geographical origin (top graph). The graph at the13bottom shows the Dd C fingerprint of the samples obtained when using neryl acetate (8) as internal isotopic standard [38]. From [38],
Marcel Dekker, 1995.
13ered a constant Dd C correlation between ethanol cheaper oils for the high quality product. In a blindand citric acid (12.4‰) in addition to the known study, Woodbury et al. were able to detect the
13Dd C correlation between fermented sugar and adulteration of maize germ oil with oils of C plant3
ethanol (21.7‰) [54]. Dennis et al. suggested the origin down to a level of 5% (w/w) [56]. They found13 the saturated 16:0 fatty acid in maize oil to be moreuse of d C values of sorbitol as a further means for
13depleted in C than the corresponding unsaturatedauthenticity control of wines [55].fatty acids 18:1 and 18:2. In addition, consistent
13differences were observed for d C values of vege-3.1.1.3. Vegetable oils table oils from different geographical regions. In a
High-quality, single-source vegetable oils are subsequent study, Woodbury et al. determined fatty13another target for fraudulent adulteration, i.e., partial acid composition and d C values of the major fatty
or total substitution of minor quality and, hence, acids of more than 150 vegetable oils [57], thus

362 W. Meier-Augenstein / J. Chromatogr. A 842 (1999) 351 –371
establishing a database that provides isotopic in- synthesised from cholesterol via dehydroepiandros-formation for authenticity control of vegetable oils. terone and is then further metabolised to andros-
13Variability in d C values could be related to geo- tanediol. The group around Aguilera et al. found that13graphical origin, year of harvest, and the particular the averaged d C values for endogenous 5a- and
variety of oil. Their findings suggest that ultimately 5b-androstanediol dropped from 226.52‰ before13
d C values of fatty acids are determined by a synthetic testosterone administration (natural back-combination of environmental and genetic factors. ground or baseline value) to 232.44‰ during
Kelly et al. investigated authenticity of single-seed testosterone administration [63]. Independent work13vegetable oils of C plant origin such as groundnut, by Shackleton et al. obtained a similar baseline d C3
palm, rape seed and sunflower oils [58]. They found value of 226.87‰ and a drop down to 230.21‰ on13that the d C values for the authentic vegetable oil average for androstanediol samples after a bolus
fatty acids fell within a narrow range of 227.6 to administration of 250 mg exogenous testosterone232.1‰. Employing canonical discriminant analy- [64,65]. This drop of about 22‰ lasted for up to 10
13 13sis, C data from sunflower oil could be separated days before d C values of androstanediol returnedfrom other oils, exploiting small, yet significant, to their former baseline value. They also reported a
13differences in d C values within the oil varieties. narrow range of 229.15 to 230.41‰ for fiveTo detect adulteration of olive oils, Angerosa et al. synthetic testosterone samples manufactured in five
13compared d C values of the aliphatic alcoholic oil different countries. Based on the results reported byfractions and found those of the adulterant pomace Aguilera et al. [63] and their own, Shackleton et al.oil to be significantly more negative than those of suggested a conservative cut-off value of 229.0‰virgin and refined olive oils [59]. Furthermore, they for androstanediol to identify unambiguously testo-studied isoprenoids and methylsterols isolated from sterone abuse for up to 7 days after administration.each grade of olive oil and showed the better the Hydrocortisone abuse in horse racing and otherolive oil grade, the more positive (i.e., less negative) equine sports can be confirmed on the basis of
13 13the d C values of these compounds became. significantly different C isotope patterns betweenendogenous urinary hydrocortisone and synthetic
3.1.1.4. Drugs material. This method, proposed by Aguilera et al.,13Measuring C isotopic abundance of heroin to employs conversion of urinary hydrocortisone into
trace the origin of heroin samples in narcotic drug its bismethylenedioxy derivative to improve its gas13abuse, showed some evidence of variation in d C chromatographic properties [66].
values of heroin depending on its geographical siteof production [60]. A preliminary study to trace the 3.1.2. Originorigin of different batches of confiscated 3,4-(methyldioxy)methylamphetamine (MDMA, Ec- 3.1.2.1. Geochemistry
13stasy) tablets by GC–C–IRMS allowed the discrimi- The desire to study C isotope abundance ofnation of four different groups of MDMA tablets sedimentary hydrocarbons on a molecular level was
13based on variations in their NA d C values [61]. one of the driving forces behind the development ofThe same study showed that further discrimination GC–C–IRMS. Geochemists and archaeologists
15could be obtained when using d N values of wanted to extract all possible information containedMDMA. in fossil biomarkers such as sedimentary long-chain
Prompted by the uncertainty associated with the alcohols and sterols [67], triterpene-derived hydro-T/E.6 test that measures the ratio of testosterone carbons [68], neutral monosaccharides [69], long-(T) and epitestosterone (E) and the high public chain alkanes [70–74], alkanes and isoprenoidsinterest in alleged doping in athletes, several studies [75,76], polycyclic aromatic hydrocarbons (PAHs)have been carried out to use metabolic pathway [77], amino acids [78–80] and phenolic acids [81].
13related C isotope patterns to differentiate between Freeman et al. measured hydrocarbons from sedi-endogenous human testosterone and exogenous testo- ments deposited in the Messel shale and found a
13sterone [62]. In the human body, testosterone is wide spectrum of d C values ranging from 220

W. Meier-Augenstein / J. Chromatogr. A 842 (1999) 351 –371 363
down to 275‰, thus proving the equally wide 16:0 and 18:0 acyl moieties of lipid compounds fromspectrum of origins [82]. The extreme negative extracts of neolithic vessels with modern referencevalues were thought to indicate the activity of animal fats, Evershed et al. could identify animal fat
13methanotrophic bacteria, as d C values of ,245‰ residues found in vessels dated circa 4200 BP asthus far had only been observed for methane but not being close to reference pig adipose fats, whereasfor larger molecules. This and others studies residues found in vessels dated circa 4500 BP were[68,69,73,83] demonstrated that sedimentary organic closer to reference ruminant fat [88].
13compounds contain contributions of bacterial origin O’Donoghue et al. reported d C values in therather than being solely of plant origin. Using GC– range of 225.4 to 229.2‰ for the principal fatty
13C–IRMS to measure C isotope abundance in acids (16:0 to 24:1) of radish seed found in a 6thhydrocarbons from sedimentary rocks across the century AD storage vessel [89]. Composition and
13Precambrian–Cambrian boundary, Logan et al. [84] d C values of fatty acids found in the ancient radishwere able to shed some light on the development of seeds matched closely those found in modern radishmulticellular life during the so-called ‘Cambrian seeds.
13explosion’. Based on the isotopic data, they could Stott et al. measured d C values of cholesterolshow a transition from an environment dominated by and 3b-hydroxycholest-5-en-7-one from fossil whalesulphate-reducing bacteria to one dominated by bones [90] and archaeological human bones and
13photosynthetic organisms, thus transforming the teeth [91], and showed that their C content couldhitherto anaerobic ocean into an aerobic ocean. be used as an important new source of palaeodietary
information. Another insight into prehistoric life was133.1.2.2. Archaeology gleaned from the C analysis of adsorbed lipids
13 12Measuring C/ C isotope ratios has become an preserved in the fabric of Minoan lamps and conical13increasingly important tool to glean information on cups. The d C values together with HTcGC–MS
prehistoric diet and lifestyle from organic residues profiles identified beeswax as the illuminant burnedpreserved in archaeological artefacts. Employing in prehistoric Aegean lamps rather than olive oil asboth HTcGC–MS and HTcGC–C–IRMS to identify hitherto supposed [92].
13chemical structures and measure d C values, re-spectively, Evershed et al. showed that lipid extracts(C –C alkanes and a C ketone, nonacosain-15- 3.1.2.3. Environmental chemistry25 33 29
one) from organic residues found in archaeological Monitoring environmental and climate changes by13potsheds were derived from Brassica species (wild- measuring d C values of atmospheric gases such as
type cabbage) [85]. Later work on organic residues methane, carbon monoxide and carbon dioxide hasfrom archaeological pottery vessels found C , C traditionally been carried out using dual-inlet IRMS31 33
13and C ketones with d C values that were up to systems. Their measurements however, required35
10‰ higher than those found for the C ketones time-consuming sample preparation of large sample29
from wild-type Brassica species. Based on HTcGC– volumes. The high abundance sensitivity of GC–C–MS and HTcGC–C–IRMS data, Evershed and co- IRMS together with the use of PLOT fused-silicaworkers formed the hypothesis that a precursor / capillary columns for routine GC analysis of highlyproduct relationship may exist between C ketones volatile organic compounds (HVOCs) has now be-35
and fatty acids, and corresponding triacylglycerols come the method of choice for scientists as airsuch as tripalmitin and tristearin from animal fats samples between 50 ml and 5 ml can be analysed[86]. Studying pyrolysis reactions of acyl lipids and on-line without any prior sample preparation [93–monitoring their products by HTcGC–MS and 95].HTcGC–C–IRMS, they could confirm that C , C High-precision CSIA by GC–C–IRMS is also31 33
and C mid-chain ketones found in archaeological used to determine origin and identify sources of oil35
pottery vessels were indeed derived from a mixture spills and oil pollution [96–98], ocean-transportedof free fatty acids [87]. Comparing carbon number bitumen [99], characterisation of refractory wastes at
13distributions of triacylglycerols and d C values of heavy-oil contaminated sites [100,101] and to trace
364 W. Meier-Augenstein / J. Chromatogr. A 842 (1999) 351 –371
13 13the sources of PAHs in the environment [102–104]. enriched with C. Incorporation of C-octanoic13Bird et al. used GC–C–IRMS to record the d C acid into plasma triglycerides (10% of the enrich-
values of individual biomarker compounds (n-al- ment of the diet), noticeably into myristic andkanes) to assess vegetation changes [105], whereas palmitic acid, by very low-weight preterm infants
13 was reported earlier by the same group [109].Naraoka et al. measured differences in d C valuesA similar observation was made during a studyof long-chain fatty acids (C –C ) that had been20 30
with an entirely different objective. Using GC–C–extracted from terrestrial and marine sediment [106].IRMS, Koziet et al. could demonstrate that ethanolitself may be used as a substrate for lipogenesis,
3.2. Tracer studies although only to a small extent [110]. They calcu-lated that ,10% of fatty acids contained in very-
The high abundance sensitivity of GC–C–IRMS low-density lipoproteins (VLDL) triglycerides werehas also been increasingly exploited in metabolic derived from this pathway, with ethanol predomi-studies investigating turnover, incorporation and nantly being incorporated into myristic and palmiticsynthesis processes in vivo that could previously acid.
13only be investigated either with stable isotope tracers The majority of C tracer studies published haveat high enrichment level using GC–MS, or not at all. dealt with various aspects of fatty acid biochemistry,The latter usually for reasons of excessive tracer such as metabolism of triglycerides [111,112], anddilution in the various metabolic pools and/or low transport and turnover of free saturated [113–115]incorporation rates. Although in these cases radioac- and unsaturated fatty acids [116–120]. While study-
13tive tracers can provide an alternative, their use is ing the metabolism of C-labelled polyunsaturated13associated with certain risks which are nowadays fatty acids by C NMR, using GC–C–IRMS,
13regarded as unacceptable especially when dealing Cunnane et al. found low levels of C-labelledwith members of the paediatric age group. g-linolenic acid in brain phospholipids of suckling
13GC–C–IRMS proved to be a decisive tool in rat pups that could not be detected by C NMRdetermining if and to what extent neonates and [121].
13premature infants of very low birth weight could Employing C tracers at low levels of enrich-synthesise arachidonic acid, which is essential for ment, reliable data were obtained in studies of thetheir growing tissues, from dietary fatty acids. Dem- kinetics of glucose [122,123] and glycoprotein neu-melmair et al. could show that in neonates fed on a tral sugars [124,125], cholesterol and lipoproteinsphenylalanine-free diet, on average 23% of free [126], phosphatidylcholine [127], urea [128,129],plasma arachidonic acid on study day 4 originated branched-chain amino acid metabolism [130],from infantile linoleic acid conversion [107]. They measuring protein fractional synthetic rates [131] and
13determined C content of linoleic acid and arach- protein synthesis in colorectal cancer cells [132,133].idonic acid in 0.25–0.5 ml serum before and for 4 Roscher et al. used L-rhamnose with two different
13days after the infants’ diet contained corn oil. levels of C abundance in parallel experiments to13Baseline d C values for linoleic acid and arach- determine if L-rhamnose serves as a carbon source
idonic acid were 231.561.1 and 230.161.2‰, for furaneol [134].13respectively; after 4 days, changes in d C values Unlike GC–MS, where increasing the amount of
over baseline were 112.760.7 and 12.760.7‰, label has no general effect on detection limits, inrespectively. Carnielli et al. added linoleic acid and GC–C–IRMS, increasing label enrichment in pre-
13linolenic acid, both C-labelled, to the formula diet cursor compounds produces significantly improvedwhich was administered continuously for 48 h (birth detection limits. In a recent review of high-precisionweight, 1.1760.12 kg; gestational age, 28.461.3 CF–IRMS, Brenna et al. discussed theoretical andweeks) [108]. They could show that both tracers practical considerations for this type of study [135].were rapidly incorporated into plasma phospholipids High-precision CSIA in this type of tracer studiesand that their metabolic products including arach- has been shown to possess advantages over organicidonic acid and docosahexaenoic acid became highly GC–MS for stable isotopic tracer detection and to be
W. Meier-Augenstein / J. Chromatogr. A 842 (1999) 351 –371 365
superior to radio-isotopic tracer methods in terms of ion source simultaneously with N , this would result215dose size and analysis efficiency [136]. Guo et al. in a serious isobaric interference at m /z 28. For d N
reported that GC–C–IRMS provides 15-fold lower values of tBDMS derivatives of amino acids, they13 15detection limits for [ C -C3,C4]cholesterol than reported a precision of S.D. (d N)55‰ at natural2
13organic GC–MS [137]. Using [U- C]a-linolenic abundance level.acid, Sheaff et al. were able demonstrate that conver- In the same year, Merritt and Hayes presented asion of a-linolenate into docosahexaenoate was not similar system but for the addition of a reductiondepressed by high dietary levels of linoleic acid furnace, loaded with Cu wires and maintained at a[117]. An interconversion of saturated dietary fatty temperature of 6008C, to reduce N-oxides to N and2
acids (e.g., 18:0) into unsaturated fatty acids (e.g., to scavenge O emanating from the combustion2
18:1) in plasma of about 14% was reported by Rhee furnace [143]. Their system also included a cryo-et al. [138]. Menand et al. applied this technique to genic trap to remove CO and water, and it produced2
15measure carbon incorporation into plasma glutamine a precision of S.D. (d N)50.2‰.[139]. Practical aspects of this technique have been This marked difference in precision was attributedinvestigated by Dube et al. [140,141]. to different performances of the IRMS systems.
Ongoing investigations in our laboratory seem toindicate that this difference might be caused by the
154. Compound-specific isotope analysis of N simultaneous presence of NO and N in the ion2
isotopic abundance source. Placing a PORAPLOT Q capillary column of0.32 mm internal diameter, maintained at 308C
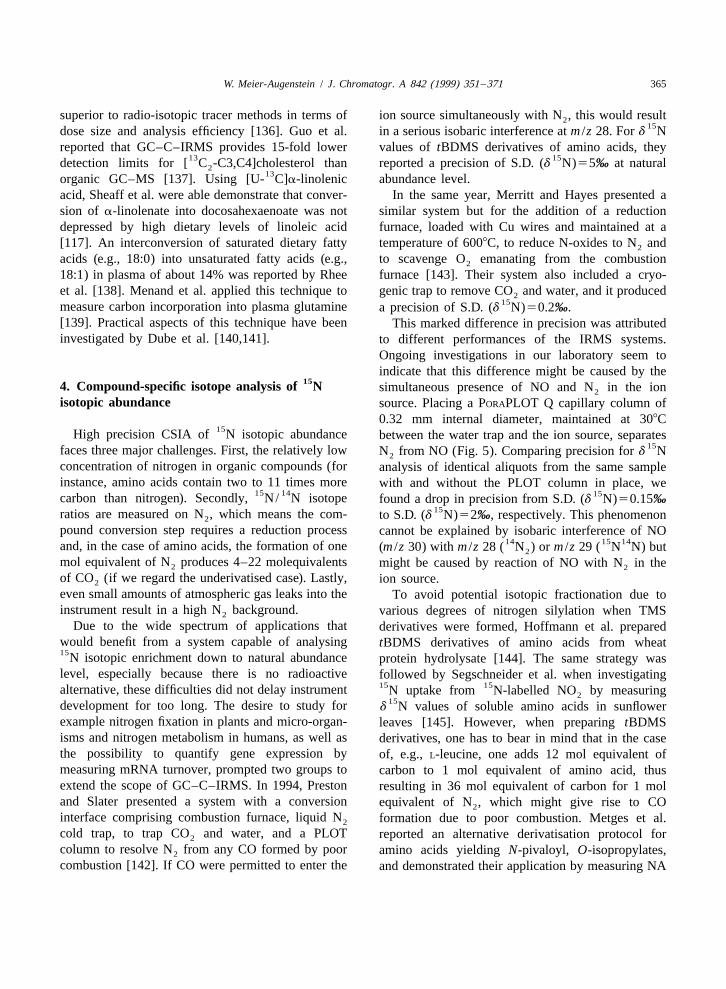
15High precision CSIA of N isotopic abundance between the water trap and the ion source, separates15faces three major challenges. First, the relatively low N from NO (Fig. 5). Comparing precision for d N2
concentration of nitrogen in organic compounds (for analysis of identical aliquots from the same sampleinstance, amino acids contain two to 11 times more with and without the PLOT column in place, we
15 14 15carbon than nitrogen). Secondly, N/ N isotope found a drop in precision from S.D. (d N)50.15‰15ratios are measured on N , which means the com- to S.D. (d N)52‰, respectively. This phenomenon2
pound conversion step requires a reduction process cannot be explained by isobaric interference of NO14 15 14and, in the case of amino acids, the formation of one (m /z 30) with m /z 28 ( N ) or m /z 29 ( N N) but2
mol equivalent of N produces 4–22 molequivalents might be caused by reaction of NO with N in the2 2
of CO (if we regard the underivatised case). Lastly, ion source.2
even small amounts of atmospheric gas leaks into the To avoid potential isotopic fractionation due toinstrument result in a high N background. various degrees of nitrogen silylation when TMS2
Due to the wide spectrum of applications that derivatives were formed, Hoffmann et al. preparedwould benefit from a system capable of analysing tBDMS derivatives of amino acids from wheat15N isotopic enrichment down to natural abundance protein hydrolysate [144]. The same strategy waslevel, especially because there is no radioactive followed by Segschneider et al. when investigating
15 15alternative, these difficulties did not delay instrument N uptake from N-labelled NO by measuring215development for too long. The desire to study for d N values of soluble amino acids in sunflower
example nitrogen fixation in plants and micro-organ- leaves [145]. However, when preparing tBDMSisms and nitrogen metabolism in humans, as well as derivatives, one has to bear in mind that in the casethe possibility to quantify gene expression by of, e.g., L-leucine, one adds 12 mol equivalent ofmeasuring mRNA turnover, prompted two groups to carbon to 1 mol equivalent of amino acid, thusextend the scope of GC–C–IRMS. In 1994, Preston resulting in 36 mol equivalent of carbon for 1 moland Slater presented a system with a conversion equivalent of N , which might give rise to CO2
interface comprising combustion furnace, liquid N formation due to poor combustion. Metges et al.2
cold trap, to trap CO and water, and a PLOT reported an alternative derivatisation protocol for2
column to resolve N from any CO formed by poor amino acids yielding N-pivaloyl, O-isopropylates,2
combustion [142]. If CO were permitted to enter the and demonstrated their application by measuring NA

366 W. Meier-Augenstein / J. Chromatogr. A 842 (1999) 351 –371
1Fig. 5. The N mass traces obtained for alanine (as N-acetyl, O-propyl derivative) having passed post-combustion through a PORAPLOT Q21column, held at 308C, shows the presence of NO next to N . The CO peaks are caused by the formation of CO from CO in the ion2 2 2
source.
15 15d N values of amino acids from plasma albumin d N values of free plasma amino acids from fastinghydrolysate [146]. human subjects. With the exception of Thr and Phe,
15 15CSIA of N isotopic abundance by GC–C–IRMS all other amino acids showed positive d N valueshas been applied to measure the effect of ibuprofen [150].
15 15on protein synthesis using N-labelled glycine as Mas et al. suggested that d N values of MDMA15tracer [147]. Williams et al. used N-labelled urea to (ecstasy) could be used for batch discrimination of
15demonstrate that Helicobactor pylori uses urea as a ecstasy tablets [61], and Faulhaber et al. used d Nnitrogen source for its synthesis of amino acids values of methyl-N-methylanthranilate as a bio-[148]. A multidisciplinary group comprising environ- marker in the authenticity control of mandarin oilsmental, archaeological, geological and nutritional [43]. Last, but not least, GC–IRMS was used for
15 15scientists showed that differences in d N values measuring d N values of N and N O, separated2 2
from soil amino acids could be used to indicate from the same sample [151,152].differences in land use in Bronze Age, medieval andearly modern soils [149]. One intriguing observation
15they made was the consistently low levels of N 5. Hyphenated techniques15abundance (d N,0.0‰ vs air) in the amino acids
threonine (Thr) and phenylalanine (Phe) from soils In recent years, the research efforts of different15of unmanured cereal production sites, whereas d N groups working in the field of GC–IRMS have
values of all the other amino acids were positive. We focused on extending the scope of on-line CSIA18 16thought this was intriguing because a similar pattern towards the measurement of organic O/ O and
2 1was found by Metges and Petalec when monitoring organic H/ H isotope ratios. Consequently, research

W. Meier-Augenstein / J. Chromatogr. A 842 (1999) 351 –371 367
was undertaken with the aim of high-precision al. converted bulk plant matter into N and CO by an2
measurement of two different elemental isotope automated on-line pyrolysis-based reaction using2 18 13 18 13 15ratios such as H/ O, C/ O and C/ N, from nickelized carbon at about 11008C and separating N2
˚the same compound source in one analytical run. from CO post-pyrolysis in a GC fitted with a 5-ABy placing a PORAPLOT Q capillary column molecular sieve PLOT column [156].
between the combustion reactor and the IRMS Independently, Begley and Scrimgeour reported2 18(which enabled us to separate N from CO by 100 s on high-precision d H and d O measurement for2 2
15 14 13 12baseline to baseline), N/ N and C/ C isotope water and VOCs by using 20% nickelized carbon toratio from alanine, leucine and phenylalanine could generate both H and CO at temperatures of between2
be measured in one single analysis [153]. The 1050 and 11008C [157]. Precisions were S.D.2 18excellent separation of N from CO provided ample (d H)52‰ and S.D. (d O)50.3‰ for samples2 2
time to switch IRMS ion source parameters from N - ranging from urine, water and VOCs. Their pyrolysis2
to CO -mode (Fig. 6). system was based on earlier work that was aimed at22 18In 1994, using a GC-based IRMS system, Brand et simultaneous d H and d O determination from
18 16al. showed that CSIA of O/ O ratios was possible small water and urine samples (0.5 ml) [158].by converting oxygen-containing organic compounds Common to both studies was the use of a novelon-line to CO by means of a pyrolytic reaction [154]. IRMS with the high dispersion necessary for sepa-
2 1 1 4 1The on-line coupling of GC and IRMS via a ration of the H H and He ion beams. This novelpyrolysis interface (GC–Py–IRMS) was used for the high mass dispersion IRMS has been described in
13 18simultaneous determination of d C and d O values detail by Prosser and Scrimgeour [159]. Very recent-for vanilla from different origins [155]. Farquhar et ly, this high mass dispersion IRMS was coupled to a
15 13Fig. 6. Dual isotope measurement of d N and d C from alanine (as N-acetyl, O-propyl derivative) during the same analysis. The arrowindicates when the ion source parameters were switched from nitrogen mode (m /z 28) to carbon dioxide mode (m /z 44). A 100-s baseline tobaseline separation of N from CO was achieved by passing the combustion products past-reduction through a PORAPLOT Q column, held2 2
15 13at 358C. The results obtained from dual-isotope analyses (d N, 27.7860.10‰ vs air; d C, 240.2260.14‰ vs PDB) were in good15 13agreement with those obtained from separate analyses (d N, 27.8660.38‰ vs air; d C, 240.2060.21‰ vs PDB).

368 W. Meier-Augenstein / J. Chromatogr. A 842 (1999) 351 –371
˚GC via a pyrolysis interface including a 5-A molecu- ments in accuracy, precision and abundance sen-2lar sieve PLOT column to achieve CSIA for H of sitivity of GC–IRMS, accompanied by increased
2fatty acids. Preliminary d H values for 16:0 and 18:1 user-friendliness, will ensure that this technique willfatty acids (as methyl esters) from tuna oil given in a cement its role as an important and unique tool ofTechnical Brochure were 2148.564.1 and analytical mass spectrometry.2155.361.0‰ (vs. VSMOV), respectively [160]. The sheer number of applications, as well as their
A different approach to CSIA for H of organic wide spectrum clearly demonstrates that state-of-the-compounds such as ethyl benzene and cyclohex- art GC–C–IRMS instruments are already powerfulanone was published by Tobias and Brenna. Initially tools providing quantitative and qualitative infor-using a two-stage reactor interface (CuO at 8508C mation that cannot be obtained by other means.followed by Ni held at 9508C) [161] they found that
2better precision for d H was achieved by employingan empty alumina tube held at about 11508C [162].
AcknowledgementsBecause their IRMS was not capable of fully resolv-2 1 4ing analyte H H from excess He carrier gas, they
The author gratefully acknowledges financial sup-used a heated Pd filter in conjunction with a make-upport through an industrial grant awarded by Europapressure unit to prevent He from entering the IRMSScientific Ltd (Crewe, UK). Many thanks are due towhile selectively admitting only hydrogen throughProfessor Michael J. Rennie for advise and helpfulthe Pd foil membrane into the ion source [163].discussions. The author is indebted to Dr Helen FThe measurement of intramolecular variations inKemp for critical reading of the manuscript.isotopic abundance due to kinetic isotope effects
during biosynthesis is another recent development toextend the scope of GC–IRMS. The group around
13Schmidt employed C isotope pattern analysis forReferencesdistinction of natural compounds from corresponding
synthetic products [53,164]. In 1997, an on-line[1] M. Sano, Y. Yotsui, H. Abe, S. Sasaki, Biomed. Masspyrolysis system for position-specific isotope analy-
Spectrom. 3 (1976) 1–3.sis (PSIA) of selected compounds from a complex[2] D.E. Matthews, J.M. Hayes, Anal. Chem. 50 (1978) 1465–mixture was described in detail by Corso and Brenna
1473.[165]. They coupled a GC (GC-1) for sample [3] A. Barrie, J. Bricout, J. Koziet, Biomed. Mass Spectrom. 11separation prior to pyrolysis to the GC (GC-2) (1984) 439–447.separating pyrolytic products of the selected sample [4] J.R. Bacon, J.S. Crain, A.W. McMahon, J.G. Williams, J.
Anal. Atomic Spectrom. 12 (1997) R407–R448.compound. Furthermore, they installed a valve into[5] M. Rautenschlein, K. Habfast, W. Brand, in: T.E Chapman,GC-2 to permit separated pyrolysis fragments to be
R. Berger, D.J. Reijngoud, A. Okken (Eds.), Stable Isotopesadmitted to an organic MS for structure analysis ofin Paediatric, Nutritional and Metabolic Research, Intercept
these fragments. Ltd, Andover, UK, 1990, pp. 133–148.[6] D.A. Merritt, K.H. Freeman, M.P. Ricci, S.A. Studley, J.M.
Hayes, Anal. Chem. 67 (1995) 2461–2473.[7] P.A. Eakin, A.E. Fallick, J. Gerc, Chem. Geol. 101 (1992)6. Conclusions
71–79.[8] K.J. Leckrone, J.M. Hayes, Anal. Chem. 70 (1998) 2737–
Despite recent advances, many fundamental chal- 2744.lenges for improved instrumentation still remain, [9] Y. Cherrah, J.B. Falconnet, M. Desage, J.L. Brazler, R. Zini,
J.P. Tillement, Biomed. Environ. Mass Spectrom. 14 (1987)most notably developments leading to (a) quantita-653–657.tive sample conversion to achieve high-precision
[10] M. Matucha, W. Jokisch, P. Verner, G. Anders, J. Chroma-CSIA for nitrogen; (b) routine CSIA of hydrogentogr. 588 (1991) 251–258.
isotopes after gas chromatographic separation; and [11] M. Matucha, in: J. Allen (Ed.), Synthesis and Applications of(c) the routine application of PSIA to detect in- Isotopically Labelled Compounds, Wiley, New York, 1995,tramolecular isotope patterns. Continuing improve- pp. 489–494.

W. Meier-Augenstein / J. Chromatogr. A 842 (1999) 351 –371 369
[12] W. Meier-Augenstein, P.W. Watt, C.-D. Langhans, J. Chroma- [42] R. Braunsdorf, U. Hener, G. Przibilla, S. Piecha, A.Mosandl, Z. Lebensm. Unters. Forsch. 197 (1991) 24–28.togr. A 752 (1996) 233–241.
[43] S. Faulhaber, U. Hener, A. Mosandl, J. Agric. Food Chem.[13] K.J. Goodman, J.T. Brenna, Anal. Chem. 66 (1994) 1294–45 (1997) 2579–2583.1301.
[44] S. Faulhaber, U. Hener, A. Mosandl, J. Agric. Food Chem.[14] K.J. Goodman, J.T. Brenna, J. Chromatogr. A. 689 (1995)45 (1997) 4719–4725.63–68.
[45] B. Faber, B. Krause, A. Mosandl, J. Essent. Oil Res. 7[15] J.T. Brenna, T.N. Corso, H.J. Tobias, R.J. Caimi, Mass(1995) 123–131.Spectrom. Rev. 16 (1997) 227–258.
[46] V. Karl, A. Dietrich, A. Mosandl, Phytochem. Anal. 5 (1994)[16] K. Schumacher, H. Turgeon, A. Mosandl, Phytochem. Anal.32–37.6 (1995) 258–261.
[47] R. Braunsdorf, U. Hener, D. Lehmann, A. Mosandl, Dtsch.[17] Y. Khalfallah, S. Normand, S. Tissot, C. Pachiaudi, M.Lebensm. Rundsch. 87 (1991) 277–280.Beylot, J.P. Riou, Biol. Mass Spectrom. 22 (1993) 707–711.
[48] A. Mosandl, R. Braunsdorf, G. Bruche, A. Dietrich, U.[18] H. Demmelmair, H.-L. Schmidt, Isotopenpraxis Environ.¨Hener, V. Karl, T. Kopke, P. Kreis, D. Lehmann, B. Maas,
Health Stud. 29 (1993) 237–250.ACS Symp. Ser. 596 (1995) 94–112.
[19] G. Rieley, Analyst 119 (1994) 915–919.[49] H.L. Scmidt, M. Butzenlechner, A. Rossmann, S. Schwarz,
[20] W. Meier-Augenstein, LC?GC 15 (1997) 244–253. H. Kexel, K. Kempe, Z. Lebensm. Unters. Forsch. 196[21] R.J. Caimi, L.H. Houghton, J.T. Brenna, Anal. Chem. 66 (1993) 105–110.
(1994) 2989–2991. [50] M. Gensler, A. Rossmann, H.L. Schmidt, J. Agric. Food[22] D.A. Merritt, W.A. Brand, J.M. Hayes, Org. Geochem. 21 Chem. 43 (1995) 2662–2666.
(1994) 573–583. [51] D. Weber, M. Gensler, H.L. Schmidt, Isotopes Environ.[23] R.J. Caimi, J.T. Brenna, J. Am. Soc. Mass Spectrom. 7 Health Stud. 33 (1997) 151–155.
(1996) 605–610. [52] A. Rossmann, H.L. Schmidt, Anal. Chim. Acta 347 (1997)[24] W. Meier-Augenstein, Rapid Commun. Mass Spectrom. 11 359–368.
(1997) 1775–1780. [53] D. Weber, H. Kexel, H.L. Schmidt, J. Agric. Food Chem. 45[25] K. Grob, in: Making and Manipulating Capillary Columns (1997) 2042–2046.
¨for Gas Chromatography, Huthig, Heidelberg, 1986, p. 193. [54] D. Weber, A. Rossmann, S. Schwarz, H.L. Schmidt, Z.[26] S. Nitz, B. Weinreich, F. Drawert, J. High Resolut. Chroma- Lebensm. Unters. Forsch. A 205 (1997) 158–164.
togr. 15 (1992) 387–391. [55] M.J. Dennis, R.C. Massey, T. Bigwood, Analyst 119 (1994)[27] H. Casabianca, J.B. Graff, P. Jame, C. Perruchietti, M. 2057–2060.
Chastrette, J. High Resolut. Chromatogr. 18 (1995) 279– [56] S.E. Woodbury, R.P. Evershed, J.B. Rossell, R.E. Griffith, P.285. Farnell, Anal. Chem. 67 (1995) 2685–2690.
[28] D. Juchelka, T. Beck, H. Hener, F. Dettmar, A. Mosandl, J. [57] S.E. Woodbury, R.P. Evershed, J.B. Rossell, J. Am. OilHigh Resolut. Chromatogr. 21 (1998) 145–151. Chem. Soc. 75 (1998) 371–379.
[29] S.E. Woodbury, R.P. Evershed, J.B. Rossel, J. Chromatogr. A [58] S. Kelly, I. Parker, M. Sharman, J. Dennis, I. Goodall, Food805 (1998) 249–257. Chem. 59 (1997) 181–186.
[30] K.J. Goodman, Anal. Chem. 70 (1998) 833–837. [59] F. Angerosa, L. Camera, S. Cumitini, G. Gleixner, F.[31] G. Rieley, J.W. Collister, B. Stern, G. Eglinton, Rapid Reniero, J. Agric. Food Chem. 45 (1997) 3044–3048.
Commun. Mass Spectrom. 7 (1993) 488–491. [60] M. Desage, R. Guilluy, J.L. Brazier, H. Chaudron, J. Girard,[32] J.W. Collister, G. Rieley, B. Stern, G. Eglinton, B. Fry, Org. H. Cherpin, J. Jumeau, Anal. Chim. Acta 247 (1991) 249–
Geochem. 21 (1994) 619–627. 254.[33] Y.X. Liang, W.S. White, L.H. Yao, R.E. Serfass, J. Chroma- [61] F. Mas, B. Beemsterboer, A.C. Veltkamp, A.M.A. Verweij,
togr. A 800 (1998) 51–58. Forensic Sci. Int. 71 (1995) 225–231.[34] H.J. Lockheart, P.F. Van Bergen, R.P. Evershed, Org. Geo- [62] M. Becchi, R. Aguilera, Y. Farizon, M.M. Flament, H.
chem. 26 (1997) 137–153. Casabianca, P. James, Rapid Commun. Mass Spectrom. 8[35] A. Bernreuther, J. Koziet, P. Brunerie, G. Krammer, N. (1994) 304–308.
Christoph, P. Schreier, Z. Lebensm. Unters. Forsch. 191 [63] R. Aguilera, M. Becchi, H. Casabianca, C.K. Hatton, D.H.(1990) 299–301. Catlin, B. Starcevic, H.G. Pope, J. Mass Spectrom. 31 (1996)
[36] A. Mosandl, U. Hener, H.-G. Schmarr, M. Rautenschlein, J. 169–176.High Resolut. Chromatogr. 13 (1990) 528–531. [64] C.H.L. Shackleton, A. Phillips, T. Chang, Y. Li, Steroids 62
[37] R. Braunsdorf, U. Hener, S. Stein, A. Mosandl, Z. Lebensm. (1997) 379–387.Unters. Forsch. 197 (1993) 137–141. [65] C.H.L. Shackleton, E. Roitman, A. Phillips, T. Chang,
[38] A. Mosandl, Food. Rev. Int. 11 (1995) 597–664. Steroids 62 (1997) 665–673.[39] U. Hener, S. Faullhaber, P. Kreis, A. Mosandl, Pharmazie 50 [66] R. Aguilera, M. Becchi, L. Mateus, M.A. Popot, Y. Bonnaire,
(1995) 60–62. H. Casabianca, C.K. Hatton, J. Chromatogr. B 702 (1997)[40] C. Frank, A. Dietrich, U. Kremer, A. Mosandl, J. Agric. 85–91.
Food Chem. 43 (1995) 1634–1637. [67] D.M. Jones, J.F. Carter, G. Eglinton, E.J. Jumeau, C.S.Fenwick, Biol. Mass Spectrom. 20 (1991) 641–646.[41] D. Juchelka, A. Mosandl, Pharmazie 51 (1996) 417–422.

370 W. Meier-Augenstein / J. Chromatogr. A 842 (1999) 351 –371
[68] V. Hauke, R. Graff, P. Wehrung, J.M. Trendel, P. Albrecht, A. [96] M. Uzaki, K. Yamada, R. Ishiwatari, Geochem. J. 27 (1993)Riva, G. Hopfgartner, F.O. Gulacar, A. Buchs, P.A. Eakin, 385–389.Geochim. Cosmochim. Acta 56 (1992) 3595–3602. [97] L. Mansuy, R.P. Philp, J. Allen, Environ. Sci. Technol. 31
[69] M.E.C. Moers, D.M. Jones, P.A. Eakin, A.E. Fallick, H. (1997) 3417–3425.Griffiths, S.R. Larter, Org. Biochem. 20 (1993) 927–933. [98] B. Jovancicevic, L. Tasic, H. Wehner, E. Faber, N. Susic, P.P.
[70] R. Ishiwatari, M. Uzaki, K. Yamada, Org. Geochem. 21 Polic, Fresenius Environ. Bull. 6 (1997) 11–12.(1994) 801–808. [99] L.M. Dowling, C.J. Boreham, J.M. Hope, A.P. Murray, R.E.
[71] A.J. Bakel, P.H. Ostrom, N.E. Ostrom, Org. Geochem. 21 Summons, Org. Geochem. 23 (1995) 729–737.(1994) 595–602. [100] M. Whittaker, S.J.T. Pollard, T.E. Fallick, Environ. Tech-
[72] M. Bjoroy, P.B. Hall, R.P. Moe, Org. Geochem. 22 (1994) nol. 16 (1995) 1009–1033.355–381. [101] M. Whittacker, S.J.T. Pollard, A.E. Fallick, T. Preston,
[73] Y.S. Huang, R. Bol, D.D. Harkness, P. Ineson, G. Eglington, Environ. Pollut. 94 (1996) 195–203.Org. Geochem. 24 (1996) 273–287. [102] C. Mcrae, G.D. Love, I.P. Murray, C.E. Snape, A.E. Fallick,
[74] K.J. Ficken, K.E. Barber, G. Eglinton, Org. Geochem. 28 Anal. Commun. 33 (1996) 331–333.(1998) 217–237. [103] V.P. O’Malley, A. Starck, T.A. Abrajano, J. Hellou, L.
[75] M. Bjoroy, K. Hall, P. Gillyon, J. Jumeau, Chem. Geol. 93 Winsor, Polycycl. Aromat. Comp. 9 (1996) 93–100.(1991) 13–20. [104] D.C. Ballentine, S.A. Macko, V.C. Turekian, W.P. Gilhooly,
[76] A. Wilhelms, S.R. Larter, K. Hall, Org. Geochem. 21 (1994) B. Martincigh, Org. Geochem. 25 (1996) 97–104.751–760. [105] M.I. Bird, R.E. Summons, M.K. Gagan, Z. Roksandic, L.
[77] E. Lichtfouse, H. Budzinski, P. Garrigues, T.I. Eglinton, Org. Dowling, J. Head, L.K. Fifield, R.G. Cresswell, D.P.Geochem. 26 (1997) 353–359. Johnson, Geochim. Cosmochim. Acta 59 (1995) 2853–
[78] S.A. Macko, M.H. Engel, Y.R. Qian, Chem. Geol. 114 2857.(1994) 365–379. [106] H. Naraoka, K. Yamada, R. Ishiwatari, Geochem. J. 29
[79] J.A. Silfer, Y. Qian, S.A. Macko, M.H. Engel, Org. Geo- (1995) 189–195.chem. 21 (1994) 603–609. [107] H. Demmelmair, U. Vonschenck, E. Behendt, T. Sauerwald,
[80] M.H. Engel, S.A. Macko, Y. Qian, J.A. Silfer, Adv. Space B. Koletzko, J. Paediatr. Gastroenterol. Nutr. 21 (1995)Res. 15 (1994) 99–106. 31–36.
[81] J. Pulchan, T.A. Abrajano, R. Helleur, J. Anal. Appl. Pyrol. [108] V.P. Carnielli, D.J.L. Wattimena, I.H.T. Luijendijk, A.42 (1997) 135–150. Boerlage, H.J. Degnhart, P.J.J. Sauer, Paediatr. Res. 40
[82] K.H. Freeman, J.M. Hayes, J.M. Trendel, P. Albrecht, Nature (1996) 169–174.343 (1990) 254–256. [109] V.P. Carnielli, E.J. Sulkers, C. Moretti, J.L.D. Wattimena,
[83] E. Lichtfouse, G. Berthier, S. Houot, E. Barriuso, V. Ber- J.B. Vangoudoever, H.J. Degenhart, F. Zacchello, P.J.J.gheaud, T. Vallaeys, Org. Geochem. 23 (1995) 849–852. Sauer, Metabolism 43 (1994) 1287–1292.
[84] G.A. Logan, J.M. Hayes, G.B. Hieshima, R.E. Summons, [110] J. Koziet, P. Gross, G. Debry, M.J. Royer, Biol. MassNature 376 (1995) 53. Spectrom. 20 (1991) 777–782.
[85] R.P. Evershed, K.I. Arnot, J. Collister, G. Eglinton, S. [111] C.C. Metges, K. Kempe, G. Wolfram, Biol. Mass Spectrom.Charters, Analyst 119 (1994) 909–914. 23 (1994) 295–301.
[86] R.P. Evershed, A.W. Stott, A. Raven, S.N. Dudd, S. Charters, [112] C. Binnert, M. Laville, C. Pachiaudi, V. Rigalleau, M.A. Leyden, Tetrahedron Lett. 36 (1995) 8875–8878. Beylot, Lipids 30 (1995) 869–873.
[87] A.M. Raven, P.F. Bergen, A.W. Stott, S.N. Dudd, R.P. [113] M. Stolinski, J.L. Murphy, A.E. Jones, A.A. Jackson, S.A.Evershed, J. Anal. Appl. Pyrol. 40–41 (1997) 267–285. Wootton, Lipids 32 (1997) 337–340.
[88] R.P. Evershed, H.R. Mottram, S.N. Dudd, S. Charters, A.W. [114] Z.K. Guo, S. Nielsen, B. Burguera, M.D. Jensen, J. LipidStott, G.J. Lawrence, A.M. Gibson, A. Conner, P.W. Blin- Res. 38 (1997) 1888–1895.khorn, V. Reeves, Naturwissenschaften 84 (1997) 402–406. [115] Z.K. Guo, M.D. Jensen, J. Appl. Physiol. 84 (1998) 1674–
[89] K. O’Donoghue, A. Clapham, R.P. Evershed, T.A. Brown, 1679.Proc. Roy. Soc. London B 263 (1996) 541–547. [116] N. Brossard, C. Pachiaudi, M. Croset, S. Normand, J.
[90] A.W. Stott, R.P. Evershed, N. Tuross, Org. Geochem. 26 Lecerf, V. Chirouze, J.P. Riou, J.L. Tayot, M. Lagarde,(1997) 99–103. Anal. Biochem. 220 (1994) 192–199.
[91] A.W. Stott, R.P. Evershed, Anal. Chem. 68 (1996) 4402– [117] R.C. Sheaff, H.M. Su, L.A. Keswick, J.T. Brenna, J. Lipid4408. Res. 36 (1995) 998–1008.
[92] R.P. Evershed, S.J.Vaughan, S.N. Dudd, J.S. Soles, Antiquity [118] M. Croset, N. Brossard, C. Pachiaudi, S. Normand, J.71 (1997) 979–985. Lecerf, V. Chirouze, J.P. Riou, J.L. Tayot, M. Lagarde,
[93] Y.Q. Zeng, H. Mukai, H. Bandow, Y. Nojiri, Anal. Chim. Lipids 31 (1996) S109–115.Acta 289 (1994) 195–204. [119] H. Demmelmair, T. Sauerwald, B. Koletzko, T. Richter,
[94] S.A. Baylis, K. Hall, E.J. Jumeau, Org. Geochem. 21 (1994) Eur. J. Paediatr. 156 (1997) S70–74.777–785. [120] N. Brossard, M. Croset, S. Normand, J. Pousin, J. Lecerf,
[95] D.A. Merrittt, J.M. Hayes, D.J. DesMarais, J. Geophys. Res. M. Laville, J.L. Tayot, M. Lagarde, J. Lipid Res. 38 (1997)100 (1995) 1317–1326. 1571–1582.

W. Meier-Augenstein / J. Chromatogr. A 842 (1999) 351 –371 371
[121] S.C. Cunnane, G. Moine, S.S. Likhodii, J.Vogt, T.N. Corso, [142] T. Preston, C. Slater, Proc. Nutr. Soc. 53 (1994) 363–372.J.T. Brenna, H. Demmelmair, B. Koletzko, K.H. Tovar, G. [143] D.A. Merritt, J.M. Hayes, J. Am. Soc. Mass Spectrom. 5Kohn, G. Sawatzki, R. Muggli, Lipids 32 (1997) 211–217. (1994) 387–397.
[122] S. Tissot, S. Normand, R. Guilluy, C. Pachiaud, M. Beylot, [144] D. Hoffmann, K. Jung, H.J. Segschneider, M. Gehre, G.M. Laville, R. Cohen, R. Mornex, J.P. Roiu, Diabetologica Schuurmann, Isotopes Environ. Health Stud. 31 (1995)33 (1990) 449–456. 267–375.
[123] B.J. Jandrain, N. Pallikarakis, S. Normand, F. Pirnay, M. [145] H.J. Segschneider, D. Hoffmann, G. Schmidt, R. Russon,Lacroix, F. Mosora, C. Pachiaudi, J.F. Gautier, A.J. Scheen, Isotopes Environ. Health Stud. 31 (1995) 315–325.J.P. Riou, P.J. Lebebvre, J. Appl. Physiol. 74 (1993) 2146– [146] C.C. Metges, K.J. Petzke, U. Hening, J. Mass Spectrom. 312154. (1996) 367–376.
[124] C. Rambal, C. Pachiaudi, S. Normand, J.P. Riou, P. Louisot, [147] T. Preston, K.C.H. Fearon, D.C. McMillan, F.P. Winstanley,A. Martin, Carbohydr. Res. 236 (1992) 29–37. C. Slater, A. Shenkin, D.C. Carter, Br. J. Surg. 82 (1995)
[125] C. Rambal, C. Pachiaudi, S. Normand, J.P. Riou, P. Louisot, 229–234.A. Martin, Ann. Nutr. Metab. 39 (1995) 143–151. [148] C.L. Williams, T. Preston, M. Hossack, C. Slater, K.E.L.
[126] F. Pont, L. Duvillard, C. Maugeais, A. Athias, L. Persegol, McColl, FEMS Immunol. Med. Microb. 13 (1996) 87–94.P. Gambert, B. Verges, Anal. Biochem. 248 (1997) 277– [149] I.A. Simpson, R. Bol, S.J. Dockrill, K.J. Peteke, R.P.287. Evershed, Archaeol. Prospect. 4 (1997) 147–152.
[127] J.E.H. Bunt, L.J. Zimmermann, J.L.D. Wattimena, R.H. [150] C.C. Metges, K.J. Petzke, Anal. Biochem. 247 (1997)VanBeek, P.J. Sauer, V.P. Carnielli, Am. J. Resp. Crit. Care 158–164.Med. 157 (1998) 810–814. [151] P.D. Brooks, G.J. Atkins, Isotopenpraxis 28 (1992) 106–
[128] M. Beylot, F. David, Y. Khalfallah, S. Normand, V. Large, 109.H. Brunengraber, Biol. Mass Spectrom. 23 (1994) 510– [152] A. Barrie, S.T. Brookes, S.J. Prosser, S. Debney, Fertil.513. Res. 42 (1995) 43–59.
[129] W.D. Kloppenburg, B.G. Wolthers, F. Stellaard, H. Elzinga, [153] M.J. Rennie, W. Meier-Augenstein, P.W. Watt, A. Patel, I.S.T. Tepper, P.E. DeJong, R.M. Huisman, Clin. Sci. 93 Begley, C.M. Scrimgeour, Biochem. Soc. Trans. 24 (1996)(1997) 73–80. 927–932.
[130] W. Meier-Augenstein, D. Rating, G.F. Hoffmann, U. Wen- [154] W.A. Brand, A.R. Tegtmeyer, A. Hilkert, Org. Geochem.del, U. Matthiesen, O. Schadewaldt, Isotopes Environ. 21 (1994) 585–594.Health Stud. 31 (1995) 261–266. [155] U. Hener, W.A. Brand, A.W. Hilkert, D. Juchelka, A.
[131] D.J. Reijngoud, G. Hellstern, H. Elzinga, M.G. De Sain- Mosandl, F. Podebrand, Z. Lebensm. Unters. Forsch. A 206Vander, A. Okken, F. Stellaard, J. Mass Spectrom. 33 (1998) 230–232.(1998) 621–626. [156] G.D. Farquhar, B.K. Henry, J.M. Styles, Rapid Commun.
[132] W.H. Hartl, H. Demmelmair, K.W. Jaunch, H.L. Schmidt, Mass Spectrom. 11 (1997) 1554–1560.B. Koletzko, F.W. Schildberg, Am. J. Physiol. Endocrinol. [157] I. Begley, C. Scrimgeour, Anal. Chem. 69 (1997) 1530–Metab. 35 (1997) E796–802. 1535.
[133] W.H. Hartl, H. Demmelmair, K.W. Jaunch, B. Koletzko, [158] I. Begley, C. Scrimgeour, Rapid Commun. Mass Spectrom.F.W. Schildberg, Ann. Surg. 227 (1998) 390–397. 10 (1996) 969–973.
[134] R. Roscher, A. Hilkert, M. Gessner, E. Schindler, P. [159] S.J. Prosser, C. Scrimgeour, Anal. Chem. 67 (1995) 1992–Schreier, W. Schwab, Z. Lebensm. Unters. Forsch. A 204 1997.(1997) 198–201.
[160] Hydra-GC, Technical Brochure H/7 /98, Crewe, Europa[135] J.T. Brenna, T.N. Corso, H.J. Tobias, R.J. Caimi, Mass
Scientific, UK.Spectrom. Rev. 16 (1997) 227–258.
[161] H.J. Tobias, J.T. Brenna, Anal. Chem. 68 (1996) 3002–[136] K.J. Goodman, J.T. Brenna, Anal. Chem. 64 (1992) 1088–
3007.1095.
[162] H.J. Tobias, J.T. Brenna, Anal. Chem. 69 (1997) 3148–[137] Z.K. Guo, A.H. Luke, W.P. Lee, D. Schoeller, Anal. Chem.
3152.65 (1993) 1954–1959.
[163] H.J. Tobias, K.J. Goodman, C.E. Blacken, J.T. Brenna,[138] S.K. Rhee, H.M. Su, L.A. Keswick, J.T. Brenna, Am. J.
Anal. Chem. 67 (1995) 2486–2492.Clin. Nutr. 65 (1997) 451–458.
[164] T. Weilacher, G. Gleixner, H.L. Schmidt, Phytochemistry[139] C. Menand, E. Pouteau, S. Marchini, P. Maugere, M.
41 (1996) 1073–1077.Krempf, D. Darmaun, J. Mass Spectrom. 32 (1997) 1094–
[165] T.N. Corso, J.T. Brenna, Proc. Natl. Acad. Sci. USA 941099.(1997) 1049–1053.[140] G. Dube, A. Henrion, W. Richter, Metrologia 34 (1997)
[166] A.R. Newman, Anal. Chem. 68 (1996) 373A–377A.83–86.[141] G. Dube, A. Henrion, R. Ohlendorf, W. Richter, Rapid
Commun. Mass Spectrom. 12 (1998) 28–32.