review and approval statement - dtic
TRANSCRIPT

�

�
REVIEW AND APPROVAL STATEMENT
AFCCC/CCD-06/007, Venezuela—A Full-Year Study, has been reviewed and is approved for public release. There is no objection to unlimited distribution of this document to the public at large, or by the Defense Techni-cal Information Center (DTIC) to the National Technical Information Service (NTIS).
SYLVIA C. TAYLOR, Lt Col, USAFDirector of Operations
John D. GrayScientific and Technical InformationProgram Manager
Technical editing, page design and layout, and graphics contributed by Mr. H. Gene Newman.

�Standard Form 298 (Rev. 8/98)
REPORT DOCUMENTATION PAGE
Prescribed by ANSI Std. Z39.18
Form Approved OMB No. 0704-0188
The public reporting burden for this collection of information is estimated to average 1 hour per response, including the time for reviewing instructions, searching existing data sources,gathering and maintaining the data needed, and completing and reviewing the collection of information. Send comments regarding this burden estimate or any other aspect of this collection ofinformation, including suggestions for reducing the burden, to the Department of Defense, Executive Services and Communications Directorate (0704-0188). Respondents should be aware that notwithstanding any other provision of law, no person shall be subject to any penalty for failing to comply with a collection of information if it does not display a currently valid OMBcontrol number. PLEASE DO NOT RETURN YOUR FORM TO THE ABOVE ORGANIZATION.1. REPORT DATE (DD-MM-YYYY) 2. REPORT TYPE 3. DATES COVERED (From - To)
4. TITLE AND SUBTITLE 5a. CONTRACT NUMBER
5b. GRANT NUMBER
5c. PROGRAM ELEMENT NUMBER
5d. PROJECT NUMBER
5e. TASK NUMBER
5f. WORK UNIT NUMBER
6. AUTHOR(S)
7. PERFORMING ORGANIZATION NAME(S) AND ADDRESS(ES) 8. PERFORMING ORGANIZATIONREPORT NUMBER
9. SPONSORING/MONITORING AGENCY NAME(S) AND ADDRESS(ES) 10. SPONSOR/MONITOR'S ACRONYM(S)
11. SPONSOR/MONITOR'S REPORTNUMBER(S)
12. DISTRIBUTION/AVAILABILITY STATEMENT
13. SUPPLEMENTARY NOTES
14. ABSTRACT
15. SUBJECT TERMS
16. SECURITY CLASSIFICATION OF:a. REPORT b. ABSTRACT c. THIS PAGE
17. LIMITATION OFABSTRACT
18. NUMBER OFPAGES
19a. NAME OF RESPONSIBLE PERSON
19b. TELEPHONE NUMBER (Include area code)
15 Sep 2006 Country Climatology Digest
Venezuela-A Full-Year Study
Mrs. Melody Higdon
Air Force Combat Climatology Center151 Patton Avenue Room 120Asheville NC 28801
AFCCC/CCD-06/007
Approved for public release; distribution is unlimited
This country climatology digest is a climatological study of Venezuela. After describing the geography and major meteorologicalfeatures of the entire region, the study discusses in detail the climatic controls of Venezuela's weather. Each "season" is defined anddiscussed in considerable detail with emphasis on general weather, hazards, clouds, visibility, winds, precipitation and temperature.
CLIMATOLOGY, METEOROLOGY, WEATHER, GEOGRAPHY, TOPOGRAPHY, CLOUDS, SKY COVER, WINDSTEMPERATURE, ATMOSPHERIC PRESSURE, PRECIPITATION, VISIBILITY, VENEZUELA, SOUTH AMERICA
U U U U 37
H. Gene Newman
(828) 271-4218
Reset
�
TABLE OF CONTENTS
CONVENTIONS ..............................................................................................................................6
LIMITATIONS ..................................................................................................................................6
TERRAIN ........................................................................................................................................6
CLIMATE OVERVIEW ....................................................................................................................8
DRY SEASON (DECEMBER - APRIL) ..........................................................................................�0 General Weather ................................................................................................................�0 Sky Cover ...........................................................................................................................�� Visibility ...............................................................................................................................�5 Winds ..................................................................................................................................�7 Precipitation ........................................................................................................................�9 Temperature .......................................................................................................................�0
WET SEASON (MAY - NOVEMBER) ............................................................................................�� General Weather ................................................................................................................�� Sky Cover ...........................................................................................................................�6 Visibility ...............................................................................................................................�8 Winds ..................................................................................................................................�0 Precipitation ........................................................................................................................�� Temperature .......................................................................................................................��
BIBLIOGRAPHY ............................................................................................................................�7

5
FIGURESFigure �a. Terrain Map of Venezuela .......................................................................................................6Figure �b. Provinces of Venezuela ..........................................................................................................7Figure �. General Low-Level Positions of the NETWC ..........................................................................9Figure �a. Positions of the NEWTC by Month from December through February ...................................��Figure �b. Positions of the NEWTC by Month from March through May .................................................��Figure �. January General Wind Flow Over Venezuela .........................................................................��Figure 5. Progression of a Northern Hemisphere Cold (Polar) Surge ...................................................��Figure 6a. January Percent Frequency of Occurrence of Ceilings Below �5,000 feet ............................��Figure 6b. January Percent Frequency of Occurrence of Ceilings Below �0,000 feet ............................��Figure 6c. January Percent Frequency of Occurrence of Ceilings Below �,000 feet ..............................��Figure 6d. January Percent Frequency of Occurrence of Ceilings Below �,000 feet ..............................�5Figure 7a. January Percent Frequency of Occurrence of Visibility Below 7 miles (��,000 meters) ......................................................................................................................�5Figure 7b. January Percent Frequency of Occurrence of Visibility Below � miles, (�,800 meters) ........................................................................................................................�6Figure 7c. January Percent Frequency of Occurrence of Visibility Below � mile (�,600 meters) ........................................................................................................................�6Figure 7d. January Mean Fog Days ........................................................................................................�7Figure 8. January Mean Upper-Level Wind Roses for Maracay, Venezuela .........................................�8Figure 9a. January Mean Monthly Precipitation ......................................................................................�9Figure 9b. January Mean Precipitation Days ...........................................................................................�9Figure �0a. January Mean High Temperatures .........................................................................................�0Figure �0b. January Extreme High Temperatures .....................................................................................�0Figure �0c. January Days with Temperatures at or above 90F (��C) .......................................................��Figure �0d. January Mean Low Temperatures ..........................................................................................��Figure �0e. January Extreme Low Temperatures ......................................................................................��Figure ��a. Month-by-Month Mean Positions of the NETWC in June through August ..............................��Figure ��b. Month-by-Month Mean Positions of the NETWC in September through November ..............��Figure ��. July General Wind Flow Over Venezuela ...............................................................................��Figure ��. Day by Day Progression of Trade Wind Surges .....................................................................��Figure ��. Progression of a Southern Cold (Polar) Surge .......................................................................��Figure �5a. July Percent Frequency of Occurrence of Ceilings Below �5,000 feet ...................................�6Figure �5b. July Percent Frequency of Occurrence of Ceilings Below �0,000 feet ...................................�7Figure �5c. July Percent Frequency of Occurrence of Ceilings Below �,000 feet .....................................�7Figure �5d. July Percent Frequency of Occurrence of Ceilings Below �,000 feet .....................................�8Figure �6a. July Percent Frequency of Occurrence of Visibility Below 7 miles (��,000 meters) ...............�8Figure �6b. July Percent Frequency of Occurrence of Visibility Below � miles, (�,800 meters) ................�9Figure �6c. July Percent Frequency of Occurrence of Visibility Below � mile (�,600 meters) ..................�9Figure �6d. July Mean Fog Days ...............................................................................................................�0Figure �7. July Mean Upper-Level Wind Roses for Maracay, Venezuela ................................................�� Figure �8a. July Mean Monthly Precipitation .............................................................................................��Figure �8b. July Mean Precipitation Days .................................................................................................��Figure �8c. July Mean Thunderstorm Days ...............................................................................................��Figure �9a. July Mean High Temperatures ................................................................................................��Figure �9b. July Extreme High Temperatures ...........................................................................................�5Figure �9c. July Days with Temperatures at or Above 90F (��C) .............................................................�5Figure �9d. July Mean Low Temperatures .................................................................................................�6Figure �9e. July Extreme Low Temperatures ............................................................................................�6

6
Venezuela—A Full-Year Study
CONVENTIONS. The spelling of place names and geographical features are those used by the National Geospatial-Intelligence Agency (NGA). All distances are in nautical miles (NM) and kilometers (km), except for visibility, which is in statute miles and meters. Elevations are in feet above mean sea level (MSL), with a metric equivalent following. Temperatures are in degrees Fahrenheit (F) and Celsius (C). Wind speeds are in knots. Cloud bases are above ground level (AGL) unless otherwise stated; tops, when provided, are above mean sea level. Precipitation amounts are in inches, with millimeter (mm) or centimeter (cm) equivalent following them. Precipitation values given are liquid equivalents unless stated otherwise. Any graphics provided to supplement the text will not include metric equivalents. Additionally, data shown in graphics for specific locations do not always represent overall conditions in complex terrain. Standard pressure levels are expressed in millibars (mb). Time is reported either in Universal Time Coordinated (UTC) (also known as Zulu or Z), or Local (L).
L I M I T A T I O N S . The graphics in this document are based on collections of observed data. This means that information shown in areas where there are no observation points is interpolated between existing points. In diverse terrain, therefore, the maps may not always accurately depict conditions in all areas. Mountainous terrain, especially at high elevations, rarely has data points for high elevation locations and valley locations within mountain ranges can not be representative of mountain conditions. They are, however, representative of valley
conditions. For more information on limitations in specific areas, contact AFCCC.
TERRAIN. Venezuela’s formal name is the Bolivarian Republic of Venezuela. It is a South American country on the Caribbean Sea, sandwiched between Colombia to the west and Guyana to the east. Brazil is at the southern border. Venezuela is a large country with diverse terrain. It has four main topographic regions: the Maracaibo lowlands in the northwest, the Cordillera de la Costa (in the north) that extends in a broad east to west arc along the Caribbean Sea, the Llanos (the Rio Orinoco basin), and the Guiana Highlands of the southeast (Haggerty, et al, �99�, wikipedia, �006). Figure �a is a terrain map of Venezuela. Figure �b shows the provinces of Venezuela.
The Maracaibo lowlands in the northwestern corner of Venezuela are in an oval basin bounded by mountains on three sides. The lowland basin opens to the Caribbean to the north through a narrow passage into
Figure 1a. Terrain Map of Venezuela.

7
the Gulf of Venezuela. The lowlands are surprisingly flat and slope gently upwards into the surrounding mountains. Lago de Maracaibo takes up much of the basin and southern lakeside areas are swampy. The surrounding mountains are all parts of the greater Andean Cordillera Oriental (eastern) range and the basin is where the range splits (Haggerty, et al, �99�) into two sub-branches.
The mountains that border the Caribbean Sea, the Cordillera de la Costa, are actually the northeastern extension of the Andean Cordillera Oriental. The range is interrupted by several major gaps that house most of Venezuela’s population, industry and agriculture. Some peaks in this range top ��,765 feet (�,500 meters). In the Caracas area, the coastal range is actually two parallel ridges with a broad gap between them. The valleys between these two ridges contain the densest population, the most agriculture and the best transportation networks in the country. Another wide gap separates the western section of the coastal range from the eastern section. The eastern section is a series of dissected hills and uplands that rise steeply from the coast. This section extends nearly to Trinidad (Haggerty, et al, �99�).
The discontinuous western portion of the coastal range is also known as the Segovia Highlands. Like the rest of the coastal highland areas, it is a jumble of hills and low mountains intermingled with valleys. On the western side of the Lago de Maracaibo, a limb of the Andes Mountains extends onto the Peninsula de la Guajira, most of which belongs to Colombia. Only the narrow, eastern coastal lowlands belong to Venezuela (Haggerty, et al, �99�).
The Llanos (the Orinoco plain or basin) extends from the southern foot of the Cordillera de la Costa to the slopes of the Guiana Highlands. Elevations in the Llanos do not exceed 655 feet (�00 meters) and the rise into the surrounding higher terrain is gradual. The Llanos is often flooded during the wet season as most of the rivers spread far beyond their banks during the wet season (May through November). North of Rio Apure, rivers that flow from the coastal mountains have carved shallow valleys in this otherwise flat terrain and have left eroded ridges that lend the land a gently rolling appearance. South of the Apure, the terrain flattens and elevations are lower (Haggerty, et al, �99�).
Figure 1b. Provinces of Venezuela.

8
Rio Orinoco is the largest river in the central drainage system of southern Venezuela and has been the principal transportation artery for many centuries. It ranges in width from about �,�00 feet (700 meters) to well over a mile (�,600 meters) across on the Venezuela-Colombia border. In times of flooding, the river expands greatly, to many times its normal width. Its edges blend into the surrounding terrain and can be difficult to discern in places. The banks are mostly stable and covered with thick vegetation. The central drainage area extends across northern Venezuela from the Colombian border eastward to the Atlantic Ocean. It is divided into three portions: the Orinoco delta, the northeastern highlands (along the coast just west of the Peninsula de Parta), and the Llanos (NIS 86; �960, Haggerty, et al, �99�) .
The Orinoco delta, which opens to the Atlantic Ocean, is a broad, flat, densely forested plain covered with swamps and marshes. It is crisscrossed by a maze of silt-laden streams and channels, which are distributaries of Rio Orinoco. More plainly, the Orinoco has many mouths that empty to the sea. Elevations remain close to sea level throughout the delta region and large areas are subject to frequent inundation. During the high-water period, mid-May through December, flooding is normal. August is generally when water levels peak. Major streams are at least �.5 feet (� meter) deep all year long and both widen and deepen considerably in the wet season. Main channels in the delta must be periodically dredged to maintain navigable depths (NIS 86; �960, Haggerty, et al, �99�).
The northeastern highland is a semi-arid area of only intermittent drainage. There are numerous small streams that are less than 60 feet (�8 meters) wide and �.5 feet (� meter) deep even at high water. Few of these support the Orinoco directly. Most streams and rivers flow through gorges and are dangerously swift during high water periods. Many are dry from January through April. High water occurs in May through December with the crest in late July through August (NIS 86; �960, Haggerty, et al, �99�).
The Llanos contain much of the middle and lower course of the Orinoco. It has its large left bank Venezuelan tributaries in its middle reaches and its right bank tributaries in its lower courses. The Orinoco varies from �,�00 to 8,000 feet (700 to �,��0 meters) wide in this area and is at least 7 feet (�.� meters) deep even in the dry season. Its main tributaries are at least 500 feet (�50 meters) wide in their middle and lower courses and at least �.5 feet (� meter) deep year-round.
Flooding is routine during high water periods and flow velocities can reach �5 feet (�.6 meters) per second in some streams. All the tributaries are silt and mud laden, particularly when the water is high. In places, they are flanked by marshes, lakes and ponds. Most meander in interlacing channels. High water peaks in June through August and the lowest water occurs in January and February (NIS 86; �960, Haggerty, et al, �99�).
One of the oldest land masses in South America, the Guiana Highlands (also seen as the Southern Highlands) is a highly dissected plateau that occupies nearly half of Venezuela. It rises abruptly from the Llanos immediately south and east of Rio Orinoco. The many swift Orinoco tributaries that flow from this region have deeply scored the plateau. The same erosion that carved deep valleys into the plateau has also created areas of abrupt cliffs and escarpments. This is especially spectacular in the Gran Sabana region of the highlands, where cliffs can be up to �,6�5 feet (800 meters high). Massive, flat-topped bluffs (called tepuis) rise high above the rolling surface of the Gran Sabana. Many of them reach considerable heights. The most famous tepui contains Angel Falls, the world’s highest waterfall. The Guiana Highlands are well watered year-round and are heavily forested (NIS 86, �960, Haggerty, et al, �99�, wikipedia, �006).
CLIMATE OVERVIEW. All year, to varying degrees, Venezuela is under the influence of the near equatorial trade wind convergence (NETWC), which is also called the equatorial trough, the northeast trade winds, or the southeast trade winds. The NETWC is discontinuous in the lower levels because of the mountains, but is continuous above the level of the Andean peaks. Figure � shows the general low-level positions of the NETWC.
The northeast trades persist along the Caribbean coast year-round and the NETWC shifts north and south with the sun, although southeasterly trades can occur there when the trough is at its extreme northernmost position. In general, the northeast (Northern Hemisphere) trades prevail over Venezuela during the warm and dry period of the year (December through April), and the southeast trades south of the NETWC dominate during the wet, cooler months of May through November. The two main seasons are called verano (summer) and invierno (winter). Verano represents the warm, dry season and invierno represents the cooler wet season (NIS 86, �956, HQ �WG, �96�, Moron, et al, �995, Pulwarty, et al, �998, Snow, �976, Walters, et al, �989)

9
Precipitation is not necessarily directly tied to the passage of the NETWC. It is as much of a transition zone between the northeast and southeast trades regimes as it is a firing point for instability precipitation. It produces enough instability for clusters of rain showers and thunderstorms to mark its passage, but the wet season is also associated with the southeasterly trades that advect in moisture from the Amazon basin. The southeasterly trades do not lose moisture as they flow over the Amazon basin. Through evapotranspiration (moisture released by vegetation), they remain as moist as they began over the Atlantic or gain moisture. Additionally, they are warmed over the land and become even more unstable (Gibson, �968, Henry, et al, �968 Snow, �976, Walters, et al, �989).
Even at locations that show the two-season pattern most clearly, other variables come into play to produce secondary wet and dry periods. The North Atlantic high (Bermuda/Azores high) shows a strong semi-annual oscillation in strength. The high is at its annual maximum strength in July and the secondary peak occurs in February. The difference for the Venezuelan climate is the location of the high. It is farthest south
in February and farthest north in July. The high has its least impact in November and April and is roughly in the same position at both times. This matters because the strength and position of the high determines the location of the NETWC. As the two subtropical highs (Bermuda/Azores and South Atlantic) shift north and south with the sun, the trough (NETWC) between them also shifts north and south. Its location determines when and where rainfall will occur. Usually the Northern Hemisphere summer period is the maximum rainfall period (NIS 86, �956, HQ �WG, �96�, Moron, et al, �995, Pulwarty, et al, �998, Snow, �976, Walters, et al, �989).
There are two basic rainfall distribution patterns in Venezuela: �. the Llanos pattern, which has a single peak wet period in Northern Hemisphere summer and a well-defined dry period in Northern Hemisphere winter; and �. the semi-annual rainfall pattern, which completes two oscillations between wet and dry periods over the course of a year. The Llanos pattern is characteristic of the entire central section of Venezuela and a large portion of the Guiana Highlands. The semi-annual pattern is most prevalent over the coast and
Figure 2. General Low-Level Positions of the NETWC.

�0
at elevations above �,000 feet (9�5 meters) in the mountains (NIS 86, �956, HQ �WG, �96�, Moron, et al, �995, Pulwarty, et al, �998, Snow, �976, Walters, et al, �989).
Within the larger annual wet and dry seasons, Venezuela has three basic climate zones based on terrain alone: �. tierra caliente (hot land), which extends from sea-level to �,000 feet (6�0 meters); �. tierra templada (temperate land), from �,000 to 7,500 feet (6�0 to �,�85 meters); and �. tierra fria (cold land), at or above 7,500 feet (�,�85 meters). The permanent snowline is typically around ��,500 feet (�,��0 meters) and snowfall is rare below ��,000 feet or �,000 meters (NIS 86, �956, HQ �WG, �96�, Pulwarty, et al, �998, Snow, �976, Walters, et al, �989).
Terrain features significantly alter large-scale patterns. For example, the coast is drier than interior locations during the wet season because the east to west oriented coastal mountains block the NETWC precipitation and the trade wind inversion that predominates in that area suppresses convective activity. The coastal mountains are close to the coast and aligned with the wind, so they confine the dry zone to the narrow coastal strip. Areas in the lee of blocking mountains, such as in the Maracaibo basin, experience the rain shadow effect. The basin is surrounded on three sides by mountains and is open only to the north. Despite this, local sources like Lago Maracaibo and mountain rivers that drain into the lake, provide enough moisture to produce some rainfall, so the basin is not a desert. That is in contrast with the peninsula on the eastern side of the Gulf of Venezuela. This is the driest part of Venezuela and desert vegetation dominates. In the mountains, windward slopes get enhanced precipitation because of orographic lifting and leeside slopes have reduced precipitation because of the leeside rain shadow effect. What constitutes a windward or leeward slope varies with the seasons. Generally, easterly flow (from northeasterly to southeasterly) is prevalent over Venezuela year-round, so these slopes typically have more rainfall than western slopes. Valleys and canyons are prone to nocturnal precipitation while ridges tend to get daytime rainfall (NIS 86, �956, HQ �WG, �96�, Pulwarty, et al, �998, Snow, �976, Walters, et al, �989).
Hurricanes can impact the coastal areas of Venezuela and even reach into the interior through the gaps in the coastal mountains. This does not occur every year. Most hurricanes move across the Caribbean north of Venezuela, however, a few have tracked right across
the coast (NIS 86, �956, NIS 8�&8�, �965, HQ �WG, �96�, Snow, �976, Walters, et al, �989).
For the purposes of this study, Venezuela has two seasons, wet and dry. The wet season is defined as May through November and the dry season is defined as December through April. The actual duration of the wet and dry seasons varies with location. The farther north a location is, the shorter the wet season is. The wet and dry seasons defined for this narrative are averaged for central Venezuela. On the central Orinoco plain, the wet season is from late April through the end of September. In southernmost Venezuela, the wet season begins in late March and lasts until December. The wet season on the southeastern slopes of the Cordillera de Merida also starts, mainly above the 5,000-foot (�,5�5-meter) elevation. The dry season there starts roughly in late September (NIS 86, �956, HQ �WG, �96�, Snow, �976, Walters, et al, �989).
The dry season is relative for much of the country as rainfall never completely stops and in southern areas, the difference between the two seasons is minimal. For most of Venezuela, there is sufficient moisture available locally year-round to produce at least sporadic rain showers and small thunderstorms due to day time heating and minor atmospheric instability. In the Guiana Highlands and the tropical rain forests of extreme southern Venezuela, both northeast trades and southeast trades penetrate into this area, so rainfall is more or less evenly distributed year-round. It is on the coast and in the central/northern Llanos that rainfall decreases sharply enough to clearly define wet and dry seasons.
DRY SEASON (DECEMBER THROUGH APRIL)
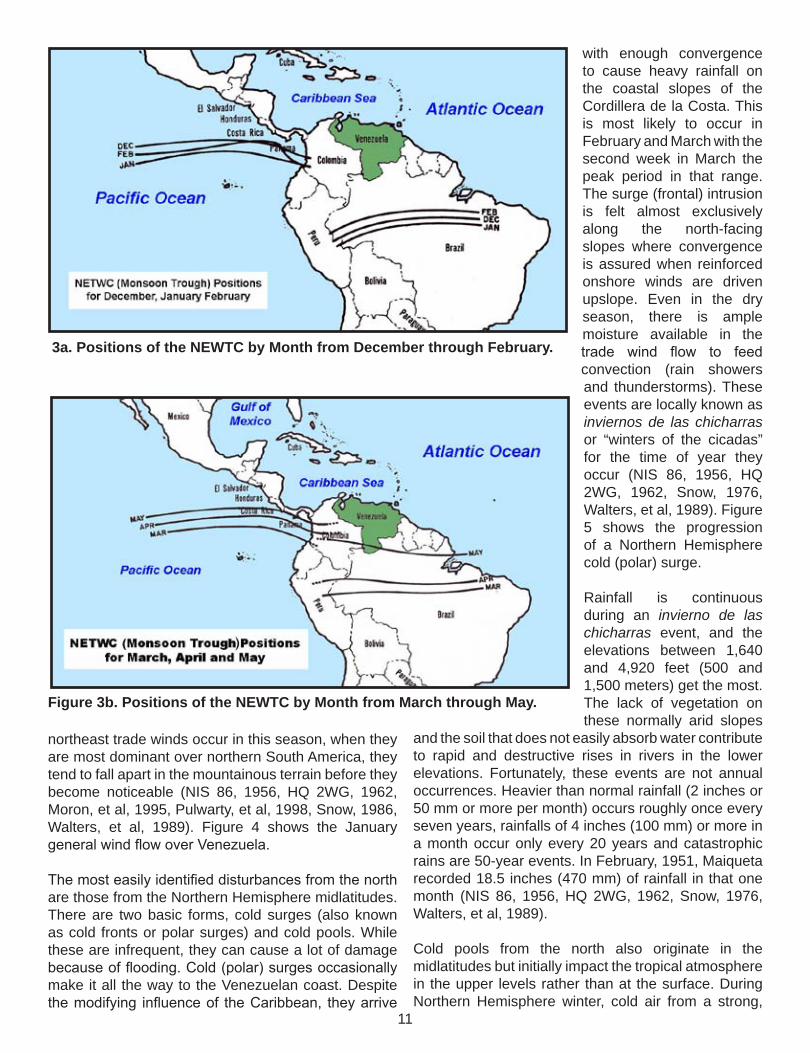
General Weather. This season is known as verano (summer) to Venezuelans because this is when temperatures are overall warmer and precipitation is less, considerably less in places, than in the wet season. The northeast trade winds dominate in this season as the Azores/Bermuda high and the NETWC are both at their farthest south positions. Figures �a and b show the positions of the NEWTC by month from December through February and March through May.
The trade winds are strong and steady out of the northeast and the trade wind inversion suppresses convection, which prevents thunderstorms and rain showers from forming. Disturbances can weaken or break down the inversion and allow some precipitation to occur. These disturbances include cold fronts and cold pools from the north. Although surges in the
��
northeast trade winds occur in this season, when they are most dominant over northern South America, they tend to fall apart in the mountainous terrain before they become noticeable (NIS 86, �956, HQ �WG, �96�, Moron, et al, �995, Pulwarty, et al, �998, Snow, �986, Walters, et al, �989). Figure � shows the January general wind flow over Venezuela.
The most easily identified disturbances from the north are those from the Northern Hemisphere midlatitudes. There are two basic forms, cold surges (also known as cold fronts or polar surges) and cold pools. While these are infrequent, they can cause a lot of damage because of flooding. Cold (polar) surges occasionally make it all the way to the Venezuelan coast. Despite the modifying influence of the Caribbean, they arrive
with enough convergence to cause heavy rainfall on the coastal slopes of the Cordillera de la Costa. This is most likely to occur in February and March with the second week in March the peak period in that range. The surge (frontal) intrusion is felt almost exclusively along the north-facing slopes where convergence is assured when reinforced onshore winds are driven upslope. Even in the dry season, there is ample moisture available in the trade wind flow to feed convection (rain showers and thunderstorms). These events are locally known as inviernos de las chicharras or “winters of the cicadas” for the time of year they occur (NIS 86, �956, HQ �WG, �96�, Snow, �976, Walters, et al, �989). Figure 5 shows the progression of a Northern Hemisphere cold (polar) surge.
Rainfall is continuous during an invierno de las chicharras event, and the elevations between �,6�0 and �,9�0 feet (500 and �,500 meters) get the most. The lack of vegetation on these normally arid slopes
and the soil that does not easily absorb water contribute to rapid and destructive rises in rivers in the lower elevations. Fortunately, these events are not annual occurrences. Heavier than normal rainfall (� inches or 50 mm or more per month) occurs roughly once every seven years, rainfalls of � inches (�00 mm) or more in a month occur only every �0 years and catastrophic rains are 50-year events. In February, �95�, Maiqueta recorded �8.5 inches (�70 mm) of rainfall in that one month (NIS 86, �956, HQ �WG, �96�, Snow, �976, Walters, et al, �989).
Cold pools from the north also originate in the midlatitudes but initially impact the tropical atmosphere in the upper levels rather than at the surface. During Northern Hemisphere winter, cold air from a strong,
3a. Positions of the NEWTC by Month from December through February.
Figure 3b. Positions of the NEWTC by Month from March through May.

��
deep trough in the westerlies becomes separated from the source and is carried into the tropics on the strong flow on the western side of the trough. The cold pool adds instability to the tropical upper atmosphere and may even develop downward into subtropical cyclones. Most cold pools do not make it all the way down to northern Venezuela, but a few do. They most impact the Cordilleras and the northern Llanos
in January through April. Cold pools effect Venezuela roughly every � years. The associated precipitation is intermittent, spotty, and typically in thunderstorms (NIS 86, �956, NIS 8�&8�, �965, HQ �WG, �96�, Snow, �976, Walters, et al, �989).
Cold pools from the south also cross Venezuela. These upper-level features occur in every month of the year.
Figure 4. January General Wind Flow Over Venezuela.
Figure 5. Progression of a Northern Hemisphere Cold (Polar) Surge.

��
They move from the Guiana Highlands northwestward and trigger heavy rain showers and some thunderstorms in the Llanos. In the dry season, rain showers predominate. These cold pools are associated with unorganized but very deep thunderstorms. It is currently thought that these southern cold pools originate in areas of organized convective activity over the Amazon basin and southern Guiana Highlands, through evaporative cooling (NIS 86, �956, HQ �WG, �96�, Snow, �976, Walters, et al, �989).
Sky Cover. Venezuela has few cloud-free days at any time of the year. The dry western coast has more clear days than anywhere else in Venezuela, but the remaining coastline has at least a little fair weather cumulus or stratocumulus even on the driest days. The position of a site relative to terrain features is an important determinant of cloud cover. The most cloud cover is typically over the windward mountain slopes of Venezuela. The Guiana Highlands generally has the most cloud cover year-round. Much of mountain cloudiness is created by orographic lifting of extremely moist air that persists year-round, so there is little seasonal change in cloud amounts. Where the maximum cloud cover occurs in the mountains depends on the wind direction. When the northeasterly trades hold sway, the northeastern slopes have the most cloud cover. When the southeasterly trades dominate, the southeastern slopes have the most clover. Leeward sites have less cloud cover, sometimes significantly less. An example of this is seen in the Maricaibo basin, where down slope winds into the basin curtail cloud cover on and below the interior (leeward) slopes of the Cordillera de Merida. It is only farther into the basin lowlands that local moisture sources support more cloud cover.
For the rest of Venezuela, cloud cover is less in the dry season than during the wet season,
but the cloud types tend to be the same year-round. Overall cloud tops tend to be mainly below 5,000 feet and much of the lowest cloud cover tops out below �,500 feet. Nocturnal low stratus forms in low areas, particularly in mountain valleys. In the lowlands, this stratus tends to be scattered at all hours, but mountain valleys tend toward broken to overcast conditions overnight and scattered conditions soon after sunrise. The stratus typically caps radiation inversions that set up overnight. Once the sun is up, the low clouds lift and dissipate even as the first cumulus and stratocumulus of the day forms. In this season, cumulus can grow into rain showers or small thunderstorms in the afternoons, but the clouds quickly break down and dissipate after sundown.
The exceptions to this daily scenario occur with thunderstorms fired by cold surges (or pools). These storms are larger than the average dry season isolated thunderstorms and tend to create multi-level cloud cover that spreads over a fairly large area. Figures 6a through d show the January percent frequency of occurrence of ceilings below �5,000 feet, �0,000 feet, �,000 feet and �,000 feet.
Figure 6a. January Percent Frequency of Occurrence of Ceilings Below 25,000 feet.

��
Figure 6b. January Percent Frequency of Occurrence of Ceilings Below 10,000 feet.
Figure 6c. January Percent Frequency of Occurrence of Ceilings Below 3,000 feet.

�5
Visibility. On the coast, salt haze and moist haze combine to at least slightly restrict visibility most of the time, but for most of Venezuela, visibility restrictions are generally caused by moist haze or fog. When fog occurs in the Llanos, it is often thin or in little rags that hang in the trees. This type quickly dissipates at sunrise. Mountain valley fog is often thicker and takes a little longer to lift and dissipate, especially if it is capped by low stratus. Rain can obscure visibility while it is falling. Thunderstorms can create heavy rainfall that decreases visibility directly below the storm cloud below a mile (�,600 meters) for a few minutes at a time. Smoke sometimes casts a pall over the air in the Llanos as local natives burn off grasses in preparation for the next wet season crops. Occasionally, these deliberately set fires get out of control and smoke is a problem over a very large area. Figures 7a through c show the January percent
frequency of occurrence of visibility below 7 miles (��,000 meters), � miles, (�,800 meters) and � mile (�,600 meters). Figure 7d shows the January mean number of fog days.
Figure 6d. January Percent Frequency of Occurrence of Ceilings Below 1,000 feet.
Figure 7a. January Percent Frequency of Occurrence of Visibility Below 7 miles (11,000 meters).

�6
Figure 7b. January Percent Frequency of Occurrence of Visibility Below 3 miles, (4,800 meters).
Figure 7c. January Percent Frequency of Occurrence of Visibility Below 1 mile (1,600 meters).

�7
Figure 7d. January Mean Fog Days.
Winds. The northeast trades predominate in this season. The local terrain has a significant effect on large-scale winds, particularly in places sheltered from the trades by mountain features. Upslope and down slope winds are important in the mountains. Land/sea breeze winds come into play both on the Caribbean coast and around Lake Maracaibo. In southern Venezuela, southeast trades alternate with northeast
trades at the start and end of the dry season as the NETWC moves north or south of an area. Regardless of which trade wind regime dominates in an area, large-scale flow has a generally easterly component. Strong winds are unusual even with thunderstorm down rush gusts. Figure 8 shows the January mean upper-level wind for Maracay, Venezuela.

�8
Figure 8. January Mean Upper-Level Wind Roses for Maracay, Venezuela.

�9
Precipitation. This is the relative dry season but that does not mean rainfall completely stops anywhere. The northern half of Venezuela, particularly in the Orinoco basin and along the coast, gets a noticeable rainfall decrease, but rain showers and even isolated thunderstorms continue to occur right through the season. Local moisture sources are plentiful enough to fuel small, local rain showers or thunderstorms in the afternoons. Southern Venezuela gets even less of a decrease in rainfall and can not be considered to have a true dry season. This is particularly true in the Guiana Highlands and the lowland areas along the Brazilian border. Figures 9a and b show the January mean precipitation statistics.
Figure 9a. January Mean Monthly Precipitation.
Figure 9b. January Mean Precipitation Days.
�0
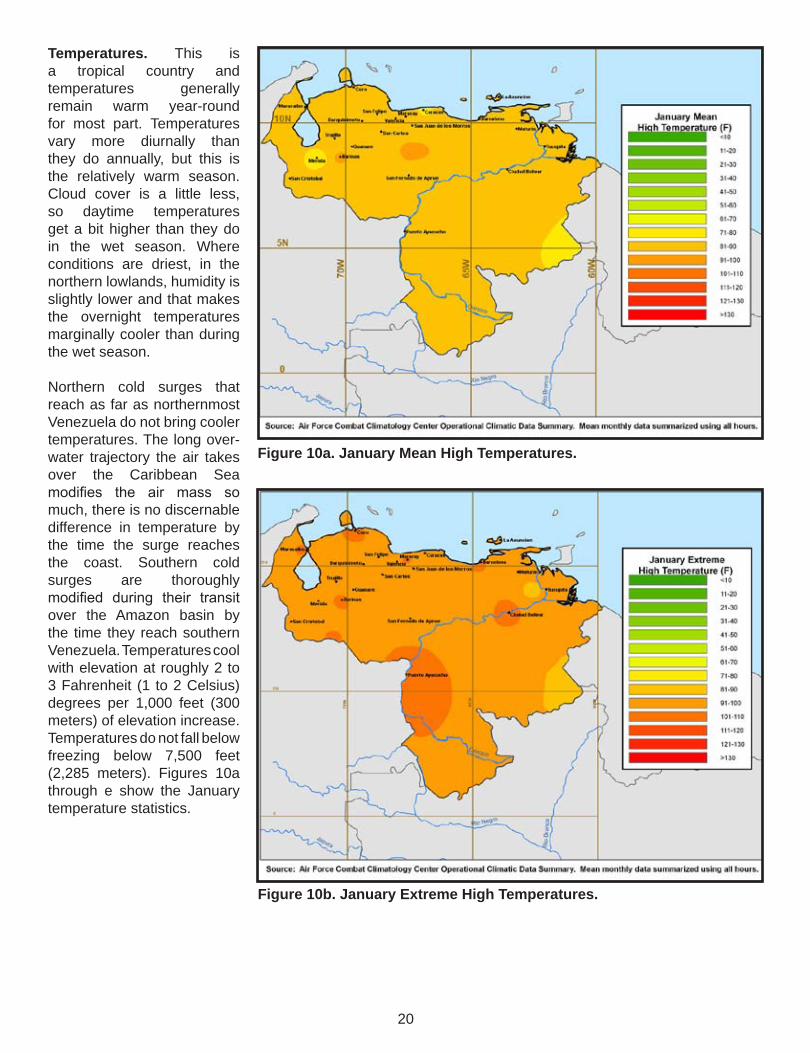
Temperatures. This is a tropical country and temperatures generally remain warm year-round for most part. Temperatures vary more diurnally than they do annually, but this is the relatively warm season. Cloud cover is a little less, so daytime temperatures get a bit higher than they do in the wet season. Where conditions are driest, in the northern lowlands, humidity is slightly lower and that makes the overnight temperatures marginally cooler than during the wet season.
Northern cold surges that reach as far as northernmost Venezuela do not bring cooler temperatures. The long over-water trajectory the air takes over the Caribbean Sea modifies the air mass so much, there is no discernable difference in temperature by the time the surge reaches the coast. Southern cold surges are thoroughly modified during their transit over the Amazon basin by the time they reach southern Venezuela. Temperatures cool with elevation at roughly � to � Fahrenheit (� to � Celsius) degrees per �,000 feet (�00 meters) of elevation increase. Temperatures do not fall below freezing below 7,500 feet (�,�85 meters). Figures �0a through e show the January temperature statistics.
Figure 10a. January Mean High Temperatures.
Figure 10b. January Extreme High Temperatures.

��
Figure 10c. January Days with Temperatures at or above 90F (32C).
Figure 10d. January Mean Low Temperatures.
��
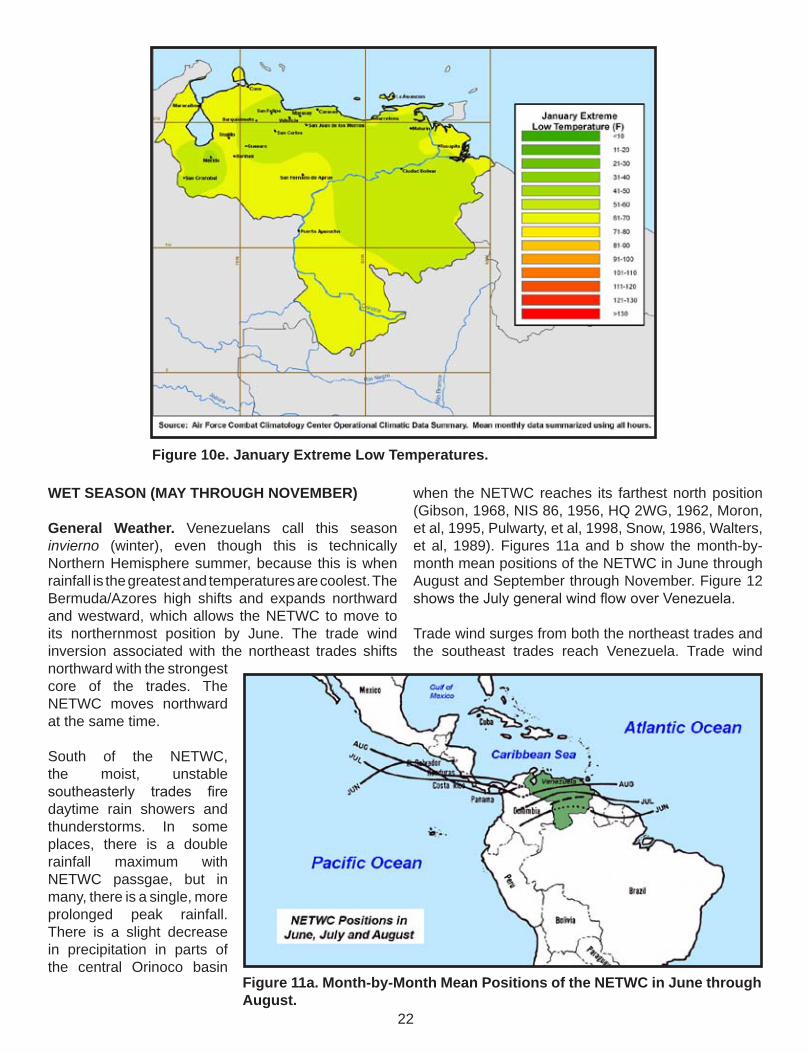
WET SEASON (MAY THROUGH NOVEMBER)
General Weather. Venezuelans call this season invierno (winter), even though this is technically Northern Hemisphere summer, because this is when rainfall is the greatest and temperatures are coolest. The Bermuda/Azores high shifts and expands northward and westward, which allows the NETWC to move to its northernmost position by June. The trade wind inversion associated with the northeast trades shifts northward with the strongest core of the trades. The NETWC moves northward at the same time.
South of the NETWC, the moist, unstable southeasterly trades fire daytime rain showers and thunderstorms. In some places, there is a double rainfall maximum with NETWC passgae, but in many, there is a single, more prolonged peak rainfall. There is a slight decrease in precipitation in parts of the central Orinoco basin
when the NETWC reaches its farthest north position (Gibson, �968, NIS 86, �956, HQ �WG, �96�, Moron, et al, �995, Pulwarty, et al, �998, Snow, �986, Walters, et al, �989). Figures ��a and b show the month-by-month mean positions of the NETWC in June through August and September through November. Figure �� shows the July general wind flow over Venezuela.
Trade wind surges from both the northeast trades and the southeast trades reach Venezuela. Trade wind
Figure 10e. January Extreme Low Temperatures.
Figure 11a. Month-by-Month Mean Positions of the NETWC in June through August.

��
Figure 11b. Month-by-Month Mean Positions of the NETWC in September through November.
Figure 12. July General Wind Flow Over Venezuela.

��
surges from either trade wind regime (northeast or southeast) originate as migratory highs that move toward the equator around the rim of a high behind a cold front. The cold front ahead of the high is the visible indicator of the surge. These highs are picked up by the trades and then are steered deep into the Amazon and Orinoco basins by the mountainous terrain of South America. Some surges in the southeasterly trades create enough of a convergence zone for squall lines to develop (Betts, et al, �976). Squall line thunderstorms travel in the same direction as the squall line itself, which follows the direction of the surge. Southeast trade surges mostly impact southern Venezuela, particularly the southern Guiana Highlands, but can reach well north into the Llanos (NIS 86, �956, HQ �WG, �96�, Snow, �986, Walters, et al, �989). Figure �� shows the day by day progression of trade wind surges over the region.
In a manner similar to their Northern Hemisphere counterparts, cold (polar) surges (also known as cold fronts) from the south reach Venezuela in July through September. Strong Antarctic polar surges often reach the equator and a few have been tracked to the southern slopes of the coastal mountains. There are at least two documented cases of southern hemisphere cold surges that made it into the southern Caribbean (Walters, et al, �989). The southern Guiana Highlands are the main areas affected by southern polar surges. Thunderstorm and rain shower activity in the highlands is greatly enhanced by these surges. In a few cases, even the Cordillera de Merida (in the west) and the southern slopes of the Cordillera de la Costa (northern coastal mountains) get intense thunderstorm activity. On rare occasions, a southern polar surge will push the NETWC all the way into the
Figure 13. Day by Day Progression of Trade Wind Surges.
Figure 14. Progression of a Southern Cold (Polar) Surge.
Caribbean. This enhances activity along the windward slopes and suppresses it along the leeward slopes. Warm, dry winds from these surges spill into leeward places like the Maracaibo basin, but local moisture sources quickly modify and destabilize them and convection results (NIS 86, �956, HQ �WG, �96�, Snow, �976, Walters, et al, �989). Figure �� shows the progression of a southern cold (polar) surge into Venezuela.
Cold pools from the south also cross Venezuela. These upper-level features move from the Guiana Highlands northwestward and trigger heavy rain showers and thunderstorms. In the wet season, thunderstorms predominate and clusters of activity can spread over the entire Llanos from the eastern slopes of the Cordillera

�5
de Merida to the Orinoco delta (NIS 86, �956, HQ �WG, �96�, Snow, �986, Walters, et al, �989).
It is a common misperception that it rains continuously or at least several times a day in the wet season. In reality, rain showers or thunderstorms hit once a day or less in most places and most of the accumulated rainfall occurs in just a few brief, heavy rain events, even in the Guiana Highlands. As much as 75 percent of rainfall in eastern Venezuela, for instance, occurs in just two or three relatively short-lived rain events for the entire season (Pulwarty, et al, �998, Snow, �976, Walters, et al, �989). The remaining �5 percent occurs in short rain showers or isolated thunderstorms. Thunderstorms are often huge in this season, yet are not typically severe because their warm cores reach to such great heights. They can produce prodigious amounts of rain in a very short period but do not produce large hail or tornadoes. Severe thunderstorms can occur, typically in association with either the NETWC convective mass or with trade wind surges (Gibson, �968, Henry, et al, �968, Pulwarty, et al, �998, Snow, �976, Walters, et al, �989).
Cold surges, cold pools and trade wind surges all have the potential to support the development of a mesoscale convective system (MCS) over Venezuela during the wet season. An MCS is a large thunderstorm or cluster of thunderstorms that develops the capacity to sustain itself for long periods of time. While a normal thunderstorm may persist only minutes, an MCS can last for hours or days at a time and produce prodigious amounts of rainfall. An MCS can spread cloud cover and rainfall over a very large area. An MCS is often the source of most of any one location’s total monthly precipitation (Gibson, �968, Henry, et al, �968, Pulwarty, et al, �998, Snow, �976, Walters, et al, �989).
There are areas of Venezuela that do not get much rain even in this season. The northern coast and the Maracaibo basin are drier than the rest of the country. The coast remains under the influence of the northeast trades most of the time. Since these winds parallel the coast, they tend to suppress precipitation except on the northeast-facing mountain slopes. The Maracaibo basin is relatively dry because the NETWC is blocked out of it by the surrounding mountains. Still, the basin has local moisture sources and is not completely dry. Upslope/down slope winds create convergence lines that are typically flash points for rain showers and thunderstorms in the basin. Additionally, Lake Maracaibo, with its swampy coastal areas, is so large, it supplies substantial moisture for land/sea breeze
rain showers and thunderstorms. The Caribbean coast also gets afternoon convection. These are associated with land/sea breeze convergence lines and produce spotty rain showers and isolated thunderstorms along the north-facing coastal mountain slopes. The exception is the peninsula on the eastern side of the Gulf of Venezuela, which is deeper in the northeast trade winds. This is the driest part of Venezuela and gets little rainfall even in the wet season (NIS 86, �956, HQ �WG, �96�, Moron, et al, �995, Pulwarty, et al, �998, Snow, �986, Walters, et al, �989).
Most hurricanes move westward well north of Venezuela but the coast is not completely immune to the effects of even relatively distant storms. Onshore circulation ahead of storms can bring rainfall to the north-facing mountain slopes and pour through the gaps in the mountains to affect the northern Llanos as well. A few hurricanes and tropical storms have tracked right along the Venezuelan coast before they have moved on to the west. They produce heavy rainfall on seaward slopes, which can produce devastating floods at lower elevations and along rivers. Storms that track along the Venezuela coast are very rare and average only one per century. Even the more distant hurricanes have a surprising effect on the Llanos inland of the coastal mountains. They pull in air from the south and create orographic convergence on the south-facing slopes of the coastal mountains, which creates heavier than normal rainfall on the mountains. This is most likely to produce heavy rainfall when a hurricane moves northwest of the peninsula on the eastern side of the Gulf of Venezuela, in other words, northwest of Venezuela (NIS 86, �956, NIS 8�&8�, �965, HQ �WG, �96�, Snow, �986, Walters, et al, �989).
Easterly waves that pass through the area every three to five 5 days are more common rain makers over the northeastern and north-central portions of the country. They are strongest in May through June and again in October and early November. In July through September, they are farther north in the Caribbean and have little to no impact on Venezuela. Although the rainfall they bring is small, it matters greatly in otherwise dry areas. Wherever terrain and waves converge, heavier precipitation is induced (NIS 86, �956, NIS 8�&8�, �965, HQ �WG, �96�, Snow, �986, Walters, et al, �989).
Note: Studies indicate there is a wet season teleconnective relationship between increased precipitation on the Venezuelan coast during the wet season and an El Nino event in the Pacific (Behrend (�987).
�6
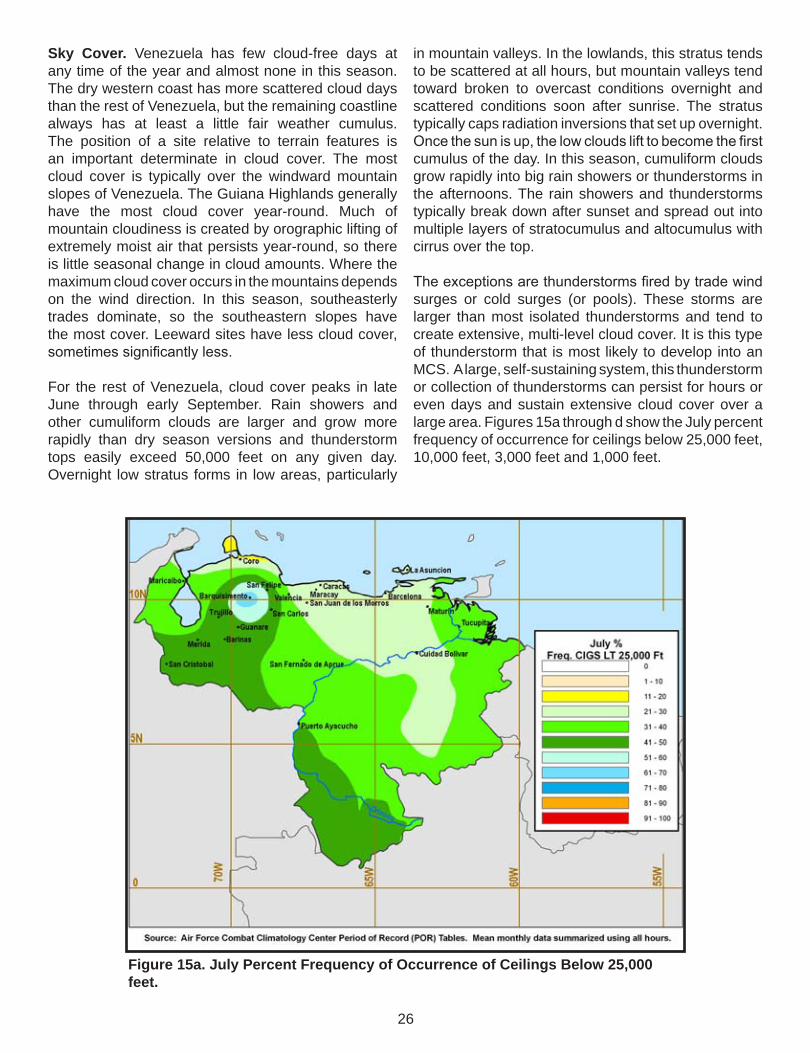
Sky Cover. Venezuela has few cloud-free days at any time of the year and almost none in this season. The dry western coast has more scattered cloud days than the rest of Venezuela, but the remaining coastline always has at least a little fair weather cumulus. The position of a site relative to terrain features is an important determinate in cloud cover. The most cloud cover is typically over the windward mountain slopes of Venezuela. The Guiana Highlands generally have the most cloud cover year-round. Much of mountain cloudiness is created by orographic lifting of extremely moist air that persists year-round, so there is little seasonal change in cloud amounts. Where the maximum cloud cover occurs in the mountains depends on the wind direction. In this season, southeasterly trades dominate, so the southeastern slopes have the most cover. Leeward sites have less cloud cover, sometimes significantly less.
For the rest of Venezuela, cloud cover peaks in late June through early September. Rain showers and other cumuliform clouds are larger and grow more rapidly than dry season versions and thunderstorm tops easily exceed 50,000 feet on any given day. Overnight low stratus forms in low areas, particularly
in mountain valleys. In the lowlands, this stratus tends to be scattered at all hours, but mountain valleys tend toward broken to overcast conditions overnight and scattered conditions soon after sunrise. The stratus typically caps radiation inversions that set up overnight. Once the sun is up, the low clouds lift to become the first cumulus of the day. In this season, cumuliform clouds grow rapidly into big rain showers or thunderstorms in the afternoons. The rain showers and thunderstorms typically break down after sunset and spread out into multiple layers of stratocumulus and altocumulus with cirrus over the top.
The exceptions are thunderstorms fired by trade wind surges or cold surges (or pools). These storms are larger than most isolated thunderstorms and tend to create extensive, multi-level cloud cover. It is this type of thunderstorm that is most likely to develop into an MCS. A large, self-sustaining system, this thunderstorm or collection of thunderstorms can persist for hours or even days and sustain extensive cloud cover over a large area. Figures �5a through d show the July percent frequency of occurrence for ceilings below �5,000 feet, �0,000 feet, �,000 feet and �,000 feet.
Figure 15a. July Percent Frequency of Occurrence of Ceilings Below 25,000 feet.

�7
Figure 15b. July Percent Frequency of Occurrence of Ceilings Below 10,000 feet.
Figure 15c. July Percent Frequency of Occurrence of Ceilings Below 3,000 feet.

�8
Visibility. Visibility restrictions are generally caused by moist haze, fog or rain. Moist haze is just about always present and often makes the air appear slightly whitish even when it is not restricting visibility below 7 miles (��,000 meters). Moist haze restricts visibility the most right after a thunderstorm has occurred. When fog occurs in the Llanos, it is often thin. This type quickly dissipates at sunrise. Mountain valley fog is thicker and takes longer to lift and dissipate, especially when capped by low stratus, which is fairly common. Rain obscures visibility while it is falling. Big thunderstorms can create very heavy rainfall that decreases visibility directly below the storm cloud below a mile (�,600 meters) for a few minutes to an hour at a time. On the coast, salt haze and moist haze combine to at least slightly restrict visibility most of the time. Figures �6a through c show the July
percent frequency of occurrence of visibility below 7 miles (��,000 meters), � miles, (�,800 meters) and � mile (�,600 meters). Figure �6d shows the July mean number of fog days.
Figure 15d. July Percent Frequency of Occurrence of Ceilings Below 1,000 feet.
Figure 16a. July Percent Frequency of Occurrence of Visibility Below 7 miles (11,000 meters).

�9
Figure 16b. July Percent Frequency of Occurrence of Visibility Below 3 miles, (4,800 meters).
Figure 16c. July Percent Frequency of Occurrence of Visibility Below 1 mile (1,600 meters).

�0
Winds. Wind flow varies across Venezuela and depends on the location of the NETWC. North of the NETWC, general winds are northeasterly trades, but south of it, southeasterly trades predominate. The Andes Mountains steer the southeasterly trades and induce a more southerly or southwesterly direction in southern Venezuela. At the peak of the wet season, southeasterly trades include all but the coast of Venezuela.
Local terrain has a significant effect on large-scale winds, particularly in places sheltered from the trades by mountain features. Up- and down slope winds are important in the mountains, land/sea breeze winds come into play both on the Caribbean coast and around
Lake Maracaibo. Southeast trades will alternate with northeast trades as the NETWC moves north and south over the course of the season. Regardless of which trade wind regime dominates in an area, large-scale flow has a generally easterly component. Strong winds are unusual even with thunderstorm down rush gusts, but they are more likely in this season than during the dry season. On the Caribbean coast and inland of gaps in the coastal mountains, strong winds are possible with passing hurricanes. Gale-force winds do not occur inland, unless the hurricane tracks across the coast. On the coast itself, gale-force winds are possible with storms that remain over the Caribbean. Figure �7 shows the July mean upper-level wind for Maracay, Venezuela.
Figure 16d. July Mean Fog Days.

��
Figure 17. July Mean Upper-Level Wind Roses for Maracay, Venezuela.

��
Precipitation. The amount and location of rainfall is very dependent on terrain features. The most rainfall occurs on windward mountain slopes. The Guiana Highlands consistently gets a lot of rain as do the lowlands of southern Venezuela. Some valley locations in all of the mountain areas of Venezuela will be in a rain shadow area in the lee of a mountain and rainfall will be considerably less than in more exposed valley locations. The coast and the Maracaibo basin areas rely mostly on locally generated rainfall from rain showers
or thunderstorms and these areas are typically much drier than in the Llanos or mountains. Trade wind and cold surges, as well as cold pools, produce rain showers and thunderstorms and often cause the major rain events that are the source for most of the rainfall accumulations during the season. A passing hurricane may produce more rain on the sea-facing slopes of the coastal mountains than they normally get in an entire year. Figures �8a through c show the July mean precipitation statistics.
Figure 18a. July Mean Monthly Precipitation.

��
Figure 18b. July Mean Precipitation Days.
Figure 18c. July Mean Thunderstorm Days.

��
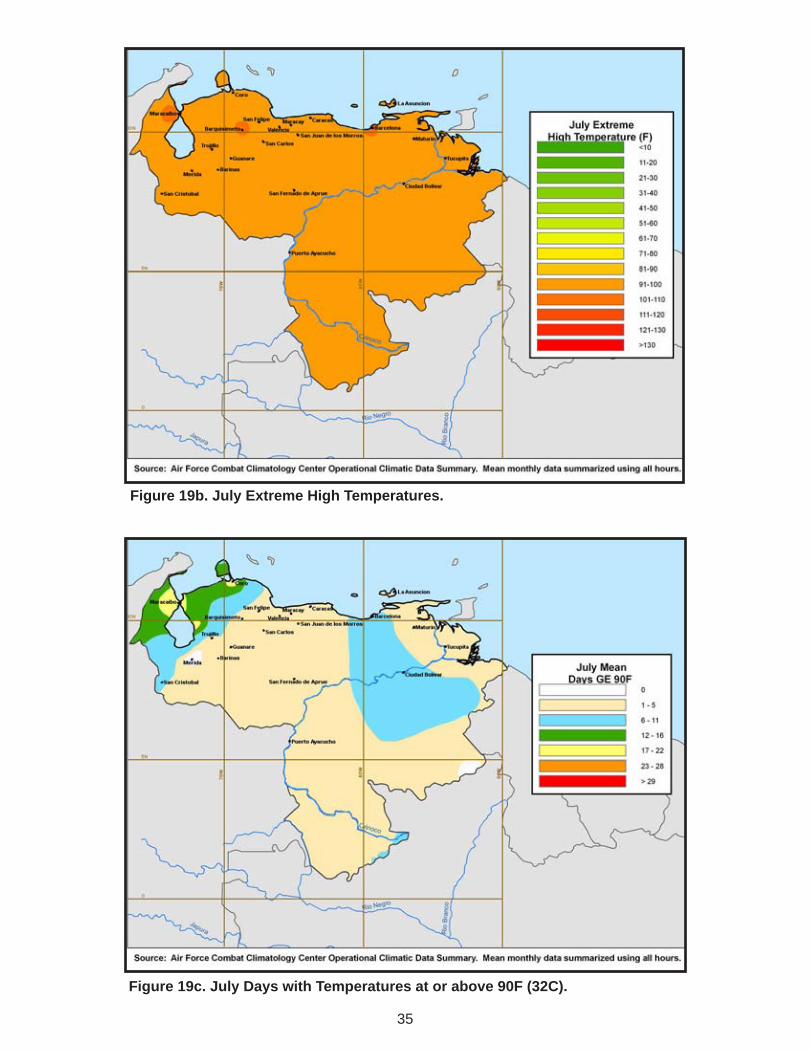
Temperatures. Temperatures vary little over the course of the year. Diurnal spreads are often wider than annual ones. Despite that, wet season temperatures are a bit cooler than those of the dry season because the extra cloud cover limits daytime heating. In southern Venezuela, where rainfall is relatively consistent year-round, temperatures do not significantly vary. The warmest temperatures occur under rare scattered skies and the coolest occur when skies are overcast
for several days in a row. This usually happens with mesoscale convective systems that spread cloud cover over a large area. During the rainy season, relative humidity is higher in areas where there is a distinct difference in rainfall between the two seasons. The higher humidity limits diurnal cooling and heating, which narrows the spread between night and day temperatures. Figures �9a-e show the July temperature statistics.
Figure 19a. July Mean High Temperatures.
�5
Figure 19b. July Extreme High Temperatures.
Figure 19c. July Days with Temperatures at or above 90F (32C).

�6
Figure 19d. July Mean Low Temperatures.
Figure 19e. July Extreme Low Temperatures.

�7
BIBLIOGRAPHY
Behrend, H., Teleconnections of Rainfall Anomalies and of the Southern Oscillation Over the Entire Tropics and their Seasonal Dependence, Tellus (�987), �9A, ��8-�5�
Betts, A., et al, Structure and Motion of Tropical Squall Lines Over Venezuela, Quarterly Journal of the Royal Meteorological Society, (�976),�0�,pp �95-�0�
Gibson, D., An Investigation of Rainfall Variability and Distribution in Venezuela, Master’s Thesis, Texas A&M University, College Station, Texas, May �968
Haggerty, R., et al, Area Handbook Series; Venezuela, A Country Study, Headquarters, Department of the Army DA Pam 550-7�, Federal Research Division, Library of Congress, Washington D.C., �99�
Henry, W., et al, Research on Tropical Rainfall Patterns and Associated Mesoscale Systems, Report No. �, Project �6� 68-��-T, Department of Meteorology, Texas A&M University, College Station, Texas, December �968
HQ �WG, FAWG-2-CS-N-2, Headquarters Second Weather Group Climatological Studies, Weather and Climate, South America, Headquarters Second Weather Group, Langley Air Force Base, Virginia, February, �96�
Moron, V., et al, Rainfall Variability in Subequatorial America and Africa and Relationships with the Main Sea-Surface Temperature Modes (1951-1990), International Journal of Climatology, Vol. �5,��97-���� (�995)
National Intelligence Survey Numbers 8� and 8�, Section ��, Netherlands Antilles and French West Indies, United States Central Intelligence Agency, May �965
National Intelligence Survey Number 86, Section ��, Venezuela, United States Central Intelligence Agency, May �965
Pulwarty, R., et al, Precipitation in the Venezuelan Andes in the Context of Regional Climate, Meteorology and Atmospheric Physics 67, ��7-��7, �998
Snow, J., World Survey of Climatology, Vol. 12, Climates of Central and South America, Chapter 6, pages ��6-�58, Amsterdam-Oxford-New York Publishing Co., �976
Walters, K. et al, The Caribbean Basin-A Climatological Study, USAFETAC/TN 89/003, United States Environmental Technical Applications Center, Scott AFB Illinois, �989
Wikipedia.org/wiki/encyclopedia.thefreedictionary.com/Venezuela, �� June, �006