reversing the incidence of malaria 2000–2015 - unicef data · annex 1. estimated malaria cases...
TRANSCRIPT
Reversing the Incidence of Malaria 2000–2015


Achieving the Malaria MDG TargetReversing the Incidence of Malaria 2000–2015

WHO Library Cataloguing-in-Publication Data
Achieving the malaria MDG target: reversing the incidence of malaria 2000-2015.
1.Malaria - prevention and control. 2.Malaria – epidemiology. 3.Goals. 4.Program Evaluation. I.World Health Organization. II.UNICEF.
ISBN 978 92 4 150944 2 (NLM classification: WC 765)
© World Health Organization and the United Nations Children’s Fund 2015
This joint report reflects the activities of the World Health Organization (WHO) and the United Nations Children’s Fund (UNICEF).
All rights reserved. Publications of the World Health Organization are available on the WHO website (www.who.int) or can be purchased from WHO Press, World Health Organization, 20 Avenue Appia, 1211 Geneva 27, Switzerland (tel.: +41 22 791 3264; fax: +41 22 791 4857; e-mail: [email protected]).
Requests for permission to reproduce or translate WHO publications – whether for sale or for non-commercial distribution – should be addressed to WHO Press through the WHO website (www.who.int/about/licensing/copyright_form/en/index.html).
The designations employed and the presentation of the material in this publication do not imply the expression of any opinion whatsoever on the part of either UNICEF or WHO concerning the legal status of any country, territory, city or area or of its authorities, or concerning the delimitation of its frontiers or boundaries. Dotted lines on maps represent approximate border lines for which there may not yet be full agreement.
The mention of specific companies or of certain manufacturers’ products does not imply that they are endorsed or recommended by either UNICEF or WHO in preference to others of a similar nature that are not mentioned. Errors and omissions excepted, the names of proprietary products are distinguished by initial capital letters.
All reasonable precautions have been taken by UNICEF and WHO to verify the information contained in this publication. However, the published material is being distributed without warranty of any kind, either expressed or implied. The responsibility for the interpretation and use of the material lies with the reader. In no event shall either UNICEF or WHO be liable for damages arising from its use.
Map production: WHO Global Malaria Programme.
Design and layout: designisgood.info
Photo credits | Front cover: © The Global Fund/Guy Stubbs | pp. iv, 5: © The Global Fund/John Rae | p. 2: © UNICEF/Olivier Asselin | p. 7: © The Global Fund/Didier Ruef | p. 9: © The Global Fund/Bruno Abarca | p. 12: © WHO/Christopher Black | p. 19: © Jhpiego/William Brieger | p. 23: © UNICEF/Christine Nesbitt
Please consult the WHO Global Malaria Programme and UNICEF websites (respectively www.who.int/malaria and www.data.unicef.org) for the most up-to-date version of all documents
Printed by the WHO Document Production Services, Geneva, Switzerland

Contents
Contents
Foreword 1
Acknowledgments 3
Abbreviations 3
Introduction 4
1. Malaria essentials 61.1 Biology and epidemiology 61.2 Fighting malaria 7
2. Indicator 6.6: Incidence and death rates associated with malaria 102.1 Global progress 102.2 Progress at regional and country level 112.3 Cases and deaths averted 122.4 Challenges 13
3. Indicator 6.7: Proportion of children under 5 sleeping under insecticide-treated mosquito nets 143.1 Progress 143.2 Remaining challenges 17
4. Indicator 6.8: Proportion of children under 5 with fever who are treated with appropriate antimalarial drugs 184.1 Progress 184.2 Reducing bottlenecks to accessing an ACT 204.3 The need for increased diagnostic testing 22
5. Beyond MDG 6 245.1 Malaria control’s contribution to achievement of other MDGs 245.2 Drivers of change 245.3 Looking to the future 26
References 28
Annex 1. Estimated malaria cases and deaths, and incidence and death rates, by MDG region 2000, 2005, 2010 and 2015 29
Annex 2. Methods and sources of data 30
Achieving the MAlAriA MDg tArget: reversing the inciDence of MAlAriA 2000–2015 | iii

iv | Achieving the MAlAriA MDg tArget: reversing the inciDence of MAlAriA 2000–2015

Foreword
Fifteen years ago, global leaders identified malaria as a serious public health challenge and one of the biggest impediments to global development, particularly in the world’s poorest countries. At a meeting of the United Nations General Assembly, they pledged to halt and begin to reverse the incidence of malaria by 2015 – a critical global target of the Millennium Development Goals.
Today, we can say with confidence – and great excitement – that the world has achieved this target. Between 2000 and 2015, the rate of new malaria infections declined globally by an estimated 37 per cent. Over the same period, the global malaria death rate fell by 60 per cent. Equally encouraging, an increasing number of countries have moved towards malaria elimination. Last year, 13 countries reported zero cases of malaria within their own borders and six countries reported fewer than 10 cases.
These figures translate into 6.2 million lives saved over the last 15 years – an enormous victory for families, communities, and countries.
This report highlights these and other key findings, as well lessons we have learned – and the challenges that remain.
Over the last 15 years, the delivery of core malaria interventions has undergone an unprecedented expansion. Since 2000, one billion insecticide-treated mosquito nets have been distributed in Africa. The introduction of rapid diagnostic tests has made it possible to distinguish more quickly between malarial and non-malarial fevers – enabling more timely and appropriate treatment. Artemisinin-based combination therapies (ACTs) have been highly effective against Plasmodium falciparum, the most prevalent and lethal malaria parasite affecting humans. And as we have reached more communities and people at risk for malaria with these core interventions, many more lives have been saved.
Progress in reaching children under the age of 5 – one of the most vulnerable groups affected by malaria – has been especially encouraging. By 2015, an estimated 68 per cent of under-fives in sub-Saharan Africa were sleeping under insecticide-treated nets, compared to less than 2 per cent in 2000. Over a 15-year period, the under-five global malaria death rate fell by 65 per cent.
Global malaria control is one of the first great public health success stories of this millennium – but our work is far from finished. Billions of people remain at risk for malaria. More than four hundred thousand people,
70 per cent of whom are children under five, still die from this preventable disease every year.
As this report shows, serious bottlenecks remain in providing full access to malaria prevention, diagnostic testing and treatment, especially for children under five and pregnant women. Progress has been uneven, with some countries carrying a disproportionately high share of the global burden. Fifteen countries – mainly in sub-Saharan Africa – account for 80 per cent of malaria cases and 78 per cent of deaths globally.
Eliminating malaria on a global scale is possible – but only if we overcome these barriers and accelerate progress in these high-burden countries. They – and we – have much to gain if we do: Not only lives saved, but also in more sustained economic growth.
As the global community commits to a new global development framework – the Sustainable Development Goals – we must strengthen our efforts to achieve universal access to malaria prevention, diagnosis and treatment.
Earlier this year, the World Health Assembly adopted the WHO Global technical strategy for malaria 2016–2030, a 15-year roadmap for malaria control. The strategy sets ambitious global targets, including a further 90 per cent reduction in malaria incidence and mortality by the year 2030.
Achieving these targets will require political will, country leadership, and significantly increased investment. To meet the first milestone of this strategy, a 40 per cent reduction in malaria incidence and mortality rates, an annual investment of approximately US$ 6.4 billion per year by 2020 will be needed – far more funding than is currently available.
But if we secure the required resources and expand access to the core interventions we know are working, we will not only save millions of lives, though this goal is reason enough to act. We will accelerate progress towards a malaria-free world – and transform our
common goal into a shared reality.
Anthony Lake Dr. Margaret Chan Executive Director Director-General UNICEF WHO
Achieving the MAlAriA MDg tArget: reversing the inciDence of MAlAriA 2000–2015 | 1

2 | Achieving the MAlAriA MDg tArget: reversing the inciDence of MAlAriA 2000–2015

AcknowledgementsThis report was prepared by Agbessi Amouzou, Valentina Buj and Liliana Carvajal (UNICEF, New York) and Richard Cibulskis and Cristin Fergus (World Health Organization [WHO] Global Malaria Programme, Geneva). The report also benefited from inputs from Annemarie Meyer (Malaria No More, United Kingdom) and from Andrea Bosman, Michael Lynch and Saira Stewart (WHO Global Malaria Programme).
Yue Chu, Li Liu and Jamie Perrin (Johns Hopkins Bloomberg School of Public Health) and Dan Hogan (WHO Department of Health Statistics and Information Systems) prepared malaria mortality estimates in children aged under 5 years on behalf of the Maternal and Child Epidemiology Estimation Group. Samir Bhatt, Peter Gething and the Malaria Atlas Project (MAP) team at the University of Oxford, produced estimates of insecticide-treated
mosquito net (ITN) coverage for African countries using data from household surveys, ITN deliveries by manufacturers, and ITNs distributed by national malaria control programmes.
Donal Bisanzio and Peter Gething (MAP, University of Oxford), Thomas Eisele (Center for Applied Malaria Research and Evaluation [CAMRE], Tulane University) and Adam Bennett (Global Health Group, University of California San Francisco) produced estimates of fever treatment.
Laurent Bergeron (WHO Global Malaria Programme) provided programmatic support for overall production of the report and Hilary Cadman performed technical editing.
Funding for the production of this report was gratefully received from the United Kingdom Department for International Development (DFID).
AbbreviationsACT artemisinin-based combination therapy
GFATM Global Fund to Fight AIDS, Tuberculosis and Malaria
iCCM integrated community case management
IMCI integrated management of childhood illness
IRS indoor residual spraying
ITN insecticide-treated mosquito net
LLIN long-lasting insecticidal net
MDG Millennium Development Goal
PMI US President’s Malaria Initiative
RDT rapid diagnostic test
SDG Sustainable Development Goal
UNICEF United Nations Children’s Fund
WHO World Health Organization
Achieving the MAlAriA MDg tArget: reversing the inciDence of MAlAriA 2000–2015 | 3

At the beginning of the millennium, the battle against malaria was being lost. In 2001, the Road map towards the implementation of the United Nations Millennium Declaration (1) noted that “Each year, one million people die from malaria, and the number has been increasing over the past two decades. The deterioration of health systems, growing resistance to drugs and insecticides, environmental changes and human migration, which have led to an increase in epidemics, all contribute to the worsening global malaria problem.” In 2000, it was estimated that 86% of malaria deaths occurred in children aged under 5 years. Malaria accounted for 12% of all deaths in children aged 1–59 months globally and 22% in
sub-Saharan Africa (where malaria was the leading cause of death in children aged 1–59 months).
Such was the devastation caused by malaria that combating the disease, along with HIV/AIDS, was identified as a priority at the 2000 United Nations General Assembly (2), and was designated as Goal 6 of the eight Millennium Development Goals (MDGs). 1 Target 6C was to “Have halted by 2015 and begun to reverse the incidence of malaria and other major diseases”, and Indicators 6.6–6.8 were selected to track progress in malaria and implementation of malaria interventions (Table 1).
1 The full set of MDGs and indicators is available at http://mdgs.un.org/unsd/mdg/Host.aspx?Content= indicators/officiallist.htm
Introduction
Table 1. MDG 6 and associated malaria target and indicators
Goal 6. Combat HIV/AIDS, malaria and other diseases
Target 6C. Have halted by 2015 and begun to reverse the incidence of malaria and other major diseases
Indicators 6.6 Incidence and death rates associated with malaria
6.7 Proportion of children under 5 sleeping under insecticide-treated mosquito nets
6.8 Proportion of children under 5 with fever who are treated with appropriate antimalarial drugs
Table 2. Malaria MDG indicators then and now
Indicators 2000 2015 % change
6.6 Incidence rate associated with malaria (per 1000 at risk) and Death rate associated with malaria (per 100 000 at risk)
146 47
91 19
–37% –60%
6.7 Proportion of children under 5 sleeping under insecticide-treated mosquito nets 2% 68% >100%
6.8 Proportion of children under 5 with fever who are treated with appropriate antimalarial drugs*
0% 13% >100%
* Refers to artemisinin-based combination therapies
4 | Achieving the MAlAriA MDg tArget: reversing the inciDence of MAlAriA 2000–2015

Introduction
Despite the unpromising circumstances in 2000 for achieving the MDG target, the subsequent 15 years saw impressive reductions in malaria, with incidence rates falling by 37% globally and death rates by 60% (Table 2). Hence, Target 6C has been met convincingly. By 2015, more than two thirds of children under 5 were sleeping under an ITN and the proportion of febrile children receiving artemisinin-based combination therapies (ACTs) rose from 0% to 13%. ACTs are the recommended treatment for malaria in sub-Saharan Africa and have progressively replaced other antimalarial medicines. The proportion of febrile children treated with antimalarial medicines other than ACTs has fallen from 46% in 2000 to 13% in 2015.
Despite incredible progress in fighting malaria in all regions affected by the disease, malaria remains an acute public health problem. During the course of 2015, it is estimated that malaria will
have caused 214 million cases (uncertainty range: 149–303 million) and 438 000 malaria deaths (range: 236 000–635 000); most of these cases (89%) and deaths (91%) occur in sub-Saharan Africa. Children aged under 5 years bear the largest burden, with more than two thirds of all malaria deaths occurring in this age group.
This report summarizes the remarkable progress made against malaria between 2000 and 2015. It introduces malaria and the strategies used to fight the disease, outlines progress according to each of the MDG indicators, and highlights the main challenges that remain in controlling and eliminating this disease.
Achieving the MAlAriA MDg tArget: reversing the inciDence of MAlAriA 2000–2015 | 5

6 | Achieving the MAlAriA MDg tArget: reversing the inciDence of MAlAriA 2000–2015
1.1 Biology and epidemiologyMalaria is an entirely preventable and treatable disease. It is caused by a protozoan parasite belonging to the genus Plasmodium, and is spread from one person to another by Anopheles mosquitoes. There are more than 400 different species of Anopheles mosquito, but only 30 are malaria vectors of major importance.
Five species of Plasmodium can infect human beings; two of these – P. falciparum and P. vivax – pose the greatest threat. Although P. vivax can cause severe illness and death, P. falciparum is the most dangerous malaria parasite, the most prevalent on the African continent and responsible for most malaria-related deaths. P. vivax has a wider distribution than P. falciparum, and predominates in many countries outside of Africa. Although P. vivax can occur in Africa, the high frequency of a genetic trait known as Duffy negativity among African populations makes many individuals resistant to infection with P. vivax.
As of 2015, an estimated 3.2 billion people in 97 countries and territories are at risk of being infected with malaria (compared to 2.4 billion in 106 countries in 2000). If an individual is infected with malaria and the disease is not treated promptly with effective antimalarial medicines, it can rapidly progress to severe illness and death. The malaria parasite invades and ultimately destroys red blood cells. Repeated infections can lead to severe anaemia, which can be lethal. P. falciparum can also cause cerebral malaria, in which small blood vessels in the brain are clogged by blood cells infected with malaria parasites. Again, this can be lethal, and in those who survive cerebral malaria, there are often long-term neurological consequences. Immunity to malaria builds up gradually among those who are repeatedly infected and survive. Non-pregnant adults from areas of intense transmission are much less likely to become severely ill or die; however,
1. Malaria essentials
Figure 1. Percentage of deaths in children under 5 years caused by malaria, 2000 and 2015
≥25%
20–24%
15–19%
10–14%
5–9%
<5%
Not malaria endemic
Not applicable
2000 2015
Source: WHO and Maternal and Child Health Epidemiology Estimation Group

Malaria essentials
Achieving the MAlAriA MDg tArget: reversing the inciDence of MAlAriA 2000–2015 | 7
they may have underlying asymptomatic infections and can thus be a reservoir for malaria transmission.In areas with intense malaria transmission, those most susceptible to malaria are children aged under 5 years and pregnant women: two groups who have little or reduced immunity to the disease.
Thus, it is children under 5 and pregnant women living in sub-Saharan Africa who suffer the largest burden of malaria disease and mortality. In this region, malaria accounts for 10% of all deaths among children under 5 in 2015 (Fig. 1) and 15% among those aged 1–59 months.
1.2 Fighting malaria There are three main ways to fight malaria (Fig.2):
● vector control, which focuses on blocking the transmission of parasites by the mosquito vector from humans to mosquitoes and then back to humans, thereby reducing the disease burden; the main interventions are vector control using insecticide-treated mosquito nets (ITNs) or indoor residual spraying (IRS) and, in some settings, mosquito larval control;
● chemoprevention, which suppres ses the blood-stage infection in humans and prevents malaria disease; and
● case management, which involves prompt diagnosis and treatment of malaria infections with appropriate antimalarial medicines; this reduces the likelihood of progression to severe disease and death from malaria.
Figure 2. Main strategies to prevent and treat malaria
Mosquito vector
Human host
1. Vector controlPrevent mosquito from acquiring or passing on an infection (ITN or IRS)
2. ChemopreventionPrevent infections
establishing themselves in human beings
3. Case managementDetect, diagnose,
treat and cureinfections

Malaria essentials
8 | Achieving the MAlAriA MDg tArget: reversing the inciDence of MAlAriA 2000–2015
1.2.1 Vector control
MDG Indicator 6.7 focuses on the proportion of children aged under 5 years sleeping under an ITN. The nets provide a physical barrier against mosquitoes; also, because they are impregnated with insecticide, they can reduce the lifespan of a mosquito, decreasing the chance of it transmitting malaria to another person. Thus, ITNs provide personal protection to those sleeping under them, and once a sufficient number of people are using ITNs, they can also provide a community-wide protective effect by reducing the number of mosquitoes in a community. It is therefore desirable to achieve high rates of ITN use in a population.
In this report, results for Indicator 6.7 are shown only for sub-Saharan Africa where malaria is concentrated in children under 5 and where mosquitoes transmit malaria predominantly at night (when most people are sleeping, and thus where barriers such as ITNs are most effective). ITNs are also recommended in other regions of the world, but vector behaviour is more variable outside of Africa (e.g. mosquitoes do not always bite during sleeping hours) and nets are therefore deployed less widely. Moreover, in areas where malaria transmission is low, malaria commonly affects those aged over 5 years.
1.2.2 Preventive chemotherapy
Preventive chemotherapy is the use of complete treatment courses of antimalarial medicines as a prophylactic in populations that are particularly at risk of malaria, with the goal of reducing malaria-related morbidity and mortality. The three preventive therapies presently recommended by WHO are intermittent preventive treatment in pregnancy, intermittent preventive treatment in infants, and seasonal malaria chemoprevention
for children aged 3–59 months. There is no MDG indicator for preventive chemotherapy.
1.2.3 Diagnosis and treatment
MDG Indicator 6.8 focuses on treatment of malaria in children aged under 5 years. In this report, the indicator is shown only for sub-Saharan Africa where (as explained above) malaria is concentrated in children under 5. Prompt treatment of malaria with effective antimalarial medicines can:
● prevent the progression of uncomplicated malaria to severe and potentially fatal disease;
● prevent the chronic infection that leads to malaria-related anaemia; and
● help to reduce transmission by ensuring that there are no parasites present in the blood if someone is bitten by a mosquito.
ACTs are the recommended treatment for uncomplicated P. falciparum malaria. P. vivax malaria should be treated with ACTs or chloroquine, supplemented with a 14-day course of primaquine to prevent relapses, taking into account the risk of adverse effects among patients receiving primaquine if they have a deficiency of the enzyme glucose-6-phosphate dehydrogenase.
Since not all fevers are due to malaria, parasitological confirmation by light microscopy or rapid diagnostic tests (RDTs) is recommended in all patients before antimalarial treatment is started. When Indicator 6.8 was first formulated, tools for parasitological diagnosis of malaria were rarely available in peripheral health facilities. Therefore, at the beginning of the millennium, WHO recommended that all febrile children living in malaria-endemic areas be treated with an antimalarial medicine within 24 hours. However, in 2010, WHO recommended that, where possible,

Malaria essentials
Achieving the MAlAriA MDg tArget: reversing the inciDence of MAlAriA 2000–2015 | 9
all cases should be confirmed by parasitological diagnosis before treatment with antimalarial medicines (3). When a large proportion of febrile children receive a diagnostic test and are revealed to not have malaria, Indicator 6.8 becomes particularly difficult to interpret. This is because the proportion of children with fever treated with an antimalarial
medicine can be small, even though the proportion of febrile children infected with malaria being treated appropriately can be high. The challenges of using this indicator, and of providing appropriate diagnostic testing and treatment, are described in Section 4 of this report.

10 | Achieving the MAlAriA MDg tArget: reversing the inciDence of MAlAriA 2000–2015
2.1 Global progressIn 2000, malaria caused an estimated 262 million cases (range: 205–316 million) and 839 000 deaths (range: 653 000–1.1 million). More than 80% of cases and 90% of deaths occurred in sub-Saharan Africa, where children aged under 5 years are particularly prone to severe disease and death. It is estimated that, in 2000, malaria was responsible for 12% of all child deaths in the post-neonatal period 2 and 22% in sub-Saharan Africa.
Since 2000, there have been substantial reductions in both the number of malaria cases and deaths (Annex 1). About 214 million malaria cases are estimated to occur in 2015 (range: 149–303 million), leading to 438 000 deaths (range: 236 000–635 000).
2 Ages 1–59 months
The declines in numbers of cases and deaths between 2000 and 2015 are even more impressive when it is considered that, during the same period, the population at risk of malaria increased by 31% globally. Therefore, the incidence rate of malaria, which takes into account population growth, is estimated to have decreased by 37% globally between 2000 and 2015 (Table 2). Malaria death rates have decreased by 60% over the same period. Malaria death rates among children under 5 years have fallen by even more, 65%. It is evident that MDG Target 6C (to have halted and begun to reverse the incidence of malaria) has been met convincingly.
2. Indicator 6.6Incidence and death rates associated with malaria
Figure 3. Estimated malaria case incidence and death rates globally, 2000–2015
Incidence rate
Death rate
200
180
160
140
120
100
80
60
40
20
0
Mal
aria
cas
es p
er 1
000
pers
ons a
t risk
and
mal
aria
dea
ths p
er 1
00 0
00 p
erso
ns a
t risk
201420132012201120102009200820072006200520042003200220012000 2015
Source: WHO estimates

Indicator 6.6
Achieving the MAlAriA MDg tArget: reversing the inciDence of MAlAriA 2000–2015 | 11
2.2 Progress at regional and country levelReductions in malaria incidence and death rates are estimated to have occurred in all regions of the world over the past 15 years. The fastest decreases were seen in Caucasus and Central Asia (which reported zero cases in 2014), and Eastern Asia (Fig 4). Of 106 countries and territories with malaria transmission in 2000, 102 across all MDG regions are estimated to have met MDG Target 6C
(to reverse the incidence of malaria). Progress in reducing malaria death rates has been made in all regions. An increasing number of countries have also moved towards eliminating malaria (i.e. having zero locally acquired cases). In 2014, a total of 13 countries that had malaria in 2000 reported zero locally acquired cases, and another six countries reported fewer than 10 such cases.
Figure 4. Percentage decrease in (a) estimated malaria case incidence and (b) malaria death rates by MDG region, 2000–2015
Sub-Saharan Africa
Latin America and the Caribbean
Caucasus and Central Asia
Eastern Asia
Southern Asia
South-eastern Asia
Western Asia
Oceania
0%
20%
40%
60%
80%
100%201020052000 2015
(a)
-60%
-40%
-20%
0%
20%
40%
60%
80%
100%201020052000 2015
(b)Sub-Saharan Africa
Latin America and the Caribbean
Caucasus and Central Asia
Eastern Asia
Southern Asia
South-eastern Asia
Western Asia
Oceania
Source: WHO estimates

Indicator 6.6
12 | Achieving the MAlAriA MDg tArget: reversing the inciDence of MAlAriA 2000–2015
2.3 Cases and deaths avertedIt is estimated that 1.2 billion fewer malaria cases and 6.2 million fewer malaria deaths occurred globally between 2001 and 2015 than would have been the case had incidence and mortality rates remained unchanged since 2000. Of the estimated 6.2 million malaria deaths averted between 2001 and 2015, some 5.9 million (95%) were in children aged under 5 years. These 5.9 million averted deaths accounted for 13% of the 46 million fewer deaths in malaria-endemic countries than would have occurred between 2001 and 2015 had under-5 mortality rates for 2000 applied for each year from 2001 to 2015 (and 25% of the
fewer deaths in children aged under 5 years in sub-Saharan Africa). Thus, reductions in malaria deaths have contributed substantially to progress towards achieving the MDG 4 target of reducing the under-5 mortality rate by two thirds between 1990 and 2015.Not all of the malaria cases and deaths averted can be attributed to malaria-control interventions. Some progress is also likely to be related to increased urbanization and overall economic development, which lead to improvements in housing and nutrition that may in turn contribute to reductions in malaria transmission and deaths.
Indicator 6.6
Achieving the MAlAriA MDg tArget: reversing the inciDence of MAlAriA 2000–2015 | 13
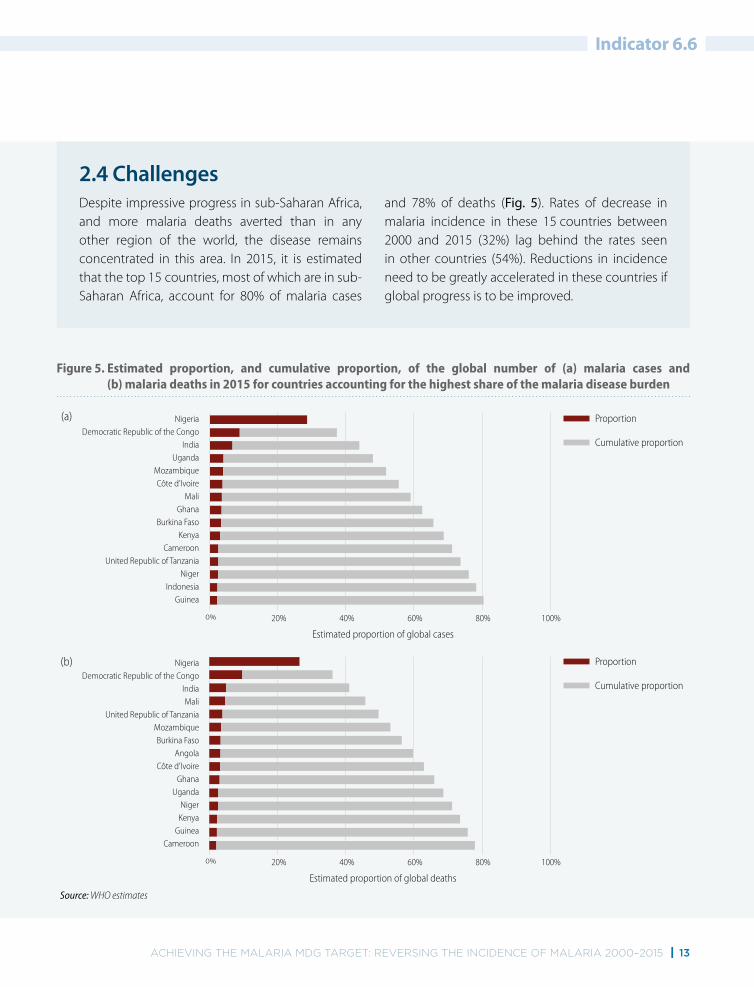
Figure 5. Estimated proportion, and cumulative proportion, of the global number of (a) malaria cases and (b) malaria deaths in 2015 for countries accounting for the highest share of the malaria disease burden
Proportion
Cumulative proportion
(a)
(b) Proportion
Cumulative proportion
NigeriaDemocratic Republic of the Congo
IndiaMali
United Republic of TanzaniaMozambiqueBurkina Faso
AngolaCôte d’Ivoire
GhanaUganda
NigerKenya
GuineaCameroon
80%60%40%20%0% 100%
Estimated proportion of global deaths
NigeriaDemocratic Republic of the Congo
IndiaUganda
MozambiqueCôte d’Ivoire
MaliGhana
Burkina FasoKenya
CameroonUnited Republic of Tanzania
NigerIndonesia
Guinea
80%60%40%20%0% 100%
Estimated proportion of global cases
Source: WHO estimates
2.4 Challenges Despite impressive progress in sub-Saharan Africa, and more malaria deaths averted than in any other region of the world, the disease remains concentrated in this area. In 2015, it is estimated that the top 15 countries, most of which are in sub-Saharan Africa, account for 80% of malaria cases
and 78% of deaths (Fig. 5). Rates of decrease in malaria incidence in these 15 countries between 2000 and 2015 (32%) lag behind the rates seen in other countries (54%). Reductions in incidence need to be greatly accelerated in these countries if global progress is to be improved.

14 | Achieving the MAlAriA MDg tArget: reversing the inciDence of MAlAriA 2000–2015
3.1 ProgressIndicator 6.7 is shown only for sub-Saharan Africa, where malaria is concentrated in children aged under 5 years and where mosquitoes bite primarily at night. High values of the indicator, ideally 100%, are needed to ensure that the most vulnerable populations are protected from malaria.
The proportion of children under 5 sleeping under an ITN has increased markedly in sub-Saharan Africa, from less than 2% in 2000 to an estimated 68% in 2015 (Fig. 6). Approximately 7% of the population at risk in sub-Saharan Africa, including children under 5, is estimated to be protected by IRS, another method of preventing mosquito bites.
The continental estimates of children under 5 sleeping under an ITN conceal large variations in progress across countries. Between 2000 and 2002, the proportion of children sleeping under an ITN was less than 25% in all of the 24 countries in which a household survey was conducted (median among 24 countries with surveys was 2%) and progress was modest in the following years, particularly in countries
with the largest number of cases and deaths (Fig. 7). In 32 countries with surveys conducted between 2005 and 2007, the proportion of children sleeping under an ITN exceeded 25% in just eight countries. By 2009–2011, more widespread progress had been made, with the proportion of children under 5 sleeping under an ITN exceeding 25% in 20 countries, and 50% in six countries (median among 35 countries with surveys was 34%). By 2012–2014, the proportion of children under 5 sleeping under an ITN exceeded 25% in 15 countries and 50% in 12 countries with household surveys. The increasing proportion of children sleeping under an ITN is driven by increasing access to ITNs in households; an estimated 67% of the population in sub-Saharan Africa had access to an ITN in 2015. Access to ITNs is linked to more widespread distribution of ITNs through mass campaigns (Box 1); in countries where such campaigns have not occurred recently, a lower proportion of the population is protected with ITNs.
3. Indicator 6.7Proportion of children under 5 sleeping under insecticide-treated mosquito nets
Figure 6. Estimated proportion of children under 5 sleeping under insecticide-treated mosquito nets, sub-Saharan Africa, 2000–2015
100%
80%
60%
40%
20%
0%
Prop
ortio
n of
chi
ldre
n <
5 sle
epin
g un
der a
n IT
N
201420132012201120102009200820072006200520042003200220012000 2015
Source: Insecticide-treated mosquito net coverage model provided by the Malaria Atlas Project (MAP)

Achieving the MAlAriA MDg tArget: reversing the inciDence of MAlAriA 2000–2015 | 15
Indicator 6.7
Figure 7. Proportion of children under 5 sleeping under an ITN in sub-Saharan Africa, 2000–2014
>75%
50–74%
25–49%
<25%
IRS is primary method of vector control
Data not available
Not malaria endemic
Not applicable
2000–2002Median 2% (IQR: 1–6)
2005–2007Median 14% (IQR: 7–26)
2009–2011Median 34% (IQR: 25–46)
2012–2014a
Median 47%(IQR: 38–61)
a Data for Mauritania and Rwanda refer to 2014–2015.
Source: Demographic and health surveys, multiple indicator cluster surveys and other national survey estimates available at http://data.unicef.org/child-health/malaria

Indicator 6.7
16 | Achieving the MAlAriA MDg tArget: reversing the inciDence of MAlAriA 2000–2015
Box 1. Increasing the availability of ITNs Free distribution of ITNs to all households through mass distribution campaigns has been one of the most effective and equitable ways of increasing the availability of ITNs among populations living in areas with malaria. Large-scale ITN campaigns have taken place in most sub-Saharan African countries, with more than 70 campaigns conducted since 2000. Mass campaigns target the entire population and do not discriminate by wealth, location or any other demographic factors. Hence, these campaigns can ensure that the poorest and most vulnerable populations have access to this life-saving malaria intervention.
The United Republic of Tanzania represents an example of the benefits of mass ITN distribution campaigns in a single country. Between 2009 and 2011, the country implemented two mass distribution campaigns, with the goal of achieving universal access to ITNs nationwide. More than 27 million ITNs were distributed between 2009 and 2011. The proportion of children from the
poorest households and rural areas sleeping under an ITN subsequently increased to more than 60%, approaching the levels observed in the richest wealth quintile and urban populations by 2011 (Fig. B1).
To maintain high levels of coverage, mass campaigns need to be supplemented with other channels of distribution, such as through antenatal and immunization clinics. Most countries distribute nets through both mechanisms. Since 2004, an estimated 975 million nets have been delivered in sub-Saharan Africa (of more than one billion nets that have been delivered globally). Since the mid-2000s, efforts to maintain high levels of ITN coverage have benefited from the introduction of long-lasting insecticidal nets (LLINs), which can provide protection for 2–3 years and thus eliminate the need for retreatment of nets with insecticide. Provision of ITNs free of charge to all age groups has prevented financial barriers to access, and contributed to the higher levels of coverage seen today.
Figure B1. Proportion of children under 5 sleeping under an ITN, by (a) wealth quintile and (b) place of residence, United Republic of Tanzania, 2004–2011
100%
80%
60%
40%
20%
0%20112010200920082007200620052004
(a) 100%
80%
60%
40%
20%
0%2010 2011200920082007200620052004
(b)RichestPoorest
UrbanRural
Source: Demographic and health surveys

Indicator 6.7
Achieving the MAlAriA MDg tArget: reversing the inciDence of MAlAriA 2000–2015 | 17
3.2 Remaining challengesSince 2007, WHO has recommended that all people at risk of malaria sleep under an ITN, not just children aged under 5 years. However, the proportion of the population in other age groups sleeping under an ITN falls below that of children under 5, particularly among children aged 5–19 years (Fig. 8). This is of particular concern, because school-aged children constitute the largest reservoir of parasite infections (4), and may contribute to continuing transmission of malaria by mosquitoes.
Across household surveys, the proportion of the population sleeping under an ITN in the general population closely tracks the proportion with access to an ITN, indicating that most of those with access to an ITN use it, and that the biggest barrier to sleeping under an ITN is lack of access to an ITN. WHO recommends that there is at least one ITN for every two people in each household. Low usage
of nets, in certain areas or among certain groups, such as those aged 5–19 years may indicate that there is scope to expand behavioural change communication programmes, and a need to ensure that there are sufficient ITNs in every household.
In addition to the 68% of children estimated to sleep under an ITN in 2015, 7% are estimated to be protected by IRS, resulting in as many as 75% of children under 5 being protected by vector control. The progress in increasing protection by vector control has been remarkable, given that in 2000, almost all of the 116 million children at risk of malaria were unprotected against mosquito bites. Nevertheless, at least 41 million out of 163 million children under 5 in sub-Saharan Africa in 2015 neither slept under an ITN nor benefited from IRS, and intense efforts are still needed to extend vector control and ensure universal access to ITNs and their benefits.
Figure 8. Proportion of different population subgroups sleeping under an ITN, for countries in sub-Saharan Africa with household surveys, 2013–2014
100%
80%
60%
40%
20%
0%
Prop
ortio
n
Pregnant woman Children under 5 Ages 5–19 years Ages >20 years
Source: Household surveys in sub-Saharan Africa 2013–2014
The median proportion of a population sleeping under an ITN, among household surveys conducted between 2013 and 2014, is shown by a horizontal bar, and the interquartile range by the shaded box surrounding it. Maximum and minimum values among the household surveys are connected by vertical lines.The median proportion of a population sleeping under an ITN, among household surveys conducted between 2013 and 2014, is shown by a horizontal bar, and the interquartile range by the shaded box surrounding it. Maximum and minimum values among the household surveys are connected by vertical lines.

18 | Achieving the MAlAriA MDg tArget: reversing the inciDence of MAlAriA 2000–2015
4.1 ProgressIndicator 6.8 is shown only for sub-Saharan Africa, where malaria is concentrated in children aged under 5 years. Furthermore, this indicator is primarily concerned with ACTs, which are recommended by WHO to treat the P. falciparum malaria that comprises more than 99% of cases in sub-Saharan Africa. As explained below, the value of the indicator is not expected to reach 100% because the indicator is concerned with fever cases, and not all fevers are due to malaria.
The use of ACTs for the treatment of fever in children has risen steadily since they were first recommended by WHO in 2000 for treatment of P. falciparum malaria, in response to increasing parasite resistance to previously used antimalarial medicines (Fig. 9). Nonetheless, in 2015, only 13% of
children with fever are estimated to have received an ACT. The use of other antimalarial medicines has decreased as ACTs have progressively replaced them; hence, among those treated with an antimalarial, the proportion who receive an ACT has increased. The proportion of febrile children treated with any antimalarial medicine has decreased from 46% in 2000 to 26% in 2015.
Indicator 6.8 is difficult to interpret because:
● not all fevers are due to malaria; thus, febrile children diagnosed with respiratory disease, ear infections or diarrhoea do not necessarily need an antimalarial medicine;
● as the incidence of malaria decreases with expanded malaria prevention programmes
4. Indicator 6.8Proportion of children under 5 with fever who are treated with appropriate antimalarial drugs
Figure 9. Estimated proportion of febrile children receiving antimalarial medicine, sub-Saharan Africa, 2000–2015
50%
40%
30%
20%
10%
0%
Prop
ortio
n
201420132012201120102009200820072006200520042003200220012000 2015
Source: Malaria treatment model produced by the Center for Applied Malaria Research and Evaluation (CAMRE), the Global Health Group (GHG) at the University of California, San Francisco (UCSF) and the Malaria Atlas Project (MAP)
ACTOther antimalarial

Indicator 6.8
Achieving the MAlAriA MDg tArget: reversing the inciDence of MAlAriA 2000–2015 | 19
and socioeconomic improvements, a smaller proportion of fevers are expected to be due to malaria and many children will therefore not require treatment with an antimalarial medicine; and
● an increase in the availability of diagnostic testing in sub-Saharan Africa, and the publication in 2010 of revised WHO recommendations for diagnostic testing to be undertaken before antimalarial treatment (3) has led to a reduced
proportion of fevers being classified as malaria and needing an ACT.
In summary, because the indicator is concerned with fever cases rather than true malaria cases, the value of the indicator is not expected to be 100%. Despite difficulties in interpreting Indicator 6.8, the low rates of use of ACTs in children with fever suggest there may be problems for children to access effective antimalarial medicines.

Indicator 6.8
20 | Achieving the MAlAriA MDg tArget: reversing the inciDence of MAlAriA 2000–2015
4.2 Reducing bottlenecks to accessing an ACTThe low proportion of children in sub-Saharan Africa with fever that receive an ACT is mainly due to two factors. First, care was not sought outside of the home for approximately a third of children with fever (median of 35% among household surveys conducted between 2012 and 2014) (Fig 10). This may be because of poor access to health-care providers or to a lack of awareness among caregivers regarding necessary care for febrile children. Second, when febrile children are taken for care, most do not receive an ACT; the prospect of febrile children receiving ACTs will be influenced by the type of provider they access, whether the provider is legislated to provide ACTs and, if so, whether the provider has adequate stocks and whether the patient can afford any charges for medicines.
Efforts are needed to:
● encourage caregivers to bring febrile children to care;
● ensure that trained and equipped health-care providers are available;
● ensure ACTs are available where children seek care; and
● ensure that children receive appropriate treatment when care is sought.
This can be accomplished by expanding the number of public health-care providers, improving quality of care in the public and private sector, or expanding malaria diagnosis and treatment at the community level (Box 2).
Figure 10. Proportion of febrile children under 5 receiving antimalarial medicines, by health-care sector attendance, from household surveys conducted in sub-Saharan Africa, 2012–2014
50%
40%
30%
20%
10%
0%
Prop
ortio
n
Not seeking carePrivate sectorPublic sector
Source: Household surveys in sub-Saharan Africa, 2012–2014
Received ACTReceived other antimalarialDid not receive antimalarial

Indicator 6.8
Achieving the MAlAriA MDg tArget: reversing the inciDence of MAlAriA 2000–2015 | 21
Box 2. Integrated management of childhood illnesses and integrated community case management WHO and the United Nations Children’s Fund (UNICEF) have long recommended the integrated management of childhood illness (IMCI) at health facility level and as part of integrated community case management (iCCM). These integrated approaches deal with the three main killers of children: pneumonia, diarrhoea and malaria. Effective delivery of IMCI and iCCM requires a proper regulatory environment, trained facility and community-based health workers, sufficient financing and a functioning supply chain for all required commodities and equipment (e.g. oral rehydration solution, antibiotics, respiratory timers, RDTs and ACTs).
Expanding access to treatment of common illnesses at the community level can directly benefit those living in the poorest households. For example, in Rwanda, the community health network is a key part of the health system, and community-based health workers have represented an important source of care for childhood illness over the past decade, particularly for children from the poorest households and those living in rural areas (Fig. B2). There is, however, a continued need to improve access to care for the poorest populations.
Figure B2. Proportion of children under 5 with fever who sought care in 2013, by type of provider, for a) the poorest and the richest quintiles, and b) rural and urban areas
100%
80%
60%
40%
20%
0%
RichestPoorest
(a)
■ Public ■ Private formal ■ Community health worker ■ Private informal ■ Other
100%
80%
60%
40%
20%
0%
UrbanRural
(b)
Source: Rwanda Malaria Indicator Survey, 2013

Indicator 6.8
22 | Achieving the MAlAriA MDg tArget: reversing the inciDence of MAlAriA 2000–2015
4.3 The need for increased diagnostic testingThe proportion of patients with suspected malaria who undergo a diagnostic test at public health facilities has increased markedly in recent years, largely due to the increased use of RDTs (Fig. 11).
In spite of advances in testing, most children suspected of having malaria still do not receive a diagnostic test. Many of these children do not have malaria and their fever may be due to other causes. Giving antimalarial medicines to children who have a fever but do not have malaria can prolong their illness and increase the risk of severe illness and death. With medicines in short supply, it may also deny a patient infected with malaria the medicine they need.
Increased malaria diagnostic testing – be it with microscopy or RDTs – accompanied by supportive supervision and training could help to ensure that
available ACTs are provided only to those infected with the malaria parasite and those without malaria receive treatment appropriate to their condition. If access to diagnostic testing were increased further, and providers adhered to the test results, the ACT medicines saved could be used to treat malaria cases that currently do not receive ACTs.
As malaria incidence continues to decrease across sub-Saharan Africa, the benefits of diagnostic testing increase, with fewer childhood fevers found to be due to malaria and requiring ACTs. Presumptive treatment with ACTs for children with fever is discouraged, unless diagnostic testing is not readily available, as it puts children at risk of inappropriate treatment, particularly when the likelihood of malaria infection is low.
Figure 11. Proportion of patients with suspected malaria attending public health facilities in sub-Saharan Africa that undergo a malaria diagnostic test, 2000–2013
By microscopyBy RDT
100%
80%
60%
40%
20%
0%
Prop
ortio
n
2012201120102009200820072006200520042003200220012000 2013
Source: National malaria control programme data from 47 malaria-endemic countries in sub-Saharan Africa

Indicator 6.8
Achieving the MAlAriA MDg tArget: reversing the inciDence of MAlAriA 2000–2015 | 23

24 | Achieving the MAlAriA MDg tArget: reversing the inciDence of MAlAriA 2000–2015
5.1 Malaria control’s contribution to achievement of other MDGsThe world has witnessed a transformation in the landscape of malaria since 2000. The MDG target of reversing the incidence of malaria has been met glob-ally, with substantial reductions in malaria incidence and mortality rates. In addition, 13 fewer countries are now reporting malaria cases than in 2000.
MDG 6 has a specific focus on malaria, but malaria control is also critical to achieving other MDGs. Malaria primarily occurs in low and lower-middle income countries, and within these countries, the poorest and most marginalized communities are the most affected. The disease reduces the number of days worked among both those infected and those who care for them, and can inflict significant expenditures in accessing treatment or prevention. Thus, malaria control and, ultimately its elimination, is inextricably linked to MDG 1 (poverty reduction). Malaria also disrupts schooling; therefore, reductions in malaria contribute to the achievement of MDG 2 (universal primary education).
Progress in reducing the malaria death rates among children aged under 5 years by 65% is also central
to achieving MDG 4 (a two thirds reduction in the mortality rate from all causes among children aged under 5 years). In 2000, malaria accounted for 12% of post-neonatal child deaths globally, and 22% in Africa where it was the leading cause of death among children aged 1-59 months. Malaria also increases mortality rates from other childhood illnesses such as pneumonia and diarrhoea. In addition, malaria in pregnancy can lead to low birth weight in newly born children, an important contributor to under-5 mortality.
Malaria control also contributes to achievement of MDG 5 (improving maternal health). Malaria is an important cause of morbidity and mortality in pregnancy, contributing to maternal anaemia in areas of high to moderate transmission and is an important cause of severe morbidity and deaths of pregnant women in areas of low transmission. In all settings, malaria has a negative impact on pregnancy outcomes, such as inducing miscarriage, prematurity and low birth weight.
5. Beyond MDG 6
Figure 12. Growth in international financing for malaria, 2000–2013
2500
2000
1500
1000
500
0
US$
(mill
ion)
20132012201120102009200820072006200520042003200220012000
Source: GFATM and PMI websites; Organisation for Economic Co-operation and Development (OECD) creditor reporting system
Global Fund
USAID/PMI
DFID
World Bank
AMFm
CIDA
AusAID
Other

Beyond MDG 6
Achieving the MAlAriA MDg tArget: reversing the inciDence of MAlAriA 2000–2015 | 25
5.2 Drivers of changeA number of factors have contributed to the tremendous progress seen since 2000: increased financing, improved planning and partnerships, innovation, development and strengthening of health systems and economic development. These drivers of change are discussed below.
5.2.1 FinancingInternational financing for malaria control has increased 20 fold since 2000, and domestic invest-ments have also increased from one year to the next (Fig. 12).
The establishment of various initiatives – the Global Fund to Fight AIDS, Tuberculosis and Malaria (GFATM) and the US President’s Malaria Initiative (PMI) – coupled with increased investments from domestic and other international sources, has led to an expansion of malaria preventive and treatment programmes, as illustrated by MDG Indicators 6.7 and 6.8. International funding has been targeted towards countries with the highest malaria incidence and mortality rates in 2000; consequently, these countries have experienced the greatest numbers of malaria cases and deaths averted.
5.2.2 Planning and partnershipsMalaria control is now squarely on the agenda of ministries of health and international agencies, who have aligned their malaria control policies with WHO recommendations. All partners united their efforts around a Global Malaria Action Plan that responded to a call for universal access to malaria interventions by the United Nations Secretary-General in 2008. Malaria-endemic countries have defined national strategies that aim to ensure that cost-effective interventions are accessible to all in need. Effective partnerships have been formed at country level to help implement national strategic plans.
5.2.3 InnovationProgrammes have also benefited from technologies that were not available in 2000 and innovative delivery strategies. LLINs have eliminated the need to retreat nets with insecticide, and mass campaigns have allowed wider coverage of vector-control programmes. ACTs have provided a highly effective treatment against P. falciparum malaria, which was previously resistant to commonly used antimalarial medicines. Also, RDTs have increased access to diagnostic testing and enabled malarial fevers to be distinguished from non-malarial fevers, allowing antimalarial medicines to be targeted only to those who need them.
5.2.4 Development of health systems In many countries, particularly in sub-Saharan Africa, programme implementation has been facilitated by the strengthening of public health delivery systems and health workforces. An increased number of health facilities and, in some countries, national health insurance schemes, have made malaria services more accessible by reducing geographical and financial barriers.
5.2.5 Economic development Rapid growth in the economies of many malaria-endemic countries has translated into improved nutrition, housing, transport and healthier behaviours, all of which can lower the risk of acquiring malaria, or reduce the adverse consequences of malaria infections. Although transport and communications systems have many benefits, they also convey additional risks, as it becomes increasingly possible for malaria to be carried from one place to another.

Beyond MDG 6
26 | Achieving the MAlAriA MDg tArget: reversing the inciDence of MAlAriA 2000–2015
5.3 Looking to the future
5.3.1 The challenges ahead
As the world moves from the MDGs to the Sustainable Development Goals (SDGs), it is imperative that the fight against malaria continues. It is estimated that, in 2015, malaria will have caused 214 million cases (range: 149–303 million) and 438 000 deaths (range: 236 000–635 000). Most of these cases (89%) and deaths (91%) will have occurred in sub-Saharan Africa, and progress must be accelerated in those countries that account for the bulk of the disease burden.
Millions of people at risk of malaria still do not have access to an ITN, IRS, malaria diagnostic testing or ACTs. Access to these life-saving interventions is lowest among those living in the poorest households. Strategies that enable malaria interventions to be accessed by the poorest households (e.g. free distribution of ITNs and access to community-based treatment) will continue to be important in continuing to drive malaria down.
The fight against malaria must also account for the ever-growing threat of drug and insecticide resistance. As the coverage of malaria programmes expands, the selection pressure for resistance to malaria prevention and treatment measures increases. Thus, it is important to undertake monitoring of resistance to insecticides and antimalarial medicines, and adopt policies that minimize the risk of resistance.
5.3.2 Directions forward
In response to the challenges that remain, two documents have been developed that describe the directions forward for malaria in the years 2016–2030:
● Global technical strategy for malaria 2016–2030 (5) – developed by WHO in conjunction with a range of stakeholders, provides guidance on further reducing malaria morbidity and mortality, and ultimately achieving a world free of malaria; and
● Action and investment to defeat malaria 2016–2030 (AIM) (6), developed by the Roll Back Malaria Partnership, builds the case for investment in malaria and provides a guide for collective action for all those engaged in the fight against malaria.
The two documents share the same targets and milestones, which are the most ambitious since the Global Malaria Eradication Programme of more than 50 years ago (Table 3).
The targets and milestones will be achieved by:
● ensuring universal access to malaria prevention, diagnosis and treatment;
● accelerating efforts towards elimination and attainment of malaria-free status; and
● transforming malaria surveillance into a core intervention.
These core strategies will be reinforced by research and innovation, and by building a conducive enabling environment. Particular attention will be paid to increasing international and domestic financing, strengthening of health systems, and the engagement of a wide range of stakeholders in the fight against malaria.
The rate of expansion required of malaria programmes between 2016 and 2030 has been mapped out, and funding requirements to meet the targets and milestones for 2020, 2025 and 2030 have been identified (of US$ 6.4 billion by 2020,

Beyond MDG 6
Achieving the MAlAriA MDg tArget: reversing the inciDence of MAlAriA 2000–2015 | 27
US$ 7.7 billion by 2025 and US$ 8.7 billion by 2030). If these resources can be secured, and malaria programmes implemented, the malaria landscape will change even more dramatically than it has over
the past 15 years, and malaria will become a thing of the past for many populations in the world.
Table 3. Goals, milestones and targets from the Global technical strategy for malaria 2016–2030 and Action and investment to defeat malaria 2016–2030 (AIM)
Vision A world free of malaria
GoalsMilestones Targets
2020 2025 2030
1. Reduce malaria mortality rates globally compared with 2015 ≥40% ≥75% ≥90%
2. Reduce malaria case incidence globally compared with 2015 ≥40% ≥75% ≥90%
3. Eliminate malaria from countries in which malaria was transmitted in 2015
At least 10 countries
At least 20 countries
At least 35 countries
4. Prevent re-establisment of malaria in all countries that are malaria-free
Re-establisment prevented
Re-establisment prevented
Re-establisment prevented

28 | Achieving the MAlAriA MDg tArget: reversing the inciDence of MAlAriA 2000–2015
1. Road map towards the implementation of the United Nations Millennium Declaration United Nations General Assembly. 2001 (http://www.unmillenniumproject.org/documents/a56326.pdf, accessed 23 August 2015).
2. United Nations Millennium Declaration. United Nations General Assembly. 2000 (http://www.unmillenniumproject.org/documents/ares552e.pdf, accessed 23 August 2015).
3. WHO. Guidelines for the treatment of malaria. Geneva, World Health Organization (WHO). 2010 (http://www.ncbi.nlm.nih.gov/books/NBK254223/, accessed 8 April 2015).
4. Noor AM, Kirui VC, Brooker SJ, Snow RW. The use of insecticide treated nets by age: implications for universal coverage in Africa. BMC Public Health. 2009;9:369 (http://www.ncbi.nlm.nih.gov/pubmed/19796380, accessed 3 September 2015).
5. Global technical strategy for malaria 2016–2030. Geneva, World Health Organization (WHO). 2015 (http://www.who.int/malaria/publications/atoz/9789241564991/en/, accessed 23 August 2015).
6. Action and investment to defeat malaria 2016–2030 (AIM). Geneva, World Health Organization (WHO). 2015 (http://www.rollbackmalaria.org/files/files/aim/RBM_AIM_Report_A4_AW_EN_lores.pdf, accessed 23 August 2015).
References
Annex 1
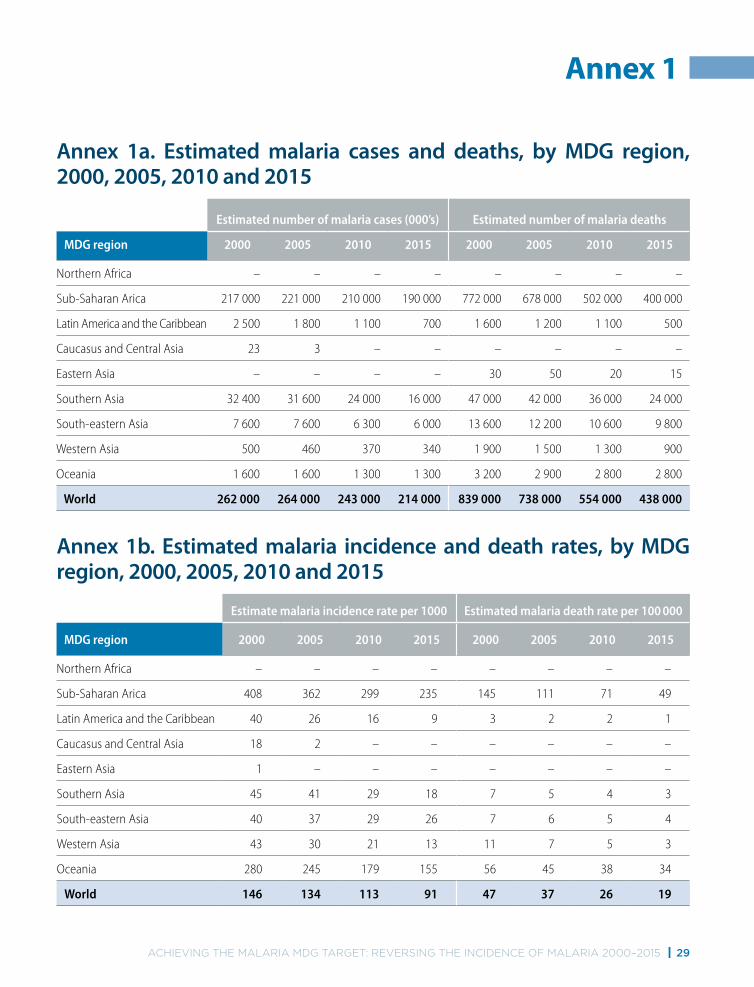
Annex 1a. Estimated malaria cases and deaths, by MDG region, 2000, 2005, 2010 and 2015
Estimated number of malaria cases (000’s) Estimated number of malaria deaths
MDG region 2000 2005 2010 2015 2000 2005 2010 2015
Northern Africa – – – – – – – –
Sub-Saharan Arica 217 000 221 000 210 000 190 000 772 000 678 000 502 000 400 000
Latin America and the Caribbean 2 500 1 800 1 100 700 1 600 1 200 1 100 500
Caucasus and Central Asia 23 3 – – – – – –
Eastern Asia – – – – 30 50 20 15
Southern Asia 32 400 31 600 24 000 16 000 47 000 42 000 36 000 24 000
South-eastern Asia 7 600 7 600 6 300 6 000 13 600 12 200 10 600 9 800
Western Asia 500 460 370 340 1 900 1 500 1 300 900
Oceania 1 600 1 600 1 300 1 300 3 200 2 900 2 800 2 800
World 262 000 264 000 243 000 214 000 839 000 738 000 554 000 438 000
Annex 1b. Estimated malaria incidence and death rates, by MDG region, 2000, 2005, 2010 and 2015
Estimate malaria incidence rate per 1000 Estimated malaria death rate per 100 000
MDG region 2000 2005 2010 2015 2000 2005 2010 2015
Northern Africa – – – – – – – –
Sub-Saharan Arica 408 362 299 235 145 111 71 49
Latin America and the Caribbean 40 26 16 9 3 2 2 1
Caucasus and Central Asia 18 2 – – – – – –
Eastern Asia 1 – – – – – – –
Southern Asia 45 41 29 18 7 5 4 3
South-eastern Asia 40 37 29 26 7 6 5 4
Western Asia 43 30 21 13 11 7 5 3
Oceania 280 245 179 155 56 45 38 34
World 146 134 113 91 47 37 26 19
Achieving the MAlAriA MDg tArget: reversing the inciDence of MAlAriA 2000–2015 | 29
30 | Achieving the MAlAriA MDg tArget: reversing the inciDence of MAlAriA 2000–2015
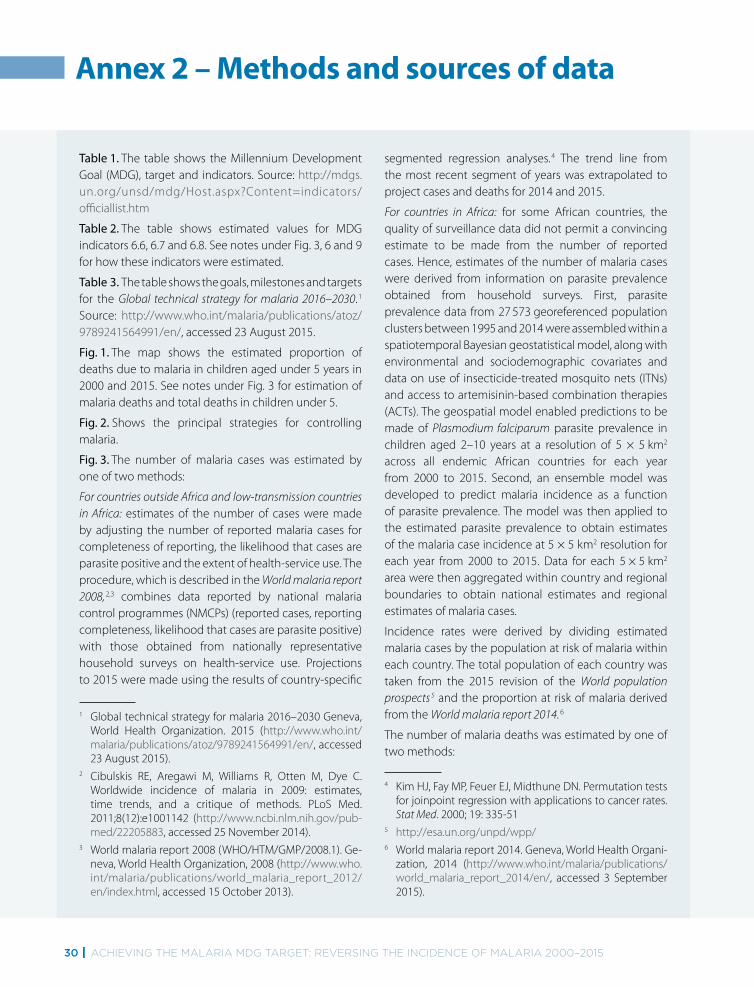
Table 1. The table shows the Millennium Development Goal (MDG), target and indicators. Source: http://mdgs.un.org/unsd/mdg/Host.aspx?Content=indicators/officiallist.htm
Table 2. The table shows estimated values for MDG indicators 6.6, 6.7 and 6.8. See notes under Fig. 3, 6 and 9 for how these indicators were estimated.
Table 3. The table shows the goals, milestones and targets for the Global technical strategy for malaria 2016–2030. 1 Source: http://www.who.int/malaria/publications/atoz/ 9789241564991/en/, accessed 23 August 2015.
Fig. 1. The map shows the estimated proportion of deaths due to malaria in children aged under 5 years in 2000 and 2015. See notes under Fig. 3 for estimation of malaria deaths and total deaths in children under 5.
Fig. 2. Shows the principal strategies for controlling malaria.
Fig. 3. The number of malaria cases was estimated by one of two methods:
For countries outside Africa and low-transmission countries in Africa: estimates of the number of cases were made by adjusting the number of reported malaria cases for completeness of reporting, the likelihood that cases are parasite positive and the extent of health-service use. The procedure, which is described in the World malaria report 2008, 2,3 combines data reported by national malaria control programmes (NMCPs) (reported cases, reporting completeness, likelihood that cases are parasite positive) with those obtained from nationally representative household surveys on health-service use. Projections to 2015 were made using the results of country-specific
1 Global technical strategy for malaria 2016–2030 Geneva, World Health Organization. 2015 (http://www.who.int/malaria/publications/atoz/9789241564991/en/, accessed 23 August 2015).
2 Cibulskis RE, Aregawi M, Williams R, Otten M, Dye C. Worldwide incidence of malaria in 2009: estimates, time trends, and a critique of methods. PLoS Med. 2011;8(12):e1001142 (http://www.ncbi.nlm.nih.gov/pub-med/22205883, accessed 25 November 2014).
3 World malaria report 2008 (WHO/HTM/GMP/2008.1). Ge-neva, World Health Organization, 2008 (http://www.who.int/malaria/publications/world_malaria_report_2012/en/index.html, accessed 15 October 2013).
segmented regression analyses. 4 The trend line from the most recent segment of years was extrapolated to project cases and deaths for 2014 and 2015.
For countries in Africa: for some African countries, the quality of surveillance data did not permit a convincing estimate to be made from the number of reported cases. Hence, estimates of the number of malaria cases were derived from information on parasite prevalence obtained from household surveys. First, parasite prevalence data from 27 573 georeferenced population clusters between 1995 and 2014 were assembled within a spatiotemporal Bayesian geostatistical model, along with environmental and sociodemographic covariates and data on use of insecticide-treated mosquito nets (ITNs) and access to artemisinin-based combination therapies (ACTs). The geospatial model enabled predictions to be made of Plasmodium falciparum parasite prevalence in children aged 2–10 years at a resolution of 5 × 5 km2
across all endemic African countries for each year from 2000 to 2015. Second, an ensemble model was developed to predict malaria incidence as a function of parasite prevalence. The model was then applied to the estimated parasite prevalence to obtain estimates of the malaria case incidence at 5 × 5 km2 resolution for each year from 2000 to 2015. Data for each 5 × 5 km2 area were then aggregated within country and regional boundaries to obtain national estimates and regional estimates of malaria cases.
Incidence rates were derived by dividing estimated malaria cases by the population at risk of malaria within each country. The total population of each country was taken from the 2015 revision of the World population prospects 5 and the proportion at risk of malaria derived from the World malaria report 2014. 6
The number of malaria deaths was estimated by one of two methods:
4 Kim HJ, Fay MP, Feuer EJ, Midthune DN. Permutation tests for joinpoint regression with applications to cancer rates. Stat Med. 2000; 19: 335-51
5 http://esa.un.org/unpd/wpp/6 World malaria report 2014. Geneva, World Health Organi-
zation, 2014 (http://www.who.int/malaria/publications/world_malaria_report_2014/en/, accessed 3 September 2015).
Annex 2 – Methods and sources of data

Annex 2
Achieving the MAlAriA MDg tArget: reversing the inciDence of MAlAriA 2000–2015 | 31
For countries outside Africa and for low-transmission countries in Africa: the number of deaths was estimated by multiplying the estimated number of P. falciparum malaria cases by a fixed case fatality rate for each country, as described in the World malaria report 2008. This method was used for all countries outside Africa and for low transmission countries in Africa where estimates of case incidence were derived from routine reporting systems. A case fatality rate of between 0.01% and 0.40% was applied to the estimated number of P. falciparum cases and a case fatality rate of between 0.01% and 0.06% was applied to the estimated number of P. vivax cases. For countries approaching elimination and those with vital registration systems that reported more than 50% of all deaths, the number of malaria deaths was derived from the number of reported deaths, adjusting for completeness of reporting.
For countries in Africa with a high proportion of deaths due to malaria: child malaria deaths were estimated using a verbal autopsy multi-cause model developed by the Maternal and Child Health Epidemiology Estimation Group to estimate causes of death for children aged 1–59 months. 7 Mortality estimates were derived for seven causes of post-neonatal death (pneumonia, diarrhoea, malaria, meningitis, injuries, pertussis and other disorders), causes arising in the neonatal period (prematurity, birth asphyxia and trauma, sepsis, and other conditions of the neonate) and other causes (e.g. malnutrition). Deaths due to measles, unknown causes and HIV/AIDS were estimated separately. The resulting cause-specific estimates were adjusted, country by country, to fit the estimated 1–59 month mortality envelopes (excluding HIV and measles deaths) for corresponding years. Estimated malaria parasite prevalence, as described above, was used as a covariate within the model. Deaths in those above the age of 5 years were inferred from a relationship between levels of malaria mortality in different age groups and the intensity of malaria
7 Liu L, Oza S, Hogan D, Perin J, Rudan I, Lawn JE et al. Global, regional, and national causes of child morta-lity in 2000-13, with projections to inform post-2015 priorities: an updated systematic analysis. Lancet. 2015;385(9966):430-440 (http://www.ncbi.nlm.nih.gov/pubmed/25280870, accessed 19 November 2014).
transmission; 8 thus, the estimated malaria mortality rate in children aged under 5 years was used to infer malaria-specific mortality in older age groups.
Malaria death rates were derived by dividing annual malaria deaths by the mid-year population at risk of malaria within each country. The total population of each country was taken from the 2015 revision of the World population prospects and the proportion at risk of malaria, derived from the World malaria report 2014. Where death rates are quoted for children aged under 5 years, the number of deaths estimated in children under 5 were divided by the estimated number of children under 5 at risk of malaria.
The number of malaria cases and deaths averted between 2001 and 2015 was estimated by calculating the difference between the cumulated number of cases and deaths that would have occurred each year if incidence and death rates had remained at 2000 levels until 2015 (i.e. had there been no progress) and the cumulated number of cases and deaths that actually occurred each year based on the estimated annual deaths rates. The denominators used were the population at risk within relevant age categories.
Fig. 4. Incidence and death rates were calculated as for Fig. 3. MDG regional groupings are summarized at: http://mdgs.un.org/unsd/mdg/Resources/Static/Data/Regional%20groupings.doc.
Fig. 5. The total number of cases and deaths for each country was estimated as for Fig. 3.
Fig. 6. Estimates of ITN coverage were derived from a model developed by the Malaria Atlas Project (MAP), University of Oxford. The model incorporates three sources of information.
● data on the number of long-lasting insecticidal nets (LLINs) delivered by manufacturers to countries, as provided by Milliner Global Associates to WHO;
● data on ITNs distributed within countries, as reported by NMCPs to WHO; and
8 Ross A, Maire N, Molineaux L, Smith T. An epidemiolo-gic model of severe morbidity and mortality caused by Plasmodium falciparum. Am J Trop Med Hyg. 2006;75(2 Suppl):63–73 (http://www.ajtmh.org/content/75/2_sup-pl/63, accessed 26 November 2014)

32 | Achieving the MAlAriA MDg tArget: reversing the inciDence of MAlAriA 2000–2015
● nationally representative household surveys from
39 sub-Saharan African countries from 2001 to 2014.
A two-stage process was followed. First, a mechanism was defined for estimating net crop – that is, the total number of ITNs in households in a country at a given point in time – taking into account inputs to the system (e.g. deliveries of ITNs to a country) and outputs (e.g. loss of ITNs from households). Second, empirical modelling was used to translate estimated net crops into resulting levels of coverage (e.g. access within households, use in all ages and use among children aged under 5 years). Further details of the modelling strategy are available in the World malaria report 2014 (pages 169–170).
Fig. 7. The proportion of children sleeping under an ITN was derived from demographic and health surveys, multiple indicators cluster surveys, malaria indicators surveys, and other national surveys conducted between 2000 and 2015. Data were obtained from the United Nations Children’s Fund (UNICEF) global databases 2015, available at http://data.unicef.org/child-health/malaria.
Fig. 8. The figure shows the proportion of the population sleeping under an ITN, by specific population groups. The median proportion of a population sleeping under an ITN, among household surveys conducted between 2013 and 2014, is shown by a horizontal bar, and the interquartile range by the shaded box surrounding it. Maximum and minimum values among the household surveys are connected by vertical lines.
Fig. 9. Estimates of the proportion of febrile children aged under 5 years receiving an ACT or other antimalarial medicine were derived from a model developed by the Malaria Atlas Project (MAP), University of Oxford, the Center for Applied Malaria Research and Evaluation (CAMRE), Tulane University and the Global Health Group, University of California San Francisco. The proportion of febrile children aged under 5 years receiving an ACT, or other antimalarial medicine, was obtained from 99 available household surveys conducted between 2000 and 2014. Data on the number of ACTs and other antimalarial medicines distributed were obtained from NMCPs as described in the World malaria report 2014. For country-years with no household survey, values were imputed using a mixed model that took into account the spatial and temporal sparseness of the data, and
incorporated the relationship between the proportion of children receiving antimalarial medicines and data on antimalarial medicine distribution across countries.
Fig. 10. The proportion of children seeking care at public and private health facilities and receiving an ACT was derived from 23 household surveys conducted between 2012–2014. Values shown are the medians of available household surveys.
Fig. 11. The proportion of suspected malaria cases receiving a malaria diagnostic test in public facilities was calculated from NMCP reports to WHO. Both rapid diagnostic tests (RDTs) and microscopic slide examinations were considered.
Fig. 12. International financing data were obtained from three sources. The Global Fund supplied information on disbursements for malaria control to WHO up to 2013. Information on funding from the United States Agency for International Development (USAID) was obtained from ForeignAssistance.gov. Malaria funding for the United States Centers for Disease Control and Prevention was obtained from Congressional Justifications and Operating Plans. For other development agencies, information on disbursements was available up to and including 2012, through the Development Co-operation Directorate database on official development assistance 9 of the Organisation for Economic Co-operation and Development (OECD). Contributions from the Department for International Development (DFID), United Kingdom of Great Britain and Northern Ireland were assumed to have increased in 2013 in line with 2010–2012 disbursements. For other agencies, funding for 2013 was assumed to have remained at 2012 levels.
Fig. Box 1. The proportion of children sleeping under an ITN was derived from Demographic and Health Surveys conducted in the United Republic of Tanzania in 2004 and 2010 and Malaria Indicator Surveys in 2007 and 2011.
Fig. Box 2. The proportion of children aged under 5 years with fever who sought care by different types of provider was derived from the Rwanda Malaria Indicator Survey conducted in 2013.
9 http://stats.oecd.org/Index.aspx?datasetcode=CRS1#


ISBN 978 92 4 150944 2For further information please contact:
Global Malaria ProgrammeWorld Health Organization20, avenue AppiaCH-1211 Geneva 27Web: www.who.int/malariaEmail: [email protected]
United Nations Children’s Fund3 United Nations PlazaNew York, NY 10017, USAWebsite: www.data.unicef.orgEmail: [email protected]