reversing diabetes naturally therapeutic effects of a vegan lifestyle
TRANSCRIPT

Reversing Diabetes with
Medical Nutrition Therapy:
Therapeutic Effects of A
Vegan Lifestyle
Jen King

Outline
Background
Review Articles
Article 1
Article 2
Article 3
Conclusions
Suggestions for Future Research
Questions
Significance of Type 2
Rising health epidemic in U.S.
Most common form of diabetes; 90-95% of DM
Preventable
23.6 million Americans with DM
165% projected increase by 2050
5th leading cause of death

Type 2 Diabetes
Diabetes Mellitus (DM)
Combination of insulin resistance and beta cell failure
“Non-insulin dependent”
Progressive disease
Risk factors: obesity, or have abdominal obesity; age, lack of physical activity

“Normal” Actions of Insulin
Secreted by the pancreas
Effects:
Increase uptake of glucose into skeletal muscle and adipose tissue
Decrease hepatic glucose production
Decrease release of NEFAs from adipose tissue
Diabetes: defective insulin production and/or action (IR). Above effects of insulin do not occur

Obesity and Insulin Resistance
Obesity (abdominal visceral)
Increased release of FFAs from adipocytes
Increases FFA flux to the liver, which causes an increase in hepatic glucose production, and a decrease in glucose utilization.
RESULT: Increase Blood Glucose Levels
*Defects in insulin signaling, so insulin does not effectively facilitate glucose entry into cells

Signs and Symptoms
Hyperglycemia
Glycosuria
Polyuria
Polydipsia
Dehydration

Related Health Complications
Hypoglycemia
Hyperglycemia
Ketoacidosis
Long-term damage
Eye complications (diabetic
retinopathy)
Kidney disease
Nerve Damage/Neuropathy
Heart disease and stroke

Methods of Diagnosis
Fasting plasma glucose (FPG)
Casual plasma glucose (any time of day)
Oral glucose tolerance test (OGTT)
Due to ease and cost, FPG tests is
recommended

Diagnosis

Diabetes Management
Intensive glycemic control
Balanced diet, proper nutrition
Regular exercise or physical activity
Smoking cessation
Specifically to type 2:
Monitor and treat risk factors and associated
conditions:
Hyperlipidemia
Hypertension
Obesity

Traditional Therapies
Testing blood sugar levels
A1C test
Blood glucose meter
Exercise and diet
Oral pill therapies
biguanides, thiazolidinediones
Insulin

Current Nutrition Therapies
General: Low-carb/low sugar/low glycemic index
Low-fat diet
Mediterranean diet slow digested foods leading to even blood sugar
Low-fat Vegetarian Diet Same benefits above
Decrease saturated fat Effect on insulin signaling
Note: Traditional and nutrition therapies have been used to reduce symptoms, not cure.

Emergence of Vegan Therapy
Dr. Barnard
Vegan: only current
therapy that is proving
not only to reduce
symptoms, but to
actually to reverse the
disease

Former Research Statements
“Plant-based diets rich in legumes and slowly
digested grains may improve glucose
tolerance, insulin sensitivity, and the
successful management of type 2 diabetes.”
“Diabetes and a Vegetarian Diet”, www.vrg.org

Former Research Statements
Vegetarian diets reduce: some cancers, heart
disease, obesity, and type 2 diabetes
Vegan diets reduce: prostate cancer, weight,
heart disease, cholesterol

Vegetarian vs. Vegan
Vegetarians
-avoid meat and/or animal products. Vegetarian diet includes only foods from plants: like fruits, vegetables, whole grain products, nuts, seeds, and legumes
Vegans-strict vegetarian; eliminating all animal products
-*no dairy
Despite such dietary restrictions, a balanced vegan diet is perfectly healthy

What about dairy?
Dairy elimination is the key difference
between vegetarian and vegan lifestyles
Bovine protein
Bovine serum lactobumin = triggers diabetes

Terminology
HbA1c (A1c): test that measures the amount of blood glucose within the last 3 months
glycemic index: a numerical index given to a carbohydrate-rich food that is based on the average increase in blood glucose levels occurring after
Low density lipoprotein (LDL)-cholesterol: “bad cholesterol”; low-density lipoproteins transport cholesterol from the liver to the tissues of the body
Polyunsaturated fatty acids (PUFA): fatty acids that have more than one double or triple bond per molecule; good fat
Affinity chromatography: a method of separating and identifying the components of a complex mixture; one such substance being immobilized and acting as the sorbent

A Low-Fat Vegan Diet Improves
Glycemic Control and
Cardiovascular Risk Factors in a
Randomized Clinical Trial in
Individuals With Type 2 Diabetes
Article 1Barnard N, Cohen J, Jenkins D, Turner-
McGrievy G, Gloede L, Jaster B, Siede K,
Green A, Talpers S

Objective
Objective
To investigate whether a low-fat vegan diet
improves glycemic control and cardiovascular risk
factors in individuals with Type 2 diabetes.
Main outcomes
Glycemic, plasma lipid, and weight control

Subjects
99 individuals with type 2 diabetes
49 followed low-fat vegan diet
22 m, 27 f
50 followed control diet*
17 m, 33 f
A1c was determined and volunteers were
ranked in order of concentrations
Randomly assigned in sequential pairs

Interventions
Vegan group 10% fat, 15% protein, 75% CHO
Include vegetables, fruits, grains, legumes
Avoid animal products and added fats
*Portion sizes, energy intake, and CHO intake were unrestricted
Control group American Diabetes Association (ADA) guidelines
15-20% protein, <7% saturated fat, 60-70% CHO, cholesterol and saturated fat <200 mg/day
*Individualized based on body weight and plasma lipid concentrations
Both groups asked to not alter exercise habits
Research Design
Randomized control trial
Each met with RD for 1 hr initially
Met weekly for 1 hr with assigned groups throughout study
Unannounced phone calls for dietary recall
In addition, 3-day dietary records were completed
Physical activity was assessed over a 3-day period (pedometer)

Lab Measurement Tools
Laboratory measurements by blind technicians
Abbott Spectrum Analyzer
plasma glucose, plasma cholesterol, triglycerides
Friedewald equation
LDL cholesterol
Urinary albumin measured using anionic dye-binding assay
Bouchard 3-Day Physical Activity Record

Statistical Methods
Abbott IMx analyzer
T-tests
Regression analyses
Pearson correlations
Interim analysis

Results
Both groups reduced energy intake and
protein intake
CHO intake increased in the vegan group
Fat intake fell in both groups
Pedometer readings had no significant
interest/difference between groups

Results: Dietary effects on
clinical measures
43% of the vegan group and 26% of the ADA group participants reduced diabetes medications.
Including all participants, A1c decreased 0.96 percentage points in the vegan group and 0.56 points in the ADA group.
Excluding those who changed medications, A1c fell 1.23 points in the vegan group compared with the 0.38 points in the ADA group.
Body weight decreased 6.5 kg in the vegan group and 3.1 kg in the ADA group.
Among those who did not change lipid-lowering medications, LDL cholesterol fell 21.2% in the vegan group and 10.7% in the ADA group.
Urinary albumin reductions were greater in the vegan group (15.9 mg/24 h) than in the ADA group (10.9 mg/24 h)

A1c at baseline, 11, & 22 wks

Conclusion
Both a low-fat vegan diet and a diet based on
ADA guidelines improved glycemic and lipid
control in type 2 diabetic patients.
These improvements were greater with a low-
fat vegan diet.

Pros and Cons
Pros:
Clear and easy to read
Keeping exercise at a constant to isolate diet
Applicability outside the research setting
Cons:
Diversity was limited among subjects
Many study participants were taking antihypertensive medications which may have blunted the effect of diet on blood pressure.
All participants had access of group support
Dietary intake was based on self-report, which is vulnerable to distortion

Changes in Nutrient Intake and Dietary
Quality among Participants with Type
2 Diabetes Following a Low-Fat Vegan
Diet or a Conventional Diabetes Diet
for 22 Weeks
Article 2Turner-McGrievy G, Barnard N, Cohen J,
Jenkins D, Gloede L, Green A

Objective
Assess the changes in nutrient intake
and dietary quality among participants
following a low-fat vegan diet or the 2003
ADA dietary recommendations.

Subjects
99 participants with type 2 diabetes in a free-
living setting
49 followed low-fat vegan diet
22 m, 27 f
50 followed control diet
17 m, 33 f
Intervention
Vegan diet
Grains, fruits, vegetables, and legumes
Avoid animal products, limit high-fat foods, and favor foods
with low glycemic index value
No restrictions on portion sizes or energy intake
Control diet
2003 ADA guidelines
Exchange system used to provide recommended energy and
carbohydrate and saturated fat grams each participant
required
Individualized based on body weight and lipid profile

Design
Randomized, controlled clinical trial
22-week trial examining changes in nutrient
intake and diet quality
Before randomization, participants completed a
practice 3-day weighed dietary record
Participants then completed a baseline food
record

Design cont.
After randomization, participants met individually with an
RD experienced in the use of the assigned diet to
develop individualized meal plans
Participants continued to meet with assigned diet
groups- 1/wk with RD and physicians
Adherence to diet was assessed based on 22-wk dietary
records and 24-hr recalls with unexpected phone calls
Quality control conducted by dietary records and recalls
by RD

Lab Measurement Tools
AHEI Scores
Alternate Healthy Eating Index
Calculated for each participant based on food
categories: vegetables, fruit, nuts and soy
protein, cereal fiber, trans fat, and ratio of
polyunsaturated to saturated fatty acids
Receives a score ranging from 0-10

Statistical Methods
T tests
Pearson's correlation

Results
The vegan group improved in every AHEI
food category
Increase in fruits, veg, nut, soy protein, and cereal
fiber; decrease in trans fat and increase in PUFA-
to-saturated fat ratio
The ADA group showed changes in one food
Increase PUFA-to-saturated fat

Clinical Data Results
Both groups reported significant decreases in energy,
protein, fat, cholesterol, and vitamin D
The vegan group significantly increased CHO, fiber,
vitamin A activity, beta carotene, vitamins A&K, folate,
magnesium, and potassium
Note: Vegan group significantly reduced intakes of vitamin B-12
and calcium

Clinical Data Results cont.
The vegan group significantly improved its
AHEI score, while the control diet group did
not.
With both groups combined, AHEI score was
negatively correlated with both changes in A1c
value and weight

Changes in AHEI Score

Conclusions
Vegan diets increase intakes of carbohydrate,
fiber, and several micronutrients, in contrast
with the ADA diet.
The vegan group improved its AHEI score
whereas the ADA diet group's AHEI scored
remained unchanged

Pros and Cons
Pros:
Clear and easy to read
Prospective design and
an intention-to-treat
analysis
Cons:
Not diverse group of
subjects
All participants had
access of group support
Dietary intake was based
on self-report, which is
vulnerable to distortion

A Low-Fat Vegan Diet Elicits Greater
Macronutrient Changes, but Is
Comparable in Adherence and
Acceptability, Compared with a More
Conventional Diabetes Diet among
Individuals with Type 2 Diabetes
Article 3Barnard N, Gloede L, Cohen J, Jenkins D,
Turner-McGrievy G, Green A, Ferdowsian H

Objective
To quantify adherence and acceptability for two types of diets for diabetes.
Main outcomes: Attrition, adherence, dietary behavior, diet acceptability, cravings

Subjects
99 individuals with type 2 diabetes
49 followed low-fat vegan diet
22 m, 27 f
50 followed control diet
17 m, 33 f

Interventions
Vegan diet 10% fat, 15% protein, 75% carbohydrate
Grains, fruits, vegetables, and legumes
Avoid animal products, fatty foods (avocadoes, fried foods, nuts/seeds), and favor foods with low glycemic index value
No restrictions on portion sizes or energy intake
Control diet 2003 ADA guidelines
15-20% protein, <7% saturated fat, 60-70% CHO, cholesterol and saturated fat <200 mg/day
Individualized based on body weight and lipid profile
All participants not to alter exercise habits.

Research Design
Controlled trial
Each participant met with RD for 1 hr prior to
discuss the assigned diet
Thereafter, attended weekly 1 hr meeting with
their diet groups for 22 weeks
Optional bi-weekly 1 hr meeting with their diet
groups for 52 weeks

Research Design cont.
3-day dietary records complete at weeks 0, 11, 22,
and 74
Diet records reviewed by RD
In addition, at several weeks throughout the study,
an RD made unannounced telephone calls to each
participant to administer a 24-hr diet recall using a
multi-pass approach
At weeks 0, 22, and 74 participants completed:
Eating Inventory, Food Acceptability Questionnaire,
Food-Craving Inventory Instruments

Lab Measurement Tools
Food scales used for dietary records
Nutrition Data System- used for diet analysis
At weeks 0, 22, and 74 participants
completed:
Eating Inventory
Food Acceptability Questionnaire
Food-Craving Inventory Instruments

Stastical Methods
T tests
Wilcoxon sum rank test
Mann-Whitney U test

Results
All participants completed the initial 22 weeks
90% of control group and 86% of the vegan diet
group participants completed 74 weeks.
Fat and cholesterol intake fell more and CHO and
fiber intake increased more in the vegan group.
At 22 weeks, group specific diet adherence criteria
were met by 44% of members of the control and
67% of the vegan group participants

Results cont.
Control group reported a greater increase in dietary restraint; this difference was not significant at 74 weeks
Both groups reported reduced hunger and reduced disinhibition.
Questionnaire responses rated both diets as satisfactory, with no significant difference except ease of preparation
Cravings for fatty foods diminished more in the vegan group at 22 weeks with no significant difference at 74 weeks.

FA Questionnaire
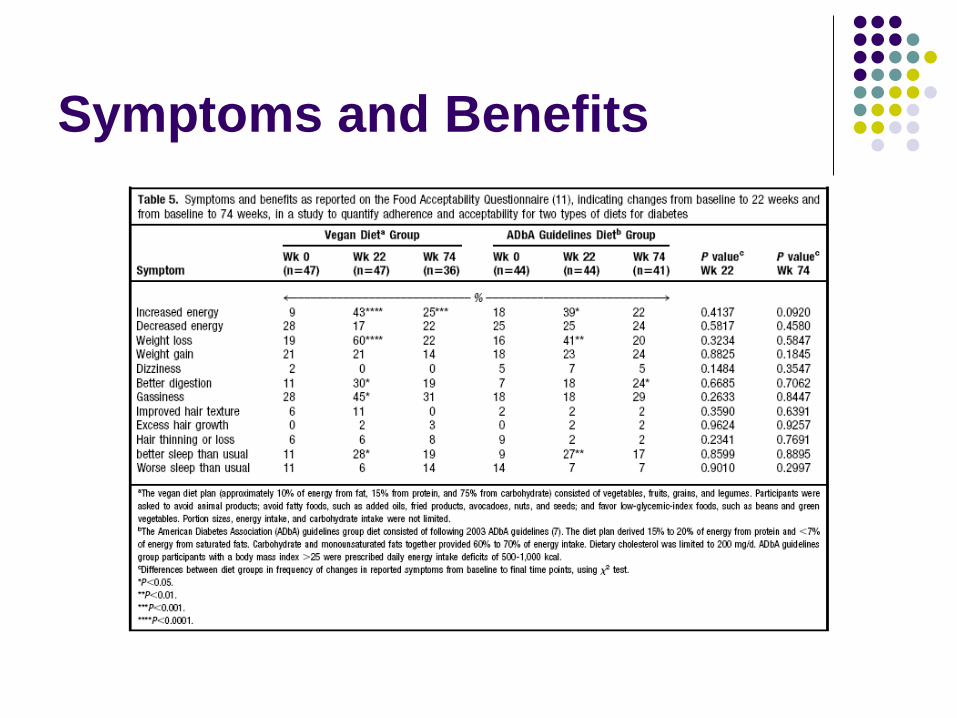
Symptoms and Benefits

Conclusions
Despite its greater influence on macronutrient
intake, a low-fat, vegan diet has an
acceptability similar to that of a more
conventional diabetes diet.
Acceptability appears to be no barrier to its
use in medical nutrition therapy.

Pros and Cons
Pros
Clear and easy to read
Sample size that was
adequate to compare
differences
Appropriate follow-up
period
.
Cons
All self-selected research volunteers: well educated
All participants had access of group support
Dietary intake was based on self-report, which is vulnerable to distortion

Summary and Conclusion
Both a low-fat vegan diet and the ADA diet improved glycemic and lipid control in type 2 diabetic patients. These improvements were greater with a low-fat vegan diet.
Vegan diets increase intakes of carbohydrate, fiber, and several micronutrients, in contrast with the ADA diet.
Summary and Conclusion
cont.
The vegan group improved its AHEI score
whereas the ADA diet group’s AHEI scored
remained unchanged.
Despite its greater influence on macronutrient
intake, a low-fat vegan diet has an
acceptability similar to that of a more
conventional diabetes diet.
Acceptability appears to be no barrier to its use
in medical nutrition therapy.

Suggestions for Future
Research
Research on body’s
response if transitioning
back to a healthy diet (but
including healthy fats, lean
meats, lean dairy)
Diagnosis at earlier age
Extend research on
satiation/acceptability over
longer period of time
More diverse subjects
Research on vegan diets
and other chronic conditions

Questions

References
1. Davy B: Medical Nutrition Therapy for Diabetes Mellitus and Related Disorders. Medical Nutrition Therapy. 2009
2. Zimmet P, Alberti KG, Shaw J. "Global and societal implications of the diabetes epidemic". Nature. 2003; 414 (6865): 782–7.
3. Eberhart, M. S.; Ogden, C, Engelgau, M, Cadwell, B, Hedley, A. A., Saydah, S. H. "Prevalence of Overweight and Obesity Among Adults with Diagnosed Diabetes ---United States, 1988--1994 and 1999--2002". Morbidity and Mortality Weekly Report(Centers for Disease Control and Prevention). 2004;53 (45): 1066–8.
4. Camastra S, Bonora E, Del Prato S, Rett K, Weck M, Ferrannini E. "Effect of obesity and insulin resistance on resting and glucose-induced thermogenesis in man. EGIR (European Group for the Study of Insulin Resistance)". Int. J. Obes. Relat. Metab. Disord. 1999;23 (12): 1307–13.
5. Jack L, Boseman L, Vinicor F. "Aging Americans and diabetes. A public health and clinical response". Geriatrics 2004;59 (4): 14–7.
6. Lovejoy JC. "The influence of dietary fat on insulin resistance". Curr. Diab. Rep.2002;2 (5): 435–40.
7. Barnard ND, Scialli AR, Turner-McGrievy G, Lanou AJ, Glass J: The effects of low-fat plant-based dietary intervention on body weight, metabolism, and insulin sensitivity. Am J Med. 2005;118:991-997.
8. Scott FW. Cow milk and insulin-dependent diabetes mellitus: is there a relationship? Am J Clin Nutr 1990;51:489-91.
9. Lovejoy JC, Windhauser MM, Rood JC, de la Bretonne JA: Effect of a controlled high-fat vs. low-fat diet on insulin sensitivity and leptin levels in African American and Caucasian women. Metabolism. 1998;47: 1520-1524.
10. Jenkins DJA, Kendall CWC, Marchie A, Jenkins AL, Augustin LSA, Ludwig DS, Barnard ND, Anderson JW: Type 2 diabetes and the vegetarian diet. Am J Clin Nutr.2003;78:610S-616S.