revenue sharing contract of the green supply chain based on centralized decision ... ·...
TRANSCRIPT
Metallurgical and Mining Industry408 No. 9 — 2015
Ecology
Revenue Sharing Contract of the Green Supply Chain Basedon Centralized Decision Making and the Game Model
Huang Ming1, Hu Shuyu2
1College of Economics and Management, Hunan Radio and Television University,Changsha, 410004, China
2College of Network Education, Hunan Radio and Television University,Changsha, 410004, China
Corresponding author is Hu Shuyu
AbstractThe uncertainty of green product market resulted in that the manufacturer to bear the enormous risks of R & D and manufacturing problems, at the same time, the cooperation of manufacturers and retailers having become an important factor affecting decision and profit of the two. In order to solve this problem, we put forward to use the revenue sharing contract to promote the depth of cooperation between manufacturers and retailers. First of all, we consider the green degree and risk aversion and other factors, constructing the centralized decision-making model and the manufacturer Stackelberg game model, and finding that the the efficiency of the supply chain of latter in will be less than the former. Therefore, we put forward the revenue sharing contract to realize the coordination of the green supply chain, which makes the profit and efficiency of the whole supply chain reach the level of decision-making model. Finally, numerical experiments verified the effectiveness and reliability of the revenue sharing contract proposed in this paper. Experimental results show that the revenue sharing contract can coordinate cooperative relationship between the manufacturer and the retailer well, and can greatly improve the utility and profit of the two.Key words: GAME THEORY, CENTRALIZED DECISION MAKING, GEEN SUPPLY CHAIN, RISK AVER-SION, REVENUE SHARING CONTRACT.
1. IntroductionWith the green products increasingly favored
by consumers, being as one that based on the sup-ply chain, considering the resource consumption and environmental impact, the green supply chain model starts to attract attention[1]. Increasingly stringent environmental regulations, and changes of the con-sumer demand, the enterprises start to pay attention to and attach importance to the management practice of the management practicegreen supply chain man-agement. Such as Panasonic appliances, Haier group and HP computer began to research and develop and
product green refrigerator, green washing machine and green computer [2]. But in the process of the implementation of the green supply chain, produc-tion and sales of green products have a considerable risk. Because of the research and development of new products, due to the incomplete information, a lot of uncertainty of itself, it is likely to fail, such as the HP Slate tablet computers,for design and software prob-lems, making Slate tablet become very heavy, Intel processor making the equipment be hot, finally the project ran aground. Therefore, manufacturers bear the huge risk of R & D failure [3]. In order to deal

409Metallurgical and Mining IndustryNo. 9 — 2015
Ecologywith incomplete information, the enterprise will take measures to avoid the risks brought by incomplete information. So, the the impact of risk aversion of research on the operations of green supply chain be-comes extremely important.
Making a comprehensive survey on the research results of domestic and foreign scholars, we can find the current research literature covers: drive and ob-stacle factors of management of the green supply chain[4,5], the influencing factors of the manage-ment of green supply chain and the impact on firm performance [6,7], strategic decision model of the management of the green supply chain[8], the game of the government and the maker of green supply chain[9,10], the coordination of green supply chain [11,12] and so on. However, the study of the above literature on green supply chain, all assuming the sup-ply chain members are risk neutral, without consider-ing the incomplete information.
Therefore, this paper will be in the condition of incomplete information, based on considering the risk aversion of the manufacturers, constructing cen-tralized decision-making model and the Stackelberg game model, comparing and analyzing, to explore the interaction between the degree of risk aversion, the product green degree and the utility of the mem-ber enterprises of the supply chain. And try to use the revenue sharing contract to coordinate the green supply chain. I hope this paper can give the green supply chain enterprises, under the condition of in-complete information, according to each other’s risk preference, formulating the corresponding manage-ment decisions, to provide theoretical support and reference.
2. The basic model and the research hypothesisThis paper made the following assumptions:(1) There are two kinds of products on the mar-
ket: ordinary products and green products. The price of the common product is 0p ,the green degree of it being 0g .The higher the Green degree, indicating that the more environmental protection of the product, the green degree of green products being g .
(2) The manufacturer’s production capacity is infinite, the out of stock of the retailer does not oc-cur. Using the mc to express the production cost of manufacturers of the unit of green products; using rcto express the marketing logistics cost of unit green product of the retailer. In order to improve the green degree of products, we need to increase research and development investment, improving the techni-cal level. Reference documentation [13], results of R & D and investment of R & D is quadratic rela-tionship. And assuming that, research and develop-
ment costs are borne by the manufacturer, the cost of R & D of green products being 21c
2y zg= , z being
the impact factor of research and development.(3) The different consumers having different con-
sumer preferences on the green products and ordinary products , different consumers want to buy the prod-ucts with different green degree. Using θ to express the green degree of green products the consumers want to buy, and in the interval 0[ , ]g g ,θ obeying the uniform distribution.
(4) Different consumers are willing to pay dif-ferent price of the product. UsingΩ the consumer’s expectations of product green degree increased by one unit, the cost the consumers are willing to pay. When the 0 0( )p g pθ+Ω − > , namely that the price of green product being lower than the expectations of consumers are willing to pay, consumers will buy green products, otherwise they will buy ordinary products.
(5) Because of incomplete information, market demand having uncertainty, using ε to reflect the un-certainty of market demand, ( )20,Nε σ∈ 2). In order to deal with the uncertain of market demand, manufac-turers and retailers will take steps to minimize losses, to avoid the risk caused by it. Using mη to express the degree of risk aversion of the manufacturer; the bigger the risk aversion degree, the more afraid of the risk that the manufacturer.
By the above assumptions, the critical value of expectations of green degree of consumers *θ should meet:
0 0( )p g pθ+Ω − =
Thus obtained * 00
p pgθ
−= +
Ω
The function of market demand is
*0
0 0
1 1( )
g p pD N d N
g g g gθθε ε
−= + = − +
− Ω − ∫
The profit function of the manufacturer is
( ) 2
20
0
12
1( )1 + ( ) 2
m m
m
w c D zg
p pN w c zg
g gε
Π = − −
−= − − −
Ω −
The expected revenue function of the manufac-turer is
2
20
0
1( ) ( ) ( )* 2
1( )1 ( ) 2
m m m
m
E E w c D E w c E D E zg
p pN w c zg
g g
Π = − = − −
−= − − −
Ω −

Metallurgical and Mining Industry410 No. 9 — 2015
EcologyBecause the manufacturer is risk aversion, accord-
ing to the theory of mean variance [14], considering the influence of profit and the variance, the expected utility of the manufacturer is:
2 2
2 2
2 2 20
0
1( ) ( ) * ( ) ( ) [ ( )]2
1( )* [ ( )]2
1( )1 ( )( ) 2
m m m m m m m m
m m m m
m m m
U E Var E w c D zg E E
E w c E D E zg E E
p pN w c zg w c
g g
η η
η
η σ
Π = Π − Π = − − − Π − Π
= − + − − Π − Π
−= − − − − −
Ω −
Similarly, the profit function of the retailer is
Proposition 2 In centralized controlled system, the product price Cp increased with the increase of prod-uct green degree Cg .
Prove For the formula 2 2
0 0 0( ) ( ) ( )C C C C Cr m r mp p p p c c p c c zg g g− − + + + = Ω −
to calculate the first-order partial derivative of Cg . According to the implicit function derivative rule we having
20 0 02 * ( ) ( ) 2 ( )
cc c c c
r mc
pp p c c z g g zg g gg∂
− + + = Ω − + Ω −∂
0 0 0( )(3 ) ( )2
c ccr m
c c
z g g g g p c cpg p
Ω − − + + +∂=
∂
According to the assuming we know, 0cg g> ,so
0 0( )(3 ) 0c cg g g g− − > .
So 0c
c
pg∂
>∂
, namely cp is the function about cg .
So the product price Cp increased with the in-crease of product green degree Cg , prove being over.
The proposition that the increase of the green degree of products, the cost of production-manufacturing and research and development will increase, so the manu-facturer shifting this part to retailers, retailers shifting this part of the cost to consumers, it will increase the market price of the product, which is consistent with the actual situation.
3. The construction of model3.1. The centralized decision-making modelCentralized decision making refers to the manu-
facturers, retailers and other supply chains make up the unified system, made centralized decision by the system, to achieve the optimization of the whole supply chain [15]. In the condition of cen-tralized decision making, manufacturers cooper-ating with retailers, based on the comprehensive consideration of the return and risk to select the appropriate wholesale price and product price mak-ing the whole supply chain have maximizing the expected utility. Under centralized decision-mak-ing, the expected utility of supply chain can be ex-pressed as:
Namely
(1)
The Hessian matrix (HESSE) of formula (1)
( ) ( )
( )( )( )
( )
02
0 02
12
002 3
0 0
22 0
0 2 022
0
r m
m
r mr m
p p c cg g g g
Hp c c p pp p c c
zg g g g
η σ
− − −−
Ω − Ω −
= − − Ω − − −− − − − Ω − Ω −
Due to the HESSE matrix containing a num-ber of parameters, only through the above hy-pothesis, it is difficult to determine whether the matrix is negative definite matrix, illustrating that the concave and convex of the objective function should depend on the values of various parame-
ters. Therefore, here we only discuss the existence of uniqueness of the equilibrium solution of the function.
Sorting out conditions as follows:Respectively calculating the first-order derivative
of p , w , g ,we can obtain

411Metallurgical and Mining IndustryNo. 9 — 2015
Ecology
(2)
(3)
(4)
Through the simultaneous equations of formula (2) (3) (4), we can get the optimal wholesale price
Cw ,the optimal product price Cp and green degree Cg of the centralized decision-making model are re-
spectively:
Cmw c=
In which, Cg is determined by the implicit func-tion:
2 20 0 0( ) ( ) ( )C C C C C
r m r mp p p p c c p c c zg g g− − + + + = Ω −
Proposition 1 In the centralized model, there exists a critical value of product green degree *
1g , making When *Cg g> , C Cp w> ;When *Cg g= , C Cp w= ;When *Cg g< , C Cp w< ;
In which, * 00
C m rc p cg g
− −= +
ΩProving that if C Cp w> , there are
From the above formula we can obtain 0
0m rc p c
g g− −
> +Ω
Making * 00
C m rc p cg g
− −= +
ΩThrough this prove we can obtain, when *Cg g> ,
C Cp w> ; In the same way other conclusions can be proved to be established.
Proposition 2 In centralized controlled system, the product price Cp increased with the increase of prod-uct green degree Cg .
Prove For the formula 2 2
0 0 0( ) ( ) ( )C C C C Cr m r mp p p p c c p c c zg g g− − + + + = Ω −
to calculate the first-order partial derivative of Cg .According to the implicit function derivative rule
we having 2
0 0 02 * ( ) ( ) 2 ( )c
c c c cr mc
pp p c c z g g zg g gg∂
− + + = Ω − + Ω −∂
0 0 0( )(3 ) ( )2
c ccr m
c c
z g g g g p c cpg p
Ω − − + + +∂=
∂
According to the assuming we know, 0cg g> ,so
0 0( )(3 ) 0c cg g g g− − > .
So 0c
c
pg∂
>∂
, namely cp is the function about cg .
So the product price Cp increased with the in-crease of product green degree Cg , prove being over. The proposition that the increase of the green degree of products, the cost of production-manufacturing and research and development will increase, so the manu-facturer shifting this part to retailers, retailers shifting this part of the cost to consumers, it will increase the market price of the product, which is consistent with the actual situation.
3.2. The game model of manufacturer led Stackelberg
In the Stackelberg game model, the manufacturer dominates the main square, retailers being the follow-ing party. Among them, the manufacturer’s decision variables is wholesale price w and the green degree of products g , retailer’s decision variable is the product price p . For the given wholesale price w ,the retailer determining the optimal product price p , the manu-facturer based on the optimal product price to deter-mine the optimal wholesale price w to maximize the utility function. We use backward induction method to solve.
2 2 20
0
1( ) ( )1 ( )( ) 2m m m mp p
MaxU N w c w c zgg g
η σ−
Π = − − − − −Ω −
(5)
*. . arg max ( )rs t p U= Π
0
0
( )1 ( )r rp p
Max N p w cg g−
Π = − − −Ω −
(6)
When w is confirmed, ( )2
0
2 0Hg g
= − <Ω −
For formula (6) to calculate second-order partial derivative of p variable to obtain:
( )2 2
0
2/ 0r pg g
∂ Π ∂ = − <Ω −
We can know that rΠ is the concave function of p ,having a maximum value.
( )0
0
2=N 0rr p p c w
Np g g
− − −∂Π− =
∂ Ω −
Obtained ( )0 0+ +
2
M MrM
g g p w cp
Ω − +=
Put Mp into formula (5) we can obtain
Metallurgical and Mining Industry412 No. 9 — 2015
Ecology
Proposition 3 When ( )0 4Mg g zΩ − < , the utility function of the manufacturer is the concave function of Mw and the Mg .
The Hessian matrix (HESSE) of formula (7)
( )03
1 12
12
Mg gH
z
− Ω − = −
According to the HESSE matrix, we can obtain
( )2
20
( ) 1 0mM
Uw g g
∂ Π= − <
∂ Ω −,
2
2
( )0mU
zg
∂ Π= − <
∂
In addition, it should meet
( )0
1 1 *( ) 04 M
zg g−
− − <Ω −
, sorted and obtained
( )0 4Mg g zΩ − <Respectively calculated the first order partial de-
rivative of w and g on (7), making the first-order partial derivative be equal to 0, sorted and obtained the conditions as follows:
( ) 20 0 2 2
0
+ 1( ) ( )1 ( )22 ( )
M MrM M M
m m m mM
g g w c pMaxU N w c w c zg
g gη σ
Ω − + −Π = − − − − −
Ω − (7)
( ) ( ) ( )0 0 2
0
( ) 22 0
2 ( )
Mm r m
m mM
U g g w c p cN N w c
w g gη σ
∂ Π Ω − + + − −= − − − =
∂ Ω − (8)
( ) 2 20 0( )( ) 2 ( ) 0m M M M
m r
UN w c w c p zg g g
g∂ Π
= Ω − + − − Ω − =∂
(9)
Through the simulta-neous equations of (8),
(9), we can obtain the optimal wholesale price
( )( ) ( ) ( )( )
20 0 0
20
2 2
2 2
M Mm m m rM
Mm
g g N c c c p N g gw
g g N
η σ
η σ
Ω − + + − + − Ω −=
Ω − +
Mg is determined by the following formula2 2
0 0( )( ) 2 ( )M M M Mm rN w c w c p z g g gΩ − + − = Ω −
Proposition 4 In the manufacturer led Stackelberg game model, the wholesale price increases with the
Mw , the green degree Mg , maximizing the utility of manufacturer.
increase of the degree of risk aversion of manufac-turer.
Proof: due to
( ) ( ) ( )( ) ( ) ( ) ( )
( ) ( ) ( ) ( ) ( )
( ) ( ) ( ) ( )
2 2 20 0 0 0 0
220
2 2 20 0 0 0 0
220
2 20 0 0 0
220
4 4 2 2
2 2
4 4 4
2 2
4 4 2
2 2
M M M MMm m m m r
Mm m
M M M Mm m m m r
Mm
M M Mm m m r
Mm
c g g g g g g N c c c p N g gw
g g N
c g g g g c g g c c p N g g
g g N
g g c g g c c p N g g
g g N
σ σ η σ
η η σ
σ σ η σ
η σ
σ η σ
η σ
Ω − − Ω − Ω − + + − + − Ω −∂=
∂ Ω − +
Ω − − Ω − Ω − + − + + Ω −=
Ω − +
− Ω − Ω − + − + + Ω −=
Ω − +
( ) ( )0 0 0 0M Mp N g g p g g p+ Ω − > +Ω − > , so ( )0 0 0M
r rp N g g c p c+ Ω − − > − >
So 0M
m
wη
∂<
∂. Therefore with the increase of the
degree of risk aversion of manufacturers, wholesale prices are getting lower and lower.
This can be explained that when manufactur-ers being more and more afraid of risk, they will reduce the wholesale price to promote the retailer to buy more green products, to avoid the product backlog.
3.4. The model of revenue sharingIn the revenue sharing contract mechanism, the
ratio of the retailer share sales revenue beingϕ , the manufacturer’s share ratio being 1 ϕ− . Retailers’ profit function can be expressed as
0
0
( )1 ( )r rp p
p w cg g
ϕ−
Π = − − −Ω −
(10)
In the revenue sharing contract, the income of the manufacturer is consisted by the benefit of the
413Metallurgical and Mining IndustryNo. 9 — 2015
Ecologywholesale and the sharing risk return provided by the retailer.
The expected utility function of the manufacturer can be expressed as
[ ] [ ]2 2 20
0
1( ) (1 ) + 1 (1 ) +( ) 2m m m mp p
U p w c p w c zgg g
ϕ η ϕ σ−
Π = − − − − − − −Ω −
In the manufacturer led Stackelberg model, the retailer’s decision variables is the retail price under the determined wholesale price of the manufacturer. When w being determined, we can obtain from the formula (10)
( )2 2
0
/ 2 0r pg gϕ
∂ Π ∂ = − < Ω −
We can know, rΠ is the concave function of p , so
( )0
0
20rr p p c w
p g gϕ ϕ
ϕ− − −∂Π
= − =∂ Ω −
Obtained ( )0 0+ +
2rg g p w c
pϕ
ϕΩ − + =
And because in the centralized decision-making
model( )0 0
2r mc g g p c c
pΩ − + + +
= , cmw c=
According to the incentive purpose of revenue sharing mechanism, only when = cp p , that is the re-tail price of the retailed and the retail price of the co-operative are equal, the purpose of incentive can be reached. So having
( ) ( )0 0 0 0+ +2 2
r r mg g p w c g g p c cϕϕ
Ω − + Ω − + + + =
Obtained ( )*
r m rw c c cϕ= + − ,
( )0 0+p*
2r mg g c c
pΩ − + +
=
We can prove *mw cϕ< . Therefore, in the revenue
sharing contract mechanism, manufacturers will wholesale the products as the price lower than the
manufacturing cost to retailers, and retailers will take 1 ϕ− of the actual sales revenue share as return to pay to manufacturers.
Effective coordination mechanism of revenue sharing contract should make the benefit of any party of the gamedo not reduce. Therefore, when the manu-facturer being the risk averse, the retailer being risk neutral, when cooperation game model, the required constraints of the manufacturer led Stackelberg mod-el should meet when cooperate:
( )( ) ( )( )* * * *, ,c Cm mU p w U p wΠ ≥ Π (11)
( ) ( )* * * *, ,c Cr rp w p wΠ ≥ Π (12)
4. Numerical SimulationIn the establishment of the previous model, we can
find that the formula is more complex. In order to fur-ther analyze the scientificalness of the model, we took numerical simulation on the model. The situation of the assignment is as follows: 200N = , 20z = , 16Ω = ,
0 13p = , 5rc = , 8mc = , 2σ = , 1og = , now taking simulation analysis.
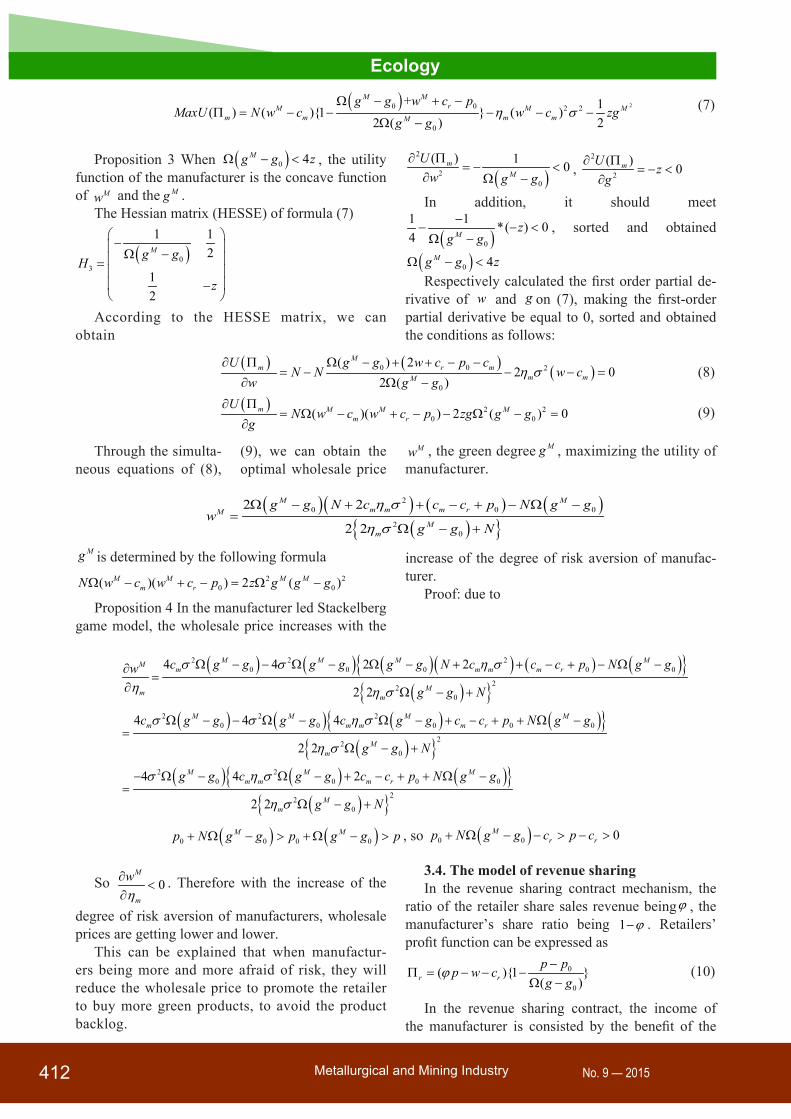
(1) The influence of the change of the coefficient of revenue sharing. We can see from the figure 1, with the increase of coefficient of revenue sharing, the utility of manufacturers continue to fall. Going a step further, we can see, although the utility of manu-facturer decreases, the coefficient of revenue sharing is in a reasonable range, the utility of manufacturer of the revenue sharing model being always greater than the utility of decentralized decision. Therefore, we can think that by revenue sharing, the manufacturer can obtain higher utility. It can be seen from Fig-ure 2, with the increase of the coefficient of revenue
Figure 2. The change of the coefficient of revenue sharing
Figure 1. The change of the utility of manufacturer profit of retailers with the with the coefficient of revenue sharing

Metallurgical and Mining Industry414 No. 9 — 2015
Ecologysharing, the profit of retailers being increasing, and the profit of the revenue sharing model being bigger than the profit of the dispersion state. It shows that by the revenue sharing, the retailer can get more profits. Therefore, manufacturers and retailers are willing to share the benefits, to improve their profit and utility.
(2) The influence of coefficients of revenue shar-ing on the wholesale price. Figure 3 shows that, with the increase of the coefficients of revenue sharing, wholesale prices also increasing, showing that in the condition of revenue sharing, manufacturers to in-crease their utility by raising wholesale price. In ad-dition, we can find that the wholesale price under the condition of the revenue sharing is far less than the wholesale price in the dispersion state. It shows that in the process that the revenue sharing, manufactur-ers will actively reduce the wholesale price to gain the trust of retailers to get more in-depth cooperation.
(3) The influence of the coefficient of risk aver-sion on the whole price. In figure 4, the whole price decreased sharply with the increase of risk aversion. It shows that with the manufacturers being more cautious and lowing the whole price, so to wholesale the great mount of products to retailers to transfer the risk, it be-ing consistent with the conclusion of figure (4).
Figure 3. The change of the wholesale price price with the with the coefficient of revenue sharing aversion
Figure 4. The change of the wholesale coefficient of risk
5. ConclusionThis paper considers, considering the second-level
green supply chain composed by a manufacturer and a retailer, the manufacturer being risk averse, the re-tailer being risk neutral. Establishing the centralized decision-making model, the manufacturer led Stack-elberg game model and the revenue sharing model. The experimental results show that: (1) in the cen-tralized model, there exists a critical value of prod-uct green degree *
1g ; (2) the manufacturer led Stack-elberg game model, the higher the green degree of products, the manufacturer’s wholesale price increas-ing. In this paper, the main consideration is the cen-tralized decision-making model and the manufacturer led Stackelberg game model, the next research direc-tion is further to consider the retailers led Stackelberg game model and the Nash balancing model, analyz-ing and comparing them.
AcknowledgementsThe research is supported by Hunan province soft
science research plan Key projects (2014ZK2041)
References1. G.R. Jahanshahloo, F. Hosseinzadeh Lotfi,
A.R. Davoodi. Extension of TOPSIS for de-cision-making problems with interval data: In-terval efficiency, Mathematical and Computer Modeling. 2009, 49(5-6), pp. 1137-1142.
2. http://dx.doi.org/10.1016/j.mcm.2008.07.0093. Hepu Deng, Chung-Hsing Yeh. Simulation-
based evaluation of defuzzification-based ap-proaches to fuzzy multiattribute decision mak-ing. IEEE Trans. on Software Engineering, 2006, 36(5), pp. 968-977.
4. J. Soini, Managing information and distribut-ing knowledge in a knowledge-intensive busi-ness environment, Management of Engineer-ing & Technology, 2008, pp. 889-894.
5. Jiang, Dingde, Zhengzheng Xu, Peng Zhang, and Ting Zhu. A transform domain-based anomaly detection approach to network-wide traffic. Journal of Network and Computer Ap-plications 40 , 2014, pp. 292-306.
6. Jie He, Yishuang Geng and Kaveh Pahlavan, Toward Accurate Human Tracking: Modelling Time-of-Arrival for Wireless Wearable Sen-sors in Multipath Environment, IEEE Sensor Journal, 2014, 14(11), pp. 3996-4006,
7. Johnson D, Perkins C, Arkko J, Mobility Sup-port in IPv6, RFC 3775, 2004. Hesham Soli-man, Claude Catelluccia, Karim ElMalk i, et

415Metallurgical and Mining IndustryNo. 9 — 2015
Ecologyal, Hierarchical Mobile IPv6 mobility manage-ment (HMIPv6), IETF RFC 4140, 2005.
8. K. Atanassov. New operations defined over the intuitionistic fuzzy sets. Fuzzy Sets and Sys-tems, 1994, 61(2), pp. 137-142.
9. K. Lorincz, D. Malan, T. F. Jones, A. Na-woj, A. Clavel, V. Shnayder, G. Mainland, S. Moulton, M. Welsh, Sensor Networks for Emergency Response: Challenges and Oppor-tunities, IEEE Pervasive Computing, Oct/Dec, 2004, pp. 16-23.
10. Kuo-Feng Huang, Shih-Jung Wu, Real-time-service-based Distributed Scheduling Scheme for IEEE 802.16j Networks. Journal of Net-works, Vol 8, No 3 , 2013, pp. 513-517.
11. M. D. Higginbotham, A. J. Milheizler, J. G. Maley, and B. J. Suskie, Enabling Technolo-gies: Infrastructure for collaborative Enterpris-es, in Enabling Technologies: Infrastructure for Collaborative Enterprises, 1998. (WET ICE '98) Proceedings., Seventh IEEE Interna-tional Workshops, 2005.
12. N. Gura, A. Patel, A. Wander, H. Eberle, S. C. Shantz, Comparing Elliptic Curve Cryptogra-phy and RSA on 8-it CPUs. In CHES 2004, Vol. 3156, LNCS, pp.119-132.
13. Ortiz G, Bordbar B. Aspect-Oriented Quality of Service for Web Services: A Model-Driven Approach. Proceedings of the IEEE Interna-tional Conference on Web Services, 2009.
14. R. Chakravorty, A Programmable Service Ar-chitecture for Mobile Medical Care. 4th IEEE International Conference on Pervasive Com-puting and Communications, 2006.
15. S. M. Dragojlovic, Kraljevo, O. T. Milenkovic and M.Vujicic, The Information System For Power Distribution System As Answer On New Demands In Power Distribution System IEEE/PES: Transmission and Distribution Conference & Exhibition,2005
16. Su S, Li F, Yang F C. Iterative selection al-gorithm for service composition in distributed environments. SCIENCE IN CHINA SERIES F-INFORMATION SCIENCES, 2008, 51(11), pp. 1841-1856.
17. Su, Tianyun, Zhihan Lv, Shan Gao, Xiaolong Li, and Haibin Lv. 3D seabed: 3D modeling
and visualization platform for the seabed. In Multimedia and Expo Workshops (ICMEW), 2014 IEEE International Conference on, 2014, pp. 1-6.
18. T.ElGamal. A public-key cryptosystem and a signature scheme based on discrete logarithms. IEEE Transactions on Information Theory IT-31 (4), 1985, pp. 469-472.
19. http://dx.doi.org/10.1109/TIT.1985.105707420. Yi Wan and Zhongping Chen, A novel syn-
chronization method for DS-CDMA systems, 8th International Wireless Communications and Mobile Computing Conference (IWC-MC), 2012, pp.596- 601
21. Yishuang Geng, Kaveh Pahlavan, On the Ac-curacy of RF and Image Processing Based Hybrid Localization for Wireless Capsule En-doscopy, IEEE Wireless Communications and Networking Conference (WCNC), 2015
22. Yunlong Cai, Rodrigo C. de Lamare, Rui Fa, Switched Interleaving Techniques with Lim-ited Feedback for Interference Mitigation in DS-CDMA Systems, IEEE Transactions on Communications, Vol. 59, No. 7, 2011, pp. 1946-1956.
23. Z. Jianxin and W. Dandong, Implementation of Product Information Publishing System Based on Web, Journal Of Engineering Graphics, No.5, 2008, pp. 146–149.
24. Zahid Ali, Qurban A Memon, Time Delay Tracking for Multiuser Synchronization in CDMA Networks. Journal of Networks, Vol 8, No 9, 2013, pp. 1929-1935.
25. Zhang, Mengxin, Zhihan Lv, Xiaolei Zhang, Ge Chen, and Ke Zhang. Research and Appli-cation of the 3D Virtual Community Based on WEBVR and RIA. Computer and Information Science 2, no. 1, 2009, 84 p.
26. Lv, Zhihan, Liangbing Feng, Shengzhong Feng, and Haibo Li. Extending Touch-less In-teraction on Vision Based Wearable Device. Virtual Reality (VR), IEEE, 2015.
27. Zhang, Mengxin, Zhihan Lv, Xiaolei Zhang, Ge Chen, and Ke Zhang. Research and Application of the 3D Virtual Community Based on WE-BVR and RIA. Computer and Information Sci-ence 2, no. 1, 2009, 84 p.t and price expectation.