revenue forecast booklet 2018 session - south dakotabfm.sd.gov/econ/revenueforecast2018.pdf ·...
TRANSCRIPT

REVENUE
FORECASTS
PRESENTED TO
JOINT APPROPRIATIONS COMMITTEE
FEBRUARY 2018

Revenue Forecasts Bureau of Finance and Management i
TABLE OF CONTENTS
FY2018 AND FY2019 GENERAL FUND REVENUES……………………………………………... 1 SALES AND USE TAX……………………………………………………………………..………….. 2 LOTTERY……………………………….……………………………………………………………….. 5 CONTRACTOR’S EXCISE TAX………………………………………………………………………. 6 INSURANCE COMPANY TAX…………………………………………………………………………. 8 UNCLAIMED PROPERTY RECEIPTS.………………………………………………………………. 9 LICENSES, PERMITS, AND FEES……………………………………………………………………. 10 TOBACCO TAXES……………………………………………………………………………………..... 11 TRUST FUNDS……………………………………………………………………….………………… 12 NET TRANSFERS IN…………………………………………………………………………………... 13 ALCOHOL BEVERAGE TAX…………………………………………………………………………... 14 BANK FRANCHISE TAX……………………………………………………………………………..... 15 CHARGES FOR GOODS AND SERVICES.………………………………………………………… 16 TELECOMMUNICATIONS TAX..…………………………………………………………………..... 17 SEVERANCE TAXES………………………………………………………………………………….. 18 SALE-LEASEBACK…………………………………………………………………………………….. 19 INVESTMENT INCOME AND INTEREST……………………………………………………………. 20 ALCOHOL BEVERAGE 2% WHOLESALE TAX…………………………………………………….. 21 GOV. REVISED FY2018 VS. FEBRUARY REVISED FY2018……….…………………………….. 22 GOV. RECOMMENDED FY2019 VS. FEBRUARY REVISED FY2019.………………….……….. 23 ADOPTED FY2018 VS. FEBRUARY REVISED FY2018.....………………………………………… 24 ACTUAL FY2017 VS. FEBRUARY REVISED FY2018………..……………………………………… 25 FEBRUARY REVISED FY2018 VS. FEBRUARY REVISED FY2019………………………………… 26

Revenue Forecasts Bureau of Finance and Management 1
FY2018 AND FY2019 GENERAL FUND REVENUES
FY2019 General Fund Revenues
Sales and Use Tax$1,030.4 m (63%)
Contractor’s Excise Tax$111.4 m (7%)
Lottery$119.4 m (7%)
Other Sources$183.5 m (11%)
Insurance Company Tax$90.2 m (6%)
Tobacco Taxes$54.5 m (3%)
$1,636,223,677
Unclaimed Property $46.8 m (3%)
FY2018 General Fund Revenues
Sales and Use Tax$992.1 m (62%)
Contractor’s Excise Tax$105.2 m (7%)
Lottery$116.3 m (7%)
Other Sources$178.6 m (11%)
Insurance Company Tax$87.3 m (6%)
$1,607,524,030
One-Time Receipts$23.1 m (1%)
Unclaimed Property$50.4 m (3%)
Tobacco Taxes$54.6 m (3%)

Revenue Forecasts Bureau of Finance and Management 2
SALES AND USE TAX Background: The sales tax is applied to the gross receipts of businesses, organizations, or persons engaged in retail sales, including the selling, leasing, and renting of tangible personal property, the sale of services, and the sale of products transferred electronically, as long as the products or services are not specifically exempt, intended for resale, or sold to a governmental or sales tax exempt agency. The rate of the state’s sales tax is 4.5% (SDCL 10-45). A use tax of the same rate as the sales tax applies to all goods and services that are used, stored, or consumed in South Dakota on which South Dakota sales tax is not paid. The purchaser or consumer of the goods or services is responsible for reporting and remitting the use tax in the filing period in which they receive the goods or services (SDCL 10-46).
In addition to the state sales and use tax, municipalities may impose a general sales and use tax of up to 2%. The municipal sales and use tax applies to items or services that are subject to the state sales and use tax. The Department of Revenue is the administrative and enforcement agency for the municipal sales and use tax and collects a fee for this service. The municipal sales and use tax is reported on the same tax return as the state sales and use tax.
Tax returns can be filed electronically via EPATH or mailed to the Remittance Center in Sioux Falls. The most common filing period is once a month. The deadline for filing is the 20th of the following month. Taxpayers using EPATH must make payments electronically on or before the 25th of the month.
NOTE: Because of when sales and use tax payments are due, sales and use tax collections are lagged one month (ex: collections recorded in January are from sales that occurred in December).
The Streamlined Sales and Use Tax Agreement project (SSUTA) is a multi-state effort to design, test and implement a system to radically simplify sales and use tax collection and administration by retailers and states. The ultimate goal is for the US Congress to require remote sellers to collect and remit state sales tax. South Dakota has been involved in the project since its inception, and is one of 23 full member states. The SSUTA was officially implemented on October 1, 2005, and effective on that date, retailers can register to report and pay sales taxes in the Agreement’s member states through a Web-based centralized registration system.
Any person who files a return to remit taxes imposed by chapter 10-45 is allowed, as compensation for the expense of collecting and paying the tax, a credit equal to 1.5% of the gross amount of the tax due. The credit may not be greater than $70.00 per month. The credit is granted to those persons who timely file and pay their sales tax due and who file and pay by electronic means. No credit is granted to any person who has outstanding tax returns due to the department or who has outstanding tax remittances due to the department.
The average annual increase in net collections between FY2009 and FY2017 was 4.68%. Net collections from the sales and use tax account for approximately 63% of ongoing general
fund revenues in FY2019.
600.0650.0700.0750.0
800.0850.0900.0950.0
1,000.01,050.0
FY10
FY11
FY12
FY13
FY14
FY15
FY16
FY17
FY18
FY19
MillionsForecast

Revenue Forecasts Bureau of Finance and Management 3
Currently: In the first seven months of FY2018, sales and use tax collections, excluding audits, were $597.4 million. This is an increase of 3.6% from the first seven months of last year. Year-to-date collections are 60.92% of the most current revised FY2018 estimate. Historically, 61.14% of the total revenue collected from this tax is received in the first seven months. Estimate: Due to the broad nature of the sales and use tax, many different variables influence collections. These influential variables include employment, income, the unemployment rate, inflation, etc. To quantify these theories, regression equations are used to determine if historically a statistically significant relationship exists between these and other variables and sales and use tax collections. The sales and use tax data is divided into five different categories (taxable sales from consumer spending on durables and services, consumer spending on nondurables and business related purchases, construction related purchases, recreation related purchases, and utilities) to account for the broad base of the sales and use tax. Different variables are used in the equations to determine if historically a statistically significant relationship between them and taxable sales has existed. After finding the best fitting regression equation for each of the five categories, sales and use tax collections are forecasted. The regression equations used in the forecast, the coefficient of determination (R2) associated with the equations, and a brief explanation of how to read regression equations are below.
Equation 1: Consumer Spending on Durables and Services (STCDS) STCDS = -308.47 + 0.07*SD Nonfarm Income + 205.26*Seasonal Dummy + 9.95*SD Manufacturing Employment + 24.27*SD Housing Starts R2 = .9940
Equation 2: Business Related Purchases/Consumer Spending on Nondurables (STBUSCND) STBUSCND = -2,562.17+ 7.83*SD Nonfarm Employment + 270.43*Seasonal Dummy + 0.63*Exports + 6.51*CPIF + 0.02*Farm Proprietors Income.
R2 = .9938
Equation 3: Construction Related Purchases (STCON) STCON = -538.77 + 25.83*SD Construction employment + 0.01*(SD Nonfarm Income*Seasonal dummy) + 7.52*SD Housing Starts + 0.05*SD wage and salary disbursements + 0.03*Farm Proprietors Income. R2 = .9854
Equation 4: Recreation Related Purchases (STREC) STREC = - 8.30 + 0.03*SD Nonfarm Income + 3.02*SD Leisure and Hospitality Employment + 0.01*(SD Disposable Income*Seasonal Dummy) – 0.54*oil price. R2 = .9948 Equation 5: Utilities (STUTI) STUTI = 76.13 + 0.02*SD Nonfarm Income + 2.94*Consumer Spending on Electricity and Natural Gas + 0.02*Farm Proprietors Income. R2 = .9851
Collection Equation: Sales Tax Collections = -1.5 + 0.045*Total Taxable Sales.
R2 =.9998

Revenue Forecasts Bureau of Finance and Management 4
Basic steps to follow when reading a regression equation are: 1.) Identify the dependent variable (the variable on the left side of the equation) and the
independent variables (the variables on the right side of the equation). 2.) Look at the signs of the independent variables. The signs indicate whether a positive or a
negative relationship between the dependent and the independent variable exists. 3.) Look at the numbers in front of the independent variables. They quantify the change in the
dependent variable if a one unit change in the independent variable occurs, holding the other independent variables constant.
4.) Look at the R2. This is a measure to identify how good an equation fits the data. An R2 value close to one indicates the equation has an excellent overall fit.
Estimate for FY2018 Estimate for FY2019 Sales and Use Tax Collections 980,956,131 1,018,420,975+ Audit Collections + Boat Tax +Off-Road Vehicle & MH Tax
14,729,4332,192,586
1,699,555
14,729,4332,258,363
1,771,409= Base Estimate 999,577,705 1,037,180,180- DOR Indirect Funding (6,660,567) (6,793,778) -Transfer to BOR for endo/ecto (778,881) 0= Net Sales Tax Estimate 992,138,257 1,030,386,402 Actual
FY2016 Actual FY2017
Estimated FY2018
Estimated FY2019
Total Receipts 860,905,705 951,223,081 992,138,257 1,030,386,402Dollar Change 24,318,597 90,317,376 40,915,176 38,248,145Percent Change 2.91 10.49 4.30 3.86

Revenue Forecasts Bureau of Finance and Management 5
LOTTERY Background: Receipts included in this category are the general fund’s share of revenues from the sale of instant and on-line lottery tickets. Beginning in FY2016, this category also includes the state’s share of video lottery receipts (SDCL 42-7A).
All of the net proceeds from the sale of instant lottery tickets are deposited in the general fund. The first $1.4 million of the net proceeds from the sale of on-line lottery tickets are deposited in
the general fund. The remaining net proceeds from the sale of on-line lottery tickets are deposited in the Capital Construction Fund.
Due to the repeal of the Property Tax Reduction Fund effective July 1, 2015, forty-nine and one half percent of video lottery net machine income now flows to the general fund in this category. Previous to FY2016, the video lottery receipts flowed through the Property Tax Reduction Fund.
Instant tickets are the scratch tickets sold by retailers. On-line games include Powerball, Mega Millions, Hot Lotto, Dakota Cash, and Wild Card 2.
Receipts included in this category account for approximately 7.3% of ongoing general fund revenues in FY2019.
0.0
20.0
40.0
60.0
80.0
100.0
120.0
FY10FY11
FY12FY13
FY14FY15
FY16FY17
FY18FY19
MillionsForecast
Currently: Through the first seven months of FY2018, the state’s share of video lottery receipts are up 4.3% compared to the same time period a year ago. Through January 2018, instant ticket sales were up 12.5% compared to a year ago. Estimate: The estimates are based on historical collections, current conditions. Actual
FY2016 Actual FY2017
Estimated FY2018
Estimated FY2019
Instant Lottery 6,124,130 5,577,739 5,840,567 6,276,400Online Lottery 1,400,000 1,400,000 1,400,000 1,400,000Video Lottery 102,533,139 104,849,517 109,043,497 111,769,585Total Receipts 110,057,269 111,827,256 116,284,065 119,445,985Dollar Change 103,104,963 1,769,987 4,456,809 3,161,920Percent Change 1,483.03 1.61 3.99 2.72

Revenue Forecasts Bureau of Finance and Management 6
CONTRACTOR’S EXCISE TAX Background: An excise tax of 2% is imposed on the gross receipts of all prime contractors on construction projects. Subcontractor’s gross receipts are not subject to the 2% tax if they are furnished a valid prime contractor’s exemption certificate by the prime contractor for each specific job performed. The gross receipts of both prime contractors and subcontractors providing construction services or realty improvement projects for qualifying utilities are subject to a 2% excise tax. Gross receipts resulting from construction services or realty improvements for public and private entities are subject to the excise tax. Therefore, projects for the U.S. Government, State of South Dakota, counties, cities, schools, hospitals, churches, and private individuals are taxable (SDCL 10-46A and 10-46B).
The date the tax return and payment is due depends on the frequency at which the taxpayer must file and the method of tax remittance. Contractor’s excise tax returns can be filed electronically via EPATH or mailed to the Remittance Center in Sioux Falls. The most common filing period is once a month. The deadline for filing is the 20th of the following month. Taxpayers using EPATH must make payments electronically on or before the 25th of the month. If gross receipts are small or if there is a unique situation to the business, taxpayers may file at a different frequency than monthly. These returns are due the last day of the month following the reporting period.
NOTE: Because of when contractor’s excise tax payments are due, collections are lagged one month (ex: collections recorded in July are payments made to contractors in June).
If the Board of Economic Development approves a reinvestment payment for projects that exceed twenty million dollars, the contractor’s excise tax imposed on that particular project is dedicated to the Building South Dakota Fund under current law. Current pending legislation regarding the Building South Dakota Fund would change this provision to allow all contractor’s excise tax to flow to the general fund in FY2019. This change is estimated to increase contractor’s excise tax collections in FY2019 by an estimated $3.0 million and is included in the FY2019 estimate.
The average annual increase in net contractor’s excise tax collections between FY2009 and FY2017 was 4.2%.
Net collections from the contractor’s excise tax account for approximately 6.8% of ongoing general fund receipts in FY2019.
60.0
70.0
80.0
90.0
100.0
110.0
FY10FY11
FY12FY13
FY14FY15
FY16FY17
FY18FY19
MillionsForecast
Currently: In the first seven months of FY2018, net contractor’s excise tax collections were $73.0 million. This is a decrease of 3.56% from the first seven months of last year. Year-to-date collections are 69.38% of the most current revised FY2018 estimate. Historically, 68.89% of the total revenue collected from this tax is received in the first seven months.

Revenue Forecasts Bureau of Finance and Management 7
Estimate: Contractor’s excise tax collections are estimated using a single regression equation. The equation and its coefficient of determination are below. (An explanation of how to read a regression equation can be found on page 4.) Contractor’s Excise Tax Collections = -44.89 + 1.85*SD Construction, Natural Resources, and Mining Employment + 0.01*(Seasonal Dummy*SD nonfarm income) – 1.78*SD Unemployment Rate + 4.15*Price Index for Metal Materials and Wood Products + 12.15*Consumer Price Index + 0.37*SD Housing Starts. R2 = .9926
Actual
FY2016 Actual FY2017
Estimated FY2018
Estimated FY2019
Net Receipts 101,496,551 106,828,537 105,226,000 111,415,004Dollar Change 1,380,112 5,331,986 (1,062,537) 6,189,004Percent Change 1.38 5.25 (1.50) 5.88
Revenue Forecasts Bureau of Finance and Management 8
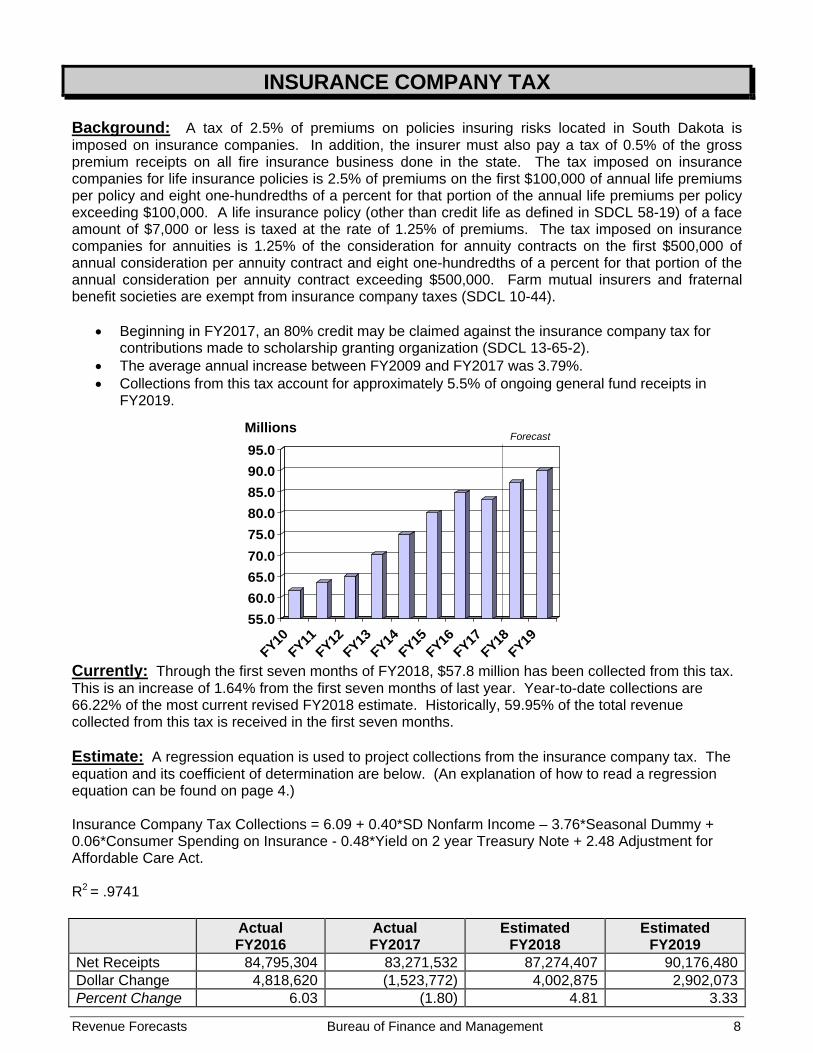
INSURANCE COMPANY TAX Background: A tax of 2.5% of premiums on policies insuring risks located in South Dakota is imposed on insurance companies. In addition, the insurer must also pay a tax of 0.5% of the gross premium receipts on all fire insurance business done in the state. The tax imposed on insurance companies for life insurance policies is 2.5% of premiums on the first $100,000 of annual life premiums per policy and eight one-hundredths of a percent for that portion of the annual life premiums per policy exceeding $100,000. A life insurance policy (other than credit life as defined in SDCL 58-19) of a face amount of $7,000 or less is taxed at the rate of 1.25% of premiums. The tax imposed on insurance companies for annuities is 1.25% of the consideration for annuity contracts on the first $500,000 of annual consideration per annuity contract and eight one-hundredths of a percent for that portion of the annual consideration per annuity contract exceeding $500,000. Farm mutual insurers and fraternal benefit societies are exempt from insurance company taxes (SDCL 10-44).
Beginning in FY2017, an 80% credit may be claimed against the insurance company tax for contributions made to scholarship granting organization (SDCL 13-65-2).
The average annual increase between FY2009 and FY2017 was 3.79%. Collections from this tax account for approximately 5.5% of ongoing general fund receipts in
FY2019.
55.0
60.0
65.0
70.0
75.0
80.0
85.0
90.0
95.0
FY10FY11
FY12FY13
FY14FY15
FY16FY17
FY18FY19
MillionsForecast
Currently: Through the first seven months of FY2018, $57.8 million has been collected from this tax. This is an increase of 1.64% from the first seven months of last year. Year-to-date collections are 66.22% of the most current revised FY2018 estimate. Historically, 59.95% of the total revenue collected from this tax is received in the first seven months. Estimate: A regression equation is used to project collections from the insurance company tax. The equation and its coefficient of determination are below. (An explanation of how to read a regression equation can be found on page 4.) Insurance Company Tax Collections = 6.09 + 0.40*SD Nonfarm Income – 3.76*Seasonal Dummy + 0.06*Consumer Spending on Insurance - 0.48*Yield on 2 year Treasury Note + 2.48 Adjustment for Affordable Care Act. R2 = .9741 Actual
FY2016 Actual FY2017
Estimated FY2018
Estimated FY2019
Net Receipts 84,795,304 83,271,532 87,274,407 90,176,480Dollar Change 4,818,620 (1,523,772) 4,002,875 2,902,073Percent Change 6.03 (1.80) 4.81 3.33

Revenue Forecasts Bureau of Finance and Management 9
UNCLAIMED PROPERTY RECEIPTS Background: Receipts to the general fund from unclaimed property are the result of all funds in excess of $50,000 receipted into the Unclaimed Property Trust Fund. Property is considered abandoned after it has been unclaimed by the rightful owner for three years in South Dakota and must be submitted to the State Treasurer’s office per state law. These unclaimed funds are a perpetual liability of the state of South Dakota and if the owner of such funds is identified, the funds must be paid to the rightful owner. The estimate for FY2018 and FY2019 in the graph below represents the ongoing portion of unclaimed property receipts.
Collections from unclaimed property receipts account for approximately 2.9% of ongoing general fund revenues in FY2019.
Actual
FY2016 Actual FY2017
Estimated FY2018
Estimated FY2019
Ongoing UCP 55,107,516 44,386,220 50,374,141 46,779,257One-time UCP 0 12,714,729 0 0Total UCP 55,107,516 57,100,949 50,374,141 46,779,257
0.0
10.0
20.0
30.0
40.0
50.0
60.0
70.0
FY10FY11
FY12FY13
FY14FY15
FY16FY17
FY18FY19
MillionsForecast
Ongoing UCP
Currently: Through January of FY2018, net unclaimed property receipts to the general fund were $43.4 million, which is down 30.45% compared to the same time period last fiscal year. Estimate: The projections for unclaimed property receipts are based on historical collections and current conditions. Actual
FY2016 Actual FY2017
Estimated FY2018
Estimated FY2019
Ongoing UCP 55,107,516 44,386,220 50,374,141 46,779,257Dollar Change 2,193,327 (10,721,296) 5,987,922 (3,594,884)Percent Change 4.15 (19.46) 13.49 (7.14)

Revenue Forecasts Bureau of Finance and Management 10
LICENSES, PERMITS, AND FEES Background: Revenues included in this category are receipts received from the sales of a broad variety of licenses, permits, and filing fees which are assessed to defray administrative costs. State agencies collecting these revenues are the Departments of Agriculture, Health, Labor and Regulation, Public Safety, Social Services, Revenue, the Unified Judicial System, and the Secretary of State.
About 70% of the revenue collected in this category comes from securities fees. Collections from securities fees are affected by conditions in the stock market. During the boom years of the late nineties and early part of this century, collections from securities fees were strong. After the stock market bubble burst in 2001, collections from securities fees decreased. In the past several years, collections have increased due to a growing economy and stock market.
Collections in this category account for approximately 4.1% of ongoing general fund revenues in FY2019.
35.0
40.0
45.0
50.0
55.0
60.0
65.0
70.0
FY10FY11
FY12FY13
FY14FY15
FY16FY17
FY18FY19
MillionsForecast
Currently: Through the first seven months of FY2018, $37.2 million has been collected in this category. This is an increase of 5.5% from the first seven months of last year. Year-to-date collections are 56.01% of the most current revised FY2018 estimate. Historically, 52.64% of the total revenue is collected in the first seven months. Estimate: The different sources of receipts included in this category are estimated individually based on historical collections and current conditions. Actual
FY2016 Actual FY2017
Estimated FY2018
Estimated FY2019
Receipts 56,712,050 64,730,175 66,340,568 67,668,510Dollar Change 255,017 8,018,125 1,610,393 1,327,942Percent Change 0.45 14.14 2.49 2.00

Revenue Forecasts Bureau of Finance and Management 11
TOBACCO TAXES Background: The cigarette tax is imposed at the rate of seventy-six and one-half mills on each cigarette ($1.53 per pack of 20 cigarettes) and the tax on all other tobacco products is 35% of the wholesale purchase price. The first $30 million generated by this tax increase is allocated to the general fund. The next $5 million is deposited into the Tobacco Prevention and Reduction Trust Fund. Any revenue in excess of $35 million is allocated to the state general fund.
Approximately 87% of the collections included in this category are from the tax on cigarettes, and the remaining 13% is collected based on the tax on the wholesale purchase price of other tobacco products.
The number of packs of cigarettes sold in South Dakota has been declining. In FY2006, 50.4 million packs of cigarettes were sold in the state; in FY2017, 34.6 million packs were sold.
Collections in this category account for approximately 3.3% of ongoing general fund revenues for FY2019.
Actual FY2016
Actual FY2017
Estimated FY2018
Estimated FY2019
General Fund 30,000,000 30,000,000 30,000,000 30,000,000TPRTF 5,000,000 5,000,000 5,000,000 5,000,000Remainder to GF 27,967,713 26,809,149 24,563,752 24,541,454Total 62,967,713 61,809,149 59,563,752 59,514,454
The following chart includes the amount allocated directly to the general fund:
20.0
30.0
40.0
50.0
60.0
FY10FY11
FY12FY13
FY14FY15
FY16FY17
FY18FY19
MillionsForecast
Currently: Through the first seven months of FY2018, the total collections from the tobacco taxes totaled $34.8 million, which was down 5.0% compared to the same time period a year ago. Estimate: Collections from the tax on cigarettes and other tobacco products are estimated individually based on historical collections and current conditions. Actual
FY2016 Actual FY2017
Estimated FY2018
Estimated FY2019
Total Receipts 57,967,713 56,809,149 54,563,752 54,514,454Dollar Change 27,967,713 (1,158,563) (2,245,397) (49,298)Percent Change 93.23 (2.00) (3.95) (0.09)

Revenue Forecasts Bureau of Finance and Management 12
TRUST FUNDS Background: Receipts included in this category are transfers from the Health Care Trust Fund (HCTF), the Education Enhancement Trust Fund (EETF), and the Dakota Cement Trust Fund (DCTF). Four percent of the market values of the trust funds are transferred to the general fund every year as long as the principal of the trust funds are not invaded. The market values are calculated using a 16-quarter average as of December 31st (SDCL 4-5-29.1 and 4-5-29.2). The earnings from the HCTF are to be used for health care related programs, and the earnings from the EETF and DCTF are to be used for education programs (Article 12, Sections 5 and 6 of the State Constitution; Article 13, Sections 20 and 21 of the State Constitution).
The table below shows the amounts transferred from each of the trust funds to the general fund in FY2016 and FY2017, and the estimated amounts for FY2018 and FY2019.
Actual
FY2016 Actual FY2017
Estimated FY2018
Estimated FY2019
HCTF 4,674,130 4,970,123 5,214,739 5,414,000 EETF 17,036,734 18,242,854 19,377,842 20,427,000 DCTF 11,436,003 11,981,721 12,441,000 12,764,000 Total 33,146,867 35,194,697 37,033,581 38,605,000
Receipts from the trust funds account for approximately 2.4% of ongoing general fund revenues
in FY2019. Currently: As of December 31st, the estimated rate of return for the fiscal year for the trust funds was 5.3%. Estimate: The estimate for FY2018 and FY2019 includes the constitutionally required transfer from the Dakota Cement Trust and the amounts to be transferred from the Health Care Trust Fund and Education Enhancement Trust Fund pursuant to SDCL 4-5-29.1 and SDCL 4-5-29.2. Actual
FY2016 Actual FY2017
Estimated FY2018
Estimated FY2019
Total Receipts 33,146,867 35,194,697 37,033,581 38,605,000Dollar Change 2,320,537 2,047,830 1,838,884 1,571,419Percent Change 7.53 6.18 5.22 4.24
10.0
15.0
20.0
25.0
30.0
35.0
40.0
FY10FY11
FY12FY13
FY14FY15
FY16FY17
FY18FY19
MillionsForecast

Revenue Forecasts Bureau of Finance and Management 13
NET TRANSFERS IN Background: Receipts included in this category are general fund reimbursements by the Highway Fund; receipts from the Department of Game, Fish, and Parks; receipts from the Motor Vehicle Fund; the state’s share of the Deadwood gaming revenue (SDCL 42-7B-28.1 and SDCL 42-7B-48.1); the obligation recovery center fee (beginning in FY2016); the transfer from the wind energy tax fund (beginning in FY2016); the transfer from the State Veteran’s Home Operating fund (beginning in FY2017); the transfer from the Prison Industries Revolving fund and other miscellaneous receipts.
In FY2016, the Health Care Tobacco Tax Fund and the Education Enhancement Tobacco Tax Fund were repealed. These receipts are now included in the Tobacco Taxes revenue category in FY2016.
In FY2017, this category includes receipts from the Department of Corrections that were previously utilized internally by the department.
In FY2018 and FY2019, there are transfers of $2.0 million in each fiscal year from the Veteran’s Home Operating fund included in the receipts.
Receipts included in this category account for approximately 1.3% of ongoing general fund revenues in FY2019.
4.0
8.0
12.0
16.0
20.0
24.0
28.0
32.0
36.0
FY10FY11
FY12FY13
FY14FY15
FY16FY17
FY18FY19
MillionsForecast
Currently: Through the first seven months of FY2018, $12.9 million has been collected in this category. This is an increase of 7.6% from the first seven months of last year. Year-to-date collections are 59.91% of the estimate below. Estimate: The different sources of receipts included in this category are broken out and estimated individually based on historical collections and current conditions. Actual
FY2016 Actual FY2017
Estimated FY2018
Estimated FY2019
Total Receipts 20,664,859 21,897,071 21,495,937 21,406,868Dollar Change (9,729,612) 1,232,211 (401,134) (89,069)Percent Change (32.01) 5.96 (1.83) (0.41)

Revenue Forecasts Bureau of Finance and Management 14
ALCOHOL BEVERAGE TAX Background: A tax is levied on manufacturers and wholesalers of alcoholic beverages, and is computed on all alcoholic beverages purchased, received, or imported from a distiller, manufacturer, or foreign wholesaler for sale to a retail dealer. The taxation rates are as follows: 1) $8.50 per 31 gallon barrel (or a prorata share thereof) on malt beverages; 2) all light wines and diluted beverages (except sparkling wines and cider) having more than 3.2% and not more than 14% alcohol by weight, 93¢ per gallon; 3) all wines (except sparkling wines) having more than 14% and not more than 20% alcohol by weight, $1.45 per gallon; 4) all wines (except sparkling wines) having more than 20% and not more than 24% alcohol by weight, and all sparkling wines containing alcohol, $2.07 per gallon; 5) all cider having not more than 10% alcohol by weight, 28¢ per gallon; and, 6) all other alcoholic beverages, $3.93 per gallon (SDCL 35-5).
Prior to FY2017, the state received 75% of the tax collected, and 25% of the collections go to the municipalities. Beginning in FY2017, 25% of the tax is allocated to the counties, 25% is allocated to the municipalities, and 50% is allocated to the state general fund.
Collections from this tax account for approximately 0.5% of ongoing general fund revenues in FY2019.
5.0
6.0
7.0
8.0
9.0
10.0
11.0
12.0
FY10
FY11
FY12
FY13
FY14
FY15
FY16
FY17
FY18
FY19
Millions Forecast
Currently: Through the first seven months of FY2018, $4.6 million has been collected from this tax. This is an increase of 4.22% from the first seven months of last year. Year-to-date collections are 58.35% of the most current revised FY2018 estimate. Historically, 53.51% of the total revenue collected from this tax is received in the first seven months. Estimate: The estimates are based on historical collections and current conditions. Actual
FY2016 Actual FY2017
Estimated FY2018
Estimated FY2019
Total Receipts 11,403,076 7,617,533 7,823,657 7,993,846Dollar Change 630,713 (3,785,543) 206,124 170,189Percent Change 5.85 (33.20) 2.71 2.18

Revenue Forecasts Bureau of Finance and Management 15
BANK FRANCHISE TAX Background: In lieu of sales tax on financial and banking services, an annual tax is imposed on banks, financial institutions, and savings and loan associations based upon net income assignable to South Dakota. The tax rates are as follows: 1) 6% on net income of $400 million or less; 2) 5% on net income exceeding $400 million but equal to or less than $425 million; 3) 4% on net income exceeding $425 million but equal to or less than $450 million; 4) 3% on net income exceeding $450 million but equal to or less than $475 million; 5) 2% on net income exceeding $475 million but equal to or less than $500 million; 6) 1% on net income exceeding $500 million but equal to or less than $600 million; 7) 0.5% on net income exceeding $600 million but equal to or less than $1.2 billion; and 8) 0.25% on net income exceeding $1.2 billion. The minimum tax payable is $200 (SDCL 10-43).
Ninety-five percent of the taxes paid by bank card taxpayers and 26 2/3% of all other revenues are deposited in the general fund. The remaining 5% of collections from bank card taxpayers and the 73 1/3% of revenues received from all other banks are remitted to the county where the bank or financial institution is located.
During the 2014 legislative session, legislation was passed to revise the apportionment laws for banks that operate in multiple states from cost of performance sourcing of income to customer based sourcing of income.
In FY2017, payments are now due on an annual basis. Collections from this tax account for approximately 0.7% of ongoing general fund revenues in
FY2019.
0.0
10.0
20.0
30.0
40.0
FY10FY11
FY12FY13
FY14FY15
FY16FY17
FY18FY19
MillionsForecast
Currently: Through the first seven months of FY2018, $3.1 million has been collected from this tax. This is an increase of 46.39% from the first seven months of last year. Estimate: Collections received from bank card taxpayers and other banks are estimated individually. The estimate is based on historical collections, current conditions, and repealing quarterly estimated payments. Actual
FY2016 Actual FY2017
Estimated FY2018
Estimated FY2019
Total Receipts 10,512,754 14,688,771 9,097,064 11,872,042Dollar Change 1,929,654 4,176,017 (5,591,707) 2,774,978Percent Change 22.48 39.72 (38.07) 30.50

Revenue Forecasts Bureau of Finance and Management 16
CHARGES FOR GOODS AND SERVICES Background: Receipts included in this category are from charges made by institutions under the Department of Human Services and the Department of Social Services; audit charges made by the Auditor General to state and local governments; child support collections paid back to the state received by the Department of Social Services; 35% of fines, penalties, and forfeitures collected by or through the use of a circuit or magistrate court, clerk, or other court officer for violations of a county, township, municipal, or chartered governmental unit's ordinance, charter, or bylaw; and other miscellaneous charges. Beginning in FY2017, additional receipts from the Department of Corrections are being receipted directly into the general fund.
Revenues to the general fund from this category are relatively constant from year to year. Receipts included in this category account for approximately 1.0% of ongoing general fund
revenues in FY2019.
0.0
4.0
8.0
12.0
16.0
20.0
FY10FY11
FY12FY13
FY14FY15
FY16FY17
FY18FY19
MillionsForecast
Currently: Through the first seven months of FY2018, $9.6 million has been collected in this category. This is an increase of 13.50% from the first seven months of last year. Year-to-date collections are 55.96% of the most current revised FY2018 estimate. Historically, 53.88% of the total revenue is collected in the first seven months. Estimate: The different sources of receipts included in this category are broken out and estimated individually based on historical collections and current conditions. Actual
FY2016 Actual FY2017
Estimated FY2018
Estimated FY2019
Total Receipts 11,589,517 15,562,672 17,199,937 16,354,430Dollar Change (164,758) 3,973,155 1,637,265 (845,507)Percent Change (1.40) 34.28 10.52 (4.92)

Revenue Forecasts Bureau of Finance and Management 17
TELECOMMUNICATIONS TAX Background: A gross receipts tax is imposed at the rate of 4% of telecommunications services within the state (SDCL 10-33A). Through FY2015, sixty percent of the revenue generated from this tax was dedicated to the Property Tax Reduction Fund (PTRF) with the remaining forty percent deposited into the County Telecommunications Gross Receipts Fund.
Beginning in FY2016, the receipts from this tax are included in this separate classification due to the repeal of the PTRF.
The chart below shows the historical collections of this particular source of revenue that has flowed through the PTRF to the state general fund from FY2009 through FY2015 as well as the projected amounts through FY2019.
Collections from this tax account for approximately 0.3% of ongoing general fund revenues in FY2019.
0.0
2.0
4.0
6.0
8.0
10.0
FY10FY11
FY12FY13
FY14FY15
FY16FY17
FY18FY19
MillionsForecast
Currently: Through the first seven months of FY2018, $2.4 million has been collected from this source. This is a decrease of 12.32% from the first seven months of last year. Estimate: Collections from the telecommunications tax is based on historical collections and current conditions.
Actual FY2016
Actual FY2017
Estimated FY2018
Estimated FY2019
Total Receipts 5,943,316 5,329,876 4,690,291 4,221,262Dollar Change (492,305) (613,441) (639,585) (469,029)Percent Change (7.65) (10.32) (12.00) (10.00)

Revenue Forecasts Bureau of Finance and Management 18
SEVERANCE TAXES Background: A severance tax is imposed at the rate of $4 per ounce of gold severed in South Dakota and an additional per ounce tax of up to $4 which is dependent on the price of gold. In addition, there is a tax of 10% of the net profits from the sale of precious metals severed (SDCL 10-39). Owners or operators of energy minerals must pay a tax equal to 4.5% of the taxable value of any energy minerals severed (SDCL 10-39A).
Currently all precious metal severance taxes are deposited in the general fund. One-half of the energy mineral severance taxes received are returned to the county where the
energy minerals were severed and one-half of the taxes are deposited in the general fund. Gold production decreased in South Dakota in 2017 compared to 2016. In 2016, 109,175
ounces of gold were produced in the state, while 95,372 ounces of gold were produced in 2017. Oil production in South Dakota was down slightly in 2017 compared to 2016, with 1,406,670
bbls in 2016 produced and an estimated 1,304,379 bbls in 2017. Collections included in this category account for approximately 0.4% of ongoing general fund
revenues in FY2019.
0.01.02.03.04.05.06.07.08.09.0
10.011.0
FY10FY11
FY12FY13
FY14FY15
FY16FY17
FY18FY19
MillionsForecast
Currently: Through the first seven months of FY2018, $5.2 million has been collected in this category. This is a decrease of 25.74% from the first seven months of last year. Estimate: Collections from taxes on precious metals and energy minerals are estimated separately. The estimates of collections from the severance taxes on gold and precious metals are based on history and current conditions. The estimates of collections from the tax on energy minerals are based on history and the projected price of crude oil and natural gas.
Actual FY2016
Actual FY2017
Estimated FY2018
Estimated FY2019
Total Receipts 6,131,259 8,968,233 6,762,544 7,082,431Dollar Change 734,634 2,836,975 (2,205,689) 319,887Percent Change 13.61 46.27 (24.59) 4.73

Revenue Forecasts Bureau of Finance and Management 19
SALE-LEASEBACK Background: On December 1, 1986, the state sold a number of buildings and then leased them back. The purpose of doing this was to take advantage of a tax opportunity which provided a large sum of money for capital improvements. Proceeds from the sale were also used to purchase an annuity contract. Starting December 1, 1987, annuity payments are deposited in the general fund. The annuity payments are then used to make the lease payments, which are appropriated annually by the legislature.
This is an in-and-out revenue source. FY2017 was the final year for the sale lease-back annuity payment.
0.0
2.0
4.0
6.0
8.0
10.0
FY10FY11
FY12FY13
FY14FY15
FY16FY17
FY18FY19
MillionsForecast
Actual
FY2016 Actual FY2017
Estimated FY2018
Estimated FY2019
Total Receipts 4,663,938 4,138,575 NA NADollar Change (572,875) (525,363) Percent Change (10.94) (11.26)

Revenue Forecasts Bureau of Finance and Management 20
INVESTMENT INCOME AND INTEREST Background: Revenues included in this category are from interest and the investment earnings of the general fund and nonparticipating funds in the cash flow fund. (Nonparticipating means the earnings attributable to the company are deposited in the general fund.) The South Dakota Investment Council is responsible for investing the money in the cash flow fund (SDCL 4-5).
The yield of the cash flow fund has varied over the years, which has affected the interest income. Due to higher interest rates, the yield ranged from 4.2% to 5.1% from FY2007 through FY2010. In the past several years, the yield has decreased due to low interest rates. In FY2016 and FY 2017, the yield was 1.3% and 1.2%, respectively.
In 2015, legislation was passed to discontinue the accelerated 90% interest earnings for the current year’s proration. Thus, only 10% of the previous year’s proration is reflected in FY2015 receipts and 100% of the earnings from the previous year are reflected in FY2016 receipts.
Receipts in this category account for approximately 0.4% of ongoing general fund revenues in FY2019.
0.0
5.0
10.0
15.0
20.0
FY10FY11
FY12FY13
FY14FY15
FY16FY17
FY18FY19
MillionsForecast
Currently: Through the first seven months of FY2018, $5.9 million has been collected in this category. This is a decrease of 5.13% from the first seven months of last year. The yield of the cash flow fund is estimated at 1.2% for FY2018 of which earnings will be distributed in FY2019. Estimate: The estimate is based on information provided by the South Dakota Investment Council and historical collections.
Actual FY2016
Actual FY2017
Estimated FY2018
Estimated FY2019
Total Receipts 5,438,611 6,366,142 6,039,167 6,113,847Dollar Change 4,573,946 927,531 (326,975) 74,680Percent Change 528.98 17.05 (5.14) 1.24

Revenue Forecasts Bureau of Finance and Management 21
ALCOHOL BEVERAGE 2% WHOLESALE TAX Background: In addition to the tax imposed by SDCL 35-5-3, a tax is levied at the rate of 2% of the purchase price upon the purchase of alcoholic beverages, except malt beverages, by a wholesaler from a distiller, manufacturer, or supplier (SDCL 35-5-6.1).
Collections from this tax account for approximately 0.1% of ongoing general fund revenues in FY2019.
1.0
1.2
1.4
1.6
1.8
2.0
2.2
2.4
FY10FY11
FY12FY13
FY14FY15
FY16FY17
FY18FY19
ForecastMillions
Currently: Through the first seven months of FY2018, $1.4 million has been collected from this tax. This is an increase of 10.34% from the first seven months of last year. Year-to-date collections are 65.31% of the most current revised FY2018 estimate. Historically, 58.22% of the total revenue collected from this tax is received in the first seven months. Estimate: The estimates are based on historical collections and current conditions. Actual
FY2016 Actual FY2017
Estimated FY2018
Estimated FY2019
Total Receipts 1,850,515 1,954,454 2,071,789 2,187,859Dollar Change (11,231) 117,335 117,335 116,070Percent Change (0.60) 5.62 6.00 5.60

Revenue Forecasts Bureau of Finance and Management 22
GOVERNOR’S REVISED FY2018 VS. FEBRUARY REVISED FY2018
GOV'S REVSIED FEB. REVISED DOLLAR PERCENTFY2018 FY2018 CHANGE CHANGE
ONGOING RECEIPTSSales and Use Tax 979,294,904$ 992,138,257$ 12,843,353$ 1.31Lottery 115,444,817 116,284,065 839,248 0.73Contractor's Excise Tax 102,736,361 105,226,000 2,489,639 2.42Insurance Company Tax 86,870,686 87,274,407 403,721 0.46Unclaimed Property Receipts 48,617,609 50,374,141 1,756,532 3.61Licenses, Permits, and Fees 66,640,728 66,340,568 (300,160) (0.45)Tobacco Taxes 55,423,609 54,563,752 (859,857) (1.55)Trust Funds 37,025,022 37,033,581 8,559 0.02Net Transfers In 21,979,954 21,495,937 (484,017) (2.20)Alcohol Beverage Tax 7,738,563 7,823,657 85,094 1.10Bank Franchise Tax 11,567,064 9,097,064 (2,470,000) (21.35)Charges for Goods and Services 17,168,192 17,199,937 31,745 0.18Telecommunications Tax 4,690,291 4,690,291 0 0.00Severance Taxes 6,508,475 6,762,544 254,069 3.90Investment Income and Interest 6,049,700 6,039,167 (10,533) (0.17)Alcohol Beverage 2% Wholesale Tax 2,033,098 2,071,789 38,691 1.90
SUBTOTAL (ONGOING RECEIPTS) 1,569,789,073$ 1,584,415,157$ 14,626,084$ 0.93
ONE-TIME RECEIPTSTransfer from SD Health and Ed Facilities Authority 2,500,000$ 0$ (2,500,000) (100.00)Transfer from Homemaker Fees Fund 2,000,000 2,000,000 0 0.00Transfer from Petroleum Release Fund 1,300,000 1,300,000 0 0.00Transfer from Workforce Education Fund 792,729 792,729 0 0.00Transfer from Prescription Drug Plan Fund 750,000 750,000 0 0.00Transfer from Telecommunication Fund 750,000 750,000 0 0.00Transfer from Video Lottery Fund 500,000 500,000 0 0.00Transfer from Court Automation Fund 500,000 500,000 0 0.00Transfer from Technology Fund 500,000 500,000 0 0.00Transfer from Private Activities Bond Fee Fund 480,743 480,743 0 0.00Transfer from Budgetary Accounting Fund 261,396 261,396 0 0.00Transfer from Veterans' Home Operating Fund 120,000 120,000 0 0.00Transfer from Budget Reserve Fund 7,210,593 7,210,593 0 0.00Obligated Cash Carried Forward 7,943,412 7,943,412 0 0.00
SUBTOTAL (ONE-TIME RECEIPTS) 25,608,873$ 23,108,873$ ($2,500,000) (9.76)
GRAND TOTAL 1,595,397,946$ 1,607,524,030$ 12,126,084$ 0.76

Revenue Forecasts Bureau of Finance and Management 23
GOVERNOR’S RECOMMENDED FY2019 VS. FEBRUARY REVISED FY2019
GOV'S REC FEB. REVISED DOLLAR PERCENTFY2019 FY2019 CHANGE CHANGE
ONGOING RECEIPTSSales and Use Tax 1,016,906,602$ 1,030,386,402$ 13,479,800$ 1.33Lottery 118,558,981 119,445,985 887,004 0.75Contractor's Excise Tax 108,849,223 111,415,004 2,565,781 2.36Insurance Company Tax 90,097,000 90,176,480 79,480 0.09Unclaimed Property Receipts 46,779,257 46,779,257 0 0.00Licenses, Permits, and Fees 68,937,971 67,668,510 (1,269,461) (1.84)Tobacco Taxes 55,352,621 54,514,454 (838,167) (1.51)Trust Funds 38,544,233 38,605,000 60,767 0.16Net Transfers In 23,303,429 21,406,868 (1,896,561) (8.14)Alcohol Beverage Tax 7,908,751 7,993,846 85,095 1.08Bank Franchise Tax 11,872,042 11,872,042 0 0.00Charges for Goods and Services 15,947,487 16,354,430 406,943 2.55Telecommunications Tax 4,455,776 4,221,262 (234,514) (5.26)Severance Taxes 6,599,863 7,082,431 482,568 7.31Investment Income and Interest 6,265,870 6,113,847 (152,023) (2.43)Alcohol Beverage 2% Wholesale Tax 2,110,479 2,187,859 77,380 3.67
SUBTOTAL (ONGOING RECEIPTS) 1,622,489,585$ 1,636,223,677$ 13,734,092$ 0.85
ONE-TIME RECEIPTSSUBTOTAL (ONE-TIME RECEIPTS) 0$ 0$ $0 0.00
GRAND TOTAL 1,622,489,585$ 1,636,223,677$ 13,734,092$ 0.85

Revenue Forecasts Bureau of Finance and Management 24
ADOPTED FY2018 VS. FEBRUARY REVISED FY2018
LEG. ADOPTED FEB. REVISED DOLLAR PERCENT FY2018 FY2018 CHANGE CHANGE
ONGOING RECEIPTSSales and Use Tax 989,040,000$ 992,138,257$ 3,098,257$ 0.31Lottery 115,318,879 116,284,065 965,186 0.84Contractor's Excise Tax 110,614,834 105,226,000 (5,388,834) (4.87)Insurance Company Tax 93,000,000 87,274,407 (5,725,593) (6.16)Unclaimed Property Receipts 51,461,196 50,374,141 (1,087,055) (2.11)Licenses, Permits, and Fees 64,000,000 66,340,568 2,340,568 3.66Tobacco Taxes 55,031,773 54,563,752 (468,021) (0.85)Trust Funds 36,960,438 37,033,581 73,143 0.20Net Transfers In 21,000,000 21,495,937 495,937 2.36Alcohol Beverage Tax 8,000,000 7,823,657 (176,343) (2.20)Bank Franchise Tax 10,944,525 9,097,064 (1,847,461) (16.88)Charges for Goods and Services 16,115,139 17,199,937 1,084,798 6.73Telecommunications Tax 5,337,875 4,690,291 (647,584) (12.13)Severance Taxes 5,825,663 6,762,544 936,881 16.08Investment Income and Interest 5,248,558 6,039,167 790,609 15.06Alcohol Bev 2% Wholesale Tax 2,200,000 2,071,789 (128,211) (5.83)
TOTAL (ONGOING RECEIPTS) 1,590,098,880$ 1,584,415,157$ (5,683,723)$ (0.36)
ONE-TIME RECEIPTSTransfer from SD Health and Ed Facilities Authority 0$ 0$ 0$ 100.00Transfer from Homemaker Fees Fund 0 2,000,000 2,000,000 100.00Transfer from Petroleum Release Fund 0 1,300,000 1,300,000 100.00Transfer from Workforce Education Fund 0 792,729 792,729 100.00Transfer from Prescription Drug Plan Fund 0 750,000 750,000 100.00Transfer from Telecommunication Fund 0 750,000 750,000 100.00Transfer from Video Lottery Fund 0 500,000 500,000 100.00Transfer from Court Automation Fund 0 500,000 500,000 100.00Transfer from Technology Fund 0 500,000 500,000 100.00Transfer from Private Activities Bond Fee Fund 0 480,743 480,743 100.00Transfer from Budgetary Accounting Fund 0 261,396 261,396 100.00Transfer from Veterans' Home Operating Fund 0 120,000 120,000 100.00Transfer from Budget Reserve Fund 0 7,210,593 7,210,593 100.00Obligated Cash Carried Forward 0 7,943,412 7,943,412 100.00
SUBTOTAL (ONE-TIME RECEIPTS) 0$ 23,108,873$ $23,108,873 100.00
GRAND TOTAL 1,590,098,880$ 1,607,524,030$ 17,425,150$ 1.10

Revenue Forecasts Bureau of Finance and Management 25
ACTUAL FY2017 VS. FEBRUARY REVISED FY2018
ACTUAL REVISED DOLLAR PERCENT FY2017 FY2018 CHANGE CHANGE
ONGOING RECEIPTSSales and Use Tax 951,223,081$ 992,138,257$ 40,915,176$ 4.30Lottery 111,827,256 116,284,065 4,456,809 3.99Contractor's Excise Tax 106,828,537 105,226,000 (1,602,537) (1.50)Insurance Company Tax 83,271,532 87,274,407 4,002,875 4.81Unclaimed Property Receipts 44,386,220 50,374,141 5,987,921 13.49Licenses, Permits, and Fees 64,730,175 66,340,568 1,610,393 2.49Tobacco Taxes 56,809,149 54,563,752 (2,245,397) (3.95)Trust Funds 35,194,697 37,033,581 1,838,884 5.22Net Transfers In 21,897,071 21,495,937 (401,134) (1.83)Alcohol Beverage Tax 7,617,533 7,823,657 206,124 2.71Bank Franchise Tax 14,688,771 9,097,064 (5,591,707) (38.07)Charges for Goods and Services 15,562,672 17,199,937 1,637,265 10.52Telecommunications Tax 5,329,876 4,690,291 (639,585) (12.00)Severance Taxes 8,968,233 6,762,544 (2,205,689) (24.59)Sale-Leaseback 4,138,575 0 (4,138,575) (100.00)Investment Income and Interest 6,366,142 6,039,167 (326,975) (5.14)Alcohol Bev 2% Wholesale Tax 1,954,454 2,071,789 117,335 6.00
TOTAL (ONGOING RECEIPTS) 1,540,793,973$ 1,584,415,157$ 43,621,184$ 2.83
ONE-TIME RECEIPTSTransfer from SD Health and Ed Facilities Authority 0$ 0$ 0$ 100.00Transfer from Homemaker Fees Fund 0 2,000,000 2,000,000 100.00Transfer from Petroleum Release Fund 0 1,300,000 1,300,000 100.00Transfer from Workforce Education Fund 0 792,729 792,729 100.00Transfer from Prescription Drug Plan Fund 0 750,000 750,000 100.00Transfer from Telecommunication Fund 800,000 750,000 (50,000) (6.25)Transfer from Video Lottery Fund 500,000 500,000 0 0.00Transfer from Court Automation Fund 500,000 500,000 0 0.00Transfer from Technology Fund 0 500,000 500,000 100.00Transfer from Private Activities Bond Fee Fund 911,625 480,743 (430,882) (47.27)Transfer from Budgetary Accounting Fund 0 261,396 261,396 100.00Transfer from Veterans' Home Operating Fund 0 120,000 120,000 100.00One-Time Unclaimed Property Receipts 12,714,729 0 (12,714,729) (100.00)Transfer from General Militia Fund 180,000 0 (180,000) (100.00)Transfer from SD Certified Beef Fund 104,000 0 (104,000) (100.00)Prior Period Adjustments (1,712,184) 0 1,712,184 (100.00)Unexpended Carryovers and Specials 1,449,345 0 (1,449,345) (100.00)Transfer from Budget Reserve Fund 0 7,210,593 7,210,593 100.00Obligated Cash Carried Forward 14,069,144 7,943,412 (6,125,732)
SUBTOTAL (ONE-TIME RECEIPTS) 29,516,659$ 23,108,873$ (6,407,786)$ (21.71)
GRAND TOTAL 1,570,310,632$ 1,607,524,030$ 37,213,398$ 2.37

Revenue Forecasts Bureau of Finance and Management 26
FEBRUARY REVISED FY2018 VS. FEBRUARY REVISED FY2019
FEB. REVISED FEB. REVISED DOLLAR PERCENTFY2018 FY2019 CHANGE CHANGE
ONGOING RECEIPTSSales and Use Tax 992,138,257$ 1,030,386,402$ 38,248,145$ 3.86Lottery 116,284,065 119,445,985 3,161,920 2.72Contractor's Excise Tax 105,226,000 111,415,004 6,189,004 5.88Insurance Company Tax 87,274,407 90,176,480 2,902,073 3.33Unclaimed Property Receipts 50,374,141 46,779,257 (3,594,884) (7.14)Licenses, Permits, and Fees 66,340,568 67,668,510 1,327,942 2.00Tobacco Taxes 54,563,752 54,514,454 (49,298) (0.09)Trust Funds 37,033,581 38,605,000 1,571,419 4.24Net Transfers In 21,495,937 21,406,868 (89,069) (0.41)Alcohol Beverage Tax 7,823,657 7,993,846 170,189 2.18Bank Franchise Tax 9,097,064 11,872,042 2,774,978 30.50Charges for Goods and Services 17,199,937 16,354,430 (845,507) (4.92)Telecommunications Tax 4,690,291 4,221,262 (469,029) (10.00)Severance Taxes 6,762,544 7,082,431 319,887 4.73Investment Income and Interest 6,039,167 6,113,847 74,680 1.24Alcohol Beverage 2% Wholesale Tax 2,071,789 2,187,859 116,070 5.60
SUBTOTAL (ONGOING RECEIPTS) 1,584,415,157$ 1,636,223,677$ 51,808,520$ 3.27
ONE-TIME RECEIPTSTransfer from SD Health and Ed Facilities Authority 0$ 0$ 0$ (100.00)Transfer from Homemaker Fees Fund 2,000,000 0 (2,000,000) (100.00)Transfer from Petroleum Release Fund 1,300,000 0 (1,300,000) (100.00)Transfer from Workforce Education Fund 792,729 0 (792,729) (100.00)Transfer from Prescription Drug Plan Fund 750,000 0 (750,000) (100.00)Transfer from Telecommunication Fund 750,000 0 (750,000) (100.00)Transfer from Video Lottery Fund 500,000 0 (500,000) (100.00)Transfer from Court Automation Fund 500,000 0 (500,000) (100.00)Transfer from Technology Fund 500,000 0 (500,000) (100.00)Transfer from Private Activities Bond Fee Fund 480,743 0 (480,743) (100.00)Transfer from Budgetary Accounting Fund 261,396 0 (261,396) (100.00)Transfer from Veterans' Home Operating Fund 120,000 0 (120,000) (100.00)Transfer from Budget Reserve Fund 7,210,593 0 (7,210,593) (100.00)Obligated Cash Carried Forward 7,943,412 0 (7,943,412) (100.00)
SUBTOTAL (ONE-TIME RECEIPTS) 23,108,873$ 0$ ($23,108,873) (100.00)
GRAND TOTAL 1,607,524,030$ 1,636,223,677$ 28,699,647$ 1.79