revenue account for the year ended 31st … · form nl-3-b-bs star health and allied insurance...
TRANSCRIPT

(Rs. in ’000)
Particulars ScheduleFor the Quarter
ended 31.Mar.15
For the Year ended
31.Mar.15
For the Quarter ended
31.Mar.14
For the Year ended
31.Mar.14
1 Premiums earned (Net) 1 D 2,812,230 10,179,295 1,732,710 6,753,950
2 Profit / (Loss) on sale / redemption of Investments 5,208 15,223 712 8,329
3 Others - - 161,606 161,606
4 Interest, Dividend & Rent – (Gross) 119,823 404,736 81,700 255,188
TOTAL (A) 2,937,261 10,599,254 1,976,728 7,179,073
1 Claims Incurred (Net) 2 D 1,716,474 6,510,591 1,198,050 4,539,456
2 Commission 3 D 357,306 1,010,122 66,358 366,602
3 Operating Expenses related to Insurance Business 4 1,492,635 4,558,341 935,106 3,318,646
4 Premium Deficiency - - - -
TOTAL (B) 3,566,414 12,079,054 2,199,514 8,224,703
Operating Profit / (Loss) from Miscellaneous
Business : C = (A - B) (629,154) (1,479,800) (222,786) (1,045,630)
APPROPRIATIONS
Transfer to Shareholders’ Account (629,154) (1,479,800) (222,786) (1,045,630)
Transfer to Catastrophe Reserve - - - -
Transfer to Other Reserves (to be specified) - - - -
TOTAL (D) (629,154) (1,479,800) (222,786) (1,045,630)
Place: Chennai – 34Date: 28.05.15
FORM NL-1-B-RASTAR HEALTH AND ALLIED INSURANCE COMPANY LIMITED
Registration No. and Date of Registration with the IRDA : 129/16.03.2006
REVENUE ACCOUNT FOR THE YEAR ENDED 31ST MARCH 2015MISCELLANEOUS BUSINESS
Page: 1

(Rs. in ’000)
Particulars Schedule
For the Quarter
ended 31.Mar.15
For the Year
ended
31.Mar.15
For the Quarter
ended 31.Mar.14
For the Year
ended
31.Mar.14
1 OPERATING PROFIT/(LOSS)
(a) Fire Insurance - - - -
(b) Marine Insurance - - - -
(c) Miscellaneous Insurance (629,154) (1,479,800) (222,786) (1,045,630)
2 INCOME FROM INVESTMENTS
(a) Interest, Dividend & Rent – (Gross) 26,303 88,845 11,781 109,366
(b) Profit on sale of investments 1,143 3,342 - 3,829
Less: Loss on sale of investments - - (715) (259)
3 OTHER INCOME - - - -
TOTAL (A) (601,708) (1,387,613) (211,720) (932,694)
4 PROVISIONS (Other than taxation)
(a) For diminution in the value of investments - - - -
(b) For doubtful debts - - - -
(c) Others - - - -
5 OTHER EXPENSES(a) Expenses other than those related to Insurance
Business - - - -
(b) Bad debts written off - - - -
(c) Others - - - -
Amortisation Expenses 196 250 (70) 541
Sweat Equity Shares Pending Allotment 12,646 12,646 - -
TOTAL (B) 12,842 12,896 (70) 541
Profit Before Tax (A - B) (614,550) (1,400,509) (211,650) (933,235)
Provision for Taxation
(a) Current Tax - - - -
(b) Fringe Benefit Tax - - - -
(c) Deferred Tax - - - -
Profit After Tax (614,550) (1,400,509) (211,650) (933,236)
APPROPRIATIONS
(a) Interim dividends paid during the year - - - -
(b) Proposed final dividend - - -
(c) Dividend distribution tax - - - -
(d) Transfer Contingency reserve for Unexpired Risk
Balance of profit / (loss) brought forward from last year - (3,551,680) - (2,618,443)
Balance carried forward to Balance Sheet (614,550) (4,952,189) (211,650) (3,551,679)
Significant accounting policies 16 - - - -
Notes to financial statements 17 - - - -
Earnings per share - Basic - (4.13) - (2.82)
- Diluted - (4.13) - (2.82)
Place: Chennai – 34Date: 28.05.15
FORM NL-2-B-PLSTAR HEALTH AND ALLIED INSURANCE COMPANY LIMITED
Registration No. and Date of Registration with the IRDA : 129/16.03.2006
PROFIT AND LOSS ACCOUNT FOR THE YEAR ENDED 31ST MARCH 2015
Page: 2

(Rs. in ’000)
Particulars Schedule
As on
31.Mar.15
As on
31.Mar.14
SOURCES OF FUNDSSHARE CAPITAL 5 3,621,441 3,338,605
SHARE APPLICATION MONEY - -
RESERVES AND SURPLUS 6 2,749,276 2,108,852
FAIR VALUE CHANGE ACCOUNT - -
BORROWINGS 7 - -
DEFERRED TAX LIABILITY - -
TOTAL 6,370,717 5,447,457
APPLICATION OF FUNDSINVESTMENTS 8 5,018,372 3,513,295
LOANS 9 - -
FIXED ASSETS 10 584,654 598,676
CURRENT ASSETS Cash and Bank Balances 11 3,277,917 2,155,038 Advances and Other Assets 12 2,076,885 2,310,828
Sub-Total (A) 5,354,802 4,465,866
CURRENT LIABILITIES 13 2,097,218 1,579,352
PROVISIONS 14 7,442,082 5,102,708
Sub-Total (B) 9,539,300 6,682,060
NET CURRENT ASSETS (C) = (A - B) (4,184,498) (2,216,194)
MISCELLANEOUS EXPENDITURE
(to the extent not written off or adjusted) 15 - -
DEBIT BALANCE IN PROFIT AND LOSS ACCOUNT 4,952,189 3,551,679
TOTAL 6,370,717 5,447,457
Place: Chennai – 34Date: 28.05.15
FORM NL-3-B-BSSTAR HEALTH AND ALLIED INSURANCE COMPANY LIMITED
Registration No. and Date of Registration with the IRDA : 129/16.03.2006
BALANCE SHEET AS AT 31ST MARCH 2015
Page: 3

FORM NL-4-PREMIUM SCHEDULEPREMIUM EARNED [NET]MISCELLANEOUS BUSINESS
(Rs. in ’000)
Particulars
For the Quarter
ended 31.Mar.15
For the Year ended
31.Mar.15
For the Quarter
ended 31.Mar.14
For the Year ended
31.Mar.14
Premium from direct business written 5,224,991 14,691,941 3,576,286 10,910,784
Add: Premium on reinsurance accepted 1,462 3,871 12,526 228,883 Less : Premium on reinsurance ceded 408,085 2,157,756 416,067 2,704,384
Net Premium 4,818,368 12,538,056 3,172,745 8,435,283
Adjustment for change in reserve for unexpired risks 2,006,138 2,358,761 1,440,035 1,681,333
Total Premium Earned (Net) 2,812,230 10,179,295 1,732,710 6,753,950
All premium written, less reinsurance, is from business in India.
SCHEDULES FORMING PART OF FINANCIAL STATEMENTS
Page: 4

FORM NL-5 - CLAIMS SCHEDULECLAIMS INCURRED [NET]MISCELLANEOUS BUSINESS
(Rs. in ’000)
Particulars
For the Quarter
ended 31.Mar.15
For the Year
ended
31.Mar.15
For the Quarter
ended 31.Mar.14
For the Year
ended
31.Mar.14
CLAIMS PAID
Direct 2,085,029 7,443,345 1,493,288 5,836,419
Add :Re-insurance accepted 331 666 (9,946) 161,846
Less :Re-insurance Ceded 475,892 1,173,956 586,328 1,651,703
NET CLAIMS PAID 1,609,468 6,270,055 897,014 4,346,562
Add Claims Outstanding at the end of the year 1,241,332 1,241,332 1,000,796 1,000,796
Less Claims Outstanding at the beginning 1,134,326 1,000,796 699,760 807,902
TOTAL CLAIMS PAID 1,716,474 6,510,591 1,198,050 4,539,456
All claims paid, less reinsurance, are to claimants in India.
SCHEDULES FORMING PART OF FINANCIAL STATEMENTS
Page: 5

FORM NL-6-COMMISSION SCHEDULECOMMISSION
MISCELLANEOUS BUSINESS(Rs. in ’000)
Particulars
For the Quarter
ended 31.Mar.15
For the Year
ended
31.Mar.15
For the Quarter
ended 31.Mar.14
For the Year
ended
31.Mar.14
Direct 565,343 1,549,405 385,211 1,103,112
Add: Re-insurance Accepted 365 968 1,383 5,711
Less: Commission on Re-insurance Ceded 208,402 540,251 320,236 742,221
Net Commission 357,306 1,010,122 66,358 366,602
Break-up of the expenses (Gross) incurred to procure Business :
Agents 552,232 1,495,505 371,996 1,056,467
Brokers 12,220 50,311 12,664 45,729
Corporate Agency 891 3,589 551 916
Referral - - - -
Others - - - -
TOTAL 565,343 1,549,405 385,211 1,103,112
Page: 6

FORM NL-7-OPERATING EXPENSES SCHEDULEOPERATING EXPENSES RELATED TO INSURANCE BUSINESS
(Rs. in ’000)
S.No: Particulars
For the Quarter
ended 31.Mar.15
For the Year ended
31.Mar.15
For the Quarter
ended 31.Mar.14
For the Year ended
31.Mar.14
1 Employees’ remuneration & welfare benefits 817,273 2,669,925 598,857 2,068,383
2 Travel, conveyance and vehicle running expenses 15,616 84,092 25,880 76,856
3 Training expenses 7,391 34,078 7,207 28,556
4 Rents, rates & taxes 71,521 244,892 69,211 199,563
5 Repairs & Maintenance 27,295 102,837 (3,646) 63,425
6 Printing & Stationery 43,216 247,021 40,387 198,044
7 Communication 29,395 85,243 28,874 89,234
8 Legal & professional charges 22,935 59,389 (27) 41,124
9 Auditors' fees, expenses etc
(a) as auditor 2,250 2,250 2,250 2,250
(b) as adviser or in any other capacity, in respect of - - - -
(i) Taxation matters 750 750 750 750
(ii) Insurance matters - - - -
(iii) Management services; and - - - -
(c) in any other capacity 180 780 - 500
(d) out of pocket expenses 326 802 461 879
10 Advertisement and publicity 284,775 569,968 52,979 180,745
11 Interest & Bank Charges 4,907 12,110 9,293 11,754
12 Others
- Donation 170 6,119 76 971
- Director's Sitting Fees 250 930 120 360
- Software Expenses 43,630 155,248 42,427 154,668
- Miscellaneous Expenses 31,692 93,878 34,295 99,886
- Amortization Expenses 894 1,139 175 1,263
13 Depreciation 88,171 186,889 25,536 99,435
TOTAL 1,492,635 4,558,341 935,106 3,318,646
SCHEDULES FORMING PART OF FINANCIAL STATEMENTS
page: 7

FORM NL-8-SHARE CAPITAL SCHEDULESHARE CAPITAL
(Rs. in ’000)
Particulars
As on
31.Mar.15
As on
31.Mar.14
1 Authorised Capital 4,500,000 3,500,000
450,000,000 (Previous Yr - 350,000,000) Equity Shares of Rs 10/- each
2 Issued Capital 3,627,324 3,338,605
362,732,365 (Previous Yr - 333,860,522) Equity Shares of Rs10/- each
3 Subscribed Capital 3,627,324 3,338,605
362,732,365 (Previous Yr - 333,860,522) Equity Shares of Rs10/- each
4 Called-up / paid up Capital 3,621,441 3,338,605
362,144,067 (Previous Yr - 333,860,522) Equity Shares of Rs10/- each
(Out of above 32,34,100 (Previous Yr - 32,34,100) equity shares of Rs.10/- each
issued for consideration other than cash.)
Less : Calls unpaid - -
Add : Equity Shares forfeited (Amount originally paid up) - -
Less : Par Value of Equity Shares bought back - -
Less : Preliminary Expenses - -
Expenses including commission or brokerage on - -
Underwriting or subscription of shares - -
TOTAL 3,621,441 3,338,605
SCHEDULES FORMING PART OF FINANCIAL STATEMENTS
Page: 8

FORM NL-9-PATTERN OF SHAREHOLDING SCHEDULESHARE CAPITAL - PATTERN OF SHAREHOLDING [As certified by the Management]
Number of Shares % of Holding Number of Shares % of Holding
Promoters
Indian 269,736,976 74.48% 248,069,372 74.30%
Foreign 92,407,091 25.52% 85,791,150 25.70%
Others - - - -
TOTAL 362,144,067 100% 333,860,522 100%
SCHEDULES FORMING PART OF FINANCIAL STATEMENTS
Shareholder
As on 31.Mar.15 As on 31.Mar.14
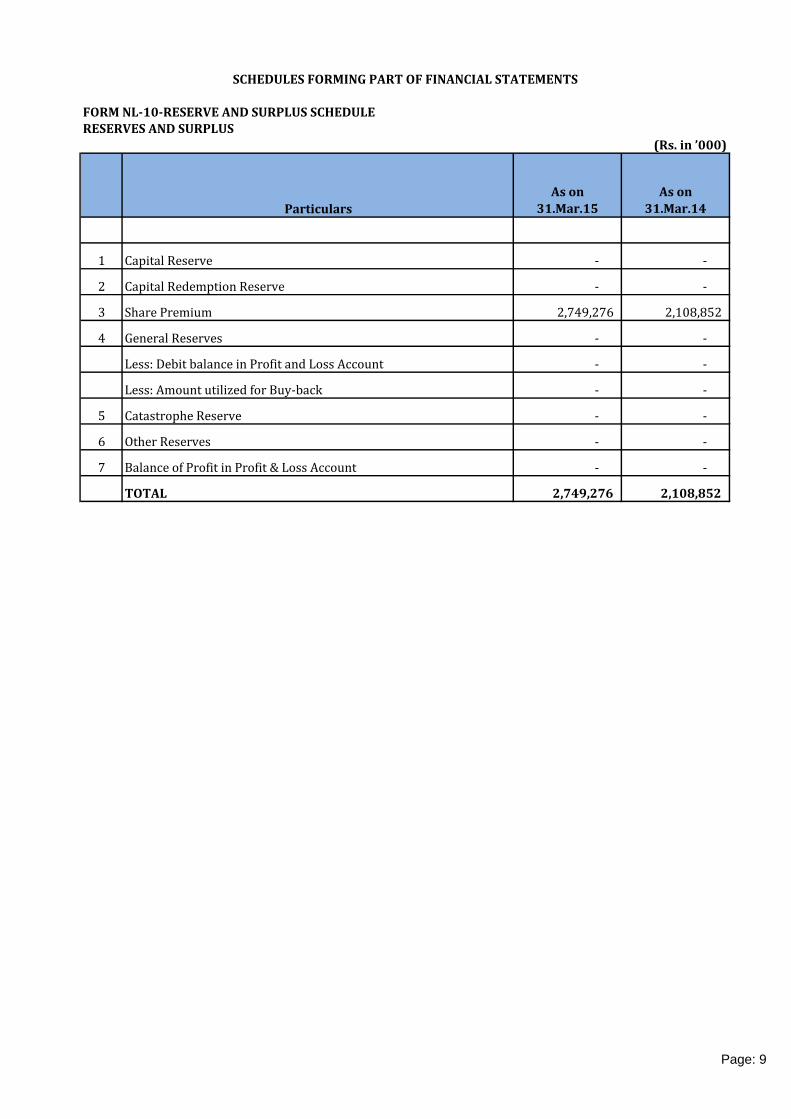
FORM NL-10-RESERVE AND SURPLUS SCHEDULERESERVES AND SURPLUS
(Rs. in ’000)
Particulars
As on
31.Mar.15
As on
31.Mar.14
1 Capital Reserve - -
2 Capital Redemption Reserve - -
3 Share Premium 2,749,276 2,108,852
4 General Reserves - -
Less: Debit balance in Profit and Loss Account - -
Less: Amount utilized for Buy-back - -
5 Catastrophe Reserve - -
6 Other Reserves - -
7 Balance of Profit in Profit & Loss Account - -
TOTAL 2,749,276 2,108,852
SCHEDULES FORMING PART OF FINANCIAL STATEMENTS
Page: 9

FORM NL-11-BORROWINGS SCHEDULEBORROWINGS
(Rs. in ’000)
Particulars
As on
31.Mar.15
As on
31.Mar.14
1 Debentures/ Bonds - -
2 Banks - -
3 Financial Institutions - -
4 Others (to be specified) - -
TOTAL - -
SCHEDULES FORMING PART OF FINANCIAL STATEMENTS
Page: 10

FORM NL-12-INVESTMENT SCHEDULEINVESTMENTS
(Rs. in ’000)
Particulars
As on
31.Mar.15
As on
31.Mar.14
LONG TERM INVESTMENTS
1
Government securities and Government guaranteed bonds including
Treasury Bills * 3,019,736 1,685,541
2 Other Approved Securities - -
3 Other Investments
(a) Shares - -
(aa) Equity - -
(bb) Preference - -
( b) Mutual Funds - -
(c) Derivative Instruments - -
(d) Debentures/ Bonds 951,133 650,137
(e) Other Securities (to be specified) - -
(f) Subsidiaries - -
(g) Investment Properties-Real Estate 81,905 76,926
4 Investments in Infrastructure and Social Sector 865,600 599,861
5 Other than Approved Investments
SHORT TERM INVESTMENTS
6
Government securities and Government guaranteed bonds
including Treasury Bills - 150,597
7 Other Approved Securities - -
8 Other Investments - -
(a) Shares - -
(aa) Equity - -
(bb) Preference - -
(b) Mutual Funds - -
(a) Derivative Instruments - -
(b) Debentures / Bonds - 50,000
(c) Other Securities - -
(d) Subsidiaries - -
(e) Investment Properties-Real Estate - -
9 Investments in Infrastructure and Social Sector 99,998 300,233
10 Other than Approved Investments - -
TOTAL 5,018,372 3,513,295
`
Aggregate Market Value of Quoted Investments other than Equity
Shares 4,999,247 3,364,753
Aggregate Book Value of Quoted Investments other than Equity
Shares 4,936,467 3,436,369
Aggregate Book Value of Un-Quoted Investments 81,905 76,926
Aggregate Market Value of Investment Properties 160,468 421,365
Historical cost of Mutual Funds valued on Fair Value basis - -
SCHEDULES FORMING PART OF FINANCIAL STATEMENTS
Page: 11

FORM NL-13-LOANS SCHEDULELOANS
(Rs. in ’000)
Particulars
As on
31.Mar.15
As on
31.Mar.14
1 SECURITY-WISE CLASSIFICATION
Secured
(a) On mortgage of property - -
(aa) In India - -
(bb) Outside India - -
(b) On Shares, Bonds, Govt. Securities - -
(c) Others (to be specified) - -
Unsecured - -
TOTAL - -
2 BORROWER-WISE CLASSIFICATION
(a) Central and State Governments - -
(b) Banks and Financial Institutions - -
(c) Subsidiaries - -
(d) Industrial Undertakings - -
(e) Others (Inter Corporate Deposit) - -
TOTAL - -
3 PERFORMANCE-WISE CLASSIFICATION
(a) Loans classified as standard - -
(aa) In India - -
(bb) Outside India - -
(b) Non-performing loans less provisions - -
(aa) In India - -
(bb) Outside India - -
TOTAL - -
4 MATURITY-WISE CLASSIFICATION
(a) Short Term - -
(b) Long Term - -
TOTAL - -
SCHEDULES FORMING PART OF FINANCIAL STATEMENTS
Page: 12

FORM NL-14-FIXED ASSETS SCHEDULEFIXED ASSETS
(Rs. in ’000)Particulars
Opening Additions Deductions Closing Upto Last Year For The YearOn Sales /
Adjustments To Date
As at year ended Mar 15
As at year ended Mar 14
1 Goodwill - - - - - - - - - -
2 Intangibles - IT Software 543,030 38,449 - 581,479 465,406 29,236 - 494,642 86,837 77,624
3 Land - Freehold 75,600 - - 75,600 - - - - 75,600 75,600
4 Leasehold Property - - - - - - - - - -
5 Buildings - - - - - - - - - -
6 Furniture & Fittings 135,351 17,020 3,978 148,393 38,279 7,997 3,978 42,308 106,086 97,072
7 Information Technology
Equipment353,759 42,009 - 395,756 167,177 97,814 - 264,981 130,775 186,582
8 Vehicles 17,336 61 944 16,452 5,707 2,816 433 8,089 8,363 11,629
9 Office Equipment 108,704 13,706 - 122,410 21,831 48,810 - 70,641 51,769 86,872
10 Others - - - -
Temporary Construction - 2,567 - 2,567 - 216 - 216 2,350 -
Total 1,233,780 113,812 4,922 1,342,658 698,400 186,889 4,411 880,878 461,780 535,379
Capital work in progress 63,297 59,576 - 122,873 - - - - 122,873 63,297
Grand Total 1,297,077 173,389 4,922 1,465,531 698,400 186,889 4,411 880,878 584,654 598,676
Previous Year 1,131,075 172,135 6,133 1,297,077 600,240 99,435 1,275 698,400 - -
Cost/ Gross Block Net BlockDepreciation
SCHEDULES FORMING PART OF FINANCIAL STATEMENTS
Page: 13

FORM NL-15-CASH AND BANK BALANCE SCHEDULECASH AND BANK BALANCES
(Rs. in ’000)
Particulars
As on
31.Mar.15
As on
31.Mar.14
1 Cash (including cheques, drafts and stamps) 371,559 388,559
2 Bank Balances
(a) Deposit Accounts
(aa) Short-term (due within 12 months) 1,702,626 1,403,145
(bb) Others 771,000 185,500
(b) Current Accounts 432,732 177,834
(c) Others (to be specified) - -
3 Money at Call and Short Notice
(a) With Banks - -
(b) With other Institutions - -
4 Others (Remittance in Transit) - -
TOTAL 3,277,917 2,155,038
SCHEDULES FORMING PART OF FINANCIAL STATEMENTS
Page: 14

FORM NL-16-ADVANCES AND OTHER ASSETS SCHEDULE ADVANCES AND OTHER ASSETS
(Rs. in ’000)
Particulars
As on 31.Mar.15
As on 31.Mar.14
A ADVANCES
1 Reserve deposits with ceding companies - -
2 Application money for investments - -
3 Prepayments 50,523 84,594
4 Advances to Directors/Officers - -
5
Advance tax paid and taxes deducted at source (Net of Provisions for Tax amounting Rs.64,411; Previuos year 64,411) 49,222 49,222
6 Others
- Travel Advance 421 1,011
- Rental Advance 125,259 110,617
- Telephone Deposit 326 300
- Staff Advance 38,947 45,266
- Other Advances 50,309 166,519
- Security Deposits 13,724 11,235
TOTAL (A) 328,731 468,764
B OTHER ASSETS
1 Income accrued on investments 234,007 126,676
2 Outstanding Premiums 351,155 196,458
3 Agents’ Balances - -
4 Foreign Agencies Balances - -
5
Due from other entities carrying on insurance business (including reinsurers) 295,046 655,792
6 Due from subsidiaries/ holding - -
7 Deposit with RBI - -
[Pursuant to section 7 of Insurance Act, 1938] - -
8 Others - -
- Amounts Recoverable under Contractual Obligations 830,089 830,104
- Service Tax 37,857 33,034
TOTAL (B) 1,748,154 1,842,064
TOTAL (A+B) 2,076,885 2,310,828
SCHEDULES FORMING PART OF FINANCIAL STATEMENTS
Page: 15

FORM NL-17-CURRENT LIABILITIES SCHEDULECURRENT LIABILITIES
(Rs. in ’000)
Particulars
As on
31.Mar.15
As on
31.Mar.14
1 Agents’ Balances 141,739 86,747
2 Balances due to other insurance companies 1,048 9,402
3 Deposits held on re-insurance ceded - -
4 Premiums received in advance 119,237 56,780
5 Unallocated Premium 117,901 66,726
6 Sundry creditors 452,860 333,602
7 Due to subsidiaries/ holding company
8 Claims Outstanding 1,241,332 1,000,796
9 Due to Officers/ Directors
Sweat Equity Shares Pending Allotment 12,646 -
10 Unclaimed Amount of policyholders 10,455 25,299
11 Others - -
TOTAL 2,097,218 1,579,352
SCHEDULES FORMING PART OF FINANCIAL STATEMENTS
Page: 16

FORM NL-18-PROVISIONS SCHEDULEPROVISIONS
(Rs. in ’000)
Particulars
As on
31.Mar.15
As on
31.Mar.14
1 Reserve for Unexpired Risk 7,439,980 5,081,220
2
For taxation (less advance tax paid and taxes
deducted at source NIL ; Previous year NIL) - -
3 For proposed dividends - -
4 For dividend distribution tax - -
5 Others - Provision for Gratuity 2,102 21,488
TOTAL 7,442,082 5,102,708
SCHEDULES FORMING PART OF FINANCIAL STATEMENTS
Page: 17

FORM NL-19 MISC EXPENDITURE SCHEDULEMISCELLANEOUS EXPENDITURE(To the extent not written off or adjusted)
(Rs. in ’000)
Particulars
As on
31.Mar.15
As on
31.Mar.14
1
Discount Allowed in issue of shares/
debentures - -
2 Others - -
TOTAL - -
SCHEDULES FORMING PART OF FINANCIAL STATEMENTS
Page: 18

FORM NL-21
31st March 2015 31st March 2014
(Rs.’000) (Rs.’000)
Cash flows from operating activitiesPremium received from policyholders, including
advance receipts 14,639,903 11,149,306
Other receipts - 161,606
Payments to the re-insurers, net of commissions
and claims (91,157) (232,277)
Payments to co-insurers, net of claims recovery - -
Payments of claims (7,431,510) (5,986,634)
Payments of commission and brokerage (1,488,915) (1,079,187)
Payments of other operating expenses (4,241,036) (3,245,429)
Preliminary and pre-operative expenses - -
Deposits, advances and staff loans 105,977 21,541
Income taxes paid (Net) - -
Service tax paid (18,900) (19,725)
Other payments - -
Cash flows before extraordinary items 1,474,362 769,200
Cash flow from extraordinary operations - -
Net cash flow from operating activities 1,474,362 769,200
Cash flows from investing activitiesPurchase of fixed assets (173,388) (172,135)
Proceeds from sale of fixed assets 300 87
Purchases of investments (3,959,304) (5,644,135)
Loans disbursed - -
Sales of investments 1,586,421 4,775,416
Repayments received - -
Rents/Interests/Dividends received 386,492 340,861
Investments in money market instruments and in
liquid mutual funds (Net) - -
Expenses related to investments (242) (220)
Net cash flow from investing activities (2,159,723) (700,126)
Cash flows from financing activitiesProceeds from issuance of share capital 923,259 94,808
Proceeds from borrowing - -
Repayments of borrowing - -
Interest/dividends paid - -
Net cash flow from financing activities 923,259 94,808
Effect of Foreign exchange rates on Cash and
Cash Equivalents, net - -
Net increase/ (decrease) in cash and cash
equivalents: 237,898 163,882
Cash and Cash equivalents at the beginning of the
year 566,393 402,511
Cash and cash equivalents at the end of the year * 804,291 566,393
RECEIPTS AND PAYMENTS ACCOUNT FOR THE YEAR ENDED 31st MARCH 2015
PARTICULARS
Note * Fixed Deposit of Rs.2,473,626 thousands (Previous year- Rs.1,588,645 thousands)
shown under schedule 11 of financial statements considered under investing activities.

NL-22-Geog Dist Bsns IRDA Periodic Disclosures
FORM NL-22
Insurer: Date: 31-Mar-15
GROSS DIRECT PREMIUM UNDERWRITTEN FOR THE QUARTER: JAN TO MAR '15
Rs.In Lakhs
For The
Qtr
Upto The
Qtr
For The
Qtr
Upto The
Qtr
For The
Qtr
Upto The
Qtr
For The
Qtr Upto The Qtr
Andhra Pradesh 18 48 843 2,888 9 46 870 2,981
Arunachal Pradesh - - - - - - - -
Assam 3 6 123 340 0 1 126 347
Bihar 1 3 142 341 0 1 144 344
Chattisgarh 3 7 199 502 0 1 202 510
Goa - - - - - - - -
Gujarath 43 201 1637 5,268 22 100 1,702 5,569
Haryana 9 37 1100 3,079 4 21 1,112 3,137
Himachal Pradesh 0 0 18 43 0 1 18 44
Jammu & Kashmir 2 5 129 339 1 5 132 349
Jharkand 1 11 759 3,325 1 3 762 3,339
Karnataka 130 435 5009 14,921 17 90 5,156 15,445
Kerala 49 145 5931 16,625 9 48 5,989 16,817
Madhya Pradesh 23 76 1599 4,098 7 22 1,629 4,196
Maharashtra 203 756 12922 34,101 36 178 13,161 35,035
Manipur - - - - - - - -
Meghalaya - - - - - - - -
Mizoram - - - - - - - -
Nagaland - - - - - - - -
Orissa 12 28 611 1,525 1 4 623 1,558
Punjab 31 94 756 1,984 20 89 808 2,166
Rajasthan 31 97 1077 2,699 4 22 1,112 2,818
Sikkim - - - - - - - -
Tamil Nadu 266 982 8339 22,940 15 159 8,620 24,081
Telangana 23 72 1877 4,912 16 79 1,917 5,063
Tripura - - - - - - - -
Uttar Pradesh 17 82 2264 6,107 6 37 2,287 6,225
Uttarkhand 7 40 598 1,562 3 12 607 1,613
West Bengal 30 81 2458 6,804 4 17 2,492 6,902
Andaman & Nicobar Is. - - - - - - - -
Chandigarh 2 6 192 490 3 19 198 516
Dadra & Nagra Haveli - - - - - - - -
Daman & Diu - - - - - - - -
Delhi 12 46 2366 7,253 12 62 2,390 7,362
Lakshadweep - - - - - - - -
Puducherry 4 13 188 484 2 6 194 503
TOTAL--------------------------> 922 3,269 51,137 142,628 192 1,022 52,250 146,919
PERIODIC DISCLOSURES
STAR HEALTH AND ALLIED INSURANCE CO LTD
STATESPersonal Accident Health Insurance
Overseas Medical
Insurance Grand Total
Page 21 of 38

NL-23-Risk RI Conc IRDA Periodic Disclosures
FORM NL-23 Reinsurance Risk Concentration
Insurer: STAR HEALTH AND ALLIED INSURANCE CO LTD Date: 31-Mar-15
Rs.In Lakhs
Proportional Non-Proportional Facultative
1 No. of Reinsurers with rating of AAA and above Nil - - - -
2 No. of Reinsurers with rating AA but less than AAA Nil - - - -
3 No. of Reinsurers with rating A but less than AA Nil - - - -
4 No. of Reinsurers with rating BBB but less than A 1 (GIC -Re) 21,578 - - 100%
5 No. of Reinsurres with rating less than BBB Nil - -
6 Total 1 - - 100%
PERIODIC DISCLOSURES
Reinsurance Risk Concentration
No. of reinsurers
Premium ceded to reinsurersPremium ceded to reinsurers / Total
reinsurance premium ceded (%)
Reinsurance PlacementsS.No.
Page 22 of 38

NL-24-Age Clm IRDA Periodic Disclosures
FORM NL-24 Ageing of Claims
Insurer: Date: 31-Mar-15
Rs. In Lakhs
Line of BusinessTotal No. of
claims paid
Total amount of
claims paid
1 month 1 - 3 months 3 - 6 months 6 months - 1 year > 1 year (for the Qtr)
1 Fire - - - - - - -
2 Marine Cargo - - - - - - -
3 Marine Hull - - - - - - -
4 Engineering - - - - - - -
5 Motor OD - - - - - - -
6 Motor TP - - - - - - -
7 Health 69,385 837 99 6 1 70,328 20,364
8 Overseas Travel 13 25 21 10 5 74 173
9 Personal Accident 363 3 - - - 366 314
PERIODIC DISCLOSURES
Ageing of Claims
Sl.No.
No. of claims paid
Star Health and Allied Insurance Co Ltd
Page 23 of 38

NL-25-Clm Data IRDA Periodic Disclosures
FORM NL-25 : Quarterly claims data for Non-Life
Insurer: Star Health and Allied Insurance Co Ltd Date: 31-Mar-15
No. of claims only
Sl. No. Claims Experience HealthOverseas
Travel
Personal
AccidentTotal
1 Claims O/S at the beginning of the period 34249 267 390 349062 Claims reported during the period 92793 138 742 936733 Claims Settled during the period 70328 74 366 707684 Claims Repudiated during the period 9616 37 86 97395 Claims closed during the period 13939 48 226 142136 Claims O/S at End of the period 33159 246 454 33859
Less than 3months 30962 128 399 314893 months to 6 months 1519 38 42 15996months to 1 year 424 54 7 4851year and above 254 26 6 286
PERIODIC DISCLOSURES
Page 24 of 38

FORM NL-27 Offices Information For Non-Life
Insurer: Date: 31-Mar-15
Sl. No.12
3
Out of approvals of
previous year
4
Out of approvals of
this year
56789
PERIODIC DISCLOSURES
STAR HEALTH AND ALLIED INSURANCE CO LTD
Office Information NumberNo. of offices at the beginning of the Quarter 286No. of branches approved during the year 23
No. of branches opened during the
Quarter
0
4
No. of branches closed during the Quarter 0
No. of urban branches 290
No of branches at the end of the Quarter 290No. of branches approved but not opened 4No. of rural branches 0

FORM NL-28-STATEMENT OF ASSETS - 3B
Company Name & Code: Star Health And Allied Insurance Co Ltd / 129
Statement as on: 31.Mar.2015
Statement of Investment Assets (General Insurer, Re-insurers)
(Business within India) Rs.In Lakhs
Periodicity of Submission: Quarterly
No PARTICULARS SCH AMOUNT
1 Investments 8 50,183.72
2 Loans 9 -
3 Fixed Assets 10 5,846.54
4 Current Assets
a. Cash & Bank Balance 11 32,779.17
b. Advances & Other Assets 12 20,768.83
5 Current Liabilities
a. Current Liabilities 13 20,972.18
b. Provisions 14 74,420.82
c. Misc. Exp not Written Off 15 -
d. Debit Balance of P&L A/c 49,521.90
Application of Funds as per Balance Sheet (A) 254,493.16
Less: Other Assets SCH Amount
1 Loans (if any) 9 -
2 Fixed Assets (if any) 10 5,846.54
3 Cash & Bank Balance (if any) 11 8,042.91
4 Advances & Other Assets (if any) 12 20,768.83
5 Current Liabilities 13 20,972.18
6 Provisions 14 74,420.82
7 Misc. Exp not Written Off 15 -
8 Debit Balance of P&L A/c 49,521.90
TOTAL (B) 179,573.18
'Investment Assets' As per FORM 3B (A-B) 74,919.98
Balance FRSM+
(a) (b) (c) d = (b+c) (e) (d + e)
1 G. Sec.Not less
than 20%5,435.52 24,761.83 30,197.36 40.31 30,197.36 30,540.49
2 G. Sec or Other Apporved Sec. (incl. (1) above)Not less
than 30%5,435.52 24,761.83 30,197.36 40.31 30,197.36 30,540.49
3 Investment subject to Exposure Norms
1. 'Housing & Loans to SG for Housing and FFE,
Infrastructure Investments
Not less
than 15%3,234.12 14,733.20 17,967.32 23.98 17,967.32 18,171.02
2. Approved Investments 4,815.96 21,939.35 26,755.31 35.71 26,755.31 30,278.09
3. Other Investments (not exceeding 25%) - - - - -
Total Investment Assets 100% 13,485.60 61,434.38 74,919.98 100.00 74,919.98 78,989.59
Book Value (SH
+ PH) % Actual
FVC
AmountTotal Market
Value
Not
exceeding
55%
No 'Investment' represented as Reg. %
SHPH

NL-29-Debt Sec IRDA Periodic DisclosuresFORM NL-29 Details Regarding Debt Securities
Insurer: Date: 31-Mar-15
Rs.In Lakhs
As at 31.Mar.15
As % of total for this class
As at 31.Mar.14
As % of total for this class
As at 31.Mar.15
As % of total for this class
As at 31.Mar.14
As % of total for this class
Break down by credit ratingAAA rated 19,451.98 38.91 15,895.60 47.24 19,167.32 38.83 16,002.33 46.57AA or better - - - - - - - - Rated below AA but above A - - - - - - - - Rated below A but above B - - - - - - - - Any other 30,540.49 61.09 17,751.05 52.76 30,197.36 61.17 18,361.38 53.43
49,992.47 100.00 33,646.65 100.00 49,364.67 100.00 34,363.71 100.00 BREAKDOWN BY RESIDUALMATURITYUp to 1 year 2,989.10 5.98 4,980.90 14.80 3,000.36 6.08 5,008.32 14.57
More than 1 year and upto 3 years 8,012.64 16.03 7,863.45 23.37 7,997.59 16.20 7,974.11 23.21
More than 3years and up to 7years 10,357.38 20.72 8,179.94 24.31 10,328.05 20.92 8,290.73 24.13
More than 7 years and up to 10 years 16,528.50 33.06 7,571.75 22.50 16,106.75 32.63 7,841.38 22.82
above 10 years 12,104.85 24.21 5,050.61 15.01 11,931.93 24.17 5,249.17 15.28 49,992.47 100.00 33,646.65 100.00 49,364.67 100.00 34,363.71 100.00
Breakdown by type of the issurer
a. Central Government 30,540.49 61.09 17,751.05 52.76 30,197.36 61.17 18,361.38 53.43b. State Government - - - - - - - - c. Corporate Bonds - - 15,399.40 45.77 - - 15,502.33 45.11d. Deposits with Banks - - - - - - - - e. Mutual Funds - - - - - - - - e. Others 19,451.98 38.91 496.20 1.47 19,167.32 38.83 500.00 1.46
49,992.47 100.00 33,646.65 100.00 49,364.67 100.00 34,363.71 100.00
PERIODIC DISCLOSURES
Detail Regarding debt securities
MARKET VALUE BOOK VALUE
STAR HEALTH AND ALLIED INSURANCE CO LTD
Page 27 of 38

NL-30-Ana Rat IRDA Periodic Disclosures
FORM NL-30 Analytical Ratios
Insurer: Star Health And Allied Insurance Co Ltd Date: 31-Mar-15
Sl.No. Particular Upto The QuarterUpto The Quarter Of The
Prceeding Year1 Gross Premium Growth Rate 35% 27%2 Gross Premium to shareholders' fund ratio 10.36 5.763 Growth rate of shareholders'fund -25% -31%4 Net Retention Ratio 85% 75%5 Net Commission Ratio 8% 4%
6Expense of Management to Gross Direct Premium
Ratio0.42 0.41
7 Combined Ratio 0.92 0.948 Technical Reserves to net premium ratio 0.69 0.729 Underwriting balance ratio -15% -16%
10 Operationg Profit Ratio -0.11 -0.1111 Liquid Assets to liabilities ratio 0.39 0.4412 Net earning ratio -0.11 -0.1113 Return on net worth ratio -0.99 -0.49
14Available Solvency Margin Ratio to Required
Solvency Margin Ratio2.40 1.50
15 NPA RatioGross NPA Ratio 0.00 0.00
Net NPA Ratio 0.00 0.00
1 (a) No. of shares 362,144,067 333,860,522
2 (b) Percentage of shareholding (Indian / Foreign) 25.52% / 74.48% 25.70% / 75.30%
3( c) %of Government holding (in case of public sector
insurance companies) - -
4(a) Basic and diluted EPS before extraordinary items (net
of tax expense) for the period (not to be annualized)(4.13) (2.82)
5(b) Basic and diluted EPS after extraordinary items (net
of tax expense) for the period (not to be annualized)(4.13) (2.82)
6 (iv) Book value per share (Rs) 3.92 5.68
PERIODIC DISCLOSURES
Analytical Ratios for Non-Life companies
Equity Holding Pattern for Non-Life Insurers
Page 28 of 38

NL-31-Rel Par IRDA Periodic Disclosures
FORM NL-31 : Related Party Transactions
Insurer: Date: 31-Mar-15Rs In Lakhs
For the quarter
(Jan - Mar 15)
up to the
period ended
Mar 15
Correspodning
quarter of the
preceeding year
(Jan - Mar 14)
up to the
period of the
prceeding year
ended Mar 14
1 Mr.V.Jagannathan Chairman cum MD
Managerial
Remuneration 26.20 104.21 49.69 128.832 Mr.V.Jagannathan Chairman cum MD Share Capital 63.03 63.03 13.01 13.01
3 Mrs.Vasanthi Jagannathan
Spouse of Chairman
cum MD Share Capital 90.91 90.91 - -
*including the premium flow through Assocaites/ Group companies as an agent
PERIODIC DISCLOSURES
Related Party Transactions
Sl.No. Name of the Related Party
Nature of
Relationship with the
Company
Description of
Transactions /
Categories
Consideration paid / received*
Star Health and Allied Insurance Co Ltd
Page 29 of 38

NL-32-Prod IRDA Periodic Disclosures
FORM NL-32
Insurer: Star Health and Allied Insurance Ltd Date: 31-Mar-15
List below the products and/or add-ons introduced during the period
Sl. No. Name of Product Co. Ref. No. IRDA Ref.no. Class of
Business*
Category
of product
Date of filing
of Product
Date IRDA
confirmed filing
/ approval
NIL
PERIODIC DISCLOSURES Products Information
Products Information
Page 30 of 38

NL-34-BOD IRDA Periodic Disclosures
FORM NL-34
Insurer: Date: 31-Mar-15
Sl. No. Name of person Role/designation
1 Mr.V Jagannathan Chairman and Managing Director2 Mr. Essa Abdullah Al Ghurair Director3 Mr.D.R.Karthikeyan Director
4 Mr.D.C.Gupta Director5 Dr.M.Y Khan Director
6 Mr.V P Nagarajan Director
7 Mr. Patrick Claude Franklin Choffel Director
8 Ms. Vishaka Mulye Nominee Director9 Mr.Gautam Mago Nominee Director
10 Mr. Akhil Awasthi Nominee Director
11 Mr.S.Sundaresan Executive Director - Designated12 Mr.V.Jayaprakash Executive Director - Designated
13 Dr.S.Prakash Executive Director-Medical- Designated
14 Mr.Ramaswamy .S Chief Financial Officer
15 Mr.Kannan Unni .C.M Senior Vice President - Company Secretary16 Mr.Kumar .K.C Senior Vice President - HR & Admin17 Mr.Mallesh .A.M Senior Vice President - Marketing
18 Mr.Anand Roy Senior Vice President - Marketing
19 Dr. Harikrishnan Senior Vice President - Marketing20 Mr.Vishwajeet Mohnot Vice President - Marketing
21 Mr.S.Kannan Vice President - IT
22 Mr.Srinivasan .H Vice President - Technical23 Ms.Rama .D Vice President - Products24 Mr. N.Jayaraman Chief Investment Officer
25 Mr.S.Surenther Chief of Internal Audit
STAR HEALTH AND ALLIED INSURANCE CO LTD
PERIODIC DISCLOSURES: Board of Directors & Key Persons
BOD and Key Person informationDetails of change in the
Page 31 of 38

FORM NL-35-NON PERFORMING ASSETS-7A
Company Name & Code: Star Health and Allied Insurance Co Ltd / 129
Statement as on : 31.Mar.15
Details of Investment Portfolio
Periodicity of Submission : Quarterly Rs.In Lakhs
%Has there been
revision?Amount
Board
Approval Ref
NIL
ClassificationProvision
(%)Provision (Rs)
Name of the Fund
Principal
Due from
Interest
Due from
Deferred
Principal
Deferred
Interest
Rolled
Over?
Has there been any Principal
Waiver?COI
Company
Name
Instrument
Type
Interest RateTotal O/s
(Book Value)
Default
Principal
(Book Value)
Default
Interest
(Book Value)

Income On
Investmen
t (Rs.)
Gross
Yield (%)
Net Yield
(%)
Income On
Investmen
t (Rs.)
Gross
Yield (%)
1 CGSB 5.30 2.26 2.26 16.27 9.08
2 CSPD 0.00 0.00 0.00 0.00 0.00
3 CDSS 0.61 2.34 2.34 1.89 8.18
4 CTRB 0.00 0.00 0.00 0.00 0.00
5 SGGB 0.00 0.00 0.00 0.00 0.00
6 SGGL 0.00 0.00 0.00 0.00 0.00
7 SGOA 0.00 0.00 0.00 0.00 0.00
8 SGGE 0.00 0.00 0.00 0.00 0.00
9 CGSL 0.00 0.00 0.00 0.00 0.00
10 HLSH 0.00 0.00 0.00 0.00 0.00
11 HLSF 0.00 0.00 0.00 0.00 0.00
12 HTLH 0.00 0.00 0.00 0.00 0.00
13 HTLN 0.00 0.00 0.00 0.00 0.00
14 HTHD 0.00 0.00 0.00 0.00 0.00
15 HTDN 1.78 2.26 2.26 6.43 9.25
16 HTDA 0.00 0.00 0.00 0.00 0.00
17 HFHD 0.00 0.00 0.00 0.00 0.00
18 HFDN 0.00 0.00 0.00 0.00 0.00
19 HFDA 0.00 0.00 0.00 0.00 0.00
20 HMBS 0.00 0.00 0.00 0.00 0.00
21 HDPG 0.00 0.00 0.00 0.00 0.00
22 HODS 0.00 0.00 0.00 0.00 0.00
23 HOMB 0.00 0.00 0.00 0.00 0.00
24 HOPG 0.00 0.00 0.00 0.00 0.00
25 ISAS 0.00 0.00 0.00 0.00 0.00
26 IDDF 0.00 0.00 0.00 0.00 0.00
27 ITPE 0.00 0.00 0.00 0.00 0.00
28 ITCE 0.00 0.00 0.00 0.00 0.00
29 IPTD 2.05 2.26 2.26 7.84 9.11
30 IPCP 0.00 0.00 0.00 0.00 0.00
31 IEPG 0.00 0.00 0.00 0.00 0.00
32 IESA 0.00 0.00 0.00 0.00 0.00
33 ICTD 0.00 0.00 0.00 0.00 0.00
34 IDPG 0.00 0.00 0.00 0.00 0.00
35 ICCP 0.00 0.00 0.00 0.00 0.00
36 ILWC 0.00 0.00 0.00 0.00 0.00
37 IPFD 0.00 0.00 0.00 0.00 0.00
38 ICFD 0.00 0.00 0.00 0.00 0.00
39 IOEQ 0.00 0.00 0.00 0.00 0.00
40 IODS 0.00 0.00 0.00 0.00 0.00
41 IOSA 0.00 0.00 0.00 0.00 0.00
42 IOPE 0.00 0.00 0.00 0.00 0.00
43 IOPD 0.00 0.00 0.00 0.00 0.00
44 EAEQ 0.00 0.00 0.00 0.00 0.00
45 EACE 0.00 0.00 0.00 0.00 0.00
46 EPBT 0.12 2.33 2.33 0.39 7.83
47 EPBF 0.00 0.00 0.00 0.00 0.00
48 EPNQ 0.00 0.00 0.00 0.00 0.00
49 ECIS 0.00 0.00 0.00 0.00 0.00
50 ECOS 0.05 2.42 2.42 0.20 9.80
51 ECDI 0.00 0.00 0.00 0.00 0.00
52 EMUN 0.00 0.00 0.00 0.00 0.00
53 EINP 0.00 0.00 0.00 0.00 0.00
54 ELPL 0.00 0.00 0.00 0.00 0.00
55 ELMI 0.00 0.00 0.00 0.00 0.00
56 ELMO 0.00 0.00 0.00 0.00 0.00
57 ECDB 4.73 2.34 2.34 16.99 9.57
58 EDCD 0.00 0.00 0.00 0.00 0.00
59 ECMR 0.00 0.00 0.00 0.00 0.00
60 ECCR 0.00 0.00 0.00 0.00 0.00
61 EDPD 0.00 0.00 0.00 0.00 0.00
62 ECBO 0.00 0.00 0.00 0.00 0.00
63 ECCP 0.00 0.00 0.00 0.00 0.00
64 ECAM 0.00 0.00 0.00 0.00 0.00
65 EUPD 0.00 0.00 0.00 0.00 0.00
66 EPPD 0.12 2.42 2.42 0.49 9.80
67 EFES 0.00 0.00 0.00 0.00 0.00
68 EUPS 0.00 0.00 0.00 0.00 0.00
69 EEPG 0.00 0.00 0.00 0.00 0.00
70 EPPS 0.00 0.00 0.00 0.00 0.00
71 EDPG 0.00 0.00 0.00 0.00 0.00
72 EFDS 0.00 0.00 0.00 0.00 0.00
73 EGMF 0.11 1.87 1.87 0.18 3.80
74 EMPG 0.00 0.00 0.00 0.00 0.00
75 ENCA 0.00 0.00 0.00 0.00 0.00
76 OBPT 0.02 0.94 0.94 0.05 1.71
77 OBPF 0.00 0.00 0.00 0.00 0.00
78 OESH 0.00 0.00 0.00 0.00 0.00
79 OLDB 0.00 0.00 0.00 0.00 0.00
80 OMUN 0.00 0.00 0.00 0.00 0.00
81 OACP 0.00 0.00 0.00 0.00 0.00
82 OPSH 0.00 0.00 0.00 0.00 0.00
83 OVNF 0.00 0.00 0.00 0.00 0.00
84 OSLU 0.00 0.00 0.00 0.00 0.00
85 OEPU 0.00 0.00 0.00 0.00 0.00
86 OTLW 0.00 0.00 0.00 0.00 0.00
87 OEPG 0.00 0.00 0.00 0.00 0.00
88 ODPG 0.00 0.00 0.00 0.00 0.00
89 OMGS 0.18 1.88 1.88 0.38 6.16
90 OMPG 0.00 0.00 0.00 0.00 0.00
91 OCDI 0.00 0.00 0.00 0.00 0.00
92 OPSA 0.00 0.00 0.00 0.00 0.00
93 OIPI 0.00 0.00 0.00 0.00 0.00
15.07 2.25 2.25 51.11 8.98
0.00 0.00
Total 669.86 569.11 8.98 437.60 37.20 8.50 8.50
INVESTMENT 0.00 0.00 0.00 0.00 0.00
0.00 0.00
SECURITISED ASSETS 0.00 0.00 0.00 0.00 0.00 0.00 0.00
DERIVATIVE 0.00 0.00 0.00 0.00 0.00
3.35 3.35
MUTUAL FUNDS - 0.00 0.00 0.00 0.00 0.00 0.00 0.00
MUTUAL FUNDS - DEBT 9.46 6.22 6.16 4.72 0.16
0.00 0.00
DEBENTURES / BONDS/ 0.00 0.00 0.00 0.00 0.00 0.00 0.00
EQUITY SHARES (INCL. 0.00 0.00 0.00 0.00 0.00
0.00 0.00
TERM LOANS (WITHOUT 0.00 0.00 0.00 0.00 0.00 0.00 0.00
EQUITY SHARES (PSUS & 0.00 0.00 0.00 0.00 0.00
0.00 0.00
SHORT TERM LOANS 0.00 0.00 0.00 0.00 0.00 0.00 0.00
VENTURE FUND / SEBI 0.00 0.00 0.00 0.00 0.00
0.00 0.00
PREFERENCE SHARES 0.00 0.00 0.00 0.00 0.00 0.00 0.00
COMMERCIAL PAPERS 0.00 0.00 0.00 0.00 0.00
0.00 0.00
MUNICIPAL BONDS 0.00 0.00 0.00 0.00 0.00 0.00 0.00
DEBENTURES 0.00 0.00 0.00 0.00 0.00
0.00 0.00
EQUITY SHARES (INCL 0.00 0.00 0.00 0.00 0.00 0.00 0.00
BONDS - PSU - TAX FREE 0.00 0.00 0.00 0.00 0.00
0.00 0.00
BONDS - PSU - TAXABLE 2.51 3.05 1.71 2.25 0.00 0.00 0.00
NET CURRENT ASSETS 0.00 0.00 0.00 0.00 0.00
0.35 0.35
MUTUAL FUNDS - 0.00 0.00 0.00 0.00 0.00 0.00 0.00
MUTUAL FUNDS - GILT / 6.03 4.70 3.80 1.89 0.01
0.00 0.00
FOREIGN DEBT 0.00 0.00 0.00 0.00 0.00 0.00 0.00
CORPORATE 0.00 0.00 0.00 0.00 0.00
0.00 0.00
PERPETUAL NON-CUM. 0.00 0.00 0.00 0.00 0.00 0.00 0.00
EQUITY SHARES (INCL. 0.00 0.00 0.00 0.00 0.00
0.00 0.00
PERPETUAL NON-CUM. 0.00 0.00 0.00 0.00 0.00 0.00 0.00
EQUITY SHARES - 0.00 0.00 0.00 0.00 0.00
0.00 0.00
PERPETUAL DEBT 5.00 5.00 9.80 5.00 0.25 4.91 4.91
PERPETUAL DEBT 0.00 0.00 0.00 0.00 0.00
0.00 0.00
APPLICATION MONEY 0.00 0.00 0.00 0.00 0.00 0.00 0.00
COMMERCIAL PAPERS 0.00 0.00 0.00 0.00 0.00
0.00 0.00
CCIL - CBLO 0.00 0.00 0.00 0.00 0.00 0.00 0.00
DEPOSIT WITH 0.00 0.00 0.00 0.00 0.00
0.00 0.00
DEPOSITS - REPO / 0.00 0.00 0.00 0.00 0.00 0.00 0.00
DEPOSITS - REPO / 0.00 0.00 0.00 0.00 0.00
9.22 9.22
DEPOSITS - CDS WITH 0.00 0.00 0.00 0.00 0.00 0.00 0.00
DEPOSITS - DEPOSIT 202.24 177.60 9.57 117.07 10.79
0.00 0.00
LOANS - SECURED 0.00 0.00 0.00 0.00 0.00 0.00 0.00
LOANS - SECURED 0.00 0.00 0.00 0.00 0.00
0.00 0.00
LOANS - POLICY LOANS 0.00 0.00 0.00 0.00 0.00 0.00 0.00
INVESTMENT 7.70 7.69 0.00 6.44 0.00
0.00 0.00
MUNICIPAL BONDS 0.00 0.00 0.00 0.00 0.00 0.00 0.00
CORPORATE 0.00 0.00 0.00 0.00 0.00
0.00 0.00
CORPORATE 2.00 2.00 9.80 2.00 0.04 1.99 1.99
CORPORATE 0.00 0.00 0.00 0.00 0.00
0.00 0.00
CORPORATE 0.00 0.00 0.00 0.00 0.00 0.00 0.00
CORPORATE 0.00 0.00 0.00 0.00 0.00
0.00 0.00
CORPORATE 5.00 5.00 7.83 0.00 0.00 0.00 0.00
CORPORATE 0.00 0.00 0.00 0.00 0.00
0.00 0.00
PSU - EQUITY SHARES - 0.00 0.00 0.00 0.00 0.00 0.00 0.00
INFRASTRUCTURE - 0.00 0.00 0.00 0.00 0.00
0.00 0.00
INFRASTRUCTURE - 0.00 0.00 0.00 0.00 0.00 0.00 0.00
INFRASTRUCTURE - 0.00 0.00 0.00 0.00 0.00
0.00 0.00
INFRASTRUCTURE - 0.00 0.00 0.00 0.00 0.00 0.00 0.00
INFRASTRUCTURE - 0.00 0.00 0.00 0.00 0.00
0.00 0.00
INFRASTRUCTURE - 0.00 0.00 0.00 0.00 0.00 0.00 0.00
INFRASTRUCTURE - PSU 0.00 0.00 0.00 0.00 0.00
0.00 0.00
INFRASTRUCTURE - 0.00 0.00 0.00 0.00 0.00 0.00 0.00
INFRASTRUCTURE - 0.00 0.00 0.00 0.00 0.00
0.00 0.00
INFRASTRUCTURE - 0.00 0.00 0.00 0.00 0.00 0.00 0.00
INFRASTRUCTURE - 0.00 0.00 0.00 0.00 0.00
0.00 0.00
INFRASTRUCTURE - 0.00 0.00 0.00 0.00 0.00 0.00 0.00
INFRASTRUCTURE - 0.00 0.00 0.00 0.00 0.00
8.74 8.74
INFRASTRUCTURE - PSU 0.00 0.00 0.00 0.00 0.00 0.00 0.00
INFRASTRUCTURE - PSU 90.55 86.03 9.11 72.75 6.36
0.00 0.00
INFRASTRUCTURE - 0.00 0.00 0.00 0.00 0.00 0.00 0.00
INFRASTRUCTURE - PSU 0.00 0.00 0.00 0.00 0.00
0.00 0.00
INFRASTRUCTURE - 0.00 0.00 0.00 0.00 0.00 0.00 0.00
INFRASTRUCTURE - 0.00 0.00 0.00 0.00 0.00
0.00 0.00
DEBENTURES / BONDS / 0.00 0.00 0.00 0.00 0.00 0.00 0.00
HOUSING - SECURITISED 0.00 0.00 0.00 0.00 0.00
0.00 0.00
DEBENTURES / BONDS / 0.00 0.00 0.00 0.00 0.00 0.00 0.00
DEBENTURES / BONDS / 0.00 0.00 0.00 0.00 0.00
0.00 0.00
HOUSING - SECURITISED 0.00 0.00 0.00 5.00 0.40 8.07 8.07
BONDS / DEBENTURES 0.00 0.00 0.00 0.00 0.00
0.00 0.00
BONDS / DEBENTURES 0.00 0.00 0.00 0.00 0.00 0.00 0.00
BONDS / DEBENTURES 0.00 0.00 0.00 0.00 0.00
9.12 9.12
BONDS / DEBENTURES 0.00 0.00 0.00 0.00 0.00 0.00 0.00
BONDS / DEBENTURES 78.83 69.57 9.25 56.97 5.20
0.00 0.00
BONDS / DEBENTURES 0.00 0.00 0.00 0.00 0.00 0.00 0.00
COMMERCIAL PAPERS - 0.00 0.00 0.00 0.00 0.00
0.00 0.00
TERM LOAN - HUDCO / 0.00 0.00 0.00 0.00 0.00 0.00 0.00
LOANS TO STATE 0.00 0.00 0.00 0.00 0.00
0.00 0.00
LOANS TO STATE 0.00 0.00 0.00 0.00 0.00 0.00 0.00
CENTRAL GOVERNMENT 0.00 0.00 0.00 0.00 0.00
0.00 0.00
GUARANTEED EQUITY 0.00 0.00 0.00 0.00 0.00 0.00 0.00
OTHER APPROVED 0.00 0.00 0.00 0.00 0.00
0.00 0.00
STATE GOVERNMENT 0.00 0.00 0.00 0.00 0.00 0.00 0.00
STATE GOVERNMENT 0.00 0.00 0.00 0.00 0.00
7.58 7.58
TREASURY BILLS 0.00 0.00 0.00 0.00 0.00 0.00 0.00
DEPOSIT UNDER 26.01 23.10 8.18 16.04 1.22
8.67
SPECIAL DEPOSITS 0.00 0.00 0.00 0.00 0.00 0.00 0.00
Income On Investment (Rs.) Gross Yield (%) Net Yield (%)
CENTRAL GOVERNMENT 234.53 179.14 9.08 147.47 12.78 8.67
No Category of Investment Category
Code
Current Quarter Year to Date (current year) Year to Date (previous year)
Investment (Rs.) Investment (Rs.) Net Yield (%) Investment (Rs.)
Statement of Investment and Income on Investment Name of Fund : GENERAL INSURANCE
Registration Number : 129
Periodicity of Submission : Quarterly Rs. Crores
Statement as on : 31-03-2015
Name of the Insurer : STAR HEALTH AND ALLIED INSURANCE CO. LTD.
FORM 1(Read with Regulation 10)

FORM NL-37-DOWN GRADING OF INVESTMENT-2
Company Name & Code: Star Health And Allied Insurance Co Ltd / 129
Statement as on: 31.Mar.2015 Name of Fund
Statement of Down Graded Investments
Periodicity of Submission: Quarterly
Rs.In Lakhs
No Name of the Security COI AmountDate of
PurchaseRating Agency
Original
Grade
Current
Grade
Date of
DowngradeRemarks
A. During the Quarter ¹
NIL
B. As on Date ²

FORM NL-38 Quarterly Business Returns Across Line Of Business
Insurer: Star Health And Allied Insurance Co Ltd Date: 31-Mar-15
Rs.In Lakhs
Premium No. of Policies Premium No. of Policies Premium No. of Policies Premium No. of Policies
1 Fire NA NA NA NA NA NA NA NA2 Cargo & Hull NA NA NA NA NA NA NA NA3 Motor TP NA NA NA NA NA NA NA NA4 Motor OD NA NA NA NA NA NA NA NA5 Engineering NA NA NA NA NA NA NA NA6 Workmen's Compensation NA NA NA NA NA NA NA NA7 Employer's Liability NA NA NA NA NA NA NA NA8 Aviation NA NA NA NA NA NA NA NA9 Personal Accident 922 67,202 718 46,801 3,269 200,291 2,331 150,390
10 Health 51,137 549,984 34,876 445,194 142,628 1,634,138 105,623 1,336,745 11 Others* (OMP) 192 6,932 169 6,004 1,022 32,236 1,154 35,082
Note:1. Premium stands for amount of premium2. The line of business which are not applicable for any company should be filled up with NA. Figure '0' in those fields will imply no business in the segment.*any other segment contributing more than 5% of the total premium needs to be shown separately
Same Period Of The Previos Year
PERIODIC DISCLOSURES
Quarterly Business Returns Across Line Of Business
S No. Line of Business
Current Quarter (Jan to Mar 15) Same Quarter Previous Year Upto The Period Ended Mar 15

FORM NL-39 Rural & Social Obligations (Quarterly Returns)
Insurer: Star Health And Allied Insurance Co Ltd Date: 31-Mar-15
Rs In Lakhs
Sl.No. Line of Business Particular No. of Policies Issued Premium Collected Sum Assured
Rural NA NA NA
Social NA NA NA
Rural NA NA NA
Social NA NA NA
Rural NA NA NA
Social NA NA NA
Rural NA NA NA
Social NA NA NA
Rural NA NA NA
Social NA NA NA
Rural NA NA NA
Social NA NA NA
Rural NA NA NA
Social NA NA NA
Rural NA NA NA
Social NA NA NA
Rural 11,339 131.53 105,648.45
Social 11,725 158.01 140,733.57
Rural 74,877 5,879.39 234,384.40
Social 110,467 10,221.47 393,523.78
Rural 543 18.56 1,082
Social 1,186 34.59 2,697.85
*any other segment contributing more than 5% needs to be shown separately
9 Personal Accident
10 Health
11 Others* (OMP)
6 Workmen's Compensation
7 Employer's Liability
8 Aviation
3 Motor TP
4 Motor OD
5 Engineering
PERIODIC DISCLOSURES
Rural & Social Obligations (Quarterly Returns)
1 Fire
2 Cargo & Hull

FORM NL-40 Business Acquisition Through Different Channels
Insurer: Date: 31-Mar-15
Rs.In Lakhs
1 Individual Agents 466,040 37,921 360,411 25,446 1,360,104 103,556 1,067,546 72,522 2 Corporate Agents-Banks - - - - - - - - 3 Corporate Agents -Others 867 60 617 38 3,914 246 1,504 65 4 Brokers 6,684 1,132 6,989 896 25,728 3,718 23,281 3,439 5 Micro Agents - - - - - - - - 6 Direct Business 150,527 13,138 129,982 9,384 476,919 39,400 429,886 33,082
Total (A) 624,118 52,250 497,999 35,763 1,866,665 146,919 1,522,217 109,108 1 Referral (B) - - - - - - - -
Grand Total (A+B) 624,118 52,250 497,999 35,763 1,866,665 146,919 1,522,217 109,108
Note:1. Premium means amount of premium received from business acquired by the source2. No of Policies stand for no. of policies sold
Same Period Of The Previous Year
No. Of Policies Premium No. Of Policies Premium No. Of Policies Premium No. Of Policies Premium
PERIODIC DISCLOSURES
Business Acquisition Through Different Channels
Channels
Current Quarter (Jan to Mar 15)
Same Quarter Previous Year Upto The Period Ended Mar 15
Star Health And Allied Insurance Co Ltd
S No.
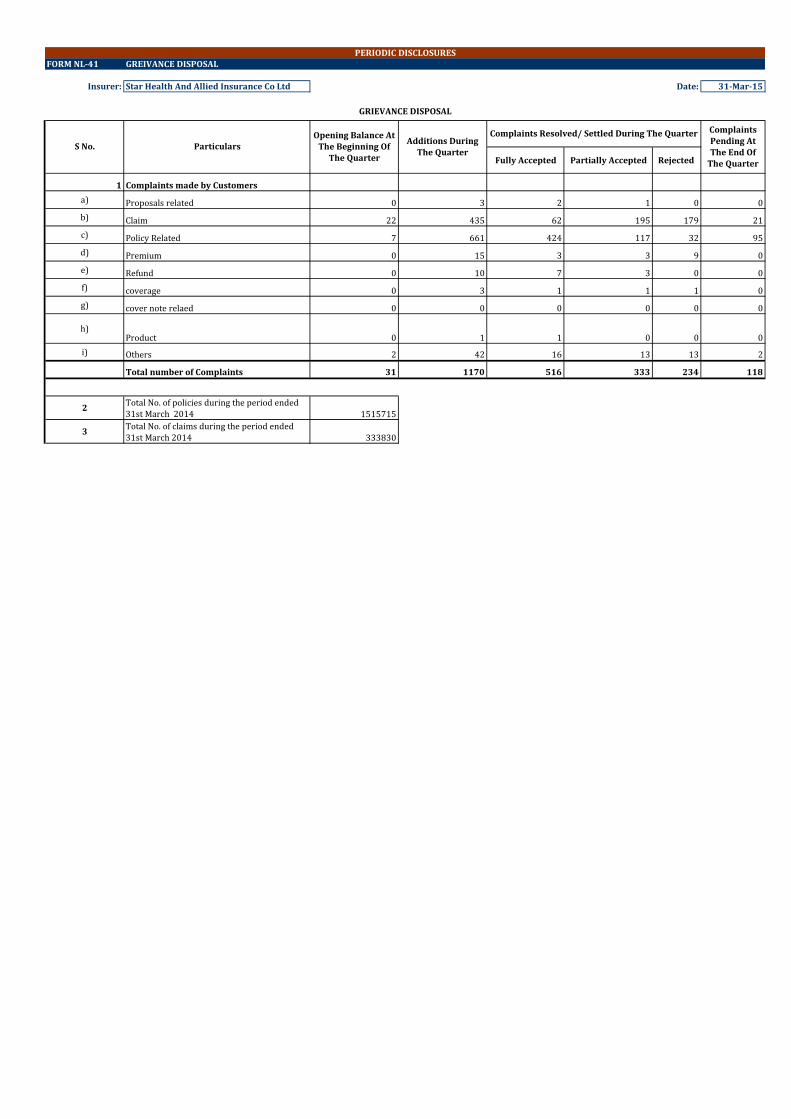
FORM NL-41 GREIVANCE DISPOSAL
Insurer: Star Health And Allied Insurance Co Ltd Date: 31-Mar-15
Fully Accepted Partially Accepted Rejected
1 Complaints made by Customers
a) Proposals related 0 3 2 1 0 0
b) Claim 22 435 62 195 179 21
c) Policy Related 7 661 424 117 32 95
d) Premium 0 15 3 3 9 0
e) Refund 0 10 7 3 0 0
f) coverage 0 3 1 1 1 0
g) cover note relaed 0 0 0 0 0 0
h)Product 0 1 1 0 0 0
i) Others 2 42 16 13 13 2
Total number of Complaints 31 1170 516 333 234 118
2Total No. of policies during the period ended 31st March 2014 1515715
3Total No. of claims during the period ended 31st March 2014 333830
PERIODIC DISCLOSURES
GRIEVANCE DISPOSAL
S No. ParticularsOpening Balance At
The Beginning Of The Quarter
Additions During The Quarter
Complaints Resolved/ Settled During The Quarter Complaints Pending At The End Of
The Quarter