return on investment for the florida sports foundation...
TRANSCRIPT

OFFICE OF ECONOMIC & DEMOGRAPHIC RESEARCH
Return on Investment for the Florida Sports Foundation Grants and Related Programs
Florida Sports Foundation Grant Program Professional Sports Franchise Incentive
Spring Training Baseball Franchise Facility Incentive Professional Golf Hall of Fame Facility Incentive
International Game Fish Association World Center
1/1/2015

Table of Contents
EXECUTIVE SUMMARY .................................................................................................................................. 1
OVERVIEW OF ECONOMIC DEVELOPMENT INCENTIVES AND ROI................................................................ 4
DESCRIPTION OF THE DATA .......................................................................................................................... 7
METHODOLOGY ............................................................................................................................................ 8
KEY ASSUMPTIONS ...................................................................................................................................... 10
PROGRAM FINDINGS ................................................................................................................................... 12
FLORIDA SPORTS FOUNDATION GRANT PROGRAM ............................................................................... 13
PROFESSONAL SPORTS FRANCHISE INCENTIVE ...................................................................................... 18
SPRING TRAINING BASEBALL FRANCHISE FACILITY INCENTIVE .............................................................. 21
PROFESSIONAL GOLF HALL OF FAME FACILITY INCENTIVE ..................................................................... 24
INTERNATIONAL GAME FISH ASSOCIATION WORLD CENTER ................................................................. 27
APPENDIX ONE – Facilities Financing APPENDIX TWO – Assessing the Economic Benefits of Public Subsidies of Professional Sports Facilities: A Literature Review

1
EXECUTIVE SUMMARY Background and Purpose... Recently enacted legislation directs the Office of Economic and Demographic Research (EDR) and the Office of Program Policy Analysis and Government Accountability (OPPAGA) to analyze and evaluate 18 state economic development incentive programs on a recurring three-year schedule.1 EDR is required to evaluate the “economic benefits” of each program using project data from the most recent three-year period and to provide an explanation of the model used in its analysis and the model’s key assumptions. “Economic Benefit” is defined as “the direct, indirect, and induced gains in state revenues as a percentage of the state’s investment” – which includes “state grants, tax exemptions, tax refunds, tax credits, and other state incentives.”2 EDR’s evaluation also requires identification of jobs created, the increase or decrease in personal income, and the impact on state Gross Domestic Product (GDP) for each program. In 2014, EDR and OPPAGA reviewed seven programs over Fiscal Years 2009-10, 2010-11, and 2011-12.3 This review period covers Fiscal Years 2010-11, 2011-12 and 2012-13, and includes the following sports-related programs:
Florida Sports Foundation (FSF) Grant Program;
Professional Sports Franchise Incentive;
Spring Training Baseball Franchise Incentive;
Professional Golf Hall of Fame Facility Incentive; and
International Game Fish Association (IGFA) World Center Facility Incentive.4 Explanation of Return on Investment... In this report, the term “Return on Investment” (ROI) is synonymous with economic benefit, and is used in lieu of the statutory term. This measure does not address issues of overall effectiveness or societal benefit; instead, it focuses on tangible financial gains or losses to state revenues, and is ultimately conditioned by the state’s tax policy. The ROI is developed by summing state revenues generated by a program less state expenditures invested in the program, and dividing that calculation by the state’s investment. It is most often used when a project is to be evaluated strictly on a monetary basis, and externalities and social costs and benefits—to the extent they exist—are excluded from the evaluation. The basic formula is:
(Increase in State Revenue – State Investment)
State Investment
1 Section 288.0001, F.S., as created by s. 1, ch. 2013-39, Laws of Florida & s. 1, ch. 2013-42, Laws of Florida.
2 Section 288.005(1), F.S.
3 EDR’s report can be found @ http://edr.state.fl.us/Content/special-research-projects/economic/EDR%20ROI.pdf
4 Three additional “programs” scheduled for review are not evaluated in this report. The Food and Beverage Concession and
Contract Awards to Minority Business Enterprises (s. 288.1167, F.S.) and the Homeless Shelter Designation of Sports Facilities (s. 288.11666, F.S ) were not reviewed because there they do not generate tax revenues for the state. Motorsports Entertainment Complex (s. 288.1171, F.S.) was not reviewed because the program did not have any recipients or costs during the study window.
2
Since EDR’s Statewide Model5 is used to develop these computations and to model the induced and indirect effects, EDR is able to simultaneously generate “State Revenue” and “State Investment” from the model so all feedback effects mirror reality. The result (a net number) is used in the final ROI calculation. As used by EDR for this analysis, the returns can be categorized as follows:
Greater Than One (>1.0)…the program more than breaks even; the return to the state produces more revenues than the total cost of the incentives.
Equal To One (=1.0)…the program breaks even; the return to the state in additional revenues equals the total cost of the incentives.
Less Than One, But Positive (+, <1)…the program does not break even; however, the state generates enough revenues to recover a portion of its cost for the incentives.
Less Than Zero (-, <0)…the program does not recover any portion of the incentive cost, and state revenues are less than they would have been in the absence of the program because taxable activity is shifted to non-taxable activity.
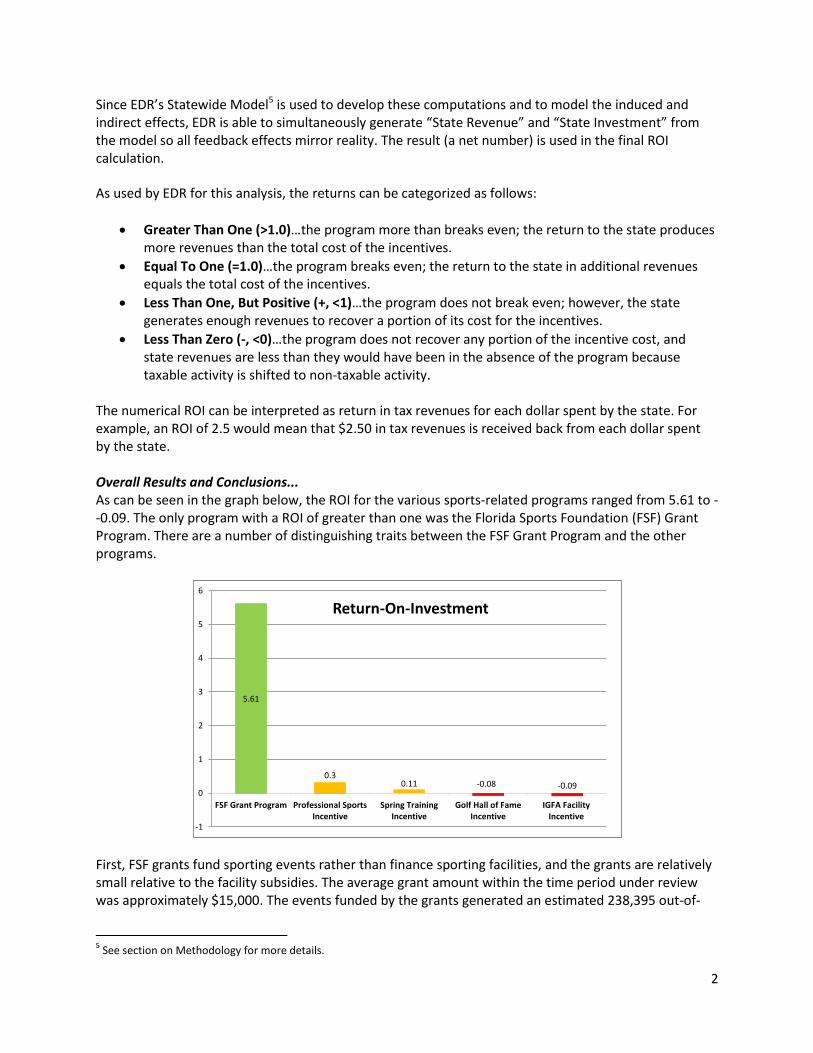
The numerical ROI can be interpreted as return in tax revenues for each dollar spent by the state. For example, an ROI of 2.5 would mean that $2.50 in tax revenues is received back from each dollar spent by the state. Overall Results and Conclusions... As can be seen in the graph below, the ROI for the various sports-related programs ranged from 5.61 to --0.09. The only program with a ROI of greater than one was the Florida Sports Foundation (FSF) Grant Program. There are a number of distinguishing traits between the FSF Grant Program and the other programs.
First, FSF grants fund sporting events rather than finance sporting facilities, and the grants are relatively small relative to the facility subsidies. The average grant amount within the time period under review was approximately $15,000. The events funded by the grants generated an estimated 238,395 out-of-
5 See section on Methodology for more details.
5.61
0.30.11 -0.08 -0.09
-1
0
1
2
3
4
5
6
FSF Grant Program Professional SportsIncentive
Spring TrainingIncentive
Golf Hall of FameIncentive
IGFA FacilityIncentive
Return-On-Investment

3
state visitors to Florida. While events held in facilities funded by the Professional Sports Franchise Incentive brought in more out-of-state visitors, the higher costs of the program adversely impacted the ROI. Facility construction is expensive. The latest professional sports arena built in Florida cost upwards of $450 million, and the state incentive committed $2 million a year for the next 30 years to help subsidize its construction cost. The FSF grant program spent a total of around $2 million for all three fiscal years in the study window. The lower awards of FSF compared to the other programs is a significant factor in its higher ROI. Second, events funded through the FSF program attract more out-of-state participants and visitors than in-state participants and visitors by design. The FSF grant program was the only program in the review period to have more out-of-state visitors than in-state visitors. This contributed to its higher ROI. For Professional Sports, Golf Hall of Fame and IGFA Museum, the estimated out-of-state visitors were less than 20% of the total visitors to these facilities. Because in-state visitors would have spent the money elsewhere (“the substitution effect”), they do not contribute to the program’s ROI6. Third, the FSF grant program funds single sporting events that will occur in the near future. This allows the FSF to more accurately estimate the economic impact of these sporting events, as well as to adjust the grant amount accordingly. For the other incentive programs, the state commits itself for 10, 15 or 30 years. This is problematic, because the long-term economic impacts of these sport teams or museums are far from clear when the initial evaluation is made. Among other things, economic performance can be driven by the team’s record, which can fluctuate annually. In addition, changing consumer preferences regarding entertainment can affect attendance at sporting events and museums. One professional sport team within the window left the incentivized facility, and the state is still paying the $2 million to the facility operators. Finally, the ROI did not take into account any intangible benefits associated with the professional sports and spring training programs. Intangible benefits can include increase in community pride and media exposure of Florida areas from televised sporting events. While these benefits likely exist, they are difficult to include in the ROI calculation.
6 The ROI did not take into account any intangible benefits associated with these programs. Intangible benefits can include
increase in community pride and media exposure of Florida areas from televised sporting events.

4
OVERVIEW OF ECONOMIC DEVELOPMENT INCENTIVES AND ROI The basic formula for Return on Investment (ROI) is always calculated in the same manner, but the inputs used in the calculation can differ depending on the needs of the investor. Florida law requires the “return” to be measured from the state’s perspective as the investor, in the form of state tax revenues. In this regard, the ROI is ultimately shaped by the state’s tax code. For example, all other factors being equal, if Florida had a personal income tax, the ROI for each incentive program would increase from the additional tax revenues. All of the issues below shape EDR’s calculation of ROI. Some of them are further addressed in the assumptions, methodology, and findings. Role of Incentives... Generally, the goal of economic development by local, state, or national government is to expand economic activity, primarily through capital investment and the creation of new job opportunities – preferably at competitive-to-above-average wages, thereby increasing the state’s standard of living for its residents. This new economic activity creates new wealth, which when spent in the economy, induces the creation of additional jobs. To the extent this economic goal is achieved, the tax base is expanded and governments realize an increase in tax revenues.7 Intuitively, it is easy to see why local governments invest in economic incentives to individual businesses. Any action that benefits or increases the standard of living within a local jurisdiction – even if it causes harm to its neighbors – would be reasonable. It is much harder to accomplish this type of economic development (as opposed to generic investments in public infrastructure and Florida’s overall business climate) at the state level where government should be neutral between competing in-state areas and has to take both winners and losers into account. In effect, the state becomes a single economic region, and the focus is generally on attracting new business to the state. From the business perspective, incentives are public resources that reduce capital or operating costs. From an economic development organization’s (EDO) perspective, incentives help sites overcome deficiencies or mitigate weaknesses relative to other sites. In regard to the programs discussed in this report, the state and local authorities have to compete with other states in attracting or retaining a sports team or sports museum. To do this, the state and local authorities offer financial assistance for the construction or renovation of a facility. The facility is defined as a stadium, arena, ballpark, or a sports-related museum. Classification of Incentives...
Economic development incentives may be provided by any level of government. The various forms an incentive can take are wide-ranging, including everything from grants, loans, and tax relief, to regulatory breaks and technical assistance. There are a number of ways these incentives may be classified. For the purposes of this analysis, only Direct Financial Incentives, such as grants, appear to be relevant.
7 There may also be complementary policy goals to address poverty or economic self-sufficiency for disadvantaged persons or
to promote environmental objectives; however, achievement of these goals would not be fully captured by the Return on Investment measure. To the extent they exist, that information would be addressed by OPPAGA’s portion of the analysis.

5
Direct financial incentives provide monetary assistance to businesses from the state or through a state-funded organization. The assistance is provided through grants, loans, equity investments, loan insurance, and guarantees. These awards usually give flexibility to the recipient regarding the specific use of the grant within the scope of its business operations, but they can also be targeted to areas such as workforce training, market development, modernization, and technology commercialization activities. The state offers many incentive programs; however, only five are under review in this report:
Florida Sports Foundation Grant Program;
Professional Sports Franchise Facility Incentive;
Spring Training Baseball Franchise Facility Incentive;
Professional Golf Hall of Fame Facility Incentive; and
International Game Fish Association World Incentive. The Florida Sports Foundation Grant Program is clearly a “Direct Financial Incentive,” as defined above. The remaining four programs operate slightly differently; however they are still grants to the recipients. This is because the recipients are not actually required to collect at least the amount of sales taxes they will receive in the annual sales tax distribution. To qualify for the annual award, three of the programs require applicants to submit “an independent analysis or study…which demonstrates that the amount of the revenues generated” by sales and use taxes by the facility or project “will equal or exceed” the annual award, but there is no calibration after the fact. Similarly, the Spring Training Baseball Franchise Facility incentive requires identification of projected “local and state tax collections” to be used in evaluating competing applications, but there is no further link once the application is approved. Effectively, using a specified distribution from state sales tax contributions is just another form of appropriating a direct grant. Local Incentives... In all but one of the facility construction programs, local governments contributed to the project funding. Sporting events that received grants from the Florida Sports Foundation also received grants from local sport commissions. For the other programs, these local sources financed a majority of the construction of the sport facilities that the state programs also helped fund. For the purposes of this analysis, EDR split the out-of-state visitors between the state and the local funding sources. “But For” Requirement…
Economic development incentives are public subsidies intended to induce an economic activity or capital investment by a private business in a jurisdiction in which such activity or investment would not otherwise take place. The necessity of offering such incentives has been the subject of much research. Some incentive proponents assert that “but for” the incentive, business expansions or relocations would not have occurred in their area – the incentive is the primary or the determining factor in business locational decisions. Site selection and economic development professionals claim that incentives may “tip the scales” between competing sites when all other factors are relatively equal. Evaluating the extent to which economic development incentives are determinative in business location decisions is challenging. Survey research is instructive but may be unreliable, principally due to the unavoidable self-interest of respondents. The studies commissioned by various states identify the

6
problems in verifying that the “but-for” condition is satisfied. While econometric studies show, to some extent, the relationships between incentives and business behavior, there is some skepticism in the academic community regarding their usefulness and applicability. Finally, a review of the academic literature reveals a lack of consensus on the degree of influence that incentives have on business locational decisions, with one researcher concluding that “there are very good reasons – theoretical, empirical, and practical – to believe that economic development incentives have little or no impact on firm location and investment decisions.”8 The “but for” assertion is less likely to be satisfied for those projects where the incentive is relatively insignificant in proportion to relocation, capital investment, production or operating costs, or where a project is otherwise dependent on in-state markets or resources. As for the determinative value of the programs under review, four of the five programs provided a significant share of the financing of the facility. It is likely that if both the state and locals did not heavily subsidize the cost of the facility, the participating organization would have found another location. Treatment as a Subsidy... Economic development is facilitated by investments in public infrastructure, expansion of certain public services, or through the provision of economic development incentives to the business sector. These incentives are public subsidies intended to induce an economic activity or capital investment by a private business in a jurisdiction in which such activity or investment would not otherwise take place. From an economic perspective, a “subsidy” is:
“.. a grant of money made by government in aid of the promoters of any enterprise, work, or improvement in which the government desires to participate, or which is considered a proper subject for government aid, because such purpose is likely to be of benefit to the public.”9
Generally, economic development subsidies are an investment of public resources (whether budgeted or from foregone revenue) with an anticipated ROI to the public treasury, as well as an indirect benefit to the general public. While subsidies still constitute a monetary transfer from the class of general taxpayers to individual businesses, such transfers are intended to expand the state’s economic infrastructure and wealth-creation capacity. Even though subsidies can be used to accomplish specific policy goals, they cause market distortions which result in inefficiencies and inequalities in the marketplace. This outcome forces decision-makers to weigh the negative repercussions of incentives against the benefits associated with the underlying goal. It also makes periodic, in-depth evaluations critical to the use of incentives. Economic literature is fairly uniform in its assessment of potential repercussions. First, to the extent that subsidies are influential or determinative in business decisions, they can:
decrease risk in the marketplace, thereby distorting economic decision making by businesses;
shift capital from more profitable uses in the private sector; and
foster inefficient projects that may not survive absent the subsidy.
8 Alan Peters and Peter Fisher, “The Failures of Economic Development Incentives” Journal of the American Planning
Association, Vol. 70, No. 1 (Winter 2004): 32. 9 Black’s Law Dictionary, 5th Edition, 1999.

7
Second, regardless as to whether subsidies are influential or determinative in business decisions, they can:
distort the marketplace by artificially lowering production costs;
shift business costs from the private sector to the public sector, as economic incentives—like all government expenditures—are funded through taxes;
create inequities among similar industries and firms within the state; and
divert public resources from spending on other public goods and services, which may be more productive uses of the funds.
To the extent that market distortions exist, the ROI may be overstated. Substitution Effect on Event Spending…
There is consensus among economists that the only tangible economic benefits to the area economy from subsidies for professional and amateur sporting events, or a unique sports-destination facility, are the result of new spending in the area economy associated with the events.10 This new spending is primarily by visitors from out-of-area, to the extent that such spending would not have otherwise occurred absent attending the event; however, it can also include capital expenditures. New spending specifically excludes “substitute” spending by in-area residents, “casual visitors” or “time-switchers” whose primary purpose for visiting is unrelated to the event. In these cases, the same amount would have been spent, and the spending related to the sports events is simply redirected from what would have occurred absent the event. This is referred to in the literature as “the substitution effect.” It is best described as spending limited disposable entertainment income in or about the sports facility rather than in other areas of the local economy, or increases in discretionary spending in one area of the economy at the expense of another.
DESCRIPTION OF THE DATA Data Sources and Development of the Universe... The law requires EDR and OPPAGA to analyze and evaluate the specified incentive programs’ performance over the previous three years.11 This report is scheduled for release January 1, 2015, and includes Fiscal Years 2010-11, 2011-12, and 2012-13. There were two primary sources of information for the five programs under review: The Florida Sports Foundation and the Florida Department of Revenue for sales and use tax distributions. Surveys, impact studies and documents related to bonding of sports facilities supplemented this information. Detailed information is provided in the Program Findings; however, only data related to the three-year review period is considered in the evaluation.
10
See the Literature Review in Appendix Two for a discussion of this issue. 11
Section 288.0001, F.S., as created by s. 1, ch. 2013-39, Laws of Florida & s. 1, ch. 2013-42, Laws of Florida.

8
METHODOLOGY Broad Approach... EDR used the Statewide Model to estimate the Return on Investment for the programs under review. The Statewide Model is a dynamic computable general equilibrium (CGE) model that simulates Florida’s economy and government finances.12 Among other things, it captures the indirect and induced economic activity resulting from the direct program effects. This is accomplished by using large amounts of data specific to the Florida economy and fiscal structure. Mathematical equations13 are used to account for the relationships (linkages and interactions) between the various economic agents, as well as likely responses by businesses and households to changes in the economy.14 The model also has the ability to estimate the impact of economic changes on state revenue collections and state expenditures in order to maintain a balanced budget by fiscal year. When using the Statewide Model to evaluate economic programs, the model is “shocked”15 using static analysis to develop the initial or direct effects attributable to the projects funded by the incentives. In this analysis, the direct effects are the changes in demand across Florida industries caused by expenditures from out-of-state visitors or construction attributed to the programs. Out-of-State expenditures were calculated from an estimate of out-of-state visitors associated with the program, daily expenditure amounts from the visitors and the expected duration of each visit. If not otherwise stated in the Program Findings, VISIT FLORIDA average daily expenditures for domestic visitors and average duration of stay were used. To distribute the daily expenditures into the model, the analysis used VISIT FLORIDA’s spending breakdown for domestic visitors. The breakdown distributed the expenditures into 5 categories: Retail, Lodging, Food & Beverage, Transportation and Entertainment. Taxable ticket sales to the sporting events were not separately estimated as ticket sales are captured in the Entertainment expenditure category. For all programs, the combined annual direct effects (“shocks”) took the form of:
Removal of the incentive payments from the state budget, with a corresponding award to businesses as subsidies to production.
Capital investments related to the program.
Increased demand based on out-of-state visitor expenditures. The model was then used to estimate the additional—indirect and induced—economic effects generated by the programs, as well as the supply-side responses to the new activity, where the supply-side responses are changes in investment and labor demand arising from the new activity. Indirect effects are the changes in employment, income, and output by local supplier industries that provide
12
The statewide economic model was developed using GEMPACK software with the assistance of the Centre of Policy Studies (CoPS) at Victoria University (Melbourne, Australia). 13
These equations represent the behavioral responses to economic stimuli to changes in economic variables. 14
The business reactions simulate the supply-side responses to the new activity (e.g., changes in investment and labor demand). 15
In economics, a shock typically refers to an unexpected or unpredictable event that affects the economy, either positive or negative. In this regard, a shock refers to some action that affects the current equilibrium or baseline path of the economy. It can be something that affects demand, such as a shift in the export demand equation; or, it could be something that affects the price of a commodity or factor of production, such as a change in tax rates.

9
goods and services to support the direct economic activity. Induced effects are the changes in spending by households whose income is affected by the direct and indirect activity. All of these effects can be measured by changes (relative to the baseline) in the following outcomes:
State government revenues and expenditures
Jobs
Personal income
Florida Gross Domestic Product
Gross output
Household consumption
Investment
Population EDR’s calculation of the Return on Investment used the model’s estimate of net state revenues and expenditures. Other required measures for this report include the number of jobs created, the increase or decrease in personal income, and the impact on gross state product, all of which are included in the model results.

10
KEY ASSUMPTIONS The following key assumptions are used in the Statewide Model to determine the outcomes of the programs under review. Some of the assumptions are used to resolve ambiguities in the literature, while others conform to the protocols and procedures adopted for the Statewide Model.
The analysis assumes that state incentives were the determining factor in the sports program, sporting event, or museum’s location decisions, provided the program was designed to attract or retain sport-related activity to the state.
The analysis assumes all data provided by Florida Sports Foundation, Department of Revenue and other entities was complete and accurate. The data was not independently audited or verified by EDR.
The analysis assumes that given the time span under review, applying discount rates would not prove material to the outcome.
The analysis treats all grants, distributions or license plate revenues as a loss to the state’s General Revenue Fund.
The analysis assumes that any expenditure made for incentives is a redirection from the general market basket of goods and services purchased by the state. Similarly, any revenue gains from increased business activities are fully spent by the state.
The analysis assumes the relevant geographic region is the whole state, not individual counties or regions. The Statewide Model does not recognize that any economic benefit arises from intrastate relocation. However, the model accounts and makes adjustments for the fact that industries within the state cannot supply all of the goods, services, capital, and labor needed to produce the state’s output.
The analysis assumes that businesses treated the incentives as subsidies. The subsidies lowered the cost of operation for each individual firm.
The analysis assumes distribution of capital purchases by each business was the same as the industry in which it operates. This assumption was made because data was not available regarding the specific capital purchases associated with each project. It is also assumed that the businesses within a program were not large enough to affect the rate of return on capital within the industries in which the businesses operated.
The analysis assumes that the demand created by the sport or sport-related event from out-of-state visitors did not displace the demand for goods and services of existing Florida businesses. To do this, demand associated with the events was assumed to be from the rest of the world. The “rest of the world” is defined as other states or the international market.
11
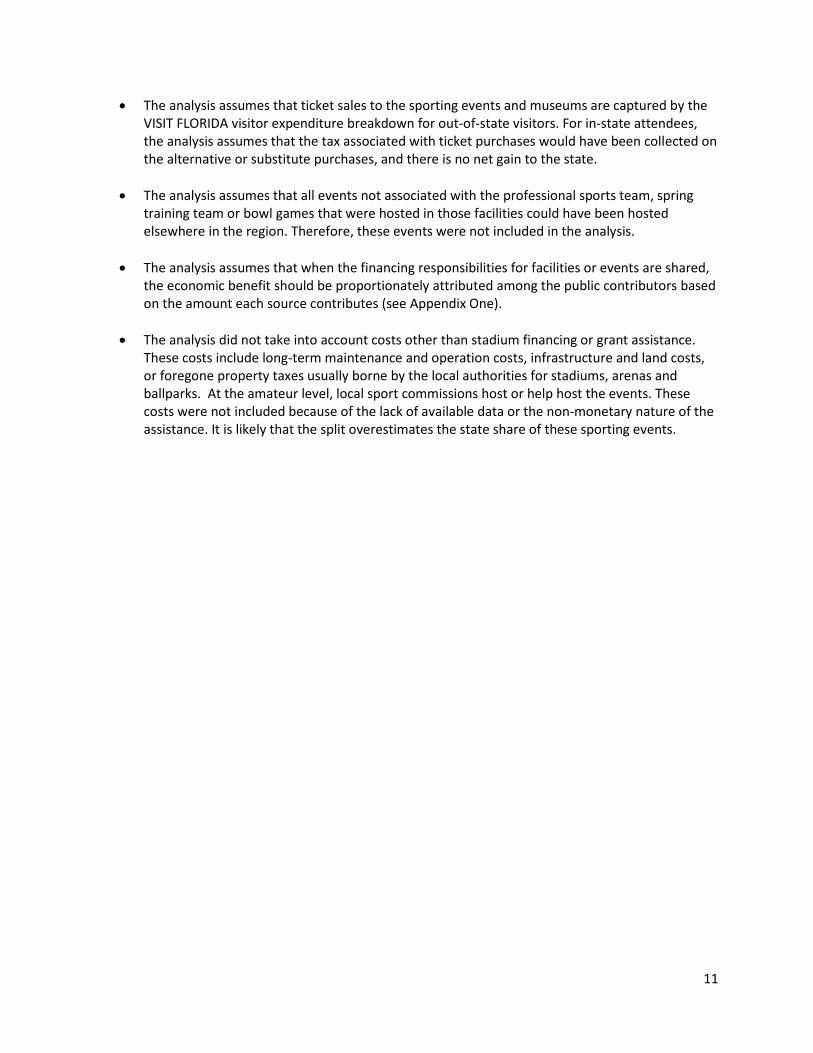
The analysis assumes that ticket sales to the sporting events and museums are captured by the VISIT FLORIDA visitor expenditure breakdown for out-of-state visitors. For in-state attendees, the analysis assumes that the tax associated with ticket purchases would have been collected on the alternative or substitute purchases, and there is no net gain to the state.
The analysis assumes that all events not associated with the professional sports team, spring training team or bowl games that were hosted in those facilities could have been hosted elsewhere in the region. Therefore, these events were not included in the analysis.
The analysis assumes that when the financing responsibilities for facilities or events are shared, the economic benefit should be proportionately attributed among the public contributors based on the amount each source contributes (see Appendix One).
The analysis did not take into account costs other than stadium financing or grant assistance. These costs include long-term maintenance and operation costs, infrastructure and land costs, or foregone property taxes usually borne by the local authorities for stadiums, arenas and ballparks. At the amateur level, local sport commissions host or help host the events. These costs were not included because of the lack of available data or the non-monetary nature of the assistance. It is likely that the split overestimates the state share of these sporting events.

12
PROGRAM FINDINGS In the pages that follow, each incentive program is preceded by diagnostic tables describing the composition and statistics of the projects under review. Key terms used in the tables are described below: Actual State Payments Used in Analysis – Represents the amount of state payments made to the program in each fiscal year.
Total Net State Revenues $ (M) – Represents the amount of new state revenue generated by the program in each fiscal year.
Personal Income (Nominal $(M)) – Income received by persons from all sources. It includes income received from participation in production as well as from government and business transfer payments. It is the sum of compensation of employees (received), supplements to wages and salaries, proprietors' income with inventory valuation adjustment (IVA) and capital consumption adjustment (CCAdj), rental income of persons with CCAdj, personal income receipts on assets, and personal current transfer receipts, less contributions for government social insurance.
Real Disposable Personal Income (Fixed 2009 $(M)) – Total after-tax income received by persons; it is the income available to persons for spending or saving.
Real Gross Domestic Product (Fixed 2009 $(M)) – A measurement of the state's output; it is the sum of value added from all industries in the state. GDP by state is the state counterpart to the Nation's gross domestic product.
Consumption by Households and Government (Fixed 2009 $(M)) –The goods and services purchased by persons plus expenditures by governments consisting of compensation of general government employees, consumption of fixed capital (CFC), and intermediate purchases of goods and services less sales to other sectors and own-account production of structures and software. It excludes current transactions of government enterprises, interest paid or received by government, and subsidies.
Real Output (Fixed 2009 $(M)) – Consists of sales, or receipts, and other operating income, plus commodity taxes and changes in inventories.
Total Employment (Jobs) – This comprises estimates of the number of jobs, full time plus part time, by place of work. Full time and part time jobs are counted at equal weight. Employees, sole proprietors, and active partners are included, but unpaid family workers and volunteers are not included.
Population (Persons) – Reflects first of year estimates of people, includes survivors from the previous year, births, special populations, and three types of migrants (economic, international, and retired).

13
FLORIDA SPORTS FOUNDATION GRANT PROGRAM
Program Description… The Florida Sports Foundation, Inc. (FSF) is a 501(c)(3) non-profit corporation, serving as the Sports Industry Development Division of Enterprise Florida, Inc.16 In 1989, the Legislature authorized the designation of a direct support organization to assist in the promotion and development of the sports industry in the state.17 In 1995, the Legislature authorized the sale of professional sport team license plates, the proceeds of which were allocated to the FSF to:
Fund major sporting events;
Promote the economic development of the sports industry;
Distribute licensing and royalty fees to participating pro sports teams;
Institute a grant program for communities bidding on minor sporting events that create an economic impact for the state;
Distribute funds to Florida-based charities designated by the FSF and the participating pro sports teams; and
Fulfill sports-promotion responsibilities of the Department required by statute.18 Following the abolishment of the Department of Commerce in 1996,19 the FSF was assigned to the Office of Tourism, Trade and Economic Development (OTTED) in the Executive Office of the Governor, with specific statutory powers and duties.20 In 1999, the Legislature transferred many of the responsibilities of the Governor’s Council on Physical Fitness and Amateur Sports to the FSF, which included the operation of the “Sunshine State Games.”21 The statutory responsibilities were expanded in 2010 to include assisting OTTED in retention of professional sports franchises and the spring training operations of Major League Baseball.22 When OTTED was abolished in 2011, FSF was merged into Enterprise Florida, Inc. (EFI), the state’s principal economic development organization under contract with the newly created Department of Economic Opportunity.23 FSF operates as a separate corporation with EFI as its sole member, and FSF retained the assets, liabilities and responsibilities of the original corporation. EFI is responsible for appointing FSF’s board of directors, President and other corporate officers. The President is responsible for the active management of FSF, subject to the directions of the board and EFI, “consistent with its organizational documents and the purposes set forth in Section 288.1229, Florida Statutes (2010).”24
16
Section 288.92(1)(e), F.S. 17
When created by statute, Direct-Service Organizations are typically non-profit corporations, authorized to carry out specific tasks in support of public entities or public causes. Section 1, ch. 88-226, L.O.F., created the Sports Advisory Council within the Florida Department of Commerce. Section 1, ch. 89-263, L.O.F., authorized the creation of a DSO to assist the Sports Advisory Council. Section 1, ch. 92-111, L.O.F., transferred the DSO to the Department of Commerce, and OPPAGA Report 96-31 states that FSF was established as a DSO of the Department of Commerce in 1992. The Council was abolished by s. 22, ch. 93-187, L.O.F. 18
Section 3, ch. 95-282, L.O.F., which created s. 320.08058(9), F.S. 19
Section 3, ch. 96-320, L.O.F. 20
Section 56, ch. 96-320, L.O.F, which created s. 288.1229, F.S. 21
Section 7, ch. 99-251, L.O.F. 22
Section 6, ch. 2010-140, L.O.F. 23
Section 30, ch. 2011-142, L.O.F. 24
Sections 1 and 2 of Article VI, and Section I (d), Bylaws of the Florida Sports Foundation, Incorporated, March 19, 2012. Section 288.1229, Florida Statutes (2010) was repealed by s. 485, ch. 2011-142, L.O.F.

14
Today, the duties of the Florida Sports Foundation are to:
With funding from the sale of nine Professional Sports and three Specialty License Plates, administer the Major, Regional and Small Market grant programs, which assist Florida communities with securing, hosting and retaining sporting events, as well as assist in the marketing of these Specialty License Plates;
Promote, organize and provide funding for the Sunshine State Games and the Florida Senior Games;
Through publications and the FSF website, promote sports tourism in Florida and convene an annual summit of Regional Sports Commissions;
Through publications and the FSF website, promote the Florida Grapefruit League as a sports tourism destination, and promote Florida as a golfing and fishing destination;
Assist the Florida Department of Economic Opportunity in certifying new and retained professional sports franchise and baseball spring-training facilities in the state; and
With other state agencies or private entities, assist or sponsor sport or fitness related activities. Funding for the FSF is provided through the sale of Florida professional sports team license plates, half of which must be used to attract major sports events in Florida.25 Additionally, the FSF receives up to $250,000 annually from the sale of Florida US Olympic Committee license plates to be used for Florida’s Sunshine State Games,26 and a portion of proceeds from the sale of Florida NASCAR27 and Florida Tennis license plates.28 FSF reported they also received $200,000 annually in General Revenue in Fiscal Years 2010-11, 2011-12, and 2012-13.29 Major program expenditures include funding of the FSF Major Grant Program, the Regional Grant Program (primarily amateur sport events), the Small Market Grant Program, and the Amateur Sports Programs (Sunshine State Games and Florida Senior Games). Grant requests are submitted through the 26 regional sports commissions and are evaluated based on need and the economic impact related to the number out-of-state participants and spectators. These estimates are provided in grant applications and validated after the event. As noted above, the FSF has varied administrative responsibilities in support of the state’s sports-tourism industry. Both the Sunshine State Games and the Senior Games cater to Florida residents. While it is possible that non-Florida residents participated, it is likely that economic benefits from these participants are negligible. Florida Sports Foundation’s main contribution to the Florida economy is the grant program, which is the focus of this analysis. FSF Grant Programs The FSF grant programs assist the 26 regional sports commissions in securing and hosting professional and amateur sporting events from recognised host organizations. Such events range from the NFL Superbowl to the International Quidditch Association's World Cup VI Games, 2013.
25
Section 320.08058(9)(b), F.S. Major sport events include pro sport events, NCAA Final Four basketball events, or a horseracing or dogracing Breeders’ Cup. 26
Section 320.08058(6)(b)1.a., F.S. 27
Section 320.08058(60), F.S. 28
Section 320.08058(65), F.S. 29
FSF Revenues and Expenditures, Information on file with EDR.

15
The Major, Regional and Small Market grant programs have specific qualifying criteria, designed to maximize “economic impact, return on investment, and community support and image value to the state.”30 Grants are subjected to pre-award evaluation and post-event verification of economic impact. To measure the estimated economic impact of events, applications are required to include an estimate of:
The number of adults and youth from out-of-state attending or participating in the event, the length of their stay, the number of rooms estimated to be let and the event room rate; and
The state sales and tourist development taxes generated by the event. The applications also identify the “community support” or other public matching funds secured for the event. Completed applications are considered quarterly by the FSF Board of Directors. After the event, the regional sports authority submits a “Post Event Report” showing the actual economic impact of out-of-state event attendees to secure the approved grant from the FSF. Regional grants may have been reduced if the event failed to meet required qualifying thresholds. Description of the Data EDR examined the post-event reports of sporting events that received a FSF grant to ascertain total number of out-of-state participants and spectators (both adult and children), as well as visiting media; the length of stay for participants and spectators; hotel costs; and average daily expenditures. The analysis only included events that occurred in the study window. Events that qualified for the grant but occurred outside the study window were excluded from the study. EDR successfully surveyed 21 of the 22 local sports commissions that received grants during the review period to ascertain the cash assistance given to the related sporting events in the study.
30
See FSF Major & Regional Grant Program Policies & Procedures @ http://www.flasports.com/images/pdfs/GrantForms/majorregionalinformation2013.pdf Last accessed on 5/9/14. Also, events are not “considered for any of the Foundation’s Grant Programs if the event also receives funding from the state of Florida, its agency or state private partner, for the purpose of economic development or economic impact and/or tourism incentives.”

16
Analysis and Findings…
The analysis considered the impact of the 152 sporting events that occurred within the three-year window of review: July 1, 2010 to June 30, 2013. The events ranged from the YMCA Masters Swimming Championships to the NBA All-Star Game. A brief summary can be found below:
Fiscal Year # of Events
Total FSF Grant
Awards Total Local Grant
Amounts
2010-11 47 $446,709 $1,361,777
2011-12 59 $1,253,710 $5,308,581
2012-13 46 $581,000 $2,978,202
When grant responsibilities for events are shared, the economic benefit is proportionately attributed among the public contributors. When proportioned at the individual event level, FSF’s share of visitors ranged from under 10% to 100% for each event. Based on the calculated proportions per event, the analysis attributes 238,395 out-of-state visitors to FSF Grants. They stayed, on average, around 6.8 days in Florida (according to the post-event reports) spending $310 million in the state economy. The Florida Sports Foundation Grant Program has a projected ROI of 5.61. For every dollar spent on the grant program, the state of Florida received $5.61 in tax revenue. In addition, the grant program increased Florida’s Real GDP by about $355.7 million and caused Real Disposable Personal Income to grow by $296.6 million in the study window. Even after apportioning the benefit with local governments, the FSF grant program had a healthy ROI. This is due to its ability to attract large national events with significant out-of-state visitors for, on average, a small state share of the cost. The state
Statewide Economic Model Impact of the Florida Sports Foundation Grant Program
2010 - 11 2011 - 12 2012 - 13 Total
0.4 1.3 0.6 2.3
1.8 6.1 5.1 12.9
4.5 4.7 8.4
Return-on-Investment for the 3 year period 5.61
2010 - 11 2011 - 12 2012 - 13 Total
Average
per Year
Personal Income Nominal $ (M) 47.8 163.7 144.0 355.5 118.5
Real Disposable Personal Income Fixed 2009 $ (M) 40.9 136.5 119.2 296.6 98.9
Real Gross Domestic Product Fixed 2009 $ (M) 50.0 166.7 139.0 355.7 118.6
Consumption by Households and Government Fixed 2009 $ (M) 40.1 139.5 124.3 303.9 101.3
Real Output Fixed 2009 $ (M) 65.3 217.0 177.4 459.7 153.2
2010 - 11 2011 - 12 2012 - 13MinimumMaximum
Average
per Year
Total Employment Jobs 344 1,203 813 344 1,203 787
Population Persons 16 80 336 16 336 144
State Payments in the Window $ (M)
Total Net State Revenues $ (M)
Return-on-Investment by Year

17
share of the cost runs about $15,000 per event. Visiting participants and spectators to these events spent money and, on average, stayed longer than a typical Florida visitor--contributing to the higher ROI.

18
PROFESSIONAL SPORTS FRANCHISE INCENTIVE
Program Description… The Professional Sports Franchise incentive is the state’s funding mechanism to attract and retain pro sport franchises in Florida. Qualified applicants are eligible for up to $2 million annually for 30 years. These dollars are pledged with other local government resources to secure bonds to fund the acquisition, construction, reconstruction or renovation of pro sport facilities. In their initial effort to attract professional sports franchises to the state, the Legislature authorized three funding mechanisms for the construction of related facilities. In 1988, local governments were authorized to levy a local option sports facility sales tax on stadium admissions, concessions and parking that was matched with an equal amount of state funds of up to $2 million per year and $15 million over the life of the facility.31 The law also authorized counties to levy a one-percent tourist development tax to pay the debt service on bonds issued to finance the construction, reconstruction, or renovation of a professional sports franchise facility. In 1991, the Legislature significantly revised the incentive to provide up to $2 million a year for up to 30 years to applicants certified by the Department of Commerce.32 Certification criteria include a commitment by the franchise to use the facility for five years, a declaration by the local government that the project serves a public purpose, projections for paid attendance (at least 300,000 annually), projections that the facility will generate at least $2 million annually in sale taxes, and demonstration of the financial capability to provide more than one-half of the costs incurred or related to the improvement or development of the facility. This law also established an incentive for new spring training franchises, limited the total number of awards for incentives to six, and prohibited facilities from receiving more than one award. The qualifying criteria were amended in 1994 to extend the use commitment from five to ten years for pro sports franchises.33 In addition, counties were authorized to levy an additional one-percent tourist development tax to pay the debt service on bonds issued to finance the construction, reconstruction, or renovation of a professional sports franchise facility. 34 The incentive was made available to fund facilities for “retained” pro franchise facilities in 1995,35 and the cap on the number of awards was increased from six to eight in 1996.36 The cap was increased again in 2000, with eight awards specifically reserved for pro facilities.37 To date, eight certified facilities for new or retained professional sports franchises have received funding distributions from DOR.38 Each facility receives $166,667 monthly ($2 million annually) for no more than
31
Section 288.1162, F.S., created in ch. 88-226, L.O.F. Approval was contingent upon review and recommendation by the Florida Department of Commerce, and subsequent Legislative authorization. If a local government was successful in signing a franchise before January 1, 1989, they would also have received an additional $1,757,920 to assist in locating the franchise to Florida. 32
Chapter 91-274, L.O.F. 33
Section 35, ch. 94-338, L.O.F. 34
Section 37, ch. 94-338 and s. 1, ch. 94-275, L.O.F. 35
Chapter 95-304, L.O.F. 36
Section 45, ch. 96-320, L.O.F. 37
Section 2, ch. 2000-186, L.O.F. 38
The eighth pro sport certification was specifically designated by s. 4, ch. 2006-262, L.O.F., for an NBA franchise located in Florida since 1997. In 2014, the Legislature established the Sports Development Program to provide an additional sales tax distribution to local governments for the purpose of constructing or renovating professional sports facilities. However, the

19
30 years, totaling a maximum of $60 million. These distributions fund a relatively small portion of the debt financing for pro-sport facilities, ranging from 6 to 17.4 percent. Finally, in some cases the primary tenant contributes to the construction or reconstruction funding of the facility. Data For the analysis of the program, EDR surveyed the eight professional teams that use facilities financed, in part, by the Professional Sports Franchise incentive. EDR requested data on total tickets purchased to professional sporting events, total number of ticket purchases from attendees with out-of-state zip codes and total number of youth tickets purchased to these events. Four of the eight teams were able to provide an estimate of out-of-state visitors based on ticket purchases. EDR reviewed the “2010-11 Fiesta Bowl Festival of College Football Economic Impact Study,” which provided estimates of out-of-state visitors to the bowl games at the relevant sport facilities. The study included separate estimates for both BCS games and non-BCS games. EDR also reviewed DOR data regarding the sales tax distributions for each Professional Sports Franchise Incentive recipient.
In addition, EDR examined the bond documents associated with the building or renovation of the qualified facilities. The bond documents helped identify the proportions financed through local sources and the state’s sales tax distributions. Analysis and Findings…
qualifying and certification criteria are substantially different from the Professional Sports Franchise Facility incentive. (Section 4, ch. 2014-167, L.O.F., creating s. 288.11625, F.S.)
Statewide Economic Model Impact of the Professional Sports Facilities Incentive Program
2010 - 11 2011 - 12 2012 - 13 Total
16.0 16.0 16.0 48.0
6.3 5.7 2.2 14.2
0.4 0.4 0.1
Return-on-Investment for the 3 year period 0.3
2010 - 11 2011 - 12 2012 - 13 Total
Average
per Year
Personal Income Nominal $ (M) 155.4 139.8 47.5 342.7 114.2
Real Disposable Personal Income Fixed 2009 $ (M) 134.4 120.1 40.7 295.1 98.4
Real Gross Domestic Product Fixed 2009 $ (M) 169.7 149.8 50.3 369.9 123.3
Consumption by Households and Government Fixed 2009 $ (M) 113.2 94.7 24.1 232.0 77.3
Real Output Fixed 2009 $ (M) 214.8 180.8 50.8 446.4 148.8
2010 - 11 2011 - 12 2012 - 13 Minimum Maximum
Average
per Year
Total Employment Jobs 1,136 808 (10) (10) 1,136 645
Population Persons 32 160 224 32 224 139
State Payments in the Window $ (M)
Total Net State Revenues $ (M)
Return-on-Investment by Year

20
EDR surveyed the eight professional sports teams to ascertain the number of out-of-state visitors attending events in their facilities during the review window. Four of the eight teams estimated that, on average, 10.8 percent of attendees were from out-of-state, based on the zip codes identified in billing documents. It is possible that the estimate doesn’t account for all out-of-state visitors to professional sport games, as visitors may have purchased tickets through a third-party vendor. However, the number does not appear to be unreasonable. Two professional sports impact studies identify overnight, out-of-state attendees ranging from 6% to 10.5%.39 Additionally, the estimate assumes that all of the out-of-state attendees were visiting Florida primarily to watch the sporting event. This is a generous assumption, as some of these visitors could have been “casuals”, with a different primary reason for visiting Florida. During the study window, one of the recipient facilities was under construction. Construction expenditures benefit the state through additional tax revenue, personal income and GDP growth. The analysis estimated the state’s share of the construction expenditures and included it in the impact. Attendees to the college football bowl games played in the facilities were included in the analysis. The “2010-11 Fiesta Bowl Festival of College Football Economic Impact Study” provided the percentage of out-of-state visitors who attended either a BCS or a non-BCS bowl game. Using this figure, the study attributed an additional 119,476 visitors to professional sports facilities from the bowl games. When financing responsibilities for facilities or events are shared, the economic benefit (or outcome) is proportionately attributed among the public contributors. In this case, EDR found that the Professional Sports Franchise incentive provided 26% of the public financing for the 8 facilities, while the local governments contributed the remaining 74%. Based on the proportions of state and local financing, the analysis attributes 602,246 out-of-state visitors to the state incentive. Including the bowl game attendees, total out-of-state visitors due to the state’s share rose to 721,722. The Professional Sports Facilities Incentive Program has a projected ROI of 0.30. For every dollar spent through the incentive, the state of Florida received 30 cents in tax revenue. In addition, the state incentive caused Florida’s Real GDP to increase by about $369.9 million and caused Real Disposable Personal Income to grow by $295.1 million during the review window. The program attracted the greatest number of out-of-state visitors in the study, but came in with only the 2nd highest ROI. This was due mainly to the cost of the program. The program cost the state $16 million per year during the study window. In contrast, the Florida Sports Foundation Grant program cost the state, on average, less than $1 million per year during the study window.
39
See The Impact of Oriole Park at Camden Yards on Maryland’s Economy, 2006 & Seattle Seahawks Economic Impact, 1996.
21
SPRING TRAINING BASEBALL FRANCHISE INCENTIVE
Program Description… The Spring Training Baseball Franchise incentive is the state’s funding mechanism to attract and retain facilities for Major League Baseball (MLB) spring training in Florida. Qualified applicants are eligible for up to $500,000 million annually for 15 years. These dollars are typically pledged with designated Tourist Development Tax revenue and other local government resources to secure bonds to fund the acquisition, construction, reconstruction or renovation of spring training facilities. In 1988, the Florida Legislature established the first state incentive to attract professional franchises to the state. In 1991, the law was significantly revised and expanded to include an incentive for spring training baseball franchises. Certification criteria for the spring training franchise incentive included a commitment by the franchise to use the facility for fifteen years, projections for paid attendance (at least 50,000 annually), demonstration of the financial capability to provide more than one-half of the costs incurred or related to the improvement or development of the facility, proof that the facility was located within 20 miles of an interstate or other limited-access highway system, and a requirement that the county levy a four-percent Tourist Development Tax, with 87.5 percent of the proceeds dedicated for the construction of the complex.40 This law also limited the total number of awards for both the professional sports franchises and new spring training franchises to six, and prohibited facilities from receiving more than one award. In 1999, the Legislature extended the use of the Professional Sports and Additional Professional Sports Tourist Development Taxes to fund debt service on spring training franchise facilities. 41 At that point, no local governments had applied for the incentive. In 2000, the law was amended to limit the incentive to “retained” rather than “new” spring training franchises, delete the requirement that the facility be located within 20 miles of an interstate or other limited-access highway system, and to establish ranking criteria for awards. The awards were limited to publically-owned facilities and were authorized for in-state relocations provided certain conditions were met. The law also imposed a cap of five awards.42 In 2006, the number of authorized awards for spring training facilities was expanded from five to ten, with the imposition of additional certification criteria. Counties were authorized to use up to $2 million of their local option half-cent sales tax revenues annually to fund facilities for new or retained professional sports franchises and facilities for retained spring training franchises. 43 The scope of the incentive was expanded in 2010, to include any spring training franchise rather than only “retained” spring training franchises. 44 By August 2012, ten facilities were certified for the incentive.45
40
Ch. 91-274, L.O.F. 41
Section 1, ch. 99-287, L.O.F 42
Ch. 2000-186, L.O.F. 43
Ch. 2006-262, L.O.F. 44
Ch. 2010-140, L.O.F. Also, provisions relating to the spring training incentive were transferred from s. 288.1162 to newly created s. 288.11621, F.S. 45
Lee County was certified for the tenth award in August 2012 with the first payment scheduled for July 2013. Consequently, the facility was not included in this analysis.

22
Data For the analysis of the program, EDR obtained attendance figures, by team, from the official Florida’s Grapefruit League website, which is maintained by the Florida Sports Foundation.46 In addition, EDR reviewed the “2009 Major League Baseball Florida Spring Training Economic Impact Study,” which provided an estimate of out-of-state visitors whose primary reason for visiting Florida was to attend Spring Training games. 47 The study also included information on average party size, average expenditure amount per party per day, and length of stay for these out-of-state visitors. EDR also reviewed DOR data on the sales tax distribution for each Spring Training Sports Facilities recipient.
In addition, EDR examined the bond documents associated with the building or renovation of the qualified facilities. The bond documents helped identify the proportions financed through local sources and the state’s sales tax distribution. Analysis and Findings…
Using the 2009 MLB Florida Spring Training Economic Impact Study, the analysis estimated the percentage of out-of-state visitors whose primary reason for visiting Florida was Spring Training. In the three-year window, this totaled 358,917 visitors to Florida. The analysis attributes only 22% of these visitors to the state incentive. This was due to two reasons. First, local contributions were the primary source of financing for these Spring Training facilities. Second, a few of the facilities did not receive the sales tax distribution and were excluded from the analysis. The impact study’s expenditure amount per party and average number of nights stayed were used to measure the dollar amount that each visitor contributed to the Florida economy.
46
http://www.floridagrapefruitleague.com 47
The Bonn Marketing Research Group, Inc.
Statewide Economic Model Impact of the Spring Training Franchise Incentive Program
2010 - 11 2011 - 12 2012 - 13 Total
4.2 4.2 4.2 12.6
0.2 0.6 0.7 1.4
0.0 0.1 0.2
Return-on-Investment for the 3 year period 0.11
2010 - 11 2011 - 12 2012 - 13 Total
Average
per Year
Personal Income Nominal $ (M) 0.6 9.6 13.6 23.8 7.9
Real Disposable Personal Income Fixed 2009 $ (M) 0.9 8.7 11.6 21.1 7.0
Real Gross Domestic Product Fixed 2009 $ (M) 2.7 13.3 16.9 32.9 11.0
Consumption by Households and Government Fixed 2009 $ (M) (4.8) 1.6 7.0 3.8 1.3
Real Output Fixed 2009 $ (M) 1.8 15.0 19.8 36.6 12.2
2010 - 11 2011 - 12 2012 - 13 Minimum Maximum
Average
per Year
Total Employment Jobs 16 93 109 16 109 73
Population Persons (16) (32) (32) (32) (16) (27)
State Payments in the Window $ (M)
Total Net State Revenues $ (M)
Return-on-Investment by Year

23
During the study window, one of the recipient facilities was under renovation. Construction expenditures benefit the state through additional tax revenue, personal income and GDP growth. The analysis estimated the state’s share of the construction expenditures and included it in the impact. Spring Training Franchise Incentive Program has a projected ROI of 0.11. For every dollar spent on the program, the state of Florida received 11 cents in tax revenue. In addition, the program increased Florida’s Real GDP by $32.9 million and caused Real Disposable Personal Income to grow by $21.1 million during the review window. The program attracted the 3rd greatest number of out-of-state visitors in the study and came in with the 3rd highest ROI.

24
PROFESSONAL GOLF HALL OF FAME FACILITY INCENTIVE
Program Description… World Golf Foundation, Inc., was established in 1994 as a non-profit with the purpose of constructing and operating the World Golf Hall of Fame facility in Northeast Florida. The $48.6 million facility was completed and opened to the public in May, 1998. The World Golf Hall of Fame was originally located in North Carolina and was owned and operated by the PGA of America.48 In 1993, the Legislature authorized a funding mechanism for financing this sports-destination facility, which is part of the “World Golf Village” project, a “vacation destination with two championship golf courses, high-end accommodations and several other amenities.”49 The project was initially financed by the St. Johns County Industrial Development Authority. In the enacting legislation, the Legislature determined the “facility would receive national and international media promotion and attention to the extent of promoting the quality of life in Florida, so as to attract national and international tourists and sports-related industry…”50 In 1998, the Florida Department of Commerce certified the World Golf Foundation as eligible for $50 million in state sales tax revenue, to be distributed over 25 years, to cover the financed construction costs related to the Professional Golf Hall of Fame. The 75,000 sq. ft. facility contains a cafeteria, gift shop and IMAX Theater. Certification criteria included:
Projections that the professional golf hall of fame facility will attract a paid attendance of more than 300,000 annually.
An independent analysis or study which demonstrates that the amount of the revenues generated by sales and use taxes with respect to the use and operation of the facility will equal or exceed $2 million annually.
An agreement by the applicant to provide $2 million annually in national and international media promotion of the professional golf hall of fame facility, Florida, and Florida tourism, through the PGA Tour, Inc., or its affiliates, at the then-current commercial rate, during the period of time that the facility receives funding from the state.
Documentation that the applicant has provided, is capable of providing, or has financial or other commitments to provide more than one-half of the costs incurred or related to the improvement and development of the facility.
Use of the state funds was restricted to costs related to the construction, reconstruction, renovation, promotion, or operation of the facility. The last scheduled distribution to St. Johns County Industrial Development Authority is June 2023. The law also required the department to recertify every 10 years that the facility is open, continues to be the only professional golf hall of fame in the United States recognized by the PGA Tour, Inc., and is
48
See http://www.worldgolfhalloffame.org 49
Chapter 93-233, L.O.F., creating s. 288.1168, F.S. & s. 212.20(6)(d)7.c., F.S. See http://www.worldgolfhalloffame.org/about-the-museum/our-history/ 50
Ch. 93-233, L.O.F.

25
meeting the minimum projections for attendance or sales tax revenue as required at the time of original certification. Data For the analysis of the program, EDR requested the World of Golf Hall of Fame provide information on total tickets purchased to the Hall of Fame, total number of ticket purchased by Florida residents, and total number of youth tickets purchased to these events. The museum provided attendance numbers, but was unable to provide information concerning out-of-state visitors. In lieu of obtaining actual out-of-state visitor counts, EDR reviewed an alternative source to estimate visitor information to cultural events in Florida: “Arts & Economic Prosperity III: The Economic Impact of Nonprofit Arts and Culture Organizations and Their Audiences in the State of Florida.” 51 EDR also reviewed DOR data on the sales tax distribution for the World of Golf Foundation.
In addition, EDR examined the bond documents associated with construction of the World Golf Village. The bond documents helped identify the proportions financed through local sources and the state’s sales tax distribution. Analysis and Findings…
The EDR survey of the World of Golf Hall of Fame produced a total attendance number, but it was unable to provide an out-of-state visitor number. Instead, EDR relied on an alternative source: “Arts & Economic Prosperity III: The Economic Impact of Nonprofit Arts and Culture Organizations and Their Audiences in the State of Florida.” This report estimated the percentage of out-of-state visitors who visited museums or cultural events to be 15.6%.
51
The report was commissioned by Americans for Arts.
Statewide Economic Model Impact of the World of Golf Hall of Fame & Museum
2010 - 11 2011 - 12 2012 - 13 Total
2.0 2.0 2.0 6.0
(0.1) (0.2) (0.2) (0.5)
-0.1 -0.1 -0.1
Return-on-Investment for the 3 year period (0.08)
2010 - 11 2011 - 12 2012 - 13 Total
Average
per Year
Personal Income Nominal $ (M) (5.6) (8.0) (7.2) (20.8) (6.9)
Real Disposable Personal Income Fixed 2009 $ (M) (4.6) (6.5) (5.8) (16.8) (5.6)
Real Gross Domestic Product Fixed 2009 $ (M) (4.7) (6.2) (5.0) (15.9) (5.3)
Consumption by Households and Government Fixed 2009 $ (M) (7.1) (9.9) (8.2) (25.2) (8.4)
Real Output Fixed 2009 $ (M) (7.1) (9.3) (7.3) (23.6) (7.9)
2010 - 11 2011 - 12 2012 - 13 Minimum Maximum
Average
per Year
Total Employment Jobs (38) (42) (24) (42) (24) (34)
Population Persons 0 (14) (44) (44) 0 (19)
State Payments in the Window $ (M)
Total Net State Revenues $ (M)
Return-on-Investment by Year

26
EDR examined the bond documents associated with the construction of the World Golf Village. The bond documents helped identify the amount financed by the state. The analysis attributes 53.82% of the out-of-state visitors to the state. This totaled 39,948 out-of-state visitors within the study window. Unlike the previous programs, the analysis does not attribute all of a visitor’s stay in Florida to the Hall of Fame. The Hall of Fame is just one of the many attractions at the World Golf Village, which also includes golf courses, convention space and a luxury hotel. The analysis assumed that all of these attractions contributed to the visitor’s decision to vacation in Florida. Therefore, the analysis only attributed one day to each estimated out-of-state visitor. The World of Golf Facility Incentive has a projected negative ROI of -0.08. For every dollar spent on the program, the state of Florida lost 8 cents of tax revenue. The primary reason for the negative ROI is the limited number of visitors the World of Golf Hall of Fame was able to attract during the study period in exchange for the strong financial commitment by the state. The state’s financial commitment also diverts spending away from other state programs that may have a higher ROI.

27
INTERNATIONAL GAME FISH ASSOCIATION WORLD CENTER
Program Description… As declared in its mission statement, the International Game Fish Association (IGFA) is a not-for-profit organization “committed to the conservation of game fish and the promotion of responsible, ethical angling practices through science, education, rule making and record keeping.”52 First formed in 1939, its headquarters was located in New York. In the late 1950’s, IGFA moved from New York to Florida, first to Miami, then in 1967 to Fort Lauderdale, in 1992 to Pompano Beach, and in 1999 to the IGFA Fishing Hall of Fame & Museum in Dania Beach. In 1996, the Legislature authorized a funding mechanism for financing this new sports-destination facility, with the understanding it would be collocated with Bass Pro Shops/Outdoor World, a privately held retailer of hunting, fishing, camping and related outdoor recreation merchandise. The 160,000 sq. ft. Outdoor World opened in 1998, and continues to provide a mix of entertainment, retailing and a full service restaurant. In the enacting legislation, the Legislature determined the entire “project would, in addition to educational, tax, environmental, and job opportunity enhancement, accomplish the goals established for sports promotion in the state…”53 In 2000, the Florida Department of Commerce certified the International Game and Fish Association as eligible for $15 million in state sales tax revenue, to be distributed over 14 years, to help finance the construction of the International Game Fish Association World Center. The 60,000 sq. ft. center contains the IGFA administrative headquarters, a fishing museum, Hall of Fame, historical displays and educational exhibits and facilities. Certification criteria included:
Projections that the IGFA World Center facility and the collocated private sector facility will attract an attendance of more than 1.8 million annually.
An independent analysis or study which demonstrates that the amount of the revenues generated by sales and use taxes with respect to the use and operation of the project (not just the IGFA facility) will exceed $1 million annually.
Projections that the project will attract more than 300,000 persons annually who are not residents of the state.
An agreement by the applicant to provide $500,000 annually in national and international media promotion of the facility, at the then-current commercial rates, during the period of time that the facility receives this funding from the state.
Documentation that the applicant has provided, and is capable of providing, or has financial or other commitments to provide, more than one-half of the cost incurred or related to the improvements and the development of the facility.
Use of the state funds was restricted to costs related to the construction, reconstruction, renovation, promotion, or operation of the facility. The IGFA received its last distribution in February 2014. The law also required the department to recertify every 10 years that the facility is open, continues to be the only international administrative headquarters, fishing museum, and Hall of Fame in the United
52
See http://www.igfa.org/About/Mission.aspx 53
Ch. 96-415, L.O.F.
28
States recognized by the International Game Fish Association, and that the project is meeting the minimum projections for attendance or sales tax revenues as required at the time of original certification. Data For the analysis of the program, EDR requested the IGFA provide information on total tickets purchased to the Hall of Fame, total number of tickets purchased by Florida residents, and total number of youth tickets purchased to these events. The museum provided attendance numbers, but was unable to provide information concerning out-of-state visitors. In lieu of obtaining actual out-of-state visitor counts, EDR reviewed an alternative source to estimate visitor information to cultural events in Florida: “Arts & Economic Prosperity III: The Economic Impact of Nonprofit Arts and Culture Organizations and Their Audiences in the State of Florida.” 54 EDR also reviewed DOR data on the sales tax distribution for the International Game & Fish Association. In addition, EDR examined the bond documents associated with the building or renovation of the facility. The bond documents helped identify the proportions financed through local sources and the state’s sales tax distribution. Analysis and Findings…
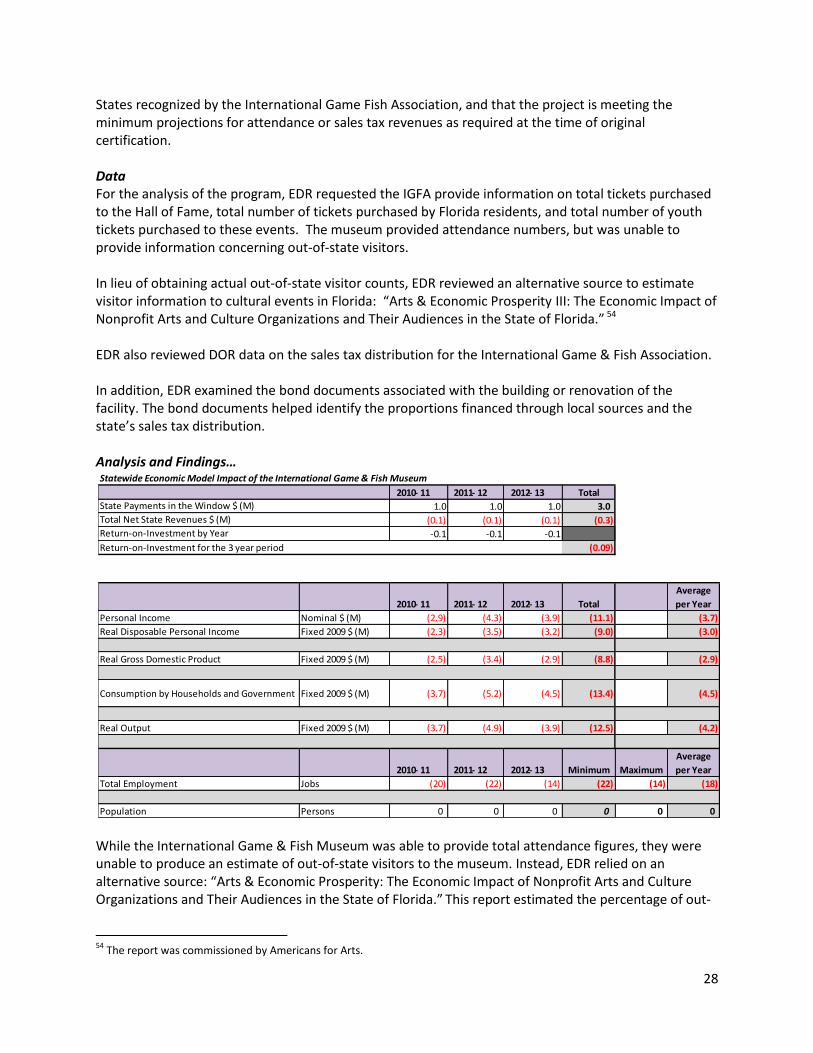
While the International Game & Fish Museum was able to provide total attendance figures, they were unable to produce an estimate of out-of-state visitors to the museum. Instead, EDR relied on an alternative source: “Arts & Economic Prosperity: The Economic Impact of Nonprofit Arts and Culture Organizations and Their Audiences in the State of Florida.” This report estimated the percentage of out-
54
The report was commissioned by Americans for Arts.
Statewide Economic Model Impact of the International Game & Fish Museum
2010 - 11 2011 - 12 2012 - 13 Total
1.0 1.0 1.0 3.0
(0.1) (0.1) (0.1) (0.3)
-0.1 -0.1 -0.1
Return-on-Investment for the 3 year period (0.09)
2010 - 11 2011 - 12 2012 - 13 Total
Average
per Year
Personal Income Nominal $ (M) (2.9) (4.3) (3.9) (11.1) (3.7)
Real Disposable Personal Income Fixed 2009 $ (M) (2.3) (3.5) (3.2) (9.0) (3.0)
Real Gross Domestic Product Fixed 2009 $ (M) (2.5) (3.4) (2.9) (8.8) (2.9)
Consumption by Households and Government Fixed 2009 $ (M) (3.7) (5.2) (4.5) (13.4) (4.5)
Real Output Fixed 2009 $ (M) (3.7) (4.9) (3.9) (12.5) (4.2)
2010 - 11 2011 - 12 2012 - 13 Minimum Maximum
Average
per Year
Total Employment Jobs (20) (22) (14) (22) (14) (18)
Population Persons 0 0 0 0 0 0
State Payments in the Window $ (M)
Total Net State Revenues $ (M)
Return-on-Investment by Year

29
of-state visitors who visited museums or cultural events to be 15.6%. Based on this, the analysis attributed 15,933 out-of-state visitors to the museum. The analysis did not consider the impact of the Bass Pro Shop/Outdoor World affiliated with the IGFA Museum. Bass Pro Shops/Outdoor World is a retail outlet, and retail stores are market dependent. Market dependent firms do not expand the statewide economy, but simply take market share from existing businesses. Therefore, there is no new state revenue resulting from their existence. However, EDR attributed 100% of IGFA out-of-state visitors to the state. EDR could not find any bond documents that identified a local source of financing. The IGFA Museum Incentive has a projected negative ROI of -0.09. For every dollar spent on the program, the state of Florida lost 9 cents of tax revenue. The primary reason for the negative ROI is the limited number of visitors the IGFA Museum was able to attract during the study period in exchange for the financial commitment by the state. The state’s financial commitment also diverts spending away from other state programs that may have a higher ROI.

1
Appendix One: Facilities Financing Most stadiums and sports facilities are financed with tax-exempt bonds, which are issued through state and local governments or other public entities such as regional sports authorities. Tax-exempt bonds allow issuers to take on debt at a lower interest rate compared to taxable bonds. In turn, the underwriter is able to get a better return on their investment because their earnings are exempt from federal income tax. The maturity structure for tax-exempt bonds is typically 20-30 years, so it is essentially a long-term debt that is paid back over time. Tax-exempt bonds are secured by pledged revenues which are usually generated from a tax or fee. The most commonly pledged revenues for sports facilities bonds are tourist development taxes, ad valorem taxes, and sales taxes. In a few instances, the bonds have been issued as general obligation debt, which means that all revenues of the issuer, regardless of the source, may be used to pay debt service, if needed. In Florida, the annual sales tax distributions for sports facilities financing have been used to secure tax-exempt bonds. Issuing bonds provides a large amount of cash up-front that can be used for capital investment. However, most of the bonds are issued with 30-year maturity structures, which mean that a large portion of the state funding is actually used to pay the interest cost of the debt. For example, a certified professional sports facility in Florida that receives $2 million a year for 30 years pledges this $60 million to pay debt service on $30 million of bonds issued. So, the state’s $60 million investment results in $30 million of up-front cash that can be used to construct or renovate a facility. The state’s investment for spring training facilities is significantly less. In most cases, certified spring training facilities receive $0.5 million each year for 30 years, which typically results in about $7.5 million of cash available for the state’s $15 million investment. In both programs, the amount of cash available varies up or down slightly by facility, depending on what interest rates were at the time bonds were issued. Most of these bonds were issued many years ago, and construction or renovations were completed well before the timeframe for analysis. Only the Orlando Magic and the Minnesota Twins had capital expenditures within the window. This means that within the timeframe, the state’s expenditures have mostly been used to pay debt service. When calculating the ROI for these programs, it is assumed that all activity at the facility within the window would not have occurred absent the initial construction or renovation of the facility. The return generated from the state’s initial investment in sports facilities will be measured as tax revenues generated from spending by out-of-state visitors to sporting events at the publicly-funded facilities. In addition to state sales tax distributions, all of the certified entities in Florida used other funding sources to complete the sports facilities projects. Most of the additional funding was provided through bonds issued by counties, cities, or regional sports authorities. The most commonly used local government revenue sources are county tourist development taxes,55 followed by local option sales taxes.56 In a few cases, proceeds from land sales or other non-ad-valorem revenues were also used. Because local governments also invested in these projects, the state cannot claim all of the benefits. In order to determine what portion of the return to attribute to the state, EDR estimated the portion of
55
To include the original and additional Tourist Development Taxes, the Professional Sports Franchise Facility Tax, and the Additional Professional Sports Franchise Facility Tax. Also, five counties may levy the High Tourism Impact tax, the revenues from which may be used to fund publicly-owned facilities. (s. 125.0104(3), F.S.) 56
Subject to referendum approval, local governments may use proceeds from the Local Government Infrastructure Surtax. (s. 212.55(2)(d)1.a., F.S.) Counties may also use up to $2 million annually of the local government half-cent sales tax allocated to them by the state. (s. 218.64(3), F.S.)

2
the initial investment that came from state funds. It is important to note that there is not one single source of comprehensive data about sports facilities financing that includes all associated costs and funding sources. In order to estimate the state’s share, EDR compiled information from many different sources, including the Florida Sports Foundation’s facility certification application files that included financing plans for the facilities, individual bond offering documents found in the Municipal Securities Rulemaking Board’s (MSRB) Electronic Municipal Market Access (EMMA) online database, and financial statements of local governments and regional sports authorities. EDR found that on average, the state funded 17.4% of pro sports facility projects and 37.4% of spring training facility projects. EDR also found that, in Florida, the average total cost (including interest costs) of pro sports facility was $419.5 million, which is substantially higher than the average total cost of a spring training facility which was $42.1 million.

3
Appendix Two: Assessing the Economic Benefits of Public Subsidies for Professional Sports Facilities --A Literature Review
INTRODUCTION In 2014, Howard and Crompton (2014, 133-179) observed that “(t)here is a long tradition in the U.S. of local governments assuming a substantial role in the financing, construction and operation of sport facilities.” The authors chart the evolution of facility funding from the 1950s to the present. From 1950 to 1970, the “Civic Development Era,” sixty-two percent of the 52 major league stadiums were publicly owned. Six new facilities were constructed in the 1950s, all publicly owned, as were 17 of the 25 new facilities constructed in the 1960s. These facilities are characterized as “basic, lacking amenities.” In the “Public Subsidy Era” from 1979 to 1984, eighteen of the 22 new facilities were publicly owned, and 2 were over 90 percent subsidized.57 From 1985 to 1994, the “Transitional Era,” local governments assumed a “progressively diminishing proportionate role in the financing of new sport facilities,” primarily because franchises developed new revenue sources, and Congress imposed restrictions on the use of tax exempt bonds for facility construction. Howard and Crompton (2014, 131) refer to the current period as the “Fully Loaded (Public-Private) Era,” characterized by:
“…a new generation of sport facilities that were filled with elaborate amenities and seating options designed to create new revenue opportunities: luxury suites, club seats, elaborate concessions, and even bars, restaurants and apartments with a view of the field.”
Santo (2010, 74-75, 83) refers to this period as the “Era of Escalation and Extravagance.” While some of these facilities were constructed for new or relocating franchises, he notes the majority were built as replacement facilities for existing teams, many for single-use (one sport, primarily MLB and NFL facilities). Another feature of this period is the increased integration of stadium construction into downtown redevelopment plans, which has contributed to the escalating costs of facilities. To fund these significantly more expensive facilities, there has been a substantial increase in the amount obligated by state and local governments, to an increasing degree financed with consumption taxes levied on non-residents. Especially in major media markets, new revenue-generating strategies have enabled some franchises to assume a greater share of the facility financing and burden. As to the evolving financing landscape, Long (2013, 153) notes that:
“…subsidy deals have become far more complex over the past few decades, including a number of different government entities -- moving beyond local and county to include multi-county and state participation, as well as quasi-public redevelopment of sports and tourism authorities…in an effort to spread the incidence of cost over a larger population base, and perhaps to insulate funding approval from local politics and referendum requirements…”
57
From an economic perspective, a “subsidy” is a grant of money made by government in aid of the promoters of any enterprise, work, or improvement in which the government desires to participate, or which is considered a proper subject for government aid, because such purpose is likely to be of benefit to the public. Black’s Law Dictionary, 5
th Edition, 1999.

4
Howard and Crompton’s (2014, 136 and 146) research shows that from 1990 through 2010, ninety-two major league stadiums and arenas were built or renovated across the U.S., with a total capital investment of $36.2 billion. Average cost per facilities increased from $284 million in the early 1990s to $718 million between 2005 and 2010. The public share of the cost for projects over these two decades was $19.9 billion, or 55 percent of the total expenditures. While the public share fell from 70 percent in the early 1990s to 47 percent between 2005 and 2010, the “amount per facility invested by government increased from $173 million to $300 million.” Assessing the economic benefit of public subsidies for these facilities, and professional sports in general, has generated a great deal of public attention over the past few decades. Economic impact studies commissioned by proponents claim these efforts result in economic benefits58 to area economies, beyond the public investment. In contrast, peer-reviewed research published in academic journals concludes otherwise.59 In their examination of public financing for professional sport facilities, Baade and Matheson (2011, 11) conclude:
“…(r)esearchers who have gone back and looked at economic data for localities that have hosted mega-events, attracted new franchises, or built new sports facilities have almost invariably found little or no economic benefits from spectator sports.”
While the focus of this research has been on professional sport facilities used during the regular season, there has also been a proliferation of construction for baseball spring training facilities in Arizona and Florida.60 For purposes of this review, EDR offers four observations:
Proponents of subsidies for spring training facilities use many of the same arguments to justify the incentives, as do the professional sports facility proponents;
The general observations and critiques of professional sports studies by academic economists apply to proponent economic impact studies for spring training facilities;
The magnitude of the public subsidy is typically lower for spring training facilities than that for regular season, professional sport facilities; and
Many of the subsidized spring training facilities are used for other purposes throughout the year, be it a ballpark for a minor league team, amateur tournaments, or other events.61
58
As used in these studies, economic benefits are the net increases in personal income and area gross domestic product, creation of new jobs and increases in tax revenue. For this review, a synonymous term is economic impact, which Agha and Rascher (2013, 3) define as “the net economic change in a local economy resulting from spending attributed to a given activity.” These terms are inclusive of, but differentiated from, the Return on Investment for the public contribution to a project used in the Florida Statues. This is measured soley in the form of tax revenue. 59
For illustrative purposes, it may be useful to view a comparative case study on the competing assessments of a recent high-profile project, the AT&T stadium in Arlington, Texas. The facility was initially estimated to cost $685 million. The city was to finance $325 million of the construction costs, with the team paying the remainder. The economic impact study commissioned by NFL’s Dallas Cowboys (and cited by the City of Arlington, Texas), concluded that “the economic impact of the stadium and team would be between $12.5 billion and $27.7 billion across 30 years.” Rosentraub and Swindle (2009) provided an alternative assessment, which “projected a loss of approximately $290 million across the same period of time.” Their research is instructive because it identifies the specific assumptions and research methodologies in conflict between the consultant’s economic impact study and those of peer-reviewed research by independent academics. 60
See Interim Report 2009-106, “Review of the Retained Spring Training Franchise Incentive Program,” Florida Senate Committee on Commerce, September 2008. http://archive.flsenate.gov/data/Publications/2009/Senate/reports/interim_reports/pdf/2009-106cm.pdf

5
Given the lack of academic research directly addressing the subsidization of spring training facilities, this report will not directly address the issue.62 The purpose of this review is to:
Review proponents’ assertions of the economic benefits of public subsidies for professional sports facilities, as evidenced by commissioned economic impact studies identified in the academic literature;
Survey literature reviews of peer-reviewed research by independent academic economists assessing the economic benefit of professional sports franchises in general, and public subsidies for related facilities in particular;
Identify efforts to measure the social, largely intangible benefits of public subsidies for professional sports facilities;
Offer a general explanation for the apparent inconsistency between the conclusions of proponents’ studies and independent research;
Discuss the primary issues related to measuring economic benefit;
Review additional misapplications and omissions of proponent studies, as identified in academic literature; and
Identify approaches to apportioning economic benefit. PROPONENT ASSERTIONS In their review of economic impact studies, academic economists identify the positive outcomes subsidy proponents attribute to professional sports franchises and facilities.63 These outcomes include:
Job creation, both during stadium construction and on-going operation of the facility;
New spending in the community, both during facility construction and from attendees when the facility is completed, and subsequently though the “multiplier effect” of the initial spending;
Expansion of tourism induced by the facility, with associated spending;
Redevelopment of economically depressed areas;
Increased revenues , which offsets the initial and ongoing public investment in the facility, in the form of revenues from leases; sales taxes on construction material, event tickets, concessions and spending outside the facility; and increases in ad valorem taxes from appreciating adjacent properties benefiting from the presence of the facility; and
61
Agha and Rischer (2013, 17) suggest that minor league teams may be more successful than others in utilizing the venue for alternative events that drive economic activity. 62
There is one definitive study published by John Zipp in 1997, where he measured the impact the major league baseball strike of 1994-95 on spring training in Florida. In 1995, the teams fielded replacement players in lieu of the striking major league players. Zipp found that:
“The most general conclusion that can be drawn from the foregoing analysis is that, whatever losses in tourism occurred with replacement spring training in 1995, these did not have a noticeable negative impact on one indicator of economic performance -- taxable sales -- in the Florida counties that host spring training. In contrast, how these counties did in the spring of 1995 is largely a function of how they did previously. This seems to indicate that, even in the relatively small economies of these Florida counties, professional sports can produce rather limited economic benefits. See “Spring Training” in Noll and Zimbalist (1997, 446)
63 See Long 2013, 7-11; Coates and Humphreys 2014, 268-269, 287; Noll and Zimbalist 1997, 1-2; Rosentraub, 2010, 1 and 4;
1999, 3; Rosentraub in Noll and Zimbalist 1997, 179; Groothius 2004, 516; Rappaport and Wilkerson 2001, 55; Sanderson 2000; Siegfried and Zimbalist 2000, 99; Coakley 1998, 343-344; Zipp 1996, 159, 178-179; and Finerty 1991, 313.

6
Generation of “social capital” through the presence of a professional team and increased national media exposure, which together expand tourism, facilitate economic growth (the “Big League City” effect), improve quality of life, make cities more attractive places to live and work; and promote civic pride.
Proponent assertions have evolved in response to local goals, political climate and negative responses from skeptics. Long (2013, 38) observes that over the past decade, advocates have “recast the subsidy rational away from economic development toward a combination of urban development and psycho-social benefits, where facilities are positioned as catalysts for downtown revitalization, as well as important sources of civic pride and social cohesion.” SURVEY OF PEER-REVIEWED RESEARCH
There is an abundance of peer-reviewed research by independent academic economists assessing the economic benefit of professional sports franchises on the local economy in general, and public subsidies for related facilities in particular. In general, summaries of the literature reviews regarding this research are consistent with the recent conclusions of Howard and Crompton (2014, 224-5):
“The findings of those who have independently evaluated the economic impact resulting from large public subsidies by local communities of pro sports team facilities, free from the pressures of a commissioning sponsor, are not encouraging. The findings from a series of such studies conducted in a variety of contexts by different investigators in the past twenty years consistently report that there is no statistical relationship between sport facility construction and economic development or job creation.”
Agha and Rascher (2013, 1 and 21) agree, noting that:
“Despite the lofty perception that teams and professional sporting leagues are useful economic development tools, most academic research has failed to support this contention. Ex post analysis of professional sports teams on a variety of economic indicators imply almost entirely insignificant or negative effects.
In her analyses of public-private partnerships for major league sports facilities, Long (2013, 4 and 197-8) concludes that:
“…a plethora of cost-benefit analyses have convincingly concluded that sports facilities are in fact poor public investments….By 2001, nearly two decades of economic cost-benefit analyses produced widespread consensus that sports facilities provide negligible net new economic benefits, and in the few cases where they do, such efforts are highly localized within the immediate area of the facility.”
Similarly, Coates (2007, 575-576) found that in those instances where there is some evidence of economic benefit, the positive effect:
“..tends to be focused on small geographic areas. Rather than being evidence of development effects, these results indicate redistribution from one area to another within a region. Calls for stadiums and arenas to be studied in the context where they will be most effective, in the central city, are implicit arguments for redistribution. Results suggesting that stadiums and

7
arenas are successful in anchoring downtown development are often accurately interpreted as evidence that redistribution has occurred.
Baade (2010, 191 & 192) finds “the consensus of scholars is that subsidies for sports franchises and mega-event do not induce economic development on a scale that justifies them.” While he acknowledges that some researchers in related disciplines argue that sports facilities, in the right context, may induce economic development, Baade concludes that “the ability of sports to do so alone is doubtful.” In 2008, Coates and Humphreys (2008, 310) acknowledged that although:
“…the intuitive argument and survey evidence do not deny the possibility of certain local economic benefits from sports subsidies, the empirical findings also strongly reject sports subsidies on the grounds of a lack of economic benefits. The large and growing peer-reviewed economics literature on the economic impacts of stadiums, arenas, sports franchises, and sport mega-events has consistently found no substantial evidence of increased jobs, incomes, or tax revenues for a community associated with any of these things. Focusing our attention on research done by economists, as opposed to that of scholars from public policy or urban development and planning departments, we find near unanimity in the conclusion that stadiums, arenas and sports franchises have no consistent, positive impact on jobs, income, and tax revenues.
Similarly, Baade, Bauman and Matheson (2008, 798) find that “ex post analyses of stadiums and franchises…generally find little or no economic benefits from professional sports teams or new playing facilities.” For Johnson, Groothuis and Whitehead (2001, 7), the “research is clear. Stadiums and professional sports do not generate significant increases in income.” Siegfried and Zimbalist (2000, 103) observe that “Few fields of empirical economic research offer virtual unanimity of findings… independent work on the economic impact of stadiums and arenas has uniformly found that there is no statistically significant positive correlation between sports facility construction and economic development. In 1997, Noll & Zimbalist (1997, 496) collaborated with fifteen academics to examine the economic impact of sports teams and stadiums on local and regional economies. They found that the studies compiled in the resulting book “uniformly conclude that metropolitan and central city economic development is not likely to be affected by a sports team or facility.” Baade and Sanderson (96), collaborators in the project, found that “In general, independent scholarship has concluded that studies claiming substantial contributions to the local and regional economies from professional sports systematically exaggerate the real contribution.” These conclusions are consistent with Zipp’s survey of the research (1996, 160), where he finds that:
“…scholarly researchers have found that teams and stadiums generate few economic benefits for their locales….In a series of analyses covering all or part of the last three decades for different subsets of major-league cities, they found that hosting a team and/or building a new stadium had a negative (or had no positive) effect on the area’s share of regional personal

8
income and generally no effect on the area’s share of employment, capital formation, or value-added in manufacturing.”64
Finally, these conclusions appear to be consistent among peers. Gregory Mankiw, Professor and Chairman of the Economics Department at Harvard University, cites the 2006 Robert Whaples survey finding that 85% of 210 Ph.D. economists polled favored eliminating state and local government subsidies to professional sports franchises.65 The literature reviews highlighted above examined peer-reviewed research by academic economists measuring primarily tangible economic benefits, to include changes in taxable sales, income, employment and tax revenue. For a representative single summary of this research, published through 2007, see Coates and Humphreys (2008).66
RESEARCH REGARDING POSSIBLE SOCIAL CAPITAL OR INTANGIBLE BENEFITS
Proponents of public subsidies for professional sports facilities claim another benefit accruing to the host community from the presence of franchises: generation of social capital. Howard & Crompton (2014, 287-325) explain that social capital “relates to enhancing a community’s brand equity,”67 which has two dimensions:
External or indirect social capital which results in tangible benefits through the attraction of tourists and new businesses to the area, the result of media exposure and “image transfer” from sporting events;68 and
Internal social capital which results in intangible benefits in the form of community pride and self-esteem.69
As to the external social capital, the authors find (293, 298 & 312) that the “incremental contribution of a sports event, facility or teams to the image of those cities is likely to be relatively small…but proportionately more substantial” to the image of smaller cities. As for attracting business to an area, thereby functioning as a stimulus in economic development, they suggest “the probability of there being
64
Zipp’s (1996) unique initial individual contribution to the research was to measure the economic impact of the major league baseball strike of 1994 on the “retail trade and hotel room sales in the 24 U.S. cities hosting baseball franchises and in 4 control cities.” He found that “the strike had little, if any, economic impact on host cities.” Zipp replicated this approach in measuring the impact of the strike on Spring Training in Florida in 1995, where the teams fielded replacement players in lieu of the striking major league players. He found “that, whatever losses in tourism occurred with replacement spring training in 1995, these did not have a noticeable negative impact on one indicator of economic performance -- taxable sales -- in the Florida counties that host spring training. See “Spring Training” in Noll and Zimbalist (1997, 427-451) 65
See Greg Mankiw’s Blog, @ http://gregmankiw.blogspot.com/2009/02/news-flash-economists-agree.html Citing Robert Whaples (2006) “Do Economists agree on Anything? Yes! Economists’ Voice, The Berkeley Electronic Press. November, 2006 66
These major contributors include: Baade and Dye (1988 and 1990); Baade (1996); Rosentraub (1996 and 1997); Zipp in Noll and Zimbalist (1997); Baade and Sanderson (1997); Hudson (1999); Coates and Humphreys (1999, 2001, 2002, and 2003a); Gius and Johnson (2001); Nelson (2001); Miller (2002); Austrian and Rosentraub (2002); Santo (2005); Lavoie and Rodriguez (2005); and Lertwachara and Cochran (2007). Post-2007 research could include: Baade, Baumann and Matheson (2008); and Jasina and Rotthoff (2008). 67
Howard and Crompton define brand equity as “the strong and distinctive favorable attributes that people associate with the city in their memories.” (2014, 287) 68
Baade (in Pindus, Wial and Wolman 2010, 194-195) refers to this as economic “signaling.” 69
Howard and Crompton define community pride as the aggregation of “personal psychic income from their emotional attachment to a sport entity…”(303) which promotes social cohesion, an “important component in the collective experience of communities that ties residents together across race, gender, and economic lines.” (309) However, they note this cohesion “is likely to be ephemeral.” (312)

9
immediate and direct business gains is remote.” However, the authors offer that “there are four conduits through which sport facilities may induce positive business outcomes:”
Attraction from increased awareness;
Attracting talent;
Facilitated networking at sport facilities; and
Facilitated networking at mega-events.
Howard and Crompton (312-318) identify efforts to measure social capital benefits through the contingent valuation method (or CVM), “which places a dollar values on goods and services not exchanged in the marketplace” through surveys of area residents. They explain that:
“These benefits derive from two sources. First, private consumption benefits are enjoyed by those who attend a sports event, but perceive they receive more benefits from it than they pay for in the admission prices...Second, public consumption benefits, which refers to the ‘free riders’ who benefit from social capital emanating from a sports team or mega event, but do not compensate the property owners for the satisfaction and enjoyment they receive.”
They found that though the number of CVM studies is small, they “are unanimous in revealing that the social capital that residents perceive to accrue does not justify the magnitude of public tax expenditures on major league facilities and franchises.” Using CVM, Johnson, Groothuis and Whitehead (2001, 20) measured the value of public goods generated by an NHL team in Pittsburgh, finding that the value is far less than the cost of building a new arena. From this research, they conclude that “the value of public goods generated by major league sports teams may not be large enough to justify the large public subsidies typically offered to most stadiums and arenas built today.” Carlina and Coulson (2004, 26) use a different measurement approach, assessing the economic sacrifice people would accept in return for living in a “major league” city. They found that residents were willing to accept higher rents and lower wages for the privilege of living in central cities and metropolitan areas with franchises of the National Football League. The researchers concluded that:
“…the evidence provided in our study, the high valuation placed on other quality-of-life characteristics found in other studies, and the increased willingness to increase public funding for new NFL stadiums after losing a team are substantial evidence that the quality-of-life benefits associated with hosting an NFL team may justify the seemingly large public expenditures.
However, they caution that:
“…assessment of benefits and cost associated with sports teams is a complex problem. Despite our careful attempt to control for the many local factors that could affect rents, it’s possible that our estimate of the implicit price of NFL amenity is overstated because we failed to control for some factor that is positively correlated with the both the presence of an NFL team and rents. If this is the case, then our estimate of the benefits used in the cost-benefit analysis is overstated.

10
After re-estimating Carlino and Coulson’s model “using several alternative reasonable specifications, ” Coates, Humphreys and Zimbalist (2006, 125) found the presence of an NFL franchise did not increase rents for apartments in the center city. While Coates, Humphreys and Zimbalist stated they:
“…encourage economists to continue this line of research because we believe that these indirect and non-pecuniary benefits are an important component of the overall social benefits that flow from professional sports. However, we believe that the evidence presented by Carlino and Coulson is too weak to be used by public policy makers to justify billions of dollars of public spending on sports facilities.”
In response, Carlino and Coulson (2006, 132) found that Coates, Humphreys and Zimbalist’s modeling suggestions were “entirely unpersuasive, or they provide quite strong additional evidence of an NFL contribution to quality of life…” In his review of the academic literature, Irani (1997, 251) concludes that the “welfare gain” generated by publically funded facilities has been ignored. His research found a consumer surplus for baseball games resulting from publicly-funded stadiums, using 1972 to 1991 data on ticket prices and attendance. However, Irani notes that the “…welfare loss associated with financing the stadium through increased taxes was completely ignored in this study. Finally, it is not clear whether the estimated consumer surplus overstates or understates the true benefits of the stadium to the city.” In their measure of consumer surplus, Alexander, Kern and Neill (2000, 235) concluded that “for most franchises in baseball, football, basketball, and hockey, the consumers’ surplus from attending games may be insufficient to justify building a facility at public expense on benefit-cost grounds.” In his article “In Defense of New Sports Stadiums, Ball Parks and Arenas,” Sanderson (2000, 175 and 184) identifies a “set of alternative theoretical points and considerations” to explain the construction boom in the sports industry, and the public funding that enables the boom. He identifies the “natural economic forces” as well as considerations in three categories: (1) the extent to which public funding for sports stadiums is different than, or consistent with, changes in public sector commitments for other purposes over time; (2) welfare or surplus aspects; and (3) the presence of positive externalities and the public-goods nature of sports, which could justify public subsidies. While this last consideration is represented to some extent in the academic literature, and to a large degree in proponent studies, Sanderson finds (188) there is “ample casual empirical evidence to suggest that the role of and interest in sports extends well beyond the turnstile tallies” which could justify public subsidies. As to the efficiency of public subsidies, he offers (189) an analogy:
“There are likely a number of activities that do not pass benefit-cost tests on the basis of direct scrutiny, but that are nevertheless socially efficient in a broader context. Sports teams and facilities may be one, recycling programs another. Studies suggest that, on average, recycling is an economic loser because the total collection costs exceed the value of the materials to be recycled. But people, even armed with that information, and knowing that recycling is implicitly taking away from other worthwhile foregone alternatives, such as more police, parks, and street repairs, or even a tax rebate, may still vote to continue recycling their newspapers, cans and bottles because the "feel-good" factor is sufficiently large. The corresponding question here is how large the feelgood factor of a professional franchise or a new stadium is, in terms of civic pride or even some "existence value."

11
Further, Sanderson concludes (192) “(i)t would not take much in the way of externalities, public good elements, consumer surpluses and an option value from a sports franchise to justify a commitment of, say, twenty to forty dollars a year per capita on debt service on a stadium.” In 2006, Rosentraub (2006, 289) calculated that the public subsidies for the three professional sport facilities in Cleveland cost each household $81.77 annually. He concluded that “if the three teams produced at least $6.81 in intangible benefits for each household each month, the investment by the county would be revenue neutral.” While acknowledging (2010, 3) that current sports-related development simply changes where people spend money, Rosentraub (2010, 25) argues for “shrewd investments” in social capital -- sports, entertainment, and cultural amenities -- to leverage development, as they are assets necessary to “attract and retain the human capital necessary to build a twenty-first century economy.” In their own research, Rappaport and Wilkerson’s found (2001, 70) that “the public outlay on current sports projects far exceed any associated jobs and tax benefits.” However, they conclude (77) that a “strong case can be made…that the quality of life benefits from hosting a major league team can sometimes justify the large public outlay associated with doing so.” While they note (72) that “valuing the happiness metro area residents derive from the presence of a major league team is extremely difficult…” they conclude (77) that:
“…if the contribution to metro area residents’ happiness from hosting a major league sports franchise is similar in magnitude to that from an additional day of pleasant weather per year, the net present value quality-of-life benefit may indeed approach the magnitude of recent public outlays on sports facility construction.”
Noll and Zimbalist (1997, 58) conclude externalities are “extremely difficult to quantify.” Long (2013, 179) suggests that while intangible symbolic benefits are probably significant, they “are very difficult to measure and irregularly distributed in favor of sports industry producers and consumers.” Siegfried and Zimbalist (2000, 101-103) find that to the extent that subsidies result in a consumer surplus, the beneficiaries “tend to be of higher-than-average income.” In addition, proponent efforts to substantiate the positive economic benefits of a facility “suggest that, on balance, the perception is that the value of consumer surplus and externalities falls short of the requested subsidy level.” Zipp (1996, 179) questions whether the assumption that the presence of a professional sports team in a community benefits the “psychological health and civic pride” of community residents is valid. First, is this benefit is widely distributed across the different groups in the community? Second, the value of this benefit may be subordinate to other sources of civic pride and identity. Weighing the negligible or negative tangible economic benefits against the perceived, positive intangible benefits is necessary to make informed decisions concerning public subsidies for professional sports facilities. In hearings addressing proposed legislation in 1999 before US Senate Committee on the Judiciary to limit the use of public funds in professional sports facilities, Andrew Zimbalist offered the following perspective:
“Although teams and leagues often hire consulting firms to publicize purported positive economic impact from sports stadiums, all independent academic studies have found that there is no statistically significant positive effect from having a new team or stadium on an area's

12
economy. This fact alone does not mean that there should be no public subsidization of new stadium construction. If the voting public in an area believes that having a new facility or team would enhance the local culture and create a positive consumption value for its citizens, then the public may very well decide to expend tax dollars in support of sports teams--much the same way they may decide to use public funds for park construction (albeit in the case of sports teams the subsidies are eventually appropriated by the private owners of the franchises). The voters, however, need to understand that they are voting for cultural, not economic, value.”
From Noll and Zimbalist’s (1997, 73) perspective, the:
“…relevant question is not whether a pro sports team makes a city more attractive for corporate executives, but whether the most effective way to spend $200 million to $300 million with a view to attracting new business is to build a new stadium to attract a team.”
Finally, Coates (2008, 575-576) concludes that:
“Measures of the consumer surplus and public benefits of stadiums and franchises are often substantial. As large as these benefits are, rough calculations indicate that they are not necessarily large enough to justify subsidies of hundreds of millions of dollars.
GENERAL EXPLANATIONS FOR THE INCONSISTENT CONCLUSIONS
In 2000, Siegfried and Zimbalist (2000, 103) observed that:
“Few fields of empirical economic research offer virtual unanimity of findings. Yet, independent work on the economic impact of stadiums and arenas has uniformly found that there is no statistically significant positive correlation between sports facility construction and economic development. …These results stand in distinct contrast to the promotional studies that are typically done by consulting firms under the hire of teams or local chambers of commerce supporting facility development.
Independent academic economists offer six general reasons for these conflicting results. First, the economic impact studies commissioned by proponents of projects or programs typically measure gross economic activity rather than net economic impact.70 These studies, in whole or in part, do not adequately account for the substitution effect and leakages in spending, and do not address opportunity costs and other conditions that affect or inform the measure of economic impact. Ignoring these factors has significant implications in calculation of economic impact. To illustrate, Hudson (2001, 29 and 32) examined 19 economic impact studies for 13 projects to account for the variation in estimates of economic impact of major league sports teams. All but one of the studies was financed by subsidy proponents. Hudson found that none of the studies accounted for
70
Net impact is a measure of change, expansion or contraction, to the area economy; gross impact is a measure of economic activity, attributed to, in this case, a facility. Gross impact does not result in a net impact, unless it results in a change to the area economy. Weisbrod and Weisbrod (1997, 11) state that economic impact studies should avoid confusing the economic role (gross effect) of a facility or project from its net impact on the area economy. See Howard and Crompton 2014, 197; Baade, in Pindus, Wail and Wolman 2010, 186-187; Rosentraub and Swindell, 2009, 323; Crompton 2006, 71; Hudson 2001, 27-28; Zimbalist 2000, 19; Noll and Zimbalist 1997, 68-75; Baade and Sanderson in Noll and Zimbalist 1997, 97; Zimmerman in Noll and Zimbalist 1997, 142; Zimbalist 1998, 19-20; and Burns and Mules 1986a, 12. As to measuring revenues, see Noll and Zimbalist 1997, 14-17.
13
opportunity costs. More important, 13 of the 19 studies included local resident spending in their estimates, and 15 studies included spending by “casuals,” who are visitors in the area for other purposes that elect to attend the game instead of doing something else. Ignoring this substitute spending resulted in measures of gross rather than net impact, leading to overstatements of economic impact. Hudson’s findings may not be surprising, as Crompton (2006, 71) notes that consultant studies often do not claim to measure net economic impact. Rather, such studies state their conclusions are based on measures of:
“…economic activity…total annual spending, gross economic impact, economic surge, gross economic output, gross economic value, total contribution to the economy, economic significance or some other analogous phrase that facilitates the incorporation of local residents’ expenditures into their analyses.”
A second explanation for conflicting results is that economic impact studies are commissioned and funded by proponents, advocates, interested parties, and beneficiaries, which, as observed by Coates and Humphreys (2004, 3), “invariably reflect the desires of the people who commissioned them.” 71 Howard and Crompton (2004, 154-155) conclude that:
“Economic impact studies are not value-free tools, because their results are dependent upon the assumptions that guide the analysis, assumptions that invariably agree with those of the study sponsor. Most economic impact studies are commissioned by sponsors who seek numbers that will support their advocacy position. Unfortunately, this often leads those undertaking the studies to adopt procedures and underlying assumptions that substantially bias the results in a direction desired by the sponsors. Indeed, most of these reports should be viewed as political documents designed to support an advocacy position rather than as legitimate studies of economic impact.”
Some have rationalized the discrepancies between consultant studies and academics by analogizing the role of the consultant as the expert witness in a lawsuit “who comes to testify in support of the side that is paying the expert’s bill…,” or as a lawyer, representing a client by presenting “findings in the best light, hopefully short of being overtly misleading.”72 Long (2005, 139) argues that because of the inherent conflict of interest between consultants and study sponsors, “it falls to the academy to monitor subsidy deals and to demand the ex ante analyses and increased transparency that will lead to better decision making.”
Third, the author’s academic discipline may influence research findings. Coates and Humphreys (2008, 301) observe that:
“The individuals who either do not hold a doctorate in economics or have not worked in economics departments or whose research is published primarily in public policy or urban or regional science journals tend to reach conclusions generally at odds with “economist”
71
Also see Howard and Crompton 2014, 187-190; Baade, in Pindus, Wail and Wolman 2010, 173; Santo 2010, 57; Crompton 2006, 68-70; 1995, 15-18; Coates and Humphreys 2000, 17; and Zimbalist 1998, 19. 72
Howard and Crompton (2014, 190) citing Curtis (1993, 7) and Crompton (2006, 80) citing personal communication with Daniel Stynes of Michigan State.

14
authors—that is, those that hold a doctorate in economics, work or have worked primarily in economics departments, or publish predominantly in economics journals.”
Other disciplines may emphasize different aspects of facility projects, such as downtown revitalization, or may attribute more weight to intangible outcomes.
Fourth, unlike consultant studies, research by academic economists is subject to peer review before publication. The “client” is the academic community rather than project proponents, serving as a check on research methods or assumptions that deviate from accepted academic norms. Coates and Humphreys (2008, 302) understand this factor as important, observing that:
“…(t)here now exists almost twenty years of research on the economic impact of professional sports franchises and facilities on the local economy. The results in this literature are strikingly consistent. No matter what cities or geographical areas are examined, no matter what estimators are used, no matter what model specifications are used, and no matter what variables are used, articles published in peer reviewed economics journals contain almost no evidence that professional sports franchises and facilities have a measurable economic impact on the economy.”
Fifth, proponent studies are prospective, relying on conclusions drawn from predictive input-output models to project the economic impact of facility construction and franchise operations. Academic peer-reviewed research is typically retrospective, based on an evaluation of actual outcomes. Finally, proponent studies fail to acknowledge that while professional sport teams may be “big business” in popular culture or local areas, they are actually relatively modest-sized operations.73
As such, they are unlikely to have significant regional or statewide impact predicted in consultant studies. Zimbalist (2014, 1) observes that:
In 2011-12, for instance, the average NBA team generated approximately $130 million in revenue. This equals less than 0.03 percent of the disposable income of New York City. The typical front office of a team employs 70 to 140 people on a full-time basis. Most of the other employees work game days, meaning roughly four hours per game for between 10 and 81 home games per year, depending on the sport. Game day workers (in concessions, catering, ticket sales, ushering, grounds keeping, security) generally number between 800 and 2,000. In the NFL, for instance, with 1,500 game day employees, each working 40 hours per season, there’s a total of 60,000 hours per year of work, or the equivalent of 30 full-time, year-round jobs. Moreover, these jobs are basically low-skill, low-wage, and without benefits.
While the value of pro franchises is significant, the revenues they generate are relatively modest.74 Combine team spending with realistic estimates of new spending by visitors attending sporting events,75 and the impact is still modest relative to the overall economy. Consequently, Santo (2010, 53) concludes “it would seem difficult to argue that stadiums and sporting events can service as economic engines.”
73
See Howard and Crompton 2014, 226; Santo, 2010, 50-52; Zimbalist 2013, 94; 1998, 18; Coates 2007, 569; Sanderson 2000, 174; Siegfried and Zimbalist 2000, 104; Zimbalist 2000, 18; Rosentraub 1999, 144-148; and Zipp 1996, 177. 74
Zimbalist (1998, 18) analogizes that such impact is “similar perhaps to the influence of a new department store.” 75
Agha and Rascher (2013, 16), note that Jones (2012) reports football stadiums are used an average of 23 days in a year and arenas are used an average of 197 days. Major league baseball stadiums host 81 regular season games.

15
MEASURING ECONOMIC BENEFIT The previous section offered a general explanation for the inconsistency between the conclusions of economic impact studies commissioned by proponents of public subsidies for professional sport franchises and peer-reviewed research by independent, academic economists. This section discusses the primary issues related to measuring economic benefit, as recognized in the academic literature.76 Substitution Effect on Event Spending77 First, there is consensus that tangible economic benefits to the area economy from subsidies for professional sports are primarily the result of new spending in the area economy associated with the franchise and facility. This new spending includes expenditures by visitors from out-of-area, to the extent that such spending would not have otherwise occurred absent attending the event. While very difficult to determine, new spending could also include “deflected” spending by in-area residents who would have otherwise spent the money out-of-area. New spending does not include expenditures by “casual visitors” or “time-switchers,” whose primary purpose for visiting is unrelated to the event. As defined by Agha and Rascher (2013, 4 and 5):
“Casuals” are visitors who visit the local economy for a reason besides the team and then decided to attend a game once they are in town; and
“Time switchers” are those visitors who were planning a trip to the local economy anyway and changed the timing of their trip to coincide with a game.
However, if casuals or time-switchers extend their planned visit to attend an event, Howard and Crompton (2104, 201) suggest the incremental increase of their expenditures may be considered new spending. New spending specifically excludes “substitute” spending by in-area residents. In this context, the “substitution effect” is described as spending limited disposable entertainment income in or about the sports facility rather than in other areas of the local economy, or increases in discretionary spending in one area of the economy at the expense of another. Academic economists identify this as one of the major errors in proponent economic analyses, resulting in a measure of gross rather than net economic impact. In testimony before the U.S. Senate Committee on the Judiciary in 1999, Zimbalist noted that in contrast to a manufacturing facility that exports goods, “most of the money that gets spent at a sports arena or sports facility is re-circulated money within the town.” At this same hearing, Rosentraub stated that spending related to sports facilities:
76
For overviews of this issue and discussion of related research, see Howard and Crompton 2014; Agha and Rascher 2013; Long 2013; Baade in Pindus, Wail and Wolman 2010; Rosentraub 2010, 1999; Santo 2010; Rosentraub and Swindell, 2009; Coates and Humphreys 2008, 2003; Coates 2008; Crompton 1995, 2006, 2013; Hudson 2001; Rappaport and Wilkerson 2001; Stynes 2001; Zaretsky 2001; Siegfried and Zimbalist 2000; Noll and Zimbalist 1997; Zipp 1996; and Burns and Mules 1986a. 77
See Howard and Crompton 2014, 192-202; Agha & Rascher 2013, 4-5, 8-10; Long 2013, 8-9; Baade and Matheson 2011, 8-15; Santo 2010, 57-58; Baade in Pindus, Wial and Wolman 2010, 186-188; Coates and Humphreys 2008, 298; Baade, Baumann and Matheson 2008, 796; Crompton 2006, 70-72; 1995, 26-29; Coates 2003, 7-8; Hudson 2001, 27-28, 37; Rosentraub 1999, 132-133; Siegfried and Zimbalist 2002, 363; Siegfried and Zimbalist 2000, 99-100; Rappaport and Wilkerson 2001, 62; Zaretsky 2001, 3; Johnson, Groothuis and Whitehead 2001, 7; Zimbalist in Rich 2000, 60; Sanderson 2000, 173; Noll and Zimbalist 1997, 55-75; and Burns and Mules 1986, 8-9, 12-13.

16
“…largely reshuffles existing spending for recreation among activities in a region. In other words, in the absence of a team, the money spent by people will continue to be expended for other recreational pursuits. To be sure teams do attract a number of visitors to a community to attend games. In addition, the presence of a team does encourage people to spend their discretionary income on local events as opposed to games or activities in other regions. The combination of economic development from both of these sources has been found to be quite small.”
Baade and Sanderson (in Noll and Zimbalist 1997, 112) agree, finding that over a 35 year period in 10 MSAs “professional sports realign economic activity within a city’s leisure industry rather than adding to it.” Santo (2010, 60) concludes that “stadiums do not create much new spending; they simply cause a reallocation of leisure spending.” 78 Facility Capital Expenditures New spending could also include capital expenditures related to facility construction. The impact of such spending is greater when surplus in-area contractors, services, and labor are used; 79 and made-in-area materials are purchased.80 Proponent studies frequently cite the economic benefits associated with facility construction. While individual construction firms, labor unions, and financiers may benefit, the net impact on the area economy will be negative or negligible if existing activity is displaced by the facility construction project. Noll and Zimbalist (1997, 60) conclude that:
“…if project workers would otherwise be employed at the same wage if the project were not undertaken, there is no net income arising from the public investment. Instead, the public investment is crowding out other activities of equal cost, and the workers are affected only insofar as the source of their income has changes.”
Miller’s research (2002, 170) appears to support this conclusion. He examined the St. Louis construction industry’s employment during the periods in which two professional sports facilities were being built. Miller found that “there was neither more nor less construction employment within the St. Louse MSA” during time the projects were being constructed. Instead of creating new construction jobs, “jobs were shifted from projects that would otherwise have been undertaken, resulting in no new job creation in the construction industry.” Miller’s findings are consistent with Long’s (2013, 180) observation that “most economic analyses demonstrate that sports facilities produce very few or no net new economic benefits relative to construction costs alone…”
78
As for estimates of out-of-area attendees, Siegfried and Zimbalist (2002, 363) state: “The experience of professional sports teams suggests a general range of 5% to 20% of attendance accounted for by people from outside the local area. Agha and Rischer (2013, 5) compiled figures for visitors from four studies, listing ranges from 5% to 52%. However, the sources in these studies of the figures greater than 20% were the teams, consultants, or local government -- not independent researchers. Agha and Rischer note that designation as a visitor depends on the definition of the local geographic area. Additionally, “mega-events” may draw more out-of-area attendees that regular sporting events. 79
See Zimbalist 2014, 96; Agha and Rascher 2013, 14; Crompton 2006, 70; Miller 2002, 161; Coakley 1998, 344; Noll and Zimbalist (1997, 61); and Rosentraub and Swindell 1991, 155. 80
Stynes (2001, 4) clarifies that “for goods that are manufactured outside of the area, only the retail margin and perhaps some portion of the wholesale and transportation margins” should be considered. “The cost (producer price) to the retailer or wholesaler of the good itself leaks immediately out of the region’s economy.” Also see Burns and Mules 1986, 12-13.
17
This may be due to a combination of additional factors. First, construction projects have a limited duration so the impacts are mostly transitory. Also, stadiums and arena project are likely to require some special materials, equipment, and subcontractors that would have to be imported into the local area, which results in higher leakages than routine construction projects. Leakages81 Spending associated with subsidized sport facilities tend to have higher leakages relative to other economic development projects, and programs or alternative uses of the funds. In this context, leakages refer to the amount of the new spending by visitors that leaves the local economy, either through the team’s spending (salaries and other operating expenditures) or the industries (hotels, restaurants, etc.) where new spending by event attendees occur. Team spending has relatively greater leakage, in part, because most of the proceeds from sports spending pays the salaries of owners, players and top administrators of the franchise, who may reside (and spend) outside of the host area, and likely invest much of their disposable salary. Most of the remaining sports jobs are part-time and low wage service sector jobs, which also have lower relative multipliers than other industries. Siegfried and Zimbalist (2000, 362) conclude that proponent studies “ignore or underestimate” these leakages, assuming that spending by franchises “has a similar effect on the local economy as spending on other consumption goods and services.” Similarly, Noll and Zimbalist (1997, 68 & 71) find that economic impact studies typically “overstate the extent to which the income generated by the team is retained in the local community...” and that “the magnitude of these external transfers and expenditures is substantial and varies enormously among sports and teams.” Similarly, Zipp (1996, 178) finds that “much of the fan spending associated with sports (on concessions, hotels, chain restaurants, and so forth) leaves the area almost instantly.” Opportunity Costs82 In this context, Howard and Crompton (2014, 256) define opportunity costs as “the benefits that would be forthcoming if the public resources committed to a sport project were (1) redirected to other public services, or (2) retained by the taxpayer.” Economic impact studies commissioned by proponents typically do not address the opportunity cost of the public subsidy for professional sports facilities. Identifying opportunity costs acknowledges that limited public funds spent to subsidize sports facilities will be at the expense of government spending for other projects or programs, or spending by individuals subject to taxation. Such public investments should be compared with the best feasible alternatives. Baade and Matheson (2011, 14) conclude the “litmus test arguably should not be whether sport induces an increase in economic activity, but rather is it the most efficient method for improving the economy.” Regarding public subsidies for professional sports facilities, Zaretsky (2001, 1) observes that:
81
See Zimbalist 2014, 94; Howard and Crompton 2014, 223-225; Agha & Rascher 2013, 10; Santo 2010, 58-59; Baade and Matheson 2011, 11; Baade in Pindus, Wial and Wolman 2010, 188-190; Baade, Baumann and Matheson 2008, 797-798; Crompton 2006, 75; Coates and Humphreys 2003, 343; Siegfried and Zimbalist 2002, 364; Siegfried and Zimbalist 2000, 105; Sanderson 2000, 173; Baade and Sanderson in Noll and Zimbalist 1997, 94; Zimbalist 1998, 20; and Zipp 1996, 178. 82
See Howard and Crompton 2014, 256-260; Agha & Rascher 2013, 11-12; Baade and Matheson 2011, 14; Rosentraub and Swindell 2009, 223-224; Coates and Humphreys 2008, 299; Crompton 2006, 75-76; Coates 2003, 243; Siegfried and Zimbalist 2000, 99-100; Zaretsky 2001, 3; Sanderson 2000, 174; Noll and Zimbalist 1997, 60-63; Baade and Sanderson, in Noll and Zimbalist 1997, 112; and Burns and Mules 1986, 18.

18
“…almost all economists and development specialists (at least those who work independently and not for a chamber of commerce or similar organization) conclude that the rate of return a city or metropolitan area receives for its investment is generally below that of alternative projects.
Rosentraub and Swindell (2009, 224) note that scholars differ on whether addressing opportunity costs should be considered in an economic impact analysis, as “some instead argue that such costs should be included in the estimates of a cost-benefit analysis.” However, they conclude that ignoring opportunity costs increases “the apparent magnitude of benefit from an economic impact analysis.”
Additional Misapplications and Omissions of Proponent Studies
As discussed above, economic studies commissioned by proponents of public subsidies for professional sports facilities are likely to fail to recognize or account for the substitution effect of consumer spending, leakages in both visitor and franchise spending, and the opportunity costs of public (or taxpayer) expenditures. Academic economists have identified additional “misapplications, omissions, and gratuitous assumptions” which contribute to overly-optimistic economic impact studies and inconsistencies with peer-reviewed research by academic economists. Failure to account for the substitution effect, spending leakages, and over-estimating the economic benefit of capital expenditures has implications in the application of multipliers in calculation of economic impact. The multiplier effect is a key feature of economic impact studies, as it “recognizes that changes in the level of economic activity created by visitors to a sports facility or event bring changes in the level of economic activity in other sectors and, therefore, create a multiple effect throughout the economy.”83 Different types of multipliers are used, depending on what impact is to be measured; sales, income and employment multipliers are the most widely used in economic impact studies. Simply put, the appropriate multiplier is applied to qualified expenditures to arrive at an estimate of economic impact. To the extent they exist, the multiplier compounds any errors and omissions in initial expenditures. The size or extent of the defined “area economy” also has implications in the measure of economic impact.84 Noll and Zimbalist (1997, 65) find “the magnitude of net benefits depends precisely on how the lines are drawn to differentiate internal and external effects.” Hudson (2001, 28) describes it this way:
“It is advantageous to use a quite small area when defining locals and visitors so that as many spectators as possible are included in the latter category, making them eligible as increases in local economic activity. On the other hand, a large geographical area permits a larger economic
83
Crompton 1995, 18-24; also see Howard and Crompton 2014, 202-214; Santo 2010, 53-57; Baade in Pindus, Wial and Wolman 2010, 174, 188; Crompton 2006, 73-75; Siegfried and Zimbalist 2002, 363; Siegfried and Zimbalist 2002, 99-100; Rappaport and Wilkerson 2001, 63; Zaretsky 2001, 3; Hudson 2001, 24-27; Rosentraub 1999, 137-144; Zimbalist 1998, 21; and Burns and Mules 1986, 8-9, 13-15. The multiplier effect is measured by applying a ratio to the direct effects of the activity to project the indirect and induced effects. In this case, the direct effects are (1) expenditures by non-excluded, out-of-area visitors; and (2) qualified capital and operating expenditures. Indirect effects are the changes in employment, income, and output by local supplier industries that provide goods and services to support the direct economic activity. Induced effects are the changes in spending by households whose income is affected by the direct and indirect activity. 84
Howard and Crompton 2014, 208-211; Long, 2013, 8; Santo 2010, 59; Baade in Pindus, Wial and Wolman 2010, 191; Crompton 2006, 75; Siegfried and Zimbalist 2002, 363; and Hudson 2001, 28;

19
impact, because a larger multiplier can be used. Some studies have attempted to get the best of both worlds by using a small area when defining visitors and a larger area when applying the multiplier…Altering the geographic area of interest in this fashion is a serious flaw in the analysis, again used to inflate the economic impact.”
Rosentraub and Swindell (2009, 223) assert that “using variable geographic areas as the basis for different aspects of the analysis” is one of the common errors in economic impact analyses. For example, Zimbalist (1998, 28) notes that the 1996 study of the proposed Yankee stadium considered “New York City as the local area for purposes of out-of-town expenditures but New York state as the relevant area for considering multiplier linkages.” Crompton (1995, 25) cautions that when a small area economy is specified, “it is crucial that only visitor spending within the defined area be included in impact studies and not total visitor expenditures, considering some of that spending may have occurred outside the area.” Another factor that influences measures of economic impact is the displacement or “crowding out” effect. While major events at sports facilities will likely attract out-of-area visitors, they may also deter other visitors who would have otherwise come to the area but did not, principally to avoid the crowds or because they could not get accommodations. Baade and Matheson (2011, 10) explains it this way:
“The crowds and congestion associated with major sporting events tend to reduce other economic activity in the local area, as sports fans displace other individuals. As with the substitution effect, sports tend to affect the allocation of economic activity across businesses and different sectors of the economy but not the total amount of activity that occurs.”
This displacement of local activity has two aspects: locals stay home or take their spending out-of-area.85 To the extent that attendees of major sporting events replace other potential visitors or deter other local spending, there is no net economic gain. Agha and Rascher (2013, 17) note that this “phenomenon is often over-looked and difficult to quantify.” As to economic development efforts in conjunction with sport facilities, Crompton (2006, 77-8) finds that proponents may “expand the project scope” and attribute additional economic gains to the facility as they serve as catalysts for speculative redevelopment of surrounding blighted areas. He claims this inflates the projected economic impact of the facility, as this “synergy” proves to be mythical for many of these projects. Additionally, if the project does spur redevelopment, it is likely redirected investment from other areas of the local economy, not new out-of-area spending. Crompton (2006, 77) also observes consultant studies inappropriately attribute economic benefit to replacement or renovated facilities. When a new facility replaces an old facility, “only the incremental gains uniquely attributable to the new facility constitute new economic income to the community.” However, this assertion could be challenged if proponents definitively established that “but-for” the subsidized renovation or replacement, the team would relocate to another region and the economic benefit of the franchise would be lost.
85
Coates and Depken (2011, 613) refer to this as the “hunker down” and “skedaddle” effects. Also see Howard and Crompton 2014, 250-255; Agha & Rascher 2013, 17-18; and Crompton 2006, 76-77.

20
APPORTIONMENT When financing responsibilities are shared, the economic benefit should be proportionately attributed among the contributors. Burns and Mules (1986a, 10, 31) suggest that:
“Where only part of the costs are funded by the government, the analysis should either attribute all benefits to joint costs or else attempt to ascertain the marginal effect on benefits received by the additional funding made possible by the government. If all the benefits generated by joint private-public sponsorship of an event are attributed to the government contribution alone, the benefit-cost ratio may falsely appear very favourable. This is especially true if the government contribution is a relatively small amount of the total.”
While Crompton (1995, 30) supports this perspective, he observes that:
“This viewpoint is conceptually logical, but it is not widely accepted by those involved in conducting economic impact analyses, possibly because it ignores the pragmatic reality of public-private sports partnerships. Proponents of attributing all the economic benefits to the government entity's contribution argue that it is the key to leveraging private sector participation in a venture. In such cases, without the public investment there would be no private investment and the sports event would not take place.”
For Hudson (2001, 24), if this “but for” assertion is valid, then “it is surely a mark of efficient subsidization if a government can spend as little as possible while ensuring” that a facility project goes ahead. If a sports franchise would have left absent the government subsidy, “it seems valid for the government to claim the full economic benefits.” In light of these perspectives, the economic benefit could be attributed in one of two ways. The estimated benefit could be distributed to all entities, public and private, that contribute to the financing of the facility, in proportion to their respective shares of the total investment. Second, the benefit could be attributed in proportion to each share of the total public contribution. For example, if both the state and one or more local governments contribute to the financing and on-going operation of a facility, the ROI should correspond to the split between those public entities.

21
References Acton, Emeline C. & Mary H. Campbell, “Public Funding of Sports Stadiums and Other Recreational Facilities: Can the Deal be "Too Sweet?" 27 Stetson Law Review 877, 1998. Agha, N., “The Economic Impact of Stadiums and Teams: The Case of Minor League Baseball.” Journal of Sports Economics June 2013 14: 227-252, first published on October 4, 2011 Agha, N., “The economic impact of stadia and teams: The case of Minor League Baseball.” Journal of Sports Economics, 14(3), 2013: 227-252. Agha, Nola and Daniel Rascher, “When can economic impact be positive? Nine conditions that explain why smaller sports can have bigger impacts.” Munich Personal RePEc Archive Paper No. 48016, posted 5 July 2013. Alexander, D.L., W. Kern and J. Neill, “Valuing the consumption benefits from professional sports franchises.” Journal of Urban Economics, September, 2000. Austrian, Z., and M.S. Rosentraub, “Cities, sports, and economic change: A retrospective assessment.” Journal of Urban Affairs, 24(5), 2002: 549-563.
Baade, R. A., “Professional sports as catalysts for metropolitan economic development.” Journal of Urban Affairs, 18(1), 1996: 1-17. Baade, R.A., “Getting in the Game: Is the Gamble on Sports as a Stimulus for Urban Economic Development a Good Bet?” in Urban and Regional Policy and Its Effects, by Nancy Pindus, Howard Wial and Harold Wolman, eds., (Washington, D.C.: The Brookings Institution, 2010) 152-204. Baade, R. A., R. Baumann and V.A. Matheson, “Selling the game: Estimating the economic impact of professional sports through taxable sales.” Southern Economic Journal, 74(3), 2008: 794-810. Baade, R. A., and R.F. Dye, “The impact of stadiums and professional sports on metropolitan area development.” Growth & Change, 21(2), 1990: 1-14.
Baade, R.A. and V. Matheson, “Financing Professional Sports Facilities.” Financing Economic Development in the 21st Century, Second Edition, Sammis B. White and Zenia Z. Kotval, eds. (NY: M.E. Sharp Publishing, 2012) Chapter 14. Baade, R. A., A.R. Sanderson, A. R., “The employment effect of teams and sports facilities.” In R. Noll, & A. Zimbalist (Eds.), Sports, jobs and taxes: The economic impact of sports teams and stadiums. (Washington, DC: Brookings Institution, 1997) 92-118. Baim, D., The sports stadium as a municipal investment. (Westport, CT: Greenwood Press, 1994.)
Broughton, David, “Clubs give winter homes a branding boost; Cities cede ballpark revenue but get more help in luring tourism.” Street & Smith’s Sports Business Journal, February 27, 2012 Burns , J.P.A and T.J. Mules, “A Framework for the Analysis of Major Special Events.” The Adelaide Grand Prix: The Impact of a Special Event, J.P.A Burns, J.H. Hatch, T.J Mules, eds. (Adelaide: The Centre for South Australian Economic Studies, 1986.)

22
Burns, J.P.A., and T.J. Mules, T.J. (1986b). An economic evaluation of the Adelaide Grand Prix. In G.J. Syme, B.J. Shaw, P.M. Fenton, & W.S. Mueller (Eds.), The planning and evaluation of hallmark events (Aldershot, England: Avebury, 1986.) 172-185. Bennett, J.T., They play, you pay: Why taxpayers build ballparks, stadiums and arenas for billionaire owners and millionaire players. (New York: Copernicus, 2012.)
Carlino, G., and N.E. Coulson, “Compensating differentials and the social benefits of the NFL.” Working Paper. (Philadelphia, PA: Federal Reserve Bank of Philadelphia, 2004.) Carlino, G., and N.E. Coulson. “Compensating differentials and the social benefit of the NFL: Reply.” Journal of Urban Economics, 60(1), 2006: 132-138. Chapin, Tim, “Identifying the Real Costs and Benefits of Sports Facilities,” Lincoln Institute of Land Policy Working Paper, 2002. Coakley, Jay J., Sport in Society: Issues and Controversies. 6th Edition (New York: McGraw-Hill, 1998.) 343-345. Coates, D., “Stadiums and arenas: Economic development or economic redistribution?” Contemporary Economic Policy, 25(4), 2007: 565-577. Coates, D., and B.R. Humphreys, “The growth effects of sport franchises, stadia, and arenas.” Journal of Policy Analysis and Management, 18(4), 1999: 601-624. Coates, D., and B.R. Humphreys, “The Stadium Gambit and Local Economic Development.” Regulation, Vol. 23, No. 2, . 2000: 15-20.
Coates, D., and B.R. Humphreys, “The Economic Consequences of Professional Sports Strikes and Lockouts.” Southern Economic Journal, Vol. 67, No. 3, 2001: 737-747.
Coates, D., and B.R. Humphreys, “The effect of professional sports on earnings and employment in the services and retail sectors in US cities.” Regional Science and Urban Economics, 33(2), 2003a: 175-198. Coates, D., and B.R. Humphreys, “Professional sport facilities, franchises and urban economic development.” Public Finance and Management, 3(3), 2003b: 335–357.
Coates, D., and B.R. Humphreys, B. R. “Caught Stealing: Debunking the Economic Case for D.C. Baseball.” CATO Institute Briefing Papers, October 27, 2004. Coates, D. and B.R. Humphreys, “Do Economists Reach a Conclusion on Subsidies for Sports Franchises, Stadiums, and Mega-Events?” Working Paper Series, Paper No. 08-18, North American Association of Sports Economists. Econ Journal Watch, 5(3), 2008: 294-315. Coates, D., B. R. Humphreys, and A. Zimbalist. “Compensating differentials and the social benefits of the NFL: A comment.” Journal of Urban Economics, 60(1), 2006: 124-131. Crompton, John L., “Economic impact analysis of sports facilities and events: Eleven sources of misapplication.” Journal of Sport Management, 9(1), 1995: 14-35. Crompton. John L., “Beyond Economic Impact: An Alternative Rationale for the Public Subsidy of Major League Sports Facilities.” Journal of Sport Management 18, 2004: 40-58.

23
Crompton, John L., “Economic impact studies: instruments for political shenanigans?” Journal of Travel Research, 45(1), 2006: 67-82.
Crompton, John L. “Measuring the Economic Impact of Park and Recreation Services” Prepared for the National Recreation & Park Association, 2011.
Crompton, John L. and D.R. Howard, “Costs: The Rest of the Economic Impact Story.” Journal of Sport Management, 27(5), 2013: 379-392. Crompton, John L., Dennis R. Howard & Turgut Var, “Financing Major League Facilities: Status, Evolution and Conflicting Forces.” Journal of Sport Management 17(2), 2003: 156-184.
Curtis, Gregory. “Waterlogged.” Texas Monthly, September, 1993. Danielson, Michael N., Home Team: Professional Sports and the American Metropolis. (New Jersey: Princeton University Press, 1997)
DeMause, Neal, “Why do Mayor Love Sports Stadiums?” The Nation, August 15-22, 2011. Eisinger, P., “The politics of bread and circuses: Building the city for the visitor class.” Urban Affairs Review, 55(3), 2000: 316-333. Fabricant, R., Staff Economist for the Florida Senate Committee on Ways and Means, in testimony before the Florida Senate Commerce and Consumer Services: Workshop and staff presentation on the Economic Costs and Benefits of Publicly Supported Professional Sports Facilities, April 5, 2005.
Finerty, John D. Jr., “Subverting the Internal Revenue Code in the “Game” of Sports Stadium Financing.” 1 Marquette Sports Law Journal 301 (1991) Fort, Rodney, “Direct Democracy and the Stadium Mess,” In R.G. Noll and A. Zimbalist (Eds.), Sports, Jobs and Taxes: the Economic Impact of Sports Teams and Stadiums (Washington, D.C.: The Brookings Institution Press, 1997) 146-177. Greenberg , Martin J. and Dennis Hughes, Jr., “Stadium Financing and Franchise Relocation Act of 1999.” 10 Marquette Sports Law Journal 383 (2000) Groothuis, Peter, Bruce Johnson and John Whitehead, “Public Funding of Professional Sports Stadiums: Public Choice or Civic Pride?” Eastern Economic Journal, Fall 2004. Holeywell, Ryan, “The Economics of Baseball's Spring Training: Cities in Arizona and Florida spend millions to host baseball teams during spring training. Is it worth it?” Governing Magazine, February 17, 2012. Howard, D. R., and J. L. Crompton, Financing Sport. 2nd Ed. (Morgantown, WV: Fitness Information Technology, Inc., 2004) Howard, D. R., and J. L. Crompton, Financing Sport. 3rd Ed. (Morgantown, WV: Fitness Information Technology, Inc., 2014)
Howard, Dennis R. and Brad R Humphreys, Eds., The Business of Sports [3 volumes]: Volume 1, Perspectives on the Sports Industry, Volume 2, Economic Perspectives on Sport, Volume 3, Bridging Research and Practice (Westport, CT: Praeger Publishing, 2008)

24
Hudson, I., “The Use and Misuse of Economic Impact Analysis: The Case of Professional Sports.” Journal of Sport and Social Issues, 25(1), 2001: 20-39.
Irani, D. ‘‘Public Subsidies to Stadiums: Do the Costs Outweigh the Benefits?’’ Public Finance Review, 25, 1997: 238-53. Jasina, John and Kurt W. Rotthoff, “The Impact of a Professional Sports Franchise on County Employment and Wages.” International Journal of Sport Finance, Vol. 3, No. 4, November 2008: 210-227. Johnson, A. and A. Sack, “Assessing the Value of Sports Facilities: The Importance of Noneconomic Factors.” Economic Development Quarterly 10(4), 1996: 369-381. Johnson, B., P. Groothuis, and J. Whitehead, J., “The Value of Public Goods Generated by a Major League Sports Team: The CVM Approach,” Journal of Sports Economics, Vol. 2, No. 1. 2001: 6-21. Keating, R. J., “Sports Pork: The costly relationship between major league sports and government.” Policy Analysis, No. 339, 1999: 1-33. Lertwachara, K., and J.J. Cochran, “An event study of the economic impact of professional sport franchises on local US economies.” Journal of Sports Economics, 8(3), 2007: 244-254. Long, Judith Grant, “Full count: The real cost of public funding for major league sports facilities. Journal of Sports Economics, 6(2), 2005: 119-143. Long, Judith Grant, Public/private Partnerships for Major League Sports Facilities. (New York, NY: Routledge, 2013) Miller, P. A., “The economic impact of sports stadium construction: The case of the construction industry in St. Louis, MO.” Journal of Urban Affairs, 24(2), 2002: 159-173. Mills, Edwin, “Megaplex: Civic Asset or Public Albatross,” Dialogue (Pioneer Institute for Public Policy Research, Boston MA ) Number 6, July 1995.
Noll, Roger and Andrew Zimbalist, (Eds.), Sports, jobs and taxes: The economic impact of sports teams and stadiums (Washington, DC: Brookings Institution Press, 1997.) Rappaport, J., and C. Wilkerson, C., “What are the benefits of hosting a major league sports franchise?” Federal Reserve Bank of Kansas City Economic Review, Fall 2001: 55-86. Rascher, D. A., “FiveThemes from 50 Economic Impact Studies.” Sports Economics Perspectives, 5, 2010: 1-6. Rich, W. C., ed., The Economics and Politics of Sports Facilities. (Westport, CT: Quorum Books, 2000). Riess, Steven A, “Historical Perspectives on Sports and Public Policy,” in The Economics and Politics of Sports Facilities, edited by W.C. Rich. (Westport, CT: Quorum Books, 2000) Rosentraub, Mark S., Major League Losers: The Real Cost of Sports and Who’s Paying for It. (New York: Basic Books, 1997.) Rosentraub, Mark S., Major League Losers: The Real Costs of Professional Sports And Who’s Paying For It, Revised Edition (New York: Basic Books, 1999) Rosentraub, Mark S. Hearing on S.952, before the Senate Committee on the Judiciary, 106th Cong. 38 (1999)

25
Rosentraub, Mark S., “The local context of a sports strategy for economic development.” Economic Development Quarterly, 20(3), 2006: 278-291. Rosentraub, M.S., and David Swindell, “Doing Better: Sports, Economic Impact Analysis, and Schools of Public Policy and Administration,” Journal of Public Administration Education, 15:2, 2009, 219-242 Rosentraub, Mark S., Major league winners: Using sports and cultural centers as tools for economic development. (New York: CRC Press, 2010)
Sanderson, A.R., “In Defense of New Sports Stadiums, Ballparks and Arenas.” Marquette Sports Law Journal, 10(2), 2000: 173-192. Santo, Charles, “The Economic Impact of Sports Stadiums: Recasting the Analysis in Context.” Journal of Urban Affairs, 27(2), 2005: 177-191. Santo, C. A., and C.S. Mildner, Sport and public policy: Social, political and economic perspectives. (Champaign, IL: Human Kinetics, 2010). Scully, Gerald W., Emeritus Professor of Economics, University of Texas at Dallas. “Sports,” The Concise Encyclopedia of Economics, Indianapolis, IN, 2008. Siegfried, J., and A. Zimbalist, “The economics of sports facilities and their communities.” The Journal of Economic Perspectives, 14(3), 2000: 95-114. Siegfried, J., and A. Zimbalist, A., “A note on the local economic impact of sports expenditures.” Journal of Sports Economics, 3(4), 2002: 361-366. Stem, William J., “Megaplex: Civic Asset or Public Albatross,” Dialogue (Pioneer Institute for Public Policy Research, Boston MA) Number 6, July 1995. Stynes, D. J. (2001). Economic Impact Concepts. http://www.msu.edu/course/prr/840/econimpact/concepts.htm.
Turner, Robyne S. and Jose F. Marichal, “Exploring Politics on the Sports Page,” in The Economics and Politics of Sports Facilities, edited by W.C. Rich. (Westport, CT: Quorum Books, 2000) Weisbrod, Glen and Burton Weisbrod, Burton, “Measuring Economic Impacts of Projects and Programs.” Economic Development Research Group, 1997. Whaples, R., “Do Economists Agree on Anything? Yes!” The Economists' Voice, 3(9) 2006
Zaretsky, Adam M., “Should Cities Pay for Sports Facilities?” The Regional Economist, April 2001, Federal Reserve Bank of St. Louis. Zimbalist, Andrew, “The Economics of Stadiums, Teams, and Cities,” in The Economics and Politics of Sports Facilities, edited by W.C. Rich. (Westport, CT: Quorum Books, 2000) Zimbalist, A., “The economics of stadiums, teams and cities.” Policy Studies Review, 15(1), 1998: 17–29. Zimbalist, A. , Hearing on S.952, before the Senate Committee on the Judiciary, 106th Cong. 38 (1999). Zimbalist, A., “Sports Facilities and Economic Development,” Government Finance Review, August 2013.

26
Zimbalist, A., and J.G. Long, “Facility finance: measurement, trends, and analysis.” In B.R. Humphreys & D.R. Howard (Eds.), Business of Sports, Vol. 2. (Westport, CT: Praeger, 2008) 235-352. Zimmerman, Dennis, “Subsidizing Stadiums: Who Benefits, Who Pays?” In R.G. Noll and A. Zimbalist (Eds.), Sports, jobs and taxes: The economic impact of sports teams and stadiums (Washington, DC: Brookings Institution Press, 1997.) 120-125. Zipp, John F., “The Economic Impact of the Baseball Strike of 1994,” Urban Affairs Review, vol. 32(2) (November 1996), 157-85. Zipp, John F., (1997). “Spring Training,” In R.G. Noll and A. Zimbalist (Eds.), Sports, Jobs and Taxes: the Economic Impact of Sports Teams and Stadiums (Washington, D.C.: The Brookings Institution Press, 1997) 427-451.