retrospective benefit-cost evaluation of u.s. doe ... study has benefitted from input from a number...
TRANSCRIPT

i

ii

iii
ACKNOWLEDGEMENTS This study has benefitted from input from a number of individuals. Doug Blankenship from Sandia National Lab provided insights into the history of PDC drill bits. Gregory Mines from Idaho National Laboratory provided information on the development of binary cycle power plant technology. Toshi Sugama provided insights into high temperature geothermal well cements and Karsten Prusess from Lawrence Berkeley National Laboratory provided information on the TOUGH series of reservoir models. Denise M. Mulholland from USEPA was especially helpful in providing the code and documentation for EPA’s COBRA model which was used to monetize health benefits from reduced emissions. Gretchen Jordan (Study Project Manager, Sandia National Laboratories) and Rosalie Ruegg (TIA Consulting Inc.), who worked closely with Jeff Dowd (DOE Study Project Manager) of EERE, authored the guidelines for conducting retrospective benefit-cost evaluations of EERE R&D programs. This report has greatly benefitted from these guidelines. Michael Gallaher (RTI International) prepared Appendix C. In addition, Ruegg and Patrick Thomas (1790 Analytics LLC) prepared Chapter 9 on knowledge benefits and the related Appendix E.
Several reviewers offered many useful comments and suggestions on earlier drafts of this report.
DOE Staff, DOE Contractor, and Project Team Reviewers:
- Sam Baldwin, DOE EERE - Doug Blankenship, Sandia National Laboratory - Jeff Dowd, DOE EERE - John Finger (Sandia National Laboratory) - Fred Glatstein, SENTECH Inc. (Contractor to DOE) - Allan Hoffman, DOE EERE - Al Link, University of North Carolina at Greensboro (Project Team) - Greg Mines, Idaho National Laboratory - Alan O‘Connor, RTI International (Project Team) - Tom Pelsoci, Delta Research Co. (Project Team) - Rosalie Ruegg, TIA Consulting Inc. (Project Team)
External Reviewers:
- Irwin Feller, Director, Institute for Policy Research and Evaluation, and Professor Emeritus of Economics, Pennsylvania State University
- Jeanne Powell, Economic Consultant, and retired Senior Economist, Advanced Technology Program, National Institute of Standards and Technology, U.S. Department of Commerce
Any shortcoming or omissions in this report are the authors’ responsibility.

iv
NOTICE
This document was prepared as an account of work sponsored by an agency of the United States government. Neither the United States government nor any agency thereof, nor any of their employees, makes any warranty, express or implied, or assumes any legal liability or responsibility for the accuracy, completeness, usefulness or any information, apparatus, product, or process disclosed, or represents that its use would not infringe privately owned rights. Reference herein to any specific commercial product, process, or service by trade name, trademark, manufacturer, or otherwise does not necessarily constitute or imply its endorsement, recommendation, or favoring by the United States government or any agency thereof. The views and opinions of authors expressed herein do not necessarily state or reflect those of the United States government or any agency thereof.

v
CONTENTS
Chapter Page
Executive Summary .............................................................................................................................. ES-1
1. Introduction .................................................................................................................................... 1-1 1.1 Selected Technologies ............................................................................................................ 1-1 1.2 Report Structure ..................................................................................................................... 1-2
2. Background .................................................................................................................................... 2-1 2.1 Drivers for Geothermal Power ............................................................................................... 2-2 2.2 Overview of GTP Research ................................................................................................... 2-2
2.2.1 Drilling ...................................................................................................................... 2-3 2.2.1 Exploration ................................................................................................................ 2-5 2.2.3 Reservoir Engineering ............................................................................................... 2-6 2.2.4 Energy Conversion .................................................................................................... 2-7
3. Methodology ................................................................................................................................... 3-1 3.1 Categories of Benefits ............................................................................................................ 3-1 3.2 Next Best Alternative ............................................................................................................. 3-2 3.3 Attribution .............................................................................................................................. 3-2 3.4 Measures of Economic Performance ..................................................................................... 3-3 3.5 Benefit-Cost Analysis for the GTP (Cluster Analysis) .......................................................... 3-4
4. Summary of Findings..................................................................................................................... 4-1 4.1 Individual Technology Case Studies ...................................................................................... 4-1
4.1.1 PDC Drill Bits .......................................................................................................... 4-4 4.1.2 Binary Cycle Power Plant Technology ..................................................................... 4-5 4.1.3 TOUGH Series of Reservoir Models ........................................................................ 4-7 4.1.4 High-Temperature Geothermal Well Cements .......................................................... 4-8
4.2 Benefit-Cost Analysis for GTP ............................................................................................ 4-10 4.2.1 Quantified Economic and Environmental Health Benefits ..................................... 4-10 4.2.2 Knowledge Benefits ................................................................................................ 4-12
4.3 Sensitivity Analysis .............................................................................................................. 4-12
4.4 Caveats ................................................................................................................................. 4-14 4.4.1 Oil and Gas Sector Benefits .................................................................................... 4-14
5. Polycrystalline Diamond Compact Drill Bits: Technology Impact Assessment ....................... 5-1 5.1 Introduction ............................................................................................................................ 5-1

vi
5.2 History of the Technology ..................................................................................................... 5-1 5.3 Next Best Alternative ............................................................................................................. 5-4 5.4 Benefits Calculations ............................................................................................................. 5-4
5.4.1 Economic Benefits (Profits) to PDC Drill Bit Producers .......................................... 5-4 5.4.2 Economic Benefits (Cost Reductions) from Using PDC Drill Bits........................... 5-6 5.4.3 Environmental Benefits ........................................................................................... 5-10 5.4.4 Security Benefits ..................................................................................................... 5-10
5.5 Attribution Share .................................................................................................................. 5-11 5.6 Benefit-Cost Analysis .......................................................................................................... 5-15
6. Geothermal Binary Cycle Power Plants: Technology Impact Assessment ............................... 6-1 6.1 Introduction ............................................................................................................................ 6-1 6.2 History of the Technology ..................................................................................................... 6-1 6.3 Next Best Alternative ............................................................................................................. 6-3 6.4 Benefits Calculations ............................................................................................................. 6-4
6.4.1 Economic Benefits .................................................................................................... 6-5 6.4.2 Environmental Benefits ............................................................................................. 6-9 6.4.3 Security Benefits ..................................................................................................... 6-13
6.5 Attribution Share .................................................................................................................. 6-14 6.6 Benefit-Cost Analysis .......................................................................................................... 6-17 6.7 Sensitivity Analysis .............................................................................................................. 6-18
7. TOUGH Series of Reservoir Models: Technology Impact Assessment ..................................... 7-1 7.1 Introduction ............................................................................................................................ 7-1 7.2 History of the Technology ..................................................................................................... 7-1 7.3 Next Best Alternative ............................................................................................................. 7-4 7.4 Benefits Calculations ............................................................................................................. 7-5
7.4.1 Economic Benefits .................................................................................................... 7-5 7.4.2 Environmental Benefits ............................................................................................. 7-9 7.4.3 Security Benefits ..................................................................................................... 7-13 7.4.4 Total Benefits………. ............................................................................................. 7-13
7.5 Attribution Share .................................................................................................................. 7-15 7.6 Benefit-Cost Analysis .......................................................................................................... 7-18 7.7 Sensitivity Analysis .............................................................................................................. 7-20
8. High-Temperature Cement: Technology Impact Assessment ................................................... 8-1 8.1 Introduction ............................................................................................................................ 8-1 8.2 History of the Technology ..................................................................................................... 8-1

vii
8.3 Next Best Alternative ............................................................................................................. 8-3 8.4 Benefits Calculations ............................................................................................................. 8-4
8.4.1 Economic Benefits from Corporate Profits ............................................................... 8-4 8.4.2 Economic Benefits to End Users ............................................................................... 8-6 8.4.3 Environmental Benefits ............................................................................................. 8-9 8.4.4 Security Benefits ....................................................................................................... 8-9
8.5 Attribution Share .................................................................................................................... 8-9 8.6 Benefit-Cost Analysis .......................................................................................................... 8-14
9. Knowledge Benefits ........................................................................................................................ 9-1 9.1 Introduction ............................................................................................................................ 9-1 9.2 Trends in Geothermal Patents Attributed to DOE and to Others ........................................... 9-2 9.3 The DOE-Attributed Knowledge Base in Patents Has Provided a Foundation for
Subsequent Innovation in Geothermal Technology ............................................................... 9-3 9.4 DOE-Attributed Geothermal Patent Families Have Influenced Developments Beyond
Geothermal, Particularly in the Oil and Gas Industries.......................................................... 9-5 9.5 Individual DOE-Attributed Geothermal Patents with Strong Influence ................................ 9-6 9.6 Trends in Geothermal Publications Attributed to DOE and to Others ................................... 9-7 9.7 Characterization of DOE-Funded Geothermal Publications by Research Organization
and by Type ............................................................................................................................ 9-8 9.8 Authorship and Citing of Samples of DOE-Funded Geothermal Publications ...................... 9-9
9.8.1 Stanford Geothermal Publications Funded by DOE ................................................. 9-9 9.8.2 INL Geothermal Publications .................................................................................... 9-9 9.8.3 NREL Geothermal Publications .............................................................................. 9-10
9.9 DOE Geothermal Publications Cited by Geothermal Patents .............................................. 9-10 9.10 Other Knowledge Outputs .................................................................................................... 9-11
9.10.1 Computer Models/Codes, Maps of Geothermal Resources, and Test Data ............ 9-11 9.10.2 Human Capital ........................................................................................................ 9-11
References ................................................................................................................................................ R-1
Appendices ............................................................................................................................................... A-1
A. Government’s Role in Technology Development ...................................................................... A-1
B. Interviews ................................................................................................................................... B-1
C. Summary of the Co-Benefits Risk Assessment (COBRA) Model ............................................. C-1
D. Geothermal R&D Program Funding Time Series ...................................................................... D-1
E. Bibliometrics Methodology Used in the Knowledge Benefits Chapter ...................................... E-1

viii
FIGURES Number Page Figure 5-1. PDC and Roller-Cone Drill Bits ................................................................................ 5-1
Figure 5-2. PDC Drill Bits’ Penetration Curve and Total Worldwide Crude Oil and Natural Gas Well Footage Drilled with PDC Bits, 1982–2008 ................................. 5-7
Figure 5-3. PDC Drill Bit Technology Benefits Attributable to DOE, 1982–2008 ................... 5-15
Figure 6-1. Geothermal Binary Cycle Power Plant ..................................................................... 6-2
Figure 6-2. Total Benefits of Binary Cycle Power Plants (thousands $2008) ........................... 6-12
Figure 6-3. Benefits of Binary Cycle Power Plants Attributable to DOE .................................. 6-16
Figure 8-1. High-Temperature Cement Technology Development Timeline, 1976–2006 ........ 8-10
Figure 9-1. Comparison of DOE-Attributed Geothermal Patent Families with Those Attributed to Others, Grouped in 5-Year Intervals by Priority-Year, 1978–2007 ................................................................................................................. 9-3
Figure 9-2. Organizations Whose Earlier Geothermal Patent Families are Linked to the Largest Number of Later Geothermal Patent Families .............................................. 9-4
Figure 9-3. Organizations with the Largest Number of Patent Families in All Topic Areas Linked to Earlier DOE-Attributed Geothermal Energy Patent Families ........ 9-5
Figure 9-4. DOE Geothermal Publications Compared with All Geothermal Publications, 1965–2009 ................................................................................................................. 9-8
Figure 9-5. A Network of Organizations Facilitates Geothermal Energy Knowledge Creation and Dissemination .................................................................................... 9-13
Figure C-1. COBRA Model Overview ........................................................................................ C-1

ix
TABLES
Number Page Table ES-1. Total Economic Benefits, 1980–2008 .................................................................... ES-3
Table ES-2. Environmental Health Benefits and Emission Reduction Attributed to DOE ........ ES-4
Table ES-3. Security Benefits Attributed to DOE, 1980–2008 .................................................. ES-5
Table ES-4. Summary of GTP Technology Case Studies .......................................................... ES-6
Table ES-5. Summary of GTP Expenditures, 1976–2008.......................................................... ES-6
Table ES-6. Benefit-Cost Analysis for the GTP Technology Case Studies (Cluster Analysis), 1980–2008 ............................................................................................. ES-7
Table ES-7. Environmental Benefits Attributed to DOE: Sensitivity to Displaced Fuel Type ........................................................................................................................ ES-7
Table ES-8. Sensitivity Analysis of GTP Technology Case Study Costs .................................. ES-8
Table 2-1. Geothermal Power Capacity by State, 2008 .............................................................. 2-1
Table 2-2. Federal and State Policy Initiatives in Geothermal Energy ....................................... 2-3
Table 2-3. DOE Drilling Research and Development Project Categories, 1976–Present .......... 2-4
Table 2-4. DOE Exploration Research and Development Project Categories, 1976–Present ............................................................................................................. 2-6
Table 2-5. DOE Reservoir Engineering Research and Development Project Categories, 1976–Present ............................................................................................................. 2-7
Table 2-6. DOE Energy Conversion Research and Development Project Categories, 1976–Present ............................................................................................................. 2-8
Table 4-1. Net Benefits Attributable to DOE (thousands $2008) ............................................... 4-2
Table 4-2. Security Benefits of Binary Cycle, 1980–2008 ......................................................... 4-6
Table 4-3. Security Benefits of TOUGH Models, 1980–2009 ................................................... 4-8
Table 4-4. Summary of GTP Benefits, 1976–2008 (thousands $2008) .................................... 4-10
Table 4-5. Summary of GTP Expenditures, 1976–2008........................................................... 4-10
Table 4-6. Benefit-Cost Analysis for GTP, 1976–2008 (thousands $2008) ............................. 4-11
Table 4-7. Environmental Benefits Attributed to DOE: Sensitivity to Displaced Fuel Type ......................................................................................................................... 4-13
Table 4-8. Sensitivity Analysis of GTP Technology Case Study Costs ................................... 4-13
Table 5-1. Key Parameters and Assumptions Used in the PDC Drill Bit Benefits Analysis ..................................................................................................................... 5-4
Table 5-2. Profits to PDC Drill Bit Manufacturers from PDC Drill Bit Technology, 1982–2009 ................................................................................................................. 5-5
Table 5-3. Average Cost Reductions per Foot in Crude Oil and Natural Gas Wells Drilled with PDC Bits ............................................................................................... 5-8

x
Table 5-4. Benefits from Using PDC Drill Bit Technology ....................................................... 5-9
Table 5-5. Total Economic Benefits from PDC Drill Bit Technology (thousands $2008)....... 5-10
Table 5-6. A Matrix Assessing DOE Attribution of PDC Drill Bit Technology by Stage ....... 5-12
Table 5-7. PDC Drill Bit Technology Net Benefits Attributable to DOE, 1976–2008 (thousands $2008) ................................................................................................... 5-16
Table 5-8. PDC Drill Bit Technology Benefit-Cost Analysis Results ...................................... 5-17
Table 6-1. Geothermal Binary Cycle Power Plants in the United States, 2008 .......................... 6-4
Table 6-2. Key Parameters and Assumptions Used in the Binary Cycle Power Plants Benefits Analysis ....................................................................................................... 6-5
Table 6-3. Increase in Conversion Efficiency of Binary vs. Flash Power Plants in the Mid-Level Temperature Range ................................................................................. 6-6
Table 6-4. Conversion Efficiency Benefits of Binary Cycle Power Plants in the Mid-Level Temperature Range, 1984–2008 ..................................................................... 6-7
Table 6-5. Emission Reductions Associated with Binary Cycle Power Plants, 2008 ................ 6-9
Table 6-6. Binary Cycle Power Plants Emission Reductions ................................................... 6-10
Table 6-7. Environmental Health Benefit Associated with Binary Cycle Power Plants, 2008 ......................................................................................................................... 6-11
Table 6-8. Time Series of Environmental Health Benefits of Binary Cycle Power Plants in the United States, 1984–2008 .............................................................................. 6-11
Table 6-9. Security Benefits of Binary Cycle Power Plants, 1984–2008 ................................. 6-13
Table 6-10. A Matrix for Assessing DOE Attribution of Binary Cycle Power Plants by Stage ........................................................................................................................ 6-15
Table 6-11. Economic Benefits of Binary Cycle Power Plants Attributable to DOE by Year, 1984–2008 (thousands $2008) ....................................................................... 6-16
Table 6-12. Net Benefits of Binary Cycle Power Plants Attributable to DOE, 1976-2008 (thousands $2008) ................................................................................................... 6-17
Table 6-13 Benefit-Cost Analysis Results ................................................................................. 6-18
Table 6-14. Binary Cycle Power Plants Environmental Benefits: Sensitivity to Displaced Fuel Type ................................................................................................................. 6-19
Table 7-1. TOUGH Workshops .................................................................................................. 7-3
Table 7-2. Key Parameters and Assumptions Used in the TOUGH Models Technology Benefits Analysis ....................................................................................................... 7-5
Table 7-3. Gain in Electricity Generated in the United States by the Geothermal Industry from the Use of TOUGH Models Technology ........................................... 7-6
Table 7-4. Increase in Geothermal Exploration Costs in the United States due to TOUGH Models Technology, 1980–2008 ................................................................ 7-8
Table 7-5. TOUGH Models Technology Emission Reductions ............................................... 7-10
Table 7-6. Annual Health Impacts of TOUGH Models Technology, 2008 (thousand $2008)...................................................................................................................... 7-11

xi
Table 7-7. Environmental Health Benefits of TOUGH Models Technology, 1980–2008 ....... 7-12
Table 7-8. Security Benefits of TOUGH Models Technology, 1980–2008 ............................. 7-13
Table 7-9. Total Benefits of TOUGH Models Technology in the Geothermal Industry in the United States, 1980-2008 (thousands $2008) .................................................... 7-14
Table 7-10. A Matrix for Assessing DOE Attribution of the TOUGH Models Technology by Stage .................................................................................................................. 7-16
Table 7-11. Benefits of TOUGH Models Technology Attributable to DOE, 1980–2008 .......... 7-18
Table 7-12. Net Benefits of TOUGH Models Technology Attributable to DOE, 1976–2008 (thousands $2008) ................................................................................ 7-19
Table 7-13. Benefit-Cost Analysis Results ................................................................................. 7-20
Table 7-14. TOUGH Models Technology Benefits: Sensitivity to Displaced Fuel Type ......... 7-20
Table 8-1. Key Parameters and Assumptions Used in the High-Temperature Cement Benefits Analysis ....................................................................................................... 8-4
Table 8-2. Corporate Income and Profitability for Support Activities for Mining (NAICS 2131110) ..................................................................................................... 8-5
Table 8-3. Manufacturer Profits from High-Temperature Cement Technology, 1999–2008 ................................................................................................................. 8-6
Table 8-4. Total Benefits to End Users of High-Temperature Cement, 1999–2008 .................. 8-7
Table 8-5. Comparison of Lifecycle Costs for a Prototypical Well by Application and Cement Type ............................................................................................................. 8-7
Table 8-6. Annual Avoided Costs per Well by Well Type (thousands $2008) .......................... 8-8
Table 8-7. Total Benefits of High-Temperature Cement, 1999-2008 (thousands $2008) .......... 8-9
Table 8-8. A Matrix for Assessing DOE Attribution of High-Temperature Cement Technolgy by Stage ................................................................................................. 8-12
Table 8-9. High-Temperature Cement Technology Benefits Attributable to DOE, 1999–2008 (thousands $2008) ................................................................................ 8-14
Table 8-10. High-Temperature Cement Technology Net Benefits Attributable to DOE, 1976–2008 (thousands $2008) ................................................................................ 8-15
Table 8-11. Benefit-Cost Analysis Results ................................................................................. 8-16
Table 9-1. DOE-Attributed Geothermal Patent Families Linked to Largest Number of Later Geothermal Patent Families ............................................................................. 9-6
Table B-1. Interviews by Technology ........................................................................................ B-1
Table C-1. Health Endpoints Included in COBRA .................................................................... C-2
Table C-2. Energy Imported by California ................................................................................. C-5
Table C-3. Weighted Average Fossil Fuel Mix of California Imports (MWh) .......................... C-6
Table C-4. Geothermal Energy Generation and Average Fossil Fuel Mix by State, 2008 ........ C-6
Table C-5. Emissions Factors Underlying Health Effects (Avoided Emissions [kg/MWh]) ............................................................................................................... C-7

xii
Table D-1. High-Temperature Cement DOE Costs .................................................................... D-1
Table D-2. Budgetary Line Items Used to Develop Technology Costs ..................................... D-2
Table D-3. Allocation of GTP Funding by Technology Category, 1976-2008 (thousands $2008)....................................................................................................................... D-2

ES-1
EXECUTIVE SUMMARY This report presents the findings from a retrospective economic analysis of technology development supported by the U.S. Department of Energy’s (DOE) Geothermal Technologies Program (GTP) in DOE’s Office of Energy Efficiency and Renewable Energy (EERE). The purpose of this study is to estimate the “public” return on investment (EERE GTP’s return on investment to the nation) by comparing historical economic activity with GTP’s investment to what would have likely happened in the absence of EERE GTP. The study includes:
• An assessment of DOE’s role in technology development and adoption,
• An estimate of the economic and environmental health benefits generated from selected technologies, and
• An estimate of measures of economic return from DOE’s research and development (R&D) activities.
Geothermal energy systems tap into thermal energy in the earth to produce heat and electricity. Geothermal power is a viable alternative for traditional fossil fuel (e.g., coal) or nuclear base-load generation. It also has the advantage of being a clean, renewable energy source without the variability of other renewable sources, such as wind and solar. Resources of geothermal energy vary in quality and accessibility because of differences in depth of reservoirs, rock formations, and water content. Historically, geothermal power plants have been built under ideal conditions for energy production; usually where the reservoir is close to the surface, the host rock is permeable and porous, and the ground fluid saturation and recharge rates allow having economically feasible operation. The relative scarcity of high-quality natural geothermal sites has limited widespread geothermal energy use. In the early 1970s, federally-sponsored geothermal R&D began with funding from the Atomic Energy Commission and the National Science Foundation. The GTP was initiated by DOE in the late 1970s to support the development of technologies that would improve the economics of tapping geothermal resources. Since that time, GTP has conducted a wide range of research targeted at the long-term goal of making geothermal energy a cost-competitive power production alternative. This study selected four technologies that accrued significant economic benefits for the geothermal industry and other industries (e.g., oil and gas) for detailed analysis:
• Polycrystalline diamond compact (PDC) drill bits. PDC drill bits use harder, longer lasting cutting surfaces and a simplified mechanical action; increasing both the productivity (more feet drilled per hour) and efficiency (less drill bits required per well) of drill bits.
• Binary cycle power plant technology. Binary cycle technology enabled the development of geothermal plants using low heat sources increasing geothermal capacity in place and offsetting electricity production by flash cycle technologies and a mix of fossil fuels.

Retrospective Benefit-Cost Evaluation of U.S. DOE Geothermal Technologies R&D Program Investments: Impacts of a Cluster of Energy Technologies
ES-2
• TOUGH1 series of reservoir models. The TOUGH series of models is a family of computer numerical simulation programs used to track fluid and heat flow in porous and fractured media. These models helped to optimize the performance of geothermal resources and manage risk associated with the uncertainty of their performance.
• High-temperature geothermal well cements. High-temperature geothermal well cements offer an improvement over alternative cement technology. They have a life expectancy of up to 20 years, eliminating annual reworks of geothermal and carbon dioxide injection wells. By comparison, wells that use traditional cement need to be reworked every one to two years.
ES.1 Methodology The analysis framework focused on four categories of net benefits to be assessed: economic, environmental, knowledge, and security. For each of the four geothermal technologies selected, a common approach was used for the evaluation. This approach included the following steps:
1. Conduct a historical review of the technology’s development, demonstration, and commercialization (if applicable) to assess the R&D timeline and EERE’s role.
2. Define the next best alternative technology.
3. Quantify the economic and environmental (air emissions) health net benefits by comparing the new (selected) technology to the next best alternative (independent of EERE attribution).
4. Determine the share of economic and environmental health net benefits attributable to DOE activities.
5. Calculate DOE program costs and estimate measures of economic performance.
In addition, a literature search and a series of interviews were conducted with industry and academic experts to estimate economic and environmental benefits attributable to DOE’s activities for each of the four selected technologies. A bibliometrics and historical tracing framework was also used to investigate the knowledge output creation and dissemination from R&D conducted by DOE’s GTP. A cluster analysis was then used to obtain measures of economic performance for the GTP as a whole. This analysis compared the sum of the net benefits from the four technologies investigated with the total expenditures of GTP. ES.2 Findings The four technologies selected for analysis in this study reflect the wide range of research activities conducted by the Geothermal Technologies Program and, as a group, have generated significant economic, environmental, and knowledge benefits.
1 TOUGH is both an acronym for “Transport of Unsaturated Groundwater and Heat” and a reference to tuff formations in Yucca
Mountain, which was one of the first major applications of the code.

Executive Summary
ES-3
ES.2.1 Economic Benefits Polycrystalline diamond compact (PDC) Drill Bits: Approximately 60% of worldwide oil and gas well footage in 2006 was drilled using PDC drill bits (Blankenship, 2009). The main advantage of PDC drill bits over conventional roller cone bits is that they reduce the frequency of pulling the drill string to replace the drill bit, allowing higher penetration rates and thus reducing the time (and cost) of renting expensive drill rigs. The use of PDC drill bits in offshore applications in the oil and gas industry is estimated to reduce costs by $59 per foot drilled. Binary Cycle: In reservoirs where the temperature range is 150oC to 190oC, flash cycle technology is economically viable but has approximately 15% lower electricity generation productivity as compared to binary cycle, because of its lower conversion efficiency. Thus, in this temperature range, the next best alternative is a traditional, but less productive, flash cycle geothermal plant. TOUGH Models: Using reservoir modeling increased productivity of geothermal resources by an estimated 10%. These benefits are somewhat offset by additional exploration costs associated with reservoir modeling. However, in the aggregate, reservoir modeling has been profitable for the geothermal industry by improving subsurface exploration. High-Temperature Cement: The rapid deterioration of Portland cement in geothermal wells (<12 months) resulted in frequent well workovers and costly well remediation. The use of high-temperature cements enhances performance in terms of structural stability and corrosion resistance and is estimated to eliminate $150,000 in annual well remediation costs and extend the working life of geothermal production wells to 20 years or more. A summary of economic benefits attributed to DOE is presented in Table ES-1. Reduction in drilling costs associated with PDC drill bits accounts for the overwhelming share of the total economic benefits with present value (PV) of $8.1 billion (discounted at 7%) quantified as part of this study.
Table ES-1. Total Economic Benefits, 1980–2008
Technologies Economic Benefits PV at 7% (thousands $2008)a Percentage of Total Benefits
PDC drill bits $7,813,212 96.7% Binary Cycle $42,848 0.5% TOUGH Models $219,445 2.7% High-temperature cement $1,013 0.0% Total economic benefits for the four technologies $8,076,518 100.0%
a PV = present value. PV base year is 1976.

Retrospective Benefit-Cost Evaluation of U.S. DOE Geothermal Technologies R&D Program Investments: Impacts of a Cluster of Energy Technologies
ES-4
ES.2.2 Environmental Benefits Environmental benefits of geothermal plants make them valuable assets in reducing air pollutants such as particulate matter (PM), sulfur oxides (SOx), and nitrous oxides (NOx); and in reducing greenhouse gases (GHG), such as carbon dioxide (CO2). Environmental health benefits were identified and quantified for binary cycle technology and the TOUGH system of models. The primary environmental benefits from binary cycle technology result from the additional renewable electricity generated from reservoirs where the temperature range is below 150oC, offsetting generation from a mix of fossil fuels. As for TOUGH model benefits, the increased productivity of geothermal fields’ yields resulting from using simulation modeling generates additional renewable energy that offsets coal base-load fossil fuel generation. The Co-Benefits Risk Assessment (COBRA) model was used to calculate the environmental health benefits associated with the reduction in air pollution resulting from using binary cycle technology and the TOUGH series of models. The input to the COBRA model is the reduction (tons/year) of PM, NOx, and SO2 resulting from geothermal energy compared to electricity that would otherwise be produced by coal, petroleum, and natural gas-fired power plants. Table ES-2 presents a summary of the environmental benefits attributable to DOE. Present value of environmental health benefits for binary cycle technology and the TOUGH series of models are discounted at 7% total $23.0 million and $103.7 million, respectively.
Table ES-2. Environmental Health Benefits and Emission Reduction Attributed to DOEa
Binary Cycle TOUGH Models Total
PM (short tons) 4,572 17,621 22,193 SO2 (short tons) 1,903 7,710 9,614 NOX (short tons) 998 4,039 5,037 GHG (thousand tCO2e) 1,319 5,266 6,585 Monetized health benefit (PV at 7%, thousands)b $22,970 $103,674 $126,644
a DOE attribution to these two technologies is explained in Sections 6.5 (Binary Cycle) and 7.5 (TOUGH Models) of the report. b PV base year is 1976. c Based on fossil fuel mix of 60% coal, 39% natural gas, and 1% petroleum
ES.2.3 GHG Effects Environmental benefits attributed to DOE include reductions in GHGs of 6.6 million tons (see Table ES-2) of carbon dioxide equivalents (tCO2e). Replacing fossil fuel electricity generation with geothermal power reduces GHG emissions. If cap and trade climate change policy is initiated in the future, the emissions could be monetized and included in the benefit-cost analysis. ES.2.3 Knowledge Benefits Principal conclusions drawn from assessing knowledge benefits resulting from GTP-funded R&D are many. The resulting knowledge base includes, among other things, approximately 90 DOE-attributed

Executive Summary
ES-5
patent families (where each family contains all patents based on the same invention) and more than 3,000 publications. These patents and publications provided a noteworthy foundation for further innovation in the geothermal energy industry and also in the gas and oil industries. Multiple technologies important to recent advances in producing power from geothermal resources and increasing efficiency in gas and oil extraction trace back strongly through patents and publications to DOE-funded research. Of a total population of more than 1,000 geothermal patent families assigned to numerous organizations, 21% were linked to earlier DOE-attributed geothermal patents and publications, second only to that for the patent portfolio of Chevron (24.9%), which is billed as the world’s largest producer of geothermal energy. More than 40% of Chevron’s patents have built extensively on earlier DOE-attributed geothermal patents and papers, as well as a high percentage of the patent portfolios of Ormat and other leading companies in geothermal energy.
Among the DOE-attributed patent families and publications are those describing Organic Rankine and Kalina thermodynamic cycles, the generation of geothermal energy from hot dry rocks, techniques for treating geothermal brine, advanced drill bits, downhole electronics and data transmission, improved cements to withstand conditions in wells, and other innovations describing geothermal power plants and power generation.
In addition to the knowledge base captured in patents, papers, models, prototypes, test data, and other tacit forms of knowledge, DOE-funded research has trained technologists and researchers in geothermal research across the nation and fostered the development of a network among them. ES.2.4 Security Benefits Security benefits derive from reducing the probability and potential impact of oil and natural gas disruptions and price shocks or other energy system disruptions that would damage or disrupt the economy, environment, or national security of the United States. Table ES-3 presents the reduction attributable to DOE. From 1980 to 2008, as a result of DOE’s efforts, 24.3 million cubic feet of natural gas or 4.3 million barrels of oil equivalent were offset by geothermal energy. Table ES-3. Security Benefits Attributed to DOE,a 1980–2008
Binary Cycle TOUGH Models Total Natural gas (million cubic feet) 4,863 19,401 24,264 BOE (thousand barrels of oil equivalent) 862 3,438 4,300
a DOE attribution to these two technologies is explained in Sections 6.5 (Binary Cycle) and 7.5 (TOUGH Models) of the report.
ES.2.5 Benefit-Cost Analysis for GTP (Cluster Analysis) Table ES-4 presents a summary of the four GTP technology case studies. PDC drill bits had the highest net benefits with PV $7.8 billion, a benefit-to-cost ratio (BCR) of 295, and an internal rate of return (IRR)

Retrospective Benefit-Cost Evaluation of U.S. DOE Geothermal Technologies R&D Program Investments: Impacts of a Cluster of Energy Technologies
ES-6
of 139%. High-temperature cement technology had the lowest net benefits (a negative value). This technology is in the early stages of adoption. Table ES-4. Summary of GTP Technology Case Studies
Metric PDC Drill Bits Binary Cycle Plants TOUGH Models High-Temp
Cement PVa of total benefits at 7% (thousands $2008) $7,813,212 $42,848 $219,445 1,013 PVa of program cost for selected case studies at 7%
(thousands $2008) $26,461 $26,819 $8,619 1,938 PVa of net benefits at 7% (thousands $2008) $7,786,751 $16,029 $210,826 -925 PVa of net benefits at 3% (thousands $2008) $18,473,186 $35,568 $446,302 162 BCR at 7% 295.3 1.6 25.5 0.5 BCR at 3% 451.4 1.9 39.3 1.1 IRR 139% 16% 48% NA
NA = Not available a PV base year is 1976. Benefits were accrued for following periods for each technology: PDC drill bits (1982–2008), binary
cycle plants (1984–2008), TOUGH models (1980–2008), and high-temperature cement (1999–2008).
As shown in Table ES-5, research activities associated with these four technologies accounted for only 3.8% of GTP’s budget from 1976 to 2008. Hence, it is very likely that the net benefits associated with GTP activities greatly exceed the $8.1 billion (discounted at 7%) quantified. However, it is still informative to compare the benefits from the four technologies to the total GTP expenditures to obtain lower bound measures of economic return.
Table ES-5. Summary of GTP Expenditures, 1976–2008
Technologies Total Expenditures PVa at 7% (thousands $2008) Percentage of Total
PDC drill bits $26,463 1.6% Binary Cycle $26,819 1.6% TOUGH Models $8,620 0.5% High-temperature cement $1,934 0.1% Total of four technologies $63,836 3.8% Total GTP expenditures $1,660,194 100.0%
a PV base year is 1976.
The study used a cluster approach to generate a conservative estimate of economic performance for the GTP as a whole. The cluster analysis compared the aggregate benefits from the four selected technology areas to the investment costs of the entire program. As shown in Table ES-6, the cluster analysis yields net benefits with present value of $8.1 billion (discounted at 7%), a BCR of 4.9 (discounted at 7%), and an IRR of 22%.

Executive Summary
ES-7
Table ES-6. Benefit-Cost Analysis for the GTP Technology Case Studies (Cluster Analysis), 1980–2008
Metric Value PVa of total benefits at 7% (thousands $2008) $8,076,518 PVa of total GTP cost at 7% (thousands $2008) $1,660,194 PVa of net benefits at 7% (thousands $2008) $6,416,324 PVa of net benefits at 3% (thousands $2008) $16,969,002 BCR at 7% 4.9 BCR at 3% 9.2 IRR 22%
a PV base year is 1976.
Note that the study was retrospective in that only benefits and costs through 2008 were included. As a result, the measures of economic return calculated are likely to be conservative, because in many instances, DOE’s historical R&D activities will continue to generate benefits well into the future. ES.2.6 Sensitivity Analysis When estimating the environmental health benefits attributed to DOE, it was assumed that in the absence of geothermal electricity, additional coal-, natural gas-, and petroleum-fired power plants would have been built to meet base load electricity demand. The exact mix of fossil fuels offset was calculated using the approach outlined in Appendix C. To investigate how sensitive our findings are to this approach, this study estimated environmental health benefits using an alternative scenario of 50% coal and 50% natural gas. The results are presented in Table ES-7. This alternative scenario is not based on specific information but is presented to illustrate how environmental benefits change when the offset fuel mix is changed.
Table ES-7. Environmental Benefits Attributed to DOE: Sensitivity to Displaced Fuel Type
Displaced Generation Percentage Reduction 60% Coal, 39% NG,
1% Oil 50% Coal, 50% NG
PM (short tons) 22,193 18,780 15.4% SO2 (short tons) 9,614 7,992 16.9% NOX (short tons) 5,037 4,227 16.0% GHG (thousand tCO2e) 6,585 6,268 4.8% Monetized health benefit (PVa at 7%, thousands $2008) $126,644 $107,501 15.1%
a PV base year is 1976. The costs for TOUGH series of models and CaP cement technologies were estimated based on FTE estimates or DOE internal cost records, however, this information was not available for binary cycle plants and PDC drill bit technologies. The costs for two latter technologies were estimated based on relevant line items from overall GTP budget. A portion of line item expenses from the GTP budget was assigned to these two technologies. This approach likely overestimated PDC drill bit and binary cycle plant technology costs. To investigate how sensitive our findings are to this approach, this study lowered PDC drill bit and binary cycle plants technology costs by 50%. The resulting benefit-cost ratios are presented in Table ES-8. This alternative scenario is not based on specific information, but is presented to

Retrospective Benefit-Cost Evaluation of U.S. DOE Geothermal Technologies R&D Program Investments: Impacts of a Cluster of Energy Technologies
ES-8
illustrate how PDC drill bit and binary cycle plant technology and overall benefit-cost ratios change when the cost calculation approach is changed.
Table ES-8. Sensitivity Analysis of GTP Technology Case Study Costs
Technology
Benefit-Cost Ratio at 7% (4 Case Study Technology Costs/4 Case Study Technology Benefits)
Baseline Decrease PDC and Binary Costs by 50%
PDC drill bits 295.3 590.5 Binary Cycle 1.6 3.2 TOUGH Models 25.5 25.5 High-temperature cement 0.5 0.5 4 Case Study Technologies 126.5 217.1

1-1
1. INTRODUCTION
In the early 1970s, federally-sponsored geothermal research and development (R&D) began with funding from the Atomic Energy Commission and the National Science Foundation. This was followed by the Geothermal Energy Research, Development, and Demonstration Act of 1974. In 1977, the Department of Energy (DOE) assumed responsibility for federal geothermal R&D and shortly thereafter, created DOE’s Geothermal Technologies Program (GTP) in DOE’s Office of Energy Efficiency and Renewable Energy (EERE). The GTP mission is to support the development of technologies that would improve the economics of tapping less-than-ideal geothermal resources. This report presents the findings from a retrospective economic analysis of the GTP. A cluster analysis was conducted for four selected technologies supported by the GTP. The objectives of the study were to:
• Assess DOE’s role in technology development and adoption,
• Estimate the economic and environmental health benefits generated from selected technologies, and
• Compare benefits attributable to DOE’s investments both for the GTP as a whole, and for the selected set of technologies examined in detail and estimate measures of economic return from DOE’s R&D activities.
The study is retrospective in that only benefits and costs through 2008 are included in the analysis. As a result, the measures of economic return calculated in this report are conservative, because in many instances, DOE’s historical R&D activities will continue to generate benefits well into the future. In addition, the nature of the cluster analysis (where total program costs are compared with benefits from a subset of selected technologies) contributes to the conservative nature of the empirical findings. 1.1 Selected Technologies The GTP has made significant contributions to a wide range of technologies, enabling more effective operation and management of underground resources. This study selected four technologies that had prominent benefits in the geothermal industry and beyond:1
• Polycrystalline diamond compact (PDC) drill bits. Geothermal systems often require penetrating harder rock than the rock encountered when drilling oil and gas wells, which necessitated the development of improved drill bits. PDC drill bits, with their harder and longer lasting cutting surface, improved on existing drill bit technology allowing the return to a simpler mechanical action from more complex roller-cone action and increasing both productivity (feet drilled per hour) and efficiency (number of drill bits per hour). In the absence of the development
1 The technologies were selected based on a review of the published literature and DOE’s historical summary reports
(EERE/GTP [2010], EERE/GTP [2008a], EERE/GTP [2008b], EERE/GTP [2008c], and EERE/GTP [2008d]). The technologies were intended to capture significant contributions by DOE across the broad range of geothermal research conducted by the GTP.

Retrospective Benefit-Cost Evaluation of U.S. DOE Geothermal Technologies R&D Program Investments: Impacts of a Cluster of Energy Technologies
1-2
of PDC drill bits, this study assumes (based on the interviews with experts) that industry would have continued to use the existing roller bit technology. Roller bits were an established technology and continue to be used where economically feasible (and where PDC drill bits fail). This occurs in hard and fractured rock, formations inter-bedded with stringers, and formations with hard inclusions such as chert.
• Binary cycle power plant technology. Binary cycle power plants are an improvement over existing geothermal plant technology and allow the construction of a geothermal plant in sites with lower temperatures that were previously unsuitable for geothermal generation. This technology enabled the development of geothermal plants using low heat sources, thus increasing geothermal capacity in place and offsetting electricity production that uses a mix of fossil fuels.
• TOUGH2 series of reservoir models. The TOUGH series of models is a new technology representing modeling capabilities not previously available. Reservoir modeling is mainly used as an operating optimization process and, to a lesser extent, during plant design. The benefits of the TOUGH series of models of geothermal applications are reduced drilling costs and decreased uncertainty associated with well management. Because of the flexibility of the TOUGH models, they have also been used for nuclear waste storage, carbon capture and storage applications, and groundwater protection and remediation design of subsurface contamination.
• High-temperature geothermal well cements. High-temperature geothermal well cements offer an improvement over existing cement technology. They have a life expectancy of up to 20 years, eliminating annual reworks of geothermal wells. High-temperature cements have also been used in CO2 injection wells on enhanced oil recovery projects and in capping retired offshore oil and gas wells. The next best alternative would have been to use existing cements (Portland cement).
These technologies and their developmental timelines are discussed in detail in the individual case studies presented in Chapters 5 through 8 of this report.
1.2 Report Structure The remainder of the report is structured as follows:
• Chapter 2 – Background: provides an overview of the GTP’s research and discusses many of the drivers for geothermal projects over the last 40 years.
• Chapter 3 – Methodology: provides an overview of the common methodology used in the four case studies.
• Chapter 4 – Summary Results: presents an overview of the study findings, including measures of economic return for each of the four technologies selected, as well as a cluster analysis that presents conservative estimates of economic return for the GTP as a whole.
• Chapters 5 through 8: present the individual technology case studies.
• Chapter 9: provides a discussion of the knowledge benefits associated with the GTP.
• Appendix A: describes a role for government in technology development.
2 TOUGH is both an acronym for “transport of unsaturated groundwater and heat” and a reference to tuff formations in Yucca
Mountain, which was one of the first major applications of the code.

Chapter 1 — Introduction
1-3
• Appendix B: provides information on the interviews conducted for this study.
• Appendix C: provides a description of the COBRA model and describes the data used to estimate environmental health benefits in the analysis.
• Appendix D: provides GTP’s historical cost (program funding) data used in the benefit-cost analysis.
• Appendix E: explains the bibliometrics methodology used in the knowledge benefits chapter.

Retrospective Benefit-Cost Evaluation of U.S. DOE Geothermal Technologies R&D Program Investments: Impacts of a Cluster of Energy Technologies
1-4

2-1
2. BACKGROUND
Geothermal energy systems tap into hydrothermal energy in the earth to produce electricity. Geothermal energy has the advantage of being a clean, renewable energy source without the variability of other renewable sources, such as wind and solar. It is also a viable alternative for traditional fossil fuel (e.g., coal) base-load generation, particularly coal and natural gas. Resources of geothermal energy vary in quality and accessibility due to differences in depth of reservoirs, rock formations, and water content. Historically, geothermal power plants have been built under ideal conditions for energy production – usually where the reservoir is close to the surface, the host rock is permeable and porous, and the ground fluid saturation and recharge rates allow having economically feasible operation. The relative scarcity of such ideal geothermal sites has been a barrier to widespread geothermal energy use (U.S. DOE, 2008a). The Department of Energy initiated the Geothermal Technologies Program in the late 1970s and has conducted a wide range of research targeted at the long-term goal of making geothermal energy a cost-competitive power production alternative. For example, before research efforts by the GTP, little commercial geothermal power was generated in the United States from the predominantly liquid-dominated hydrothermal resources.1 Only four plants were installed from 1971 to 1979 (as compared to 16 plants from 1980 to 1985). The United States currently leads the world in online megawatt capacity of geothermal energy and electric power generation (Glitnir, 2008). However, the net electricity generated from geothermal power in the United States in 2008 was 14,859 million kWh, or only 0.37% of the total electricity generated in the United States that year (U.S. DOE, 2010d). As shown in Table 2-1, the overwhelming majority of installed geothermal capacity is in California and Nevada (due to the abundance and ease of access to the heat sources in these states). Table 2-1. Geothermal Power Capacity by State, 2008
State Installed Capacity (MW) Share by State California 2,555.3 87% Nevada 318.0 11% Utah 36.0 1% Hawaii 35.0 1% Idaho 13.0 <1% Alaska 0.4 <1% New Mexico 0.2 <1% Total 2,957.9 100%
Source: U.S. Geothermal Energy Association (2009).
1 Liquid-dominated resources are those in which liquid has not vaporized into steam (as opposed to vapor-dominated resources).

Retrospective Benefit-Cost Evaluation of U.S. DOE Geothermal Technologies R&D Program Investments: Impacts of a Cluster of Energy Technologies
2-2
2.1 Drivers for Geothermal Power Limited commercial geothermal electric power production in the United States began in the 1960s. However, following the energy crisis in the 1970s, the development of geothermal resources in the United States became a national priority, and federal and state resources were made available to support R&D and promote implementation projects. As a result, the growth in installed capacity through the 1980s and 1990s was in large part driven by political and financial support. Table 2-2 lists various federal and state policy initiatives that have contributed to the continued development of new geothermal energy resources. These policies have been instrumental in enhancing the economics of exploration, drilling, and siting new geothermal projects; and stimulating geothermal investment from the private sector. The role of government in technology development is further described in the Appendix A.
The economic and environmental benefit estimates associated with DOE activities are related primarily to lowering installation and operating costs, and increasing operating efficiencies and productivity. The exception is DOE’s impact on the adoption of binary cycle technologies, where GTP’s funding and demonstration projects proved the technology and accelerated its adoption. 2.2 Overview of GTP Research In four reports issued by GTP under the main title “A History of Geothermal Energy Research and Development in the United States,” GTP identifies the four main areas of geothermal technology development and research: drilling, exploration, reservoir engineering, and energy conversion. This section discusses the history of the GTP program and describes each of the four main areas of their research. Prior to 1974, the majority of research on geothermal technology was conducted by government agencies, including the National Science Foundation, Atomic Energy Commission, U.S. Geological Survey (USGS), and the Energy Research and Development Administration (Reservoir Engineering, 2008). In 1974, the U.S. government enacted the Geothermal Energy Research, Development and Demonstration (RD&D) Act. This Act instituted the Geothermal Loan Guaranty Program, which provides investment security to the public and private sectors to exploit geothermal resources (EERE/GTP, 2010). The Energy Research and Development Administration (ERDA) was formed in 1975, and its Division of Geothermal Energy took over the RD&D program. When DOE was formed in 1977, it took over as the leading agency in geothermal technology research (EERE/GTP, 2008a).

Chapter 2 — Background
2-3
Table 2-2. Federal and State Policy Initiatives in Geothermal Energy Year Initiative 1978 The Federal Public Utilities Regulatory Policies Act required utilities to purchase power from small
renewable energy producers, referred to as Qualifying Facilities, at the utilities’ avoided cost. This legislation spurred growth in a number of new renewable and cogeneration energy projects, most notably in California (Masters, 2004). The Federal Energy Tax Act provided a 10% corporate tax credit for investment in geothermal and other renewable energy sources.
1980 The California Geothermal Resource Development Account provided funding to support the development of new and existing geothermal resources in California.
1983 California Standard Offer Contracts were enacted to allow state energy utility companies to enter into long-term, fixed price contracts with renewable generating facilities for periods of 10 to 30 years. This provided long-term, fixed price contracts, lowering return uncertainty and making it easier for geothermal developers to obtain requisite financing (REPP, 2003).
1986 The Federal Tax Reform Act repealed the 10% tax credit for investment in renewable energy generation projects.
1992 The Energy Policy Act reinstated the 10% tax credit, but only for renewable energy production equipment.
1996 The California Public Goods Charge mandated a fee assessed on all energy bills starting in 1998, providing funding for renewable energy and technology development and demonstration.
2001 The Nevada Universal Energy Charge, similar to California’s Public Goods Charge, allowed Nevada state utilities to assess a fee for providing renewable energy.
2002 The California Renewable Portfolio Standard Program required a 1% annual increase in renewable energy production by state utilities, up to 20% by 2017. The California New Renewable Resources Account provided financial resources to subsidize the cost of producing energy above the government-issued market price of the Renewable Resource Trust Fund. The Nevada Renewable Portfolio Standard required state electric utilities to generate or purchase >5% of electricity sold from renewable energy sources, increasing to 15% by 2013.
2004 The Federal Production Tax Credit, a statute originally introduced under the Energy Policy Act of 1992, was expanded under the American Jobs Creation Act of 2004 to include renewable energy production from geothermal facilities. The production tax credit provided a tax credit to renewable energy generators for the production and sale of electricity to consumers. The federal production tax credit has expired and been renewed and expanded numerous times since 1992, most recently in 2009. The original tax credit was 1.5 cents per kWh produced (1992 dollars) (U.S. DOE, 2005b).
2.2.1 Drilling ERDA, and later DOE, funded drilling R&D as part of government support for geothermal research in the United States, with some costs shared with industry partners. At the inception of DOE’s efforts in the 1970s, DOE program managers were responsible for as many as 20 drilling projects. By the early 1980s, Sandia National Laboratories (SNL) assumed responsibility for DOE’s drilling technologies program, with some of the work being done at Los Alamos National Laboratory (LANL) (EERE/GTP, 2008a). The cost of completing and drilling wells is a major component of the capital investment in a geothermal power plant for both production and reinjection. Research to reduce this cost has been underway since 1975. The primary focus of the DOE research has been to pursue two goals (EERE/GTP, 2008a):
• Develop technologies to lower geothermal drilling costs in the near term.

Retrospective Benefit-Cost Evaluation of U.S. DOE Geothermal Technologies R&D Program Investments: Impacts of a Cluster of Energy Technologies
2-4
• Pursue high-risk, long-term R&D activities on advanced concepts that would lead to significant long-run reductions in drilling costs.
Table 2-3 summarizes drilling research and development projects carried out by DOE and national laboratory researchers.
Table 2-3. DOE Drilling Research and Development Project Categories, 1976–Present
Project Category Description Major Projects Rock penetration Drilling methods suitable for
harder, more abrasive formations characteristic of geothermal reservoirs with the goal of increasing drilling speed and reducing drill wear.
Spark Drill (1976–1979), Improved Roller-Cone Bits (1975–1980), Chain Bit (1978–1991), Bit Hydraulics (1979–1982), PDC bits (1978–Present), Percussion Drilling (1980–1981), Jet Erosion Drilling (1979–1981), Cavitating Mud Jets (1979–2005)
Other drilling tools
Tools that improve the environment in which drill bits operate, improving drill bit performance.
Motor Seals (1976–1982), Insulated Drill Pipe (1986–1999), Diagnostics-While-Drilling (1999–2005), Drilling Dynamics Simulator and Active Vibration Control (2004–Present)
Logging and instrumentation
Instruments that provide downhole data that characterize reservoir conditions and drill performance.
High-Temperature Electronics (1976–2007), Wellbore Inertial Navigation System (1980–1982), Downhole Radar (1984–1990), Bore-Hole Televiewer (1980s–1990s, 2003–2005), Acoustic Telemetry (1986–2003), Spectral-Gamma Logging Tool (1993–1997), Precision Pressure-Temperature Tool (1993–1998), Downhole Steam Sampler (1995–2007), Core Tube Data logger (1998–2000), Downhole Data Logger (2002–2003), Optical Fiber (1999–2002), Downhole Turbine-Alternator (2001–2003), Downhole Monitoring System for the USGS and Coso (2002–2005)
Drilling fluids and wellbore integrity
Technologies that battle drilling problems (such as lost circulation of drilling fluid, stuck drill pipe, damaged bits, slow penetration rates, and collapsed boreholes).
High-Temperature Muds (1979–1988), Lost Circulation Materials Qualification (1979–1989), Drilling With Aqueous Foam (1979–1980s), Inert Gas Generation and Drilling Corrosion (1979–1982), High-Temperature, High Pressure Viscometer (1979–1981), Polyurethane Foam Grout (1980s–2004), Drillable Straddle Packer (1989–1999), Rolling Float Meter (1991–1998)
Slimhole drilling Technologies that allow drilling smaller exploration holes (2 to 6 inches compared to 8.5- to 12.25-inch holes drilled historically), reducing drilling costs.
Steamboat Hills: Nevada Demonstration (1993), Vale: Oregon Demonstration (1994), Newberry Caldera, Oregon Demonstration (1995), Fort Bliss: Texas Demonstration
Systems analysis Technologies to address complex problems by breaking them into smaller components and solving each component individually.
Geothermal Well Models (1980–1982), Cost Models (1980s–Present), Advanced Drilling Systems (1995–1996), Slimhole Power Generation (1994–1996), Drilling For Geothermal Heat Pump Installation (1996), Wellbore Lining (2001–2002)
(continued)

Chapter 2 — Background
2-5
Table 2-3. DOE Drilling Research and Development Project Categories, 1976–Present, (continued)
Project Category Description Major Projects Analytical studies Software tools that could be
applied in different scenarios to single out the impact of a particular technological advancement.
GEOTEMP (1979–1984), Casing Stress and Collapse (1981–1985), Drill-String Dynamics (1981–1987)
Geothermal Drilling Organization (GDO)
The organization created in 1982 to develop and fund near-term technology development project.
Expert System for Lost Circulation (1996–1999), Retrievable Whipstock (1996), Rotating-Head Rubbers (1996–1997), Valve-Changing Tool (1997), Insulated Drill Pipe (1997–1999), Geysers Casing Remediation (1998–1999), Low Emission Atmospheric Metering Separator (1998–2000)
Scientific drilling management
Cross-agency drilling management and technical support performed by SNL, which benefited DOE’s drilling research.
Inyo Domes and Craters (1987), Valles Caldera, VC-2B (1988), Weeks Island (1994), Long Valley, Phase 3 (1998)
Source: EERE/GTP (2008a).
2.2.2 Exploration DOE’s exploration research was initiated by several national laboratories beginning in the 1970s. Initially, research was conducted by universities and contractors. Since the 1980s, most of the work has been conducted by the University of Utah Earth and Geoscience Laboratory, Lawrence Berkeley National Laboratory (LBNL), and Lawrence Livermore National Laboratory (LLNL). Additional support was provided by Idaho National Laboratory (INL), Oak Ridge National Laboratory (ORNL), LANL, and SNL (EERE/GTP, 2008b). DOE found that the most efficient way to promote the development of geothermal resources was to have a strong working relationship with the private sector. All of the research was driven by the industry’s need to mitigate highest-risk and highest-cost elements of geothermal resource development. Research programs and projects have been selected based on the projected impact on program goals, especially related to cost of power. To this end, lowering well-field costs through dry-hole avoidance and improving drilling technology were identified as priorities in the increased development of the available hydrothermal resource base. Thus, most of the research work in the exploration area has been focused on these factors (EERE/GTP, 2008b). Table 2-4 summarizes exploration R&D projects carried out by DOE and national laboratory researchers.

Retrospective Benefit-Cost Evaluation of U.S. DOE Geothermal Technologies R&D Program Investments: Impacts of a Cluster of Energy Technologies
2-6
Table 2-4. DOE Exploration Research and Development Project Categories, 1976–Present Project Category Description Major Projects Industry cooperative exploration and drilling
Case studies, cooperative exploration, and drilling aimed at lowering drilling costs.
Industry Coupled Case Study Program (1978), Cove Fort – Sulphurdale (1975–1979), Roosevelt Hot Springs (early 1970s–1979), Case Studies of Low- to Moderate-Temperature Hydrothermal Energy Development (1977–1978), Cascades I and II Cost Shared Programs, GRED I, II and III Cost-Share Programs
State Cooperative resource assessment
Prepared geothermal potential maps for western states.
State Coupled Program, State Cooperative Reservoir Analysis Program, Low-Temperature Resource Assessment Program
Selected hydrothermal system studies
Conducted topical studies of various geothermal environments.
Mid-Oceanic Volcanic Environments – Ascension Island, Deep Circulation within the Basin and Range Province – Coso Hot Springs, Geysers Coring Project, Deep Circulation within the Basin and Range Province –Dixie Valley, An Active Rift Valley – the Salton Sea Scientific Drilling Program
Geological technique development
DOE-funded studies documented the importance of hydrothermal alteration on the formation of geothermal systems and their impact on geophysical measurements.
Evolution of the Salton Sea Geothermal Field, structural controls on geothermal systems, applied terrestrial remote sensing technology, a conceptual model of volcano-hosted vapor-dominated geothermal systems, significance of hydrothermal alteration assemblages, duration and age of hydrothermal activity
Surveys and studies related to geochemical analysis of reservoirs.
Trace-element analyses of soils and rocks, soil-gas and gas-flux measurements, geochemical analyses of geothermal fluids, fluid inclusion studies
Surveys and studies related to geophysical analysis of reservoirs.
Seismic methods, aeromagnetic methods, gravity methods, thermal methods, geophysical well log interpretation, electrical methods, borehole geophysics studies, InSAR studies, geopositioning satellite studies, coupled reservoir simulation and electrical surveys
Exploration strategies
Developed geothermal exploration strategies.
Resource assessment
Sponsorship of assessment the geothermal energy resource base in the U.S. by the USGS.
Source: EERE/GTP, 2008b.
2.2.3 Reservoir Engineering The research projects related to reservoir engineering began in 1976 and were carried out by a variety of institutions, including the national laboratories, universities, the USGS and the private sector. DOE’s work in this field was focused on three general areas (EERE/GTP, 2008c):
• Improvement of existing technologies to enhance operation and management of geothermal
resources by predicting resource productive capacity and longevity (such as reservoir simulation, tracer development and interpretation, reservoir monitoring, and establishing physical and chemical properties of reservoirs and reservoir fluids);
• Research and development of innovative technologies for heat extraction (hot dry rock, enhanced geothermal systems); and

Chapter 2 — Background
2-7
• Site-specific cooperative studies with U.S. and international researchers to improve reservoir productivity (included theoretical, modeling, laboratory, and field activities related to demonstration and verification of geothermal resources).
Table 2-5 summarizes reservoir engineering research and development projects carried out by DOE and national laboratory researchers.
Table 2-5. DOE Reservoir Engineering Research and Development Project Categories, 1976–
Present Project Category Description Major Projects
Reservoir engineering
Developed reservoir simulators and geothermal modeling capability. Demonstrated reservoir simulators on numerous case studies and presented in educational meetings. Laboratory determination of reservoir, rock, and fluid parameters.
Reservoir modeling, physical properties and modeling parameters
Geoscience support projects
Discovered the appropriate tracers for use in hot geothermal reservoirs. Developed a better understanding of fluid geochemistry. Improved fluid-rock chemical interaction models. Monitored induced seismicity at two EGS projects and at The Geysers Geothermal Field.
Tracer development, fluid chemistry, induced seismicity
Enhanced geothermal systems
Completed the first ever enhanced geothermal system project at Fenton Hill. Performed joint feasibility project with industry to study EGS at the Coso Hot Springs Geothermal Field. Performed joint cost project with industry to study the feasibility of EGS at the Desert Hot Springs Geothermal Field. Performed research into alternative EGS working fluids to increase the feasibility of the process.
Fenton Hill, Coso Hot Springs, Desert Peak, Advanced Systems
Source: EERE/GTP (2008c).
2.2.4 Energy Conversion When the DOE energy conversion R&D program first began, commercial power production from geothermal resources was limited to The Geysers, a dry-steam plant located in northern California. There was increasing interest in developing geothermal resources; however, since vapor-dominated resources (like The Geysers) are rare, developing the technologies to improve the economic feasibility of using liquid-dominated resources for power production became a primary focus of DOE research (EERE/GTP, 2008d). A wide range of activities related to energy conversion were conducted in the early research period, with primary emphasis placed on understanding geothermal fluid chemistry and developing materials and components. Geothermal fluids produced from liquid-dominated resources are hot and may contain significant levels of dissolved solids with a higher potential for corrosion and scaling. Thus, DOE’s research focused on identifying compatible materials and minimizing the precipitation of dissolved solids, since these factors determine the feasibility of using liquid-dominated resources for power production

Retrospective Benefit-Cost Evaluation of U.S. DOE Geothermal Technologies R&D Program Investments: Impacts of a Cluster of Energy Technologies
2-8
(EERE/GTP, 2008d). Table 2-6 summarizes reservoir engineering research and development projects carried out by DOE and national laboratory researchers.
Table 2-6. DOE Energy Conversion Research and Development Project Categories, 1976-
Present Project Category Description Major Projects
DOE test facilities and demonstration plants
Developed government-owned test facilities, funded design and construction of demonstration geothermal power plants.
Raft River (1975), Geothermal Components Test Facility (1976), Geothermal Loop Experimental Facility (1976), Heber Binary Demonstration Plant (1980), Pleasant Bayou – Hybrid Geo-pressured Geothermal Power Plant (1989), Small-Scale Field Verification Projects (2000–2001)
Materials development
Developed cost-effective materials to meet the unique needs of geothermal applications.
Early materials and fouling studies, thermoplastic coatings – polyphenylene sulfide with additives, advanced coating materials (nano-composite coatings, coatings for air-cooled condensers, coatings for steam separators, heat exchanger tube joints), thermal spray coatings for piping surfaces
Geothermal fluid chemistry
Research focused on improving the understanding of geothermal fluid chemistry and particularly the formation and control of silica scale.
Silica scale inhibition (high-temperature, high-salinity geothermal fluids, chemistry instrumentation development, fluid sampling and analysis), treatment of geothermal brines, recovery of minerals and metals from geothermal brines
Power plant design and engineering
Research to lower power generation costs including work to develop innovative plant components and more efficient power cycles. Recently, research sought to enhance component performance to increase plant output and lower power generation costs.
Component development projects (innovative heat exchangers, total flow devices, enhanced air-cooled condenser performance, advanced direct contact condenser, component development for ammonia/water power cycles, non-condensable gas removal for steam plants), power cycle development (heat cycle research program, binary cycle improvement – post heat cycle research)
Power plant operations
Research aimed at improving process monitors or instruments to provide real-time monitoring of conditions affecting plant performance, cost, or the integrity of plant components (corrosion and scaling) for flash and steam plants. Research aimed at reducing the effects of high ambient temperatures on the performance of air-cooled binary plants and in lessening the adverse impact of NCGs in binary cycle working fluid systems on both plant output and operating and maintenance costs for binary plants.
Improved monitors (plant process stream monitors, monitoring biological activity, nondestructive testing of corrosion/erosion in piping systems), non-condensable gas removal system for binary plants, off-design operation of air-cooled binary plants (mitigating effects of off-design operation, evaporative cooling enhancement methods for air-cooled plants)
Power plant analytical studies
Studies that showed the benefits of specific technologies or concepts, providing the basis or justification for further research.
Geothermal sourcebook, next generation geothermal power plants, Geothermal Electricity Technology Evaluation Model (GETEM)
Source: EERE/GTP (2008d).

3-1
3. METHODOLOGY
The objective of this study is to assess the realized economic and other net benefits from the GTP. For each of the four geothermal technologies selected (PDC drill bits, binary cycle technology, the TOUGH family of reservoir models, and high-temperature cement), a common approach was used for the evaluation. This approach included the following steps:
1. Conduct a historical review of the technology’s development, demonstration, and commercialization (if applicable) to assess the R&D timeline and EERE’s role.
2. Define the next best alternative technology.
3. Quantify the economic and environmental (air emissions) health net benefits by comparing the new (selected) technology to the next best alternative (independent of EERE attribution).
4. Determine the share of economic and environmental (air emissions) health net benefits attributable to DOE activities.
5. Calculate DOE program costs and estimate measures of economic performance for each of the four research areas.
The above steps resulted in individual measures of economic performance for investment in each of the four technologies. A cluster analysis was then used to obtain measures of economic performance for the GTP as a whole. The cluster analysis compared the sum of the net benefits from the four technologies investigated with the total expenditures of the GTP. The remainder of this chapter provides additional details on the methodology used in the analysis. This methodology follows the guidelines set forth in the draft Guidelines for Conducting Retrospective Benefit-Cost Studies (Ruegg and Jordan, 2009), and the discussion below borrows from that study. 3.1 Categories of Benefits The analysis framework focused on four categories of net benefits to be assessed: economic, environmental, knowledge, and security, which are described further below.
• Economic benefits are increases in the value of goods and services in the economy. Technological advancement is one way to increase economic benefits. This occurs by improving the performance of existing goods and services and/or reducing their cost, and by developing novel goods and services that provide desired new capabilities and experiences with economic value.
• Environmental benefits in EERE benefit-cost studies focus on air pollution, and the benefits are measured using changes in the physical quantities of a set of air emission pollutants. Monetary estimates are developed for environmental health benefits (reduced mortality, lost work days, and health care costs) using the Co-Benefit Risk Assessment (COBRA) model.1 The input to the model is the reduction (tons/year) of PM, NOx, and SO2 from geothermal energy generated by binary cycle
1 A discussion of the COBRA model is contained in Appendix C.

Retrospective Benefit-Cost Evaluation of U.S. DOE Geothermal Technologies R&D Program Investments: Impacts of a Cluster of Energy Technologies
3-2
compared to the next best alternative. The power displaced by geothermal energy depends on the electricity portfolio of each state. Shares of fossil fuels (coal, petroleum, and natural gas) displaced by geothermal energy are calculated in Appendix C. Reduction in the amount of PM, NOx, and SO2 (tons/years) are presented in Chapters 6 and 7. Reductions in GHG emissions are also estimated (but not monetized) and reported in tons of carbon dioxide equivalents (tCO2e).
• Knowledge benefits for the 2009 benefit-cost studies were derived from parallel historical tracing evaluation studies that were prepared for each of the four program areas. The approach emphasizes analysis of the creation and dissemination of explicit knowledge codified in publications and patents but also provides qualitative information on relational networks and tacit knowledge. An overview of the methodology used in the analysis of knowledge benefits is presented in Appendix E.
• Security benefits derive from reducing the probability and potential impact of oil and natural gas disruptions and price shocks or other energy system disruptions that would damage or disrupt the economy, environment, or national security of the United States (Ruegg and Jordan, 2009). Security benefits are reported in terms of volumes of oil (gallons) and natural gas (cubic feet), which would otherwise be required to generate electricity equal to the amount generated as a result of DOE’s support of the four case study technologies.
The monetized impact measures of economic and environmental health benefits are derived from retrospective analysis. This means that technologies for which monetary benefits are included in the study completed successful development and were deployed by the end of 2008. Prospective benefits beyond 2008 are highly likely to occur as a result of DOE/GTP research but are not included in the analysis because of the uncertainty around future operations of geothermal plants or oil and gas drilling activities. Performing the study retrospectively reduces the technical and market uncertainty that typically characterizes prospective benefit-cost analyses of advanced technologies. 3.2 Next Best Alternative Benefits were calculated following methodologies pioneered by Griliches (1958) and Mansfield et al. (1977). This approach uses primary and secondary research on technology advances supported by DOE and ascertains how, when, or if those advances would have been made in the absence of DOE’s programs. The economic and environmental benefits of a new technology are judged against the next best alternative (i.e., the best choice that could be made in lieu of choosing the new technology). For a retrospective benefit-cost analysis, the next best alternative is defined by looking back in time and hypothesizing what technologies would have been developed or used in the absence of the new technology being investigated. This is sometimes referred to as a counterfactual scenario and is a key driver in quantifying benefits. 3.3 Attribution Because this study focuses on estimating the return on DOE’s investment (i.e., the return on public investment), it is important to identify EERE’s role in realizing the benefits described above. To estimate the return on public investment, the impacts attributable to DOE needed to be estimated. This is also sometimes
Chapter 3 — Methodology
3-3
referred to as “program additionality.” This step – also counterfactual in nature – looks at what likely would have happened without the GTP’s activities (note the distinction that the benefit estimates described in Section 3.2 investigate the world with and without the new technology). Attribution assesses how (or if) the new technology would have evolved in the absence of the GTP’s activities. A DOE R&D program might have a number of effects on technology development, but not all are relevant to all technologies. For the four geothermal technologies selected for this study, an R&D program may:
• Accelerate technology entry into the marketplace by speeding the R&D effort (which is then carried forward), reducing the risk of failure, enhancing the attraction of other funding for development and commercialization, and increasing market awareness;
• Improve the performance characteristics of the technology by increasing the scale or scope of the R&D effort to take on more technical challenges, and/or open technology opportunities that were not previously available;
• Change the cost of a technology by encouraging collaborative R&D activities among organizations to avoid investment redundancy, and providing specialized facilities and services needed by an entire industry in order to make advances; and
• Increase market size by reducing barriers to market adoption through information, training, standards and certification activities, and increasing the access of U.S. firms to growing global markets.
The determination of attribution is frequently one of the main sources of uncertainty in the benefit-cost analysis. Issues naturally stem from the multiple lines of evidence that are available to support claims of DOE additionality and the extent to which these lines of evidence come from unbiased, independent sources. Data collection in any retrospective evaluation presents challenges that limit evidence, such as lost or nonexistent records, key people who cannot be found or choose not to respond to inquiries, and industry concerns about sharing proprietary data. To address these issues, this study conducted multiple interviews with academics, industry experts, and GTP staff who were involved in the research, development, and deployment of the technologies. 3.4 Measures of Economic Performance Once the share of net economic and environmental health benefits attributable to the GTP was quantified in dollar terms, the share was compared to program costs (expenditures) to develop measures of economic performance. As recommended in the DOE’s guidance document (Ruegg and Jordan, 2009), this study used three measures that are widely used to express the economic performance of the monetized elements of an evaluated investment:
• Present Value (PV) of Net Benefits: PV of net benefits is the lump-sum, time-equivalent dollar value of all the economic benefits less all the costs stated as of the base year (i.e., the first year of EERE investment in the technology or cluster). A positive PV of net benefits means that the benefits

Retrospective Benefit-Cost Evaluation of U.S. DOE Geothermal Technologies R&D Program Investments: Impacts of a Cluster of Energy Technologies
3-4
are sufficient to cover all costs plus the required rate of return expressed by the discount rate used to calculate the PV of net benefits. The larger the net benefits, the greater the extent that benefits exceed costs and the more worthwhile a project is considered, other things being equal. Out calculations placed cash flows in the middle of the period. The reason is that almost all of the DOE geothermal expenditures were labor costs (FTEs) that were distributed evenly over the year. This is slightly different from a standard one-time capital investment where the costs are incurred at the beginning of the time period. Similarly, geothermal benefits are associated with continuous activity, such as energy production (MWh/year) or operating cost reduction ($$/year). These benefits accrue close to evenly over a given year and hence the timing is best represented by the midpoint of the year.
• Benefit-to-Cost Ratio (BCR): The BCR is a ratio of benefits to costs and is a dimensionless number that indicates how many dollars of benefit are returned per dollar invested, adjusting for the time-value of money. It is computed by dividing total discounted benefits by total discounted costs. A ratio greater than one means that benefits exceed costs. A ratio of 10, for example, means that, on average, 10 dollars in benefits are generated for every dollar of costs incurred, after adjusting for the time-value of money.
• Internal Rate of Return (IRR): The IRR gives the rate of return on investment, expressed as an interest rate. Unlike the previous two measures, the discount rate is not used directly in the IRR calculation. Rather, the IRR is solved for by substituting an interest rate (i) with unknown value in place of the discount rate in the discounting formulas and solving for the value of i for which time-adjusted benefits equal costs (i.e., the discount rate for which net benefits are zero).
3.5 Benefit-Cost Analysis for the GTP (Cluster Analysis) The aggregate benefits from the four selected technology areas are then compared to the GTP costs as a whole. This approach is commonly referred to as a cluster analysis. The purpose is to provide an estimate of the minimum return for the whole program, without performing detailed analysis of all of its research projects or technologies. The same three measures of economic return presented in Section 3.4 were used in the cluster analysis. For additional discussion of the benefits of cluster analysis and the rationale for using it, see Ruegg and Jordan (2009).

4-1
4. SUMMARY OF FINDINGS
This chapter presents an overview of the findings for the four technology case studies, as well as the cluster analysis for GTP as a whole. Primary and secondary data collection was conducted for each of the technologies. As part of the study, 22 informal interviews were conducted with industry experts, academics, and DOE staff. Appendix B lists the number of interviews conducted for each technology, and professional publications and technical reports are listed in Chapter 10. The calculations of the findings presented in this chapter are explained in greater detail in subsequent sections. 4.1 Individual Technology Case Studies The analysis for each technology is summarized in this section1, and additional detail is provided in Chapters 5 through 8. Table 4-1 presents the benefits and GTP expenditures for each of the four technologies, along with the calculated measures of economic return.
1 Knowledge benefits are discussed as part of the cluster analysis in Chapter 9. Knowledge benefits were analyzed for the GTP as a
whole and not on an individual technology basis.

Retrospective Benefit-Cost Evaluation of U.S. D
OE G
eothermal Technologies R&
D Program
Investments:
Impacts of a C
luster of Energy Technologies
4-2 Table 4-1. Net Benefits Attributable to DOE (thousands $2008) PDC Binary TOUGH Cement
Year Total Benefits
Program Expenses
Net Benefits
Total Benefits
Program Expenses
Net Benefits
Total Benefits
Program Expenses
Net Benefits
Total Benefits
Program Expenses
Net Benefits
1976 $0 $2,081 -$2,081 $0 $2,036 -$2,036 $0 $797 -$797 $0 $142 -$142 1977 $0 $2,081 -$2,081 $0 $2,036 -$2,036 $0 $797 -$797 $0 $142 -$142 1978 $0 $2,081 -$2,081 $0 $2,036 -$2,036 $0 $797 -$797 $0 $142 -$142 1979 $0 $2,081 -$2,081 $0 $2,036 -$2,036 $0 $797 -$797 $0 $142 -$142 1980 $0 $2,081 -$2,081 $0 $2,036 -$2,036 -$3,158 $797 -$3,955 $0 $142 -$142 1981 $0 $2,081 -$2,081 $0 $2,036 -$2,036 $7,041 $797 $6,244 $0 $142 -$142 1982 $319,823 $2,081 $317,742 $0 $2,036 -$2,036 $3,495 $797 $2,698 $0 $142 -$142 1983 $400,600 $2,081 $398,519 $0 $2,036 -$2,036 -$6,065 $797 -$6,862 $0 $142 -$142 1984 $630,196 $2,081 $628,115 $2,114 $2,036 $78 $10,446 $797 $9,649 $0 $142 -$142 1985 $662,306 $2,081 $660,225 $2,047 $2,036 $11 $6,455 $797 $5,658 $0 $142 -$142 1986 $436,938 $2,081 $434,857 $9,822 $2,036 $7,786 $21,896 $797 $21,099 $0 $142 -$142 1987 $443,817 $1,844 $441,973 $14,398 $1,639 $12,759 $21,946 $797 $21,149 $0 $142 -$142 1988 $474,236 $1,683 $472,553 $3,750 $1,335 $2,415 $15,404 $797 $14,607 $0 $142 -$142 1989 $465,778 $1,601 $464,177 $8,238 $1,015 $7,223 $28,656 $797 $27,859 $0 $142 -$142 1990 $619,142 $1,490 $617,652 $15,229 $1,025 $14,204 $38,331 $797 $37,534 $0 $142 -$142 1991 $610,952 $1,586 $609,366 $7,337 $2,277 $5,060 $44,331 $797 $43,534 $0 $142 -$142 1992 $548,896 $1,575 $547,321 $15,926 $3,542 $12,384 $42,944 $159 $42,785 $0 $142 -$142 1993 $655,894 $1,455 $654,439 $26,175 $3,745 $22,430 $44,169 $159 $44,010 $0 $142 -$142 1994 $640,427 $1,335 $639,092 $6,700 $3,770 $2,930 $42,213 $159 $42,054 $0 $142 -$142 1995 $618,012 $1,341 $616,671 -$12,363 $2,890 -$15,253 $34,046 $159 $33,887 $0 $142 -$142 1996 $731,344 $1,474 $729,870 -$5,514 $1,844 -$7,358 $35,623 $159 $35,464 $0 $142 -$142 1997 $922,792 $1,558 $921,234 $3,362 $1,925 $1,437 $38,239 $159 $38,080 $0 $142 -$142 1998 $778,133 $1,817 $776,316 $978 $1,787 -$809 $37,958 $159 $37,799 $0 $142 -$142 1999 $564,958 $1,979 $562,979 -$391 $1,616 -$2,007 $37,664 $159 $37,505 $41 $142 -$101 2000 $862,685 $2,045 $860,640 -$2,399 $1,452 -$3,851 $33,581 $159 $33,422 -$123 $142 -$265 2001 $1,454,710 $2,188 $1,452,522 -$2,202 $1,203 -$3,405 $35,559 $159 $35,400 $1 $150 -$149 2002 $1,454,567 $2,188 $1,452,379 $2,226 $1,040 $1,186 $37,844 $159 $37,685 $165 $150 $15 2003 $2,025,308 $2,188 $2,023,120 $2,489 $971 $1,518 $37,994 $159 $37,835 $291 $150 $141 2004 $2,497,349 $2,188 $2,495,161 $1,721 $953 $768 $39,428 $159 $39,269 $472 $120 $352
(continued)

Chapter 4 — Sum
mary of Findings
4-3
Table 4-1. Net Benefits Attributable to DOE (thousands $2008), (continued) PDC Binary TOUGH Cement
Year Total Benefits
Program Expenses
Net Benefits
Total Benefits
Program Expenses
Net Benefits
Total Benefits
Program Expenses
Net Benefits
Total Benefits
Program Expenses
Net Benefits
2005 $3,429,701 $2,188 $3,427,513 $6,471 $972 $5,499 $38,802 $159 $38,643 $1,540 $130 $1,410 2006 $4,631,182 $2,188 $4,628,994 $4,882 $972 $3,910 $38,797 $159 $38,638 $1,666 $150 $1,516 2007 $5,589,616 $2,188 $5,587,428 $2,677 $972 $1,705 $40,735 $159 $40,576 $1,811 $142 $1,669 2008 $6,081,340 $2,188 $6,079,152 $10,533 $972 $9,561 $41,817 $159 $41,658 $1,955 $142 $1,813
Undiscounted Total $38,550,702 $63,178 $38,487,524 $124,206 $60,313 $63,893 $846,193 $15,455 $830,738 $7,820 $4,684 $3,136 PVb at 7% $7,813,212 $26,461 $7,786,751 $42,848 $26,819 $16,029 $219,445 $8,619 $210,826 $1,013 $1,938 -$925 PVb at 3% $18,514,201 $41,015 $18,473,186 $76,269 $40,701 $35,568 $457,957 $11,655 $446,302 $3,199 $3,037 $162 BCR at 7% 295.3 1.6 25.5 0.5 BCR at 3% 451.4 1.9 39.3 1.1 IRR 139% 16% 48% NA b PV Base year is 1976.

Retrospective Benefit-Cost Evaluation of U.S. DOE Geothermal Technologies R&D Program Investments: Impacts of a Cluster of Energy Technologies
4-4
4.1.1 Polycrystalline Diamond Compact Drill Bits Technology Description: In the early 1970s, the Geothermal Division of DOE began research to produce an enhanced drill bit that would be more suitable than traditional drill bits for the high-density, high-temperature applications needed to drill geothermal wells (EERE/GTP, 2008a). This led to the development of several technological drilling advances, among which were PDC drill bits. A typical PDC drill bit consists of the drill bit body, usually made from steel or matrix metal, and drill bit cutters, their number varying with the bit diameter. PDC drill bits cutters are made from synthetic diamond powder (heated and pressurized graphite), cobalt, and tungsten carbide, and the bits have the key advantage of having no moving parts. Next Best Alternative: PDC drill bit technology is an improvement to an existing technology. The next best alternative technology is the traditional moving parts roller cone bit. Roller cone bits are an established technology and continue to be used in applications involving shallow wells and softer rock formations. With its harder and longer lasting cutting surface, the PDC bit uses a simpler mechanical action, increasing productivity (feet drilled per hour) and efficiency (decreasing of the number of drill bits per well). Benefits Economic Benefits: Approximately 60% of worldwide oil and gas well footage in 2006 was drilled using PDC drill bits (Blankenship, 2009). The main advantage of PDC drill bits over conventional roller cone bits2 is that they reduce frequency of pulling the drill string to replace the drill bit, allowing higher penetration rates and thus reducing the time (and cost) of renting expensive drill rigs. The use of PDC drill bits in offshore applications in the oil and gas industry is estimated to reduce costs by $58.54 per foot drilled, yielding a PV cost savings of $15.6 billion3 from 1982 to 2008 (see Chapter 5 for calculations and citations for these numbers). Environmental Benefits: Using PDC drill bits does not directly affect emissions. Environmental impacts were judged to be small and were not quantified. Security Benefits: Using PDC drill bits reduces the cost and increases the availability of domestic oil and gas, which can reduce U.S. dependence on foreign imports of oil and gas. However, this potential impact was not quantified. DOE Attribution: DOE played a very important role in developing and adopting the PDC drill bit technology, making significant contribution to (1) developing the bit and getting it to the market, (2)
2 This is true in instances where PDC bits can be applied. PDC bits are less successful in high temperature hard and fractured
rock formations. Since the principal wear mechanism of PDC drill bits is frictional heating, high temperatures only aggravate wear.
3 Here and throughout the report, unless otherwise noted, PVs are discounted at 7%.

Chapter 4 — Summary of Findings
4-5
overcoming performance flaws and limitations, and (3) spurring the innovation that resulted in overall market success of PDC drill bits. As a result, based on the observable technology transfer, findings from published papers, and interviews, this study attributes 50% of the economic benefits from PDC bits to DOE. This attribution estimate is consistent with previous analysis (see Papadakis and Link [1997] and Falcone and Bjornstad [2005]). Thus, the PV of total benefits from DOE’s contributions to developing drill bit technology equal $7.8 billion. Measures of Economic Return: DOE program expenditures associated with PDC drill bit research are presented in Table 4-1 and total $26.5 million from 1982 to 2008. Comparing DOE’s investment in PDC drill bit technology with benefits attributed to DOE yields a net benefit with PV of $7.8 billion ($18.5 billion discounted at 3%). The BCR is calculated to be 295.3 discounted at 7% (451.4 discounted at 3%), and the IRR for PDC drill bit technology project was 139%.
4.1.2 Binary Cycle Power Plant Technology Technology Description: Binary cycle plants represented 14.5% of total geothermal capacity in the United States in 2008. Binary cycle geothermal power plant technology enables efficient use of lower temperature resources through the use of a closed loop heat transfer system. DOE assisted with the penetration of binary cycle plant technology in the United States, by sponsoring research to lower costs and by developing demonstration projects to showcase the technology’s viability. Next Best Alternative: The best alternative to binary cycle is usually flash cycle technology, which was used in 84% of geothermal power plants in 2008 (GEA, 2009a). However, the appropriate counterfactual technology for the benefits analysis differs depending on the temperature of the reservoir where binary cycle is installed:
• In reservoirs where the temperature range is 150oC to 190oC, flash cycle technology is economically viable but has lower electricity generation productivity as compared to binary cycle because of its lower conversion efficiency. Thus, in this temperature range, the next best alternative is a traditional, but less productive, flash cycle geothermal plant.
• In reservoirs where the temperature range is below 150oC, flash cycle technology is not economically viable and no other geothermal technology is available. Hence, for temperature ranges below 150oC, the next best alternative technology is generation from a mix of fossil fuels.

Retrospective Benefit-Cost Evaluation of U.S. DOE Geothermal Technologies R&D Program Investments: Impacts of a Cluster of Energy Technologies
4-6
Benefits Economic Benefits: Economic benefits include the market value of the additional electricity produced from reservoirs where the temperature range is 150oC to 190oC.4 The PV of economic benefit is estimated to be approximately $109.9 million (discounted at 7%) from 1984 to 2008. Environmental Benefits: Environmental benefits result from both (1) the additional renewable electricity generated from reservoirs where the temperature range is below 150oC, offsetting generation from a mix of fossil fuels and (2) the incremental renewable power generation (which has zero emissions) from reservoirs where the temperature range is 150oC to 190oC, which would have been flash cycle –degenerated electricity but are now binary cycle – generated electricity. The PV of environmental health benefits is estimated to be $127 million (discounted at 7%). In addition there are reductions of GHGs totaling 7.3 million tCO2e from 1984 to 2008. Security Benefits: Security benefits derive from reducing the probability and potential impact of oil and natural gas disruptions and price shocks or other energy system disruptions that would damage or disrupt the economy, environment, or national security of the United States. Table 4-2 presents the reduction in 4.9 billion cubic feet of natural gas or 862 thousand barrels of oil equivalent.
Table 4-2. Security Benefits of Binary Cycle Attributable to DOE, 1980-2008
Fossil Fuel Binary Cycle Natural gas (million cubic feet) 4,863 BOE (thousand barrels of oil equivalent) 861.8
DOE Attribution: The main impact of DOE on binary cycle technology has been the demonstration of commercial applicability of binary cycle technology and the provision of guaranteed loans, which helped industry to obtain financing. This accelerated the entry of the technology into the market. Interview participants estimated that the acceleration effect was less than five years but more than six months. Based on that estimate, it was assumed that the acceleration effect of DOE activities was two years. The PV of benefits attributable to DOE’s acceleration effect equaled approximately $42.8 million (discounted at 7%). Measures of Economic Return: DOE expenditures on binary cycle activities represent approximately 1.6% of EERE’s total GTP budget from 1976 to 2008. The PV of expenditures (adjusted to 2008 dollars) equaled $26.8 million discounted at 7% ($40.7 million discounted at 3%). When expenditures are compared to the benefits with PV of $42.8 million discounted at 7% attributed to DOE, DOE’s investment in binary cycle power plant technology yielded net benefits with the PV of $16.0 million
4 The increased productivity associated with binary cycle over flash at this temperature range is achieved at negligible
incremental cost. Thus, the economic benefit is the value of the power generated. For the lower temperature range, because the cost of binary power generation is comparable to the cost of coal power generation there is no economic benefit, but there are environmental benefits.

Chapter 4 — Summary of Findings
4-7
discounted at 7% ($35.6 million discounted at 3%). The BCR discounted at 7% is calculated to be 1.6 (1.9 discounted at 3%), and the IRR for binary cycle plant technology is 16%. 4.1.3 TOUGH Series of Reservoir Models Technology Description: Reservoir models simulate the flow of fluids and thermal energy in the subsurface. They are used as analytical and management tools in forecasting reservoir capacity, designing development activities, and identifying characteristics that may cause changes in the reservoir. Reservoir modeling helps optimize resources and manage risk. DOE’s research efforts helped identify the limitations of traditional exploration techniques and demonstrate the potential for imaging and characterizing subsurfaces, which provided the foundation for geothermal reservoir modeling. Next Best Alternative: Geothermal reservoir modeling, in general, is an example of new technology representing analysis capabilities of much higher complexity than previously available. Before capabilities for detailed computer simulation of geothermal reservoirs were developed, the best alternative was to use so-called “lumped parameter” models. These models simplified reservoir simulation and provided limited information about how fast this energy could be recovered, how many production and injection wells would be required, where these wells should be located, and at what rate makeup wells would be required as the reservoir was being depleted. This sometimes led to incorrect estimation of power plant capacity, thus increasing installed costs. Benefits The benefits associated with using reservoir modeling that were quantified for this study fall into two categories: (1) increased productivity of geothermal resources (the value of the additional electricity generated) and (2) the environmental health benefits associated with the additional renewable energy offsetting fossil fuel generation. Economic benefits: Using reservoir modeling increased productivity of geothermal resources. These benefits are somewhat offset by additional exploration costs associated with reservoir modeling. However, in the aggregate, reservoir modeling has been profitable for the geothermal industry by improving subsurface exploration. The PV of total economic benefits of reservoir modeling from 1984 to 2008 equaled $503.3 million (discounted at 7%). In addition, reservoir modeling has been adapted for other uses, such as nuclear waste geologic storage, carbon dioxide (CO2) sequestration, and remediation of subsurface contamination problems. For these applications, the TOUGH model has been the primary modeling tool; however, this study was not able to quantity the benefits of non-geothermal applications. Environmental Benefits: The increased productivity of geothermal fields yields additional renewable energy that offsets generation from a mix of fossil fuels. The PV of the environmental health benefits associated with the additional renewable energy is estimated to be $450.8 million (discounted at 7%). In addition, there are reductions of GHGs totaling 22.9 million tCO2e.

Retrospective Benefit-Cost Evaluation of U.S. DOE Geothermal Technologies R&D Program Investments: Impacts of a Cluster of Energy Technologies
4-8
Security Benefits: Security benefits derive from reducing the probability and potential impact of oil and natural gas disruptions and price shocks or other energy system disruptions that would damage or disrupt the economy, environment, or national security of the United States. Table 4-3 presents the reduction in 19.4 billion cubic feet of natural gas or 3.4 million barrels of oil equivalent.
Table 4-3. Security Benefits of TOUGH Models Attributable to DOE, 1980-2008
Fossil Fuel TOUGH Models Natural gas (million cubic feet) 19,401 BOE (thousand barrels of oil equivalent) 3,438
DOE Attribution: DOE’s activities in the late 1970s and early 1980s were at the forefront of geothermal reservoir model development, coinciding with the evolution of computer capabilities that enabled complex simulation models to be run cost effectively. To quantify attribution, this study partitioned the suite of available reservoir models into two groups: (1) the TOUGH series of models and (2) other reservoir models (e.g., TETRAD, STAR). Participants interviewed as part of this study indicated that the DOE attribution between the two groups is different:
• DOE had overwhelming influence (80%) on the TOUGH series models.
• DOE efforts were influential (20%) on other reservoir models. Based on a study conducted by O’Sullivan (2001), the share of TOUGH usage for U.S. geothermal applications is approximately 5%, with other reservoir models accounting for 95% of U.S. geothermal reservoir modeling. Using these usage shares and the attribution rates, this study estimates that PV of total benefits discounted at 7% attributable to DOE equaled $219.4 million for the period 1980 to 2008. Measures of Economic Return: The PV of DOE program expenditures, discounted at 7%, associated with the TOUGH family of reservoir models (adjusted to 2008 dollars) equaled $8.6 million from 1976 to 2008 ($11.7 million discounted at 3%). When compared with attributed benefits of $219.4 million discounted at 7%, DOE’s investment in the TOUGH models yielded net benefits with PV of $210.8 million discounted at 7% ($446.3 million discounted at 3%). The BCR is calculated to be 25.5 discounted at 7% (39.3 discounted at 3%). The IRR for the TOUGH program is 48%. 4.1.4 High-Temperature Geothermal Well Cements Technology Description: Early geothermal energy projects revealed that using Portland cement in geothermal wells was problematic, leading to frequent and costly repairs and significantly shorter well lifetimes. In the 1970s, DOE began supporting the development of new well cements that address these shortcomings through basic materials research and applied research on the cementitious properties of various chemical formulations. DOE’s research led to the patenting and commercialization of a calcium aluminate phosphate (CaP) cement system that is resistant to acidic corrosion and maintains structural integrity at extremely high temperatures.

Chapter 4 — Summary of Findings
4-9
Next Best Alternative: High-temperature well cement is a technology improvement over existing Portland-based well cements commonly used in geothermal, oil, and gas wells. Originally developed for use in geothermal wells, high-temperature cement has also been used for enhanced oil recovery projects and offshore well drilling. The DOE-developed cement technology affects new well construction and ongoing maintenance at high-temperature geothermal production wells. Benefits Economic Benefit: The rapid deterioration of Portland cement in geothermal wells (<12 months) resulted in frequent well workovers and costly well remediation. The use of high-temperature cements enhances performance in terms of structural stability and corrosion resistance and is estimated to eliminate $150,000 in annual well remediation costs and extend the working life of geothermal production wells to 20 years or more. The economic benefits from high-temperature cements include (1) cost savings to the end users of CaP cement and (2) profits from the sale of ThermaLock cement. The PV of total benefits from the use of high-temperature cement from 1999 to 2008 is estimated to be $2.1 million (discounted at 7%), with the 99% of the benefits associated with cost savings to users. Environmental Benefits: No environmental benefits were identified associated with using high-temperature cement. However, a complete life-cycle analysis including cement production (beyond the scope of this study) might identify emission reductions in GHGs and other pollutants. Security Benefits: No security benefits were identified associated with using high-temperature cement. DOE Attribution: DOE’s influence on the development of high-temperature cement varied over the 24-year period examined. For example, DOE had a very important influence on determining the direction of cement research, choosing to pursue a ceramic-based cement formulation over a more conventional Portland-based design. In contrast, since commercialization in 1999, Halliburton has marketed ThermaLock for use in domestic and international geothermal and enhanced oil recovery injection wells with minimal direct involvement from DOE. Averaging estimated influence factors over each stage in the technology development cycle yields an estimated 48.3% attribution rate. Thus, roughly half of the total benefits realized from the development CaP cement, or approximately $1 million, are directly attributable to GTP’s research and development activities. Measures of Economic Return: PV of DOE program expenditures associated with cement materials research (adjusted to 2008 dollars) equaled $1.9 million (discounted at 7%) from 1976 to 2008 ($3 million discounted at 3%). Compared with the economic benefits attributed to DOE, DOE’s investment in CaP cement technology yielded PV of −$925 million discounted at 7% in net benefits ($162 million discounted at 3%). However, it is important to note that the technology is in its infancy, and experts interviewed for this analysis predict a considerable increase in the rate of adoption over the next 5 years. Allowing more time for industry to adopt the existing CaP cement technology in geothermal wells
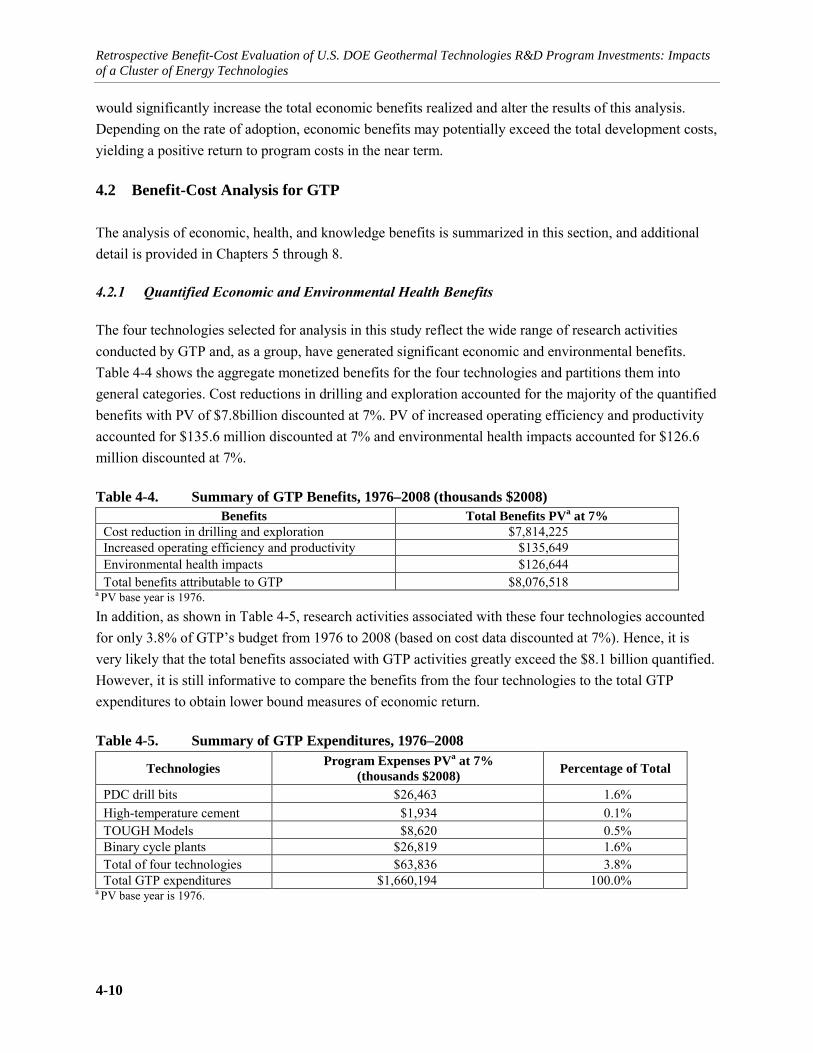
Retrospective Benefit-Cost Evaluation of U.S. DOE Geothermal Technologies R&D Program Investments: Impacts of a Cluster of Energy Technologies
4-10
would significantly increase the total economic benefits realized and alter the results of this analysis. Depending on the rate of adoption, economic benefits may potentially exceed the total development costs, yielding a positive return to program costs in the near term. 4.2 Benefit-Cost Analysis for GTP The analysis of economic, health, and knowledge benefits is summarized in this section, and additional detail is provided in Chapters 5 through 8. 4.2.1 Quantified Economic and Environmental Health Benefits The four technologies selected for analysis in this study reflect the wide range of research activities conducted by GTP and, as a group, have generated significant economic and environmental benefits. Table 4-4 shows the aggregate monetized benefits for the four technologies and partitions them into general categories. Cost reductions in drilling and exploration accounted for the majority of the quantified benefits with PV of $7.8billion discounted at 7%. PV of increased operating efficiency and productivity accounted for $135.6 million discounted at 7% and environmental health impacts accounted for $126.6 million discounted at 7%.
Table 4-4. Summary of GTP Benefits, 1976–2008 (thousands $2008)
Benefits Total Benefits PVa at 7% Cost reduction in drilling and exploration $7,814,225 Increased operating efficiency and productivity $135,649 Environmental health impacts $126,644 Total benefits attributable to GTP $8,076,518
a PV base year is 1976.
In addition, as shown in Table 4-5, research activities associated with these four technologies accounted for only 3.8% of GTP’s budget from 1976 to 2008 (based on cost data discounted at 7%). Hence, it is very likely that the total benefits associated with GTP activities greatly exceed the $8.1 billion quantified. However, it is still informative to compare the benefits from the four technologies to the total GTP expenditures to obtain lower bound measures of economic return.
Table 4-5. Summary of GTP Expenditures, 1976–2008
Technologies Program Expenses PVa at 7% (thousands $2008) Percentage of Total
PDC drill bits $26,463 1.6% High-temperature cement $1,934 0.1% TOUGH Models $8,620 0.5% Binary cycle plants $26,819 1.6% Total of four technologies $63,836 3.8% Total GTP expenditures $1,660,194 100.0%
a PV base year is 1976.

Chapter 4 — Summary of Findings
4-11
Table 4-6 presents the cluster analysis results for GTP. PV of net benefits (in 2008 dollars) for the program is $6.4 billion discounted at 7% ($17 billion discounted at 3%). The BCR is 4.9 discounted at 7% (9.1 discounted at 3%). The IRR is 22%.
Table 4-6. Benefit-Cost Analysis for GTP, 1976–2008 (thousands $2008)
Geothermal Program Year Total Benefits Program Expensesa Net Benefits 1976 $0 $92,819 -$92,819 1977 $0 $130,899 -$130,899 1978 $0 $288,654 -$288,654 1979 $0 $367,328 -$367,328 1980 -$3,158 $316,935 -$320,093 1981 $7,041 $324,090 -$317,049 1982 $323,318 $142,327 $180,991 1983 $394,536 $93,412 $301,124 1984 $642,756 $41,677 $601,079 1985 $670,808 $57,793 $613,015 1986 $468,656 $45,668 $422,988 1987 $480,161 $34,891 $445,270 1988 $493,391 $35,623 $457,768 1989 $502,671 $30,829 $471,842 1990 $672,701 $26,832 $645,869 1991 $662,620 $43,236 $619,384 1992 $607,766 $38,143 $569,623 1993 $726,238 $31,619 $694,619 1994 $689,340 $31,251 $658,089 1995 $639,695 $50,360 $589,335 1996 $761,452 $38,384 $723,068 1997 $964,393 $37,373 $927,020 1998 $817,069 $36,402 $780,667 1999 $602,273 $35,194 $567,079 2000 $893,744 $28,554 $865,190 2001 $1,488,069 $32,205 $1,455,864 2002 $1,494,803 $32,149 $1,462,654 2003 $2,066,083 $30,550 $2,035,533 2004 $2,538,971 $29,348 $2,509,623 2005 $3,476,513 $27,414 $3,449,099 2006 $4,676,527 $24,478 $4,652,049 2007 $5,634,838 $5,107 $5,629,731 2008 $6,135,647 $19,307 $6,116,340
Undiscounted Total $39,528,921 $2,600,851 $36,928,070 PVb at 7% $8,076,518 $1,660,194 $6,416,324 PVb at 3% $19,051,625 $2,082,623 $16,969,002 BCR at 7% 4.9 BCR at 3% 9.1 IRR 22%
a Source: U.S. DOE (2008b). b Base year is 1976, which is the first year of DOE program expenses.
It should be noted that additional benefits are associated with the four technologies that could not be quantified given this study’s timing and resources. For example, environmental health benefits only

Retrospective Benefit-Cost Evaluation of U.S. DOE Geothermal Technologies R&D Program Investments: Impacts of a Cluster of Energy Technologies
4-12
capture the impact of reducing emissions of particulate matter, nitrous oxides, and sulfur oxides and do not reflect other environmental health benefits associated with reductions of other pollutants (such as CO2, mercury). In addition, the use of renewable energy systems, such as geothermal, to generate electricity would also have an impact on fresh water resources in the United States. Thermoelectric generation requires significant amounts of water for cooling and emissions scrubbing. Power plants account for approximately 40% of fresh water withdrawals. Available surface water supplies have not increased in 20 years, and many underground water tables are dropping at an unsustainable rate. 4.2.2 Knowledge Benefits Principal conclusions from assessing knowledge benefits resulting from GTP-funded R&D are the following: the resulting knowledge base includes, among other things, approximately 90 DOE-attributed patent families (where each family contains all patents based on the same invention) and more than 3,000 publications. These patents and publications provided a noteworthy foundation for further innovation in the geothermal energy industry and also in the gas and oil industries. Multiple technologies important to recent advances in producing power from geothermal resources and in increasing efficiency in gas and oil extraction trace back strongly through patents and publications to DOE-funded research.
• Of a total population of more than 1,000 geothermal patent families assigned to numerous organizations, 21% were linked to earlier DOE-attributed geothermal patents and publications, second only to that for the patent portfolio of Chevron, which is billed as the world’s largest producer of geothermal energy. Furthermore, greater than 40% of Chevron’s patents have also built extensively on earlier DOE-attributed geothermal patents and papers, as well as high percentages of the patent portfolios of Ormat and other leading companies in geothermal energy.
• Among the DOE-attributed patent families and publications are those describing Organic Rankine and Kalina thermodynamic cycles, the generation of geothermal energy from hot dry rocks, techniques for treating geothermal brine, advanced drill bits, downhole electronics and data transmission, improved cements to withstand conditions in wells, and other innovations describing geothermal power plants and power generation.
In addition to the knowledge base captured in patents, papers, models, prototypes, test data, and other tacit forms of knowledge, DOE-funded research has trained technologists and researchers in geothermal research across the nation and fostered the development of a network among them. 4.3 Sensitivity Analysis When estimating the environmental health benefits, it was assumed that in the absence of geothermal electricity, additional coal-, natural gas-, and oil-fired power plants would have been built to meet electricity demand. Appendix C describes the method used to obtain the appropriate fuel mix for each state that geothermal power likely offsets (the average value of this mix across states is 60% coal, 39% natural gas, and 1% oil). To investigate how sensitive our findings are to this calculation approach, this

Chapter 4 — Summary of Findings
4-13
study estimated environmental health benefits using an alternative scenario of 50% coal and 50% natural gas, the results of which are presented in Table 4-7. The alternative scenario is not based on new information but is simply intended to illustrate how environmental benefits change as the fuel mix offset changes.
Table 4-7. Environmental Benefits Attributed to DOE: Sensitivity to Displaced Fuel Type
Displaced Generation Percentage Reduction
60% Coal, 39% NG, 1% Oil1
50% Coal, 50% NG
PM (short tons) 22,194 18,780 15.4% SO2 (short tons) 9,611 7,992 16.9% NOX (short tons) 5,035 4,227 16.0% GHG (million tCO2e) 6,585 6,268 4.8% Monetized health benefit (PVa at 7%, thousands $2008) $126,644 $107,501 15.1%
a PV base year is 1976.
Because natural gas generates significantly less PM than coal and PM is the main driver of health impacts in the COBRA model, decreasing the share of coal generation from 60% to 50% decreases the environmental health benefits attributed to DOE by 15.1% or $19.1 million. However, because the majority of benefits are attributable to PDC drill bits, this change reduces the BCR for the cluster analysis by only 0.01 from 4.70 to 4.69. The costs for TOUGH series of models and CaP cement technologies were estimated based on FTE estimates or DOE internal cost records; however, this information was not available for binary cycle plants and PDC drill bit technologies. The costs for the two latter technologies were estimated based on relevant line items from overall GTP budget. A portion of line item expenses from the GTP budget was assigned to these two technologies. This approach likely overestimated PDC drill bit and binary cycle plant technology costs. To investigate how sensitive our findings are to this approach, this study lowered PDC drill bit and binary cycle plants technology costs by 50%. The resulting benefit-cost ratios are presented in Table 4-8. This alternative scenario is not based on specific information but is presented to illustrate how PDC drill bit and binary cycle plant technology and overall benefit-cost ratios change when the cost calculation approach is changed.
Table 4-8. Sensitivity Analysis of GTP Technology Case Study Costs
Technology
Benefit-Cost Ratio at 7% (4 Case Study Technology Costs/4 Case Study Technology Benefits)
Baseline Decrease PDC and Binary Costs by 50%
PDC drill bits 295.3 590.5 Binary Cycle 1.6 3.2 TOUGH Models 25.5 25.5 High-temperature cement 0.5 0.5 4 Case Study Technologies 126.5 217.1
1 This represents the average of fossil fuel mix offset by geothermal production in each state. See Appendix C for details.

Retrospective Benefit-Cost Evaluation of U.S. DOE Geothermal Technologies R&D Program Investments: Impacts of a Cluster of Energy Technologies
4-14
4.4 Caveats 4.4.1 Oil and Gas Sector Benefits The majority of GTP benefits quantified as part of this study are attributed to PDC drill bits. These benefits were primarily in the form of cost reductions in exploration and drilling of oil and gas. Although this category of benefits is not the main objective of GTP’s R&D, this category does reflect economic benefits that are realized by society. It is not uncommon for, spillover benefits to account for a significant share of societal benefits from government-sponsored R&D programs (see Chapter 9 for additional discussion of knowledge benefits). However, it is also possible that knowledge spillovers could have negative benefits from a societal perspective. For example, if cost reductions lead to the increased production of a less desirable good, this could result in a decrease in social welfare. In terms of this study, if the use of PDC drill bits lowers the cost of gasoline and natural gas products, this could increase their use, which carries the negative externalities discussed in earlier sections. The extent of this phenomenon depends on how prices are set in the energy markets and on the demand elasticity of final consumers. Although an analysis of this potential impact is beyond the scope of this study, the following points are noted:
• Energy prices for crude oil and natural gas are driven in large part by output decisions of producing countries and political unrest and minimally by exploration and development costs.
• Final consumers have historically been shown to be price inelastic with respect to their gasoline and natural gas consumption.
As a result, the occurrence of increased use of fossil fuels due to PDC drill bit cost reductions is likely to be minor.

Chapter 5 — Polycrystalline Diamond Compact Drill Bits: Technology Impact Assessment
5-1
5. POLYCRYSTALLINE DIAMOND COMPACT DRILL BITS: TECHNOLOGY IMPACT ASSESSMENT
5.1 Introduction Approximately 60% of worldwide oil and gas well footage in 2006 was drilled using polycrystalline diamond (PDC) drill bits. A typical PDC compact drill bit consists of the drill bit body, usually made from steel or matrix metal, with synthetic diamond (PDC) cutters attached. Figure 5-1 compares typical PDC drill bits to roller-cone drill bits. DOE initially sponsored PDC drill bits as a potential application for geothermal wells and they have since been widely adopted by the oil and gas industry. This section discusses the history and social benefits of PDC drill bit technology attributable to DOE, and DOE’s role in bringing this technology to the U.S. market. PV of total benefits related to PDC drill bit technology are estimated to be approximately $15 billion (discounted at 7%). Approximately $7.6 billion (discounted at 7%) of these benefits can be attributed to DOE through its research activities resulting from an investment with PV of $26.5 million discounted at 7%.
Figure 5-1. PDC and Roller-Cone Drill Bits
PDC Drill Bits Roller-Cone Drill Bits
Source: EERE/GTP (2008c)
5.2 History of the Technology In the early 1970s, the Organization of the Petroleum Exporting Countries (OPEC) and individual oil-producing countries instituted higher prices and oil embargoes from 1973 to 1985, putting pressure on the U.S. oil companies to expand oil production to more challenging geographic regions, such as deeper wells in the Gulf of Mexico (Jones, 1988) and to look for other energy sources. These events led to the development of several technological drilling advances, among which was the PDC drill bit. At that time, government labs began research to produce an enhanced drill bit that would reduce drilling costs for geothermal wells. Drilling is a large part of the capital cost of a geothermal power plant; thus, cheaper drilling provides a definite stimulus for placing geothermal power online.

Retrospective Benefit-Cost Evaluation of U.S. DOE Geothermal Technologies R&D Program Investments: Impacts of a Cluster of Energy Technologies
5-2
High temperatures in geothermal wells cause serious damage to traditional roller cone bits, partly because of damage to the bearing seals and bearings. PDC drill bits have the advantage of no moving parts. A typical PDC drill bit consists of the drill bit body, usually made from steel or matrix metal (Mensa-Wilmot, 2003), with PDC cutters attached. The number of cutters varies with the bit diameter and the hardness of the formation that it is designed to drill. The cutters are made under immense pressure and temperature from synthetic diamond powder sintered with cobalt onto a tungsten carbide substrate. The resulting disks (also known as compacts) can be made in different sizes but are typically 0.5 inch in diameter and 0.3 inches thick. The disks are bonded to tungsten carbide cylinders to form cutters, and the cylinders are then brazed into the bit body (Falcone and Bjornstad, 2005). General Electric (GE) developed synthetic diamonds in 1955 and first used them on prototype drill bits in the field in 1973 (Madigan and Caldwell, 1981). However, field versions of early bits were disappointing, because the compacts detached from their mounts and wore out quickly. To address these issues, beginning in the 1970s, Sandia National Laboratories (SNL) conducted in-house research and promoted industry research and development by funding field tests and fundamental studies of rock-cutting interactions and frictional heating of the cutters. The research was broadly focused on the following areas (Finger and Glowka, 1989):
• Bit-rock interaction to understand how cutters induce failure in rock.
• Diffusion bonding to prevent cutters from detaching from the mounting studs or the bit body.
• Cutter temperature modeling to understand how frictional heating affects the wear behavior of PDC cutters.
• Single-cutter tests to model bit behavior as a function of a combination of parameters, such as vertical force, depth of cut, type of rock, rake angle, and lubricity of the drilling fluid.
• Bit design modeling to determine the layout of cutter patterns on a PDC.
The first commercial application of PDC drill bits occurred in 1976, and in 1977, GE marketed the first PDC cutter under the name Stratapax (Slack and Wood, 1982). PDC bits were initially less successful in geothermal formations because the principal wear mechanism of PDC drill bits is frictional heating. High-heat and hard and fractured rock formations aggravated that problem. Nonetheless, PDC bits drill soft formations at high temperatures. Successful PDC drill bit research was adopted by the oil and gas industry.
Cooperation between the oil and gas industry and SNL began during the period 1973 to 1977, while the lab was working with GE on improving the performance of the PDC drill bit. SNL sponsored wear and friction tests and conducted research on drill mechanics and hydraulics. After drill bit commercialization in 1977, Sandia kept working with the industry (because it was willing to participate in research that was mutually beneficial to the geothermal program and oil and gas industry), and the R&D program continued (Papadakis and Link, 1997). SNL helped resolve several technical problems exhibited by PDC bits and aided in bit design. Sandia National Laboratories’ computer program, STRATAPAX, released in 1982,

Chapter 5 — Polycrystalline Diamond Compact Drill Bits: Technology Impact Assessment
5-3
and later PDCWEAR, released in 1986, helped manufacturers place cutters on the bit strategically (Falcone and Bjornstad 2005). PDCWEAR could “compare bit designs and gain detailed information on the individual cutters so that the bit design can optimally place the cutters to produce uniform cutter wear. PDCWEAR also predicted the performance of specific bit-rock combinations” (Finger and Glowka, 1989, p. 63). SNL’s PDC R&D program ran through 1986. After this, SNL’s scientists and engineers continued to contract with a consortium of PDC drill bit manufacturers and university researchers to work on advancing the PDC technology (Glowka and Schaefer, 1993). For example, in 1995, Sandia’s scientists collaborated with five drill bit companies (in the research sponsored by the industry) to improve performance of PDC drill bits in harder rock formations (Glowka et al., 1995) and in 2004 SNL cooperated with bit manufacturers in testing “best effort” drag bits in extensive drilling tests (Wise et al., 2004). In general, advances in PDC drill bit technology since the first commercial application can be broken into three overlapping time segments:
• From 1977 to 1986, fundamental design and manufacturing deficiencies were identified and corrected.
• From 1979 to 1998, enabling research in bit mechanics, hydraulics, and thermal effects was performed. The PDCWEAR computer code was developed, which enabled the development of anti-whirl drill bits. Also, best practices in operation were established during this period.
• From 1996 to 2006, drilling dynamics were addressed, and improved cutter structures were tested and implemented. Integrated bit/bottom hole assembly was developed, and rotary steerable subs were introduced (Blankenship, 2009).1
Experts and practitioners agree that Sandia National Laboratories played an important role in developing PDC drill bit technology. The lab’s contribution to PDC technology included providing financing and R&D contracts to GE to run wear and friction tests, performing internal research on PDC drill mechanics and hydraulics, performing PDC drill bit tests in the field, and resolving technical problems with PDC drill bits (Papadakis and Link, 1997). The transfer of knowledge from DOE to drill bit manufacturers occurred through peer-to-peer discussion and numerous presentations and papers published by SNL.
1 Note that our economic benefit estimates below are based on per linear foot drilled and hence capture impacts for both
horizontal and vertical drilling.

Retrospective Benefit-Cost Evaluation of U.S. DOE Geothermal Technologies R&D Program Investments: Impacts of a Cluster of Energy Technologies
5-4
5.3 Next Best Alternative Polycrystalline diamond compact drill bit technology is an example of improvement to an existing technology. The next best alternative technology is the traditional moving parts roller cone bit.1 Roller cone bits are an established technology and continue to be used in applications where PDC bits are unsuitable, such as very hard formations. With its harder and longer lasting cutting surface, the PDC bit uses a more efficient mechanical action, shearing rock instead of crushing it. This mechanical action increases productivity (feet drilled per hour) and reduces the frequency of pulling the drill string to exchange a drill bit; thus, increasing efficiency (decreasing of the number of drill bits per well). Compared to roller cone drill bits, PDC drill bits reduce the time and costs of drilling. Both PDC and roller cone drill bits have improved over time. However, there is limited empirical data to measure improvements in cost effectiveness of both drill bit types. Thus, this study uses fixed “delta” technical impact metrics over the time period of this analysis. This assumes that improvements over the technology’s lifespan are comparable for both the PDC and the alternative roller cone drill bits. 5.4 Benefits Calculations Benefits realized from using PDC drill bit technology are primarily economic benefits and are segmented into profits to manufacturers of PDC drill bits and cost reductions to oil producers from using PDC drill bits in oil exploration. Table 5-1 summarizes the key parameters and assumptions used to estimate benefits.
Table 5-1. Key Parameters and Assumptions Used in the PDC Drill Bit Benefits Analysis
Parameters/Assumptions Source PDC drill bit market penetration 60% by 2008 Blankenship (2009) Crude oil and natural gas exploratory and developmental well footage drilled
Crude Oil Developmental and Exploratory Well Footage (U.S. DOE, 2010a); Natural Gas Developmental and Exploratory Well Footage (U.S. DOE, 2010b)
PDC drill bits yield a cost reduction of $59 per foot drilled
Average of seven empirical studies published between 1982 and 1997
6.5% net profit estimate for drill bit producers Falcone and Bjornstad (2005) 50% attribution of benefits to DOE Published literature including Papadakis and Link
(1997), interviews with industry and DOE experts
5.4.1 Economic Benefits (Profits) to PDC Drill Bit Producers To estimate the benefits to polycrystalline diamond compact drill bit producers, historical PDC drill bit sales were studied, starting in 1982, which was the first year for which the PDC market could be defined (Falcone and Bjornstad, 2005). This study used data from three sources to construct sales estimates from 1982 to 2008: Falcone and Bjornstad (2005) provided sales estimates for 1982 to 1992, the U.S. DOE
1 PDC drill bits replaced roller cone bits for certain applications in the oil and gas industry; however, roller cone bits are still used
almost exclusively for geothermal applications.

Chapter 5 — Polycrystalline Diamond Compact Drill Bits: Technology Impact Assessment
5-5
(2000a) provided sales estimates for 2000, and Freedonia Group (2009) supplied sales estimates for 2007. Sales for 1993 to 1999 and 2001 to 2008 were calculated from the above data using linear interpolation. The estimated sales for the entire period are presented in Table 5-2. We considered profit margins for the four largest PDC drill bit manufacturers: Baker Hughes, Smith Bits, ReedHycalog, and Security-DBS. Unfortunately, all four top producers are subsidiaries of large oil (service or tool and equipment) companies: Baker Hughes of Baker International, Smith Bits of Smith International, Security-DBS of Halliburton, and ReedHycalog of National Oilwell Varco. Parent companies did not provide profitability numbers for subsidiaries, and using parent company profitability information would be misleading. Falcone and Bjornstad (2005) estimated 6.5% as a net profit estimate for drill bit producers. Therefore, 6.5% was used as a net profit estimate for drilling companies. The profit calculation for drill bit manufacturers is presented in Table 5-2. Table 5-2. Profits to PDC Drill Bit Manufacturers from PDC Drill Bit Technology, 1982–2009
Year Annual Sales of PDC Drill Bits
(thousands $current)
Annual Sales of PDC Drill Bits
(thousands $2008)
Profitsa (thousands $2008)
1982 $300,697 $588,679 $38,264 1983 $377,503 $710,928 $46,210 1984 $595,101 $1,080,234 $70,215 1985 $626,449 $1,103,680 $71,739 1986 $413,769 $713,149 $46,355 1987 $420,911 $705,044 $45,828 1988 $450,533 $729,608 $47,425 1989 $443,303 $691,796 $44,967 1990 $590,329 $886,913 $57,649 1991 $583,451 $846,563 $55,027 1992 $524,734 $743,776 $48,345 1993 $627,620 $870,365 $56,574 1994 $613,365 $833,037 $54,147 1995 $592,408 $788,196 $51,233 1996 $701,587 $916,030 $59,542 1997 $885,875 $1,136,466 $73,870 1998 $747,337 $948,036 $61,622 1999 $542,911 $678,724 $44,117 2000 $829,704 $1,015,301 $65,995 2001 $1,400,276 $1,675,773 $108,925 2002 $1,400,979 $1,649,763 $107,235 2003 $1,952,203 $2,250,638 $146,291 2004 $2,409,614 $2,701,058 $175,569 2005 $3,312,964 $3,594,016 $233,611 2006 $4,478,373 $4,704,668 $305,803 2007 $5,410,144 $5,525,630 $359,166 2008 $5,890,035 $5,890,035 $382,852
Undiscounted Total $2,858,577 PVb at 7% $602,767
Sources: Falcone and Bjornstad (2005), U.S. DOE (2000a), Freedonia Group (2009). a Calculations are based on assumption of 6.5% profit margin. b Base year is 1976, which is the first year of DOE program expenses.

Retrospective Benefit-Cost Evaluation of U.S. DOE Geothermal Technologies R&D Program Investments: Impacts of a Cluster of Energy Technologies
5-6
5.4.2 Economic Benefits (Cost Reductions) from Using PDC Drill Bits One of the main expenditures to oil production companies is the cost of renting drilling rigs. Regardless of whether the well is successful, drilling companies could pay up to $1,000,000 (in 2008 dollars) for a drilling rig per day (Falcone and Bjornstad, 2005; Blankenship, 2009). Oil producers often use cost per foot calculations as a measure of drilling efficiency. The following formula is used to calculate cost per foot:
Drilled Footage
Cost] LaborCost ToolCost Bit Cost Rig Hour Time) Trip Time [(Drilling
Foot
Cost +++×+=
The main advantage of PDC drill bits over the conventional roller cone bits is that they allow higher penetration rates and reduce the frequency of changing the drill bit, reducing the time of renting expensive drill rigs. Even though PDC bits themselves cost more than roller cone bits, they produce net benefits of cost per foot. To calculate the benefits to the oil extraction industry resulting from cost savings of drilling with PDC bits, this study uses the following formula:
Foot)-Per-(Savings x Drilled) Footage WellGas and Oil (Annual x n)Penetratio Market (PDC Savings Cost =
Where:
• PDC market penetration is the percentage of crude oil and gas wells drilled with PDC bits,
• Annual well footage drilled is the oil well footage drilled in the United States annually, and
• Savings-per-foot is the inflation-adjusted dollars saved per foot from drilling wells with PDC bits as compared to baseline roller cone bits.
Figure 5-2 presents the percentage of world oil and gas well footage drilled with PDC drill bits. This study assumes that drilling in the United States followed a similar pattern. Market penetration started low in early 1980s and grew greatly in the 1990s with greater use of horizontal drilling and an increase in oil and gas demand.

Chapter 5 — Polycrystalline Diamond Compact Drill Bits: Technology Impact Assessment
5-7
Figure 5-2. PDC Drill Bits’ Penetration Curve and Total Worldwide Crude Oil and Natural Gas Well Footage Drilled with PDC Bits, 1982–2008
0
50,000
100,000
150,000
200,000
250,000
300,000
350,000
400,000
0%
10%
20%
30%
40%
50%
60%
70%
1982
1984
1986
1988
1990
1992
1994
1996
1998
2000
2002
2004
2006
2008
Thou
sand
Fee
t
Perc
ent
PDC Penetration Total Footage Drilled
Source: Blankenship (2009).
Figure 5-2 also presents total developmental oil and gas well footage drilled in the United States from 1982 (the year PDC drill bits were introduced to the market) to 2008. Since the oil boom of the early 1980s, there has been a significant decline in the total footage drilled; however, the total footage drilled started rising in the early 2000s and reached 350 million feet in 2008.

Retrospective Benefit-Cost Evaluation of U.S. DOE Geothermal Technologies R&D Program Investments: Impacts of a Cluster of Energy Technologies
5-8
Table 5-3 presents the calculation of average savings per foot from drilling oil wells with PDC drill bits as compared with conventional roller cone bits. Seven studies were located that presented savings-per-foot estimates, dating from 1982 to 1997. These studies represent four geographic locations and presented a total of 19 savings estimates for seven different hole sizes for both oil and gas wells. Savings estimates were adjusted by the gross domestic product deflator, and weighted by the length drilled. The average cost saving was $58.54 per foot in 2008 dollars.
Table 5-3. Average Cost Reductions per Foot in Crude Oil and Natural Gas Wells Drilled with
PDC Bits
Study (Year)
Year Sampled Area
Hole Diameter
(in)
Length Drilled (feet)
Real Savings per foot drilled ($2008)
Weighted Savings per foot drilled ($2008)
Slack and Wood (1982) 1981 Texas 8 3/4 1,700 $20 $0.68 1981 Texas 8 3/4 731 $288 $4.21 1981 Texas 8 3/4 800 $309 $4.94 1981 Texas 8 3/4 3,412 $13 $0.90 1981 Texas 8 3/4 4,590 $47 $4.31 1981 Texas 8 1/2 1,782 $180 $6.41 1981 Louisiana 8 1/2 3,860 $12 $0.93 1981 Louisiana 6 3/4 4,113 $11 $0.91 Gani (1982) 1982 Indonesia 12 1/4 3,491 $35 $2.44 1982 Indonesia 7 3/8 705 $192 $2.70 1982 Indonesia 7 3/8 507 $80 $0.81 Wampler and Myhre (1990) 1990 South Texas 8 3/4 3,000 $9 $0.54 1990 South Texas 8 3/4 1,300 $6 $0.16 1990 South Texas 6 1/4 2,100 $7 $0.29 Boudreaux and Massey (1994) 1994 Gulf of Mexico 12 1/4 2,841 $69 $3.91 Casto (1995) 1995 Gulf of Mexico 12 1/4 2,841 $187 $10.61 McDonald and Felderhoff (1996) 1996 Gulf of Mexico 6 1/8 2,701 $22 $1.19 Mensa-Wilmot (1997) 1997 Gulf of Mexico 12 1/4 5,814 $43 $5.00 1997 Gulf of Mexico 12 1/4 3,767 $101 $7.60 Average $86 $58.54
Crude oil and gas well footage drilled with PDC drill bits (see Table 5-4) were calculated based on information from Figure 5-2. This footage was multiplied by cost reduction of $59 per foot to obtain annual benefits to the oil and gas extraction industry. The PV of total benefits equaled approximately $15 billion (discounted at 7%).

Chapter 5 — Polycrystalline Diamond Compact Drill Bits: Technology Impact Assessment
5-9
Table 5-4. Benefits from Using PDC Drill Bit Technology
Year Crude Oil and Natural Gas Exploratory and
Developmental Well Footage Drilled with PDC Bitsa (thousand feet)
Savings Based on Well Footageb
(thousands $2008) 1982 10,273 $601,381 1983 12,897 $754,990 1984 20,331 $1,190,177 1985 21,402 $1,252,873 1986 14,136 $827,521 1987 14,380 $841,805 1988 15,392 $901,048 1989 15,145 $886,588 1990 20,168 $1,180,635 1991 19,933 $1,166,878 1992 17,927 $1,049,447 1993 21,442 $1,255,215 1994 20,955 $1,226,706 1995 20,239 $1,184,791 1996 23,969 $1,403,145 1997 30,265 $1,771,713 1998 25,532 $1,494,643 1999 18,548 $1,085,800 2000 28,346 $1,659,375 2001 47,839 $2,800,495 2002 47,863 $2,801,900 2003 66,695 $3,904,325 2004 82,322 $4,819,130 2005 113,184 $6,625,791 2006 152,999 $8,956,561 2007 184,832 $10,820,065 2008 201,227 $11,779,829
Undiscounted Total $74,242,828 PVc at 7% $14,981,464
Source: Crude Oil Developmental and Exploratory Well Footage (U.S. DOE, 2010a); Natural Gas Developmental and Exploratory Well Footage (U.S. DOE, 2010b)
a Crude Oil and Natural Gas Exploratory and Developmental Well Footage Drilled with PDC Bits = (Oil Well Footage + Gas Well Footage) x Penetration Curve (from Figure 5-2).
b Savings Based on Wells Footage = Crude Oil and Natural Gas Exploratory and Developmental Well Footage Drilled with PDC Bits x Average Cost Reductions per Foot in Crude Oil and Natural Gas Wells Drilled with PDC Bits ($58.54 from Table 5-2).
c Base year is 1976, which is the first year of DOE program expenses.
Calculations of total benefits of PDC drill bit technology are presented in Table 5-5. Total benefits represent the sum of cost reductions to oil and gas producers and profit to PDC drill bit manufacturers. For 1982 to 2008, the introduction of PDC drill bit technology resulted in total benefits with PV of $15.6 billion (discounted at 7%).

Retrospective Benefit-Cost Evaluation of U.S. DOE Geothermal Technologies R&D Program Investments: Impacts of a Cluster of Energy Technologies
5-10
Table 5-5. Total Economic Benefits from PDC Drill Bit Technology (thousands $2008)
Year Savings Based on Well Footage
Annual Profits from Sales of PDC Drill Bits Total Benefit
1982 $601,381 $38,264 $639,646 1983 $754,990 $46,210 $801,201 1984 $1,190,177 $70,215 $1,260,392 1985 $1,252,873 $71,739 $1,324,612 1986 $827,521 $46,355 $873,876 1987 $841,805 $45,828 $887,633 1988 $901,048 $47,425 $948,472 1989 $886,588 $44,967 $931,555 1990 $1,180,635 $57,649 $1,238,284 1991 $1,166,878 $55,027 $1,221,904 1992 $1,049,447 $48,345 $1,097,792 1993 $1,255,215 $56,574 $1,311,788 1994 $1,226,706 $54,147 $1,280,853 1995 $1,184,791 $51,233 $1,236,024 1996 $1,403,145 $59,542 $1,462,687 1997 $1,771,713 $73,870 $1,845,583 1998 $1,494,643 $61,622 $1,556,266 1999 $1,085,800 $44,117 $1,129,917 2000 $1,659,375 $65,995 $1,725,369 2001 $2,800,495 $108,925 $2,909,420 2002 $2,801,900 $107,235 $2,909,135 2003 $3,904,325 $146,291 $4,050,617 2004 $4,819,130 $175,569 $4,994,699 2005 $6,625,791 $233,611 $6,859,402 2006 $8,956,561 $305,803 $9,262,365 2007 $10,820,065 $359,166 $11,179,231 2008 $11,779,829 $382,852 $12,162,681
Undiscounted Total $74,242,828 $2,858,577 $77,101,405 PVa at 7% $15,626,424
a Base year is 1976, which is the first year of DOE program expenses.
5.4.3 Environmental Benefits The development of polycrystalline diamond compact drill bits was one of several technological advances which in combination supported the introduction of directional drilling. Through the use of horizontal drilling, the physical foot print of drilling platforms has been reduced, resulting in less disruption of the environment. Because it would be difficult to quantify this impact it was not included in the monetary benefits estimates. 5.4.4 Security Benefits The use of PDC drill bits lowered the cost of oil and gas production and potentially increased domestic supply. This may have had an effect on the U.S. dependence on foreign oil and gas imports. However,

Chapter 5 — Polycrystalline Diamond Compact Drill Bits: Technology Impact Assessment
5-11
quantifying these impacts was beyond the scope of this study.
5.5 Attribution Share Sandia National Laboratories played a critical role in the development and adoption of the PDC drill bit technology. Through a review of the literature and interviews with experts, this study found that SNL significantly contributed to the development and adoption of PDC technology by (1) developing the bit and getting it to the market, (2) overcoming many of the performance flaws and limitations, and (3) spurring the innovation that resulted in overall market success of PDC drill bits. Table 5-6 provides an overview of SNL’s contributions at the different stages of the PDC bit development life cycle. SNL conducted research on bit mechanics and hydraulics which would prove useful in overcoming some of the technologies’ limitations. The Lab’s research identified the cause of and provided a solution to catastrophic bit failure, and solved the bit’s spalling (or chipping off of diamond cutter) problem, resulting in solutions that became industry standards. To resolve the spalling problem, an issue caused by wear rate, SNL established an optimal bit parameter (a 20-degree back-rake angle) and designed a nozzle layout to achieve optimal cooling of the bit. Both of those innovations were adopted and widely used by bit manufacturers. SNL also created sophisticated computer code that allowed manufacturers position the desired number of cutters on a bit (Falcone and Bjornstad, 2005). SNL’s R&D efforts, publications, and innovations brought attention and publicity to PDC drill bit technology, resulting in its overall market success. As mentioned previously, GE acknowledged that SNL’s research helped deliver PDC drill bits to the market on time. Many officials credited the “publicness” of Sandia’s efforts as a difference maker in PDC drill bit success (Papadakis and Link, 1997). SNL’s research resulted in 34 published journal articles and 42 presentations, representing the flow of information from SNL to the industry. Moreover, approximately half of the industry used one of the versions of SNL’s computer code. Furthermore, using PDCWEAR code as a basis, Amoco developed an anti-whirl drill bit, which further increased industry savings and spurred a new wave of innovations (Falcone and Bjornstad, 2005). As one expert noted, PDC drill bits were an enabling technology for the horizontal drilling3 that is so heavily relied upon for offshore drilling (Blankenship, 2009). An estimated 60% of worldwide oil and gas well footage was drilled using PDC drill bits in 2008 (Figure 5-2). A large share of this footage is attributable to horizontal drilling.
3 Horizontal drilling is the process of drilling and completing, for production, a well that begins as a vertical or inclined linear
bore that extends from the surface to a subsurface location just above the target oil or gas reservoir, called the “kickoff point,” then bears off on an arc to intersect the reservoir at the “entry point,” and thereafter, continues at a near-horizontal attitude tangent to the arc to substantially or entirely remain within the reservoir until the desired bottom hole location is reached (U.S. DOE, 1993). The total linear footage used in the benefits calculations captures both vertical and linear drilling.

Retrospective Benefit-Cost Evaluation of U.S. D
OE G
eothermal Technologies R&
D Program
Investments:
Impacts of a C
luster of Energy Technologies
5-12
Table 5-6. A Matrix Assessing DOE Attribution of PDC Drill Bit Technology by Stage Categories of Information Needed for
Additionality Assessment
Technology Timeline (Stage of Research, Development, and Commercialization)
Preliminary & Detailed
Investigation
Develop Components
Develop System Validate/Demonstrate Commercialize Market Adoption DOE
Attribution
What DOE support of SNL and others did
Study applicability of PDC drill bits to geothermal fields
Worked on improving performance of drill bits
Financed contracts and R&D efforts with GE
Conducted research on drill mechanics and hydraulics
Developed STRATAPAX and PDCWEAR, which helped place cutters on the drill bit
Sponsored wear and friction tests
Helped establish best practices
Held workshops, sponsored publications and presentations
DOE efforts helped commercialize PDC bits
DOE scientists and engineers contracted with consortium of drill bit manufacturers to continue improving the performance of PDC drill bits
50%
What others did (rival explanations)
GE developed PDC in 1955 and first tested in the field 1973
GE worked on DOE contracts
GE used STRATAPAX to position cutters on drill bits
Industry used PDCWEAR to create anti-whirl drill bits
Driving/ restraining policies/ government forces (rival explanations)
USGS study showed availability of geothermal fields around United States
Oil crisis, U.S. government studied energy sources alternative to fossil fuels
Oil crisis, U.S. government studied alternative energy sources to fossil fuels (including geothermal)
Demand for oil went up, creating a demand for offshore drilling
PDC bits became enabling technology for horizontal drilling widely used in offshore drilling
Federal and State Tax Credits
(continued)

Chapter 5 — Polycrystalline D
iamond Com
pact Drill Bits: Technology Im
pact Assessment
5-13
Table 5-6. A Matrix Assessing DOE Attribution of PDC Drill Bit Technology by Stage, (continued) Categories of
Information Needed for
Additionality Assessment
Technology Timeline (Stage of Research, Development, and Commercialization)
Preliminary & Detailed
Investigation
Develop Components Develop System Validate/Demonstrate Commercialize Market Adoption DOE
Attribution
Description of DOE influence
Very Important (50%)
DOE efforts helped consider applications of costly PDC drill bit technology
Very Important (50%)
DOE supported the technology at the time when it seemed too costly and unreliable
Dominant (70%) Developed
analytical tools that helped advance the application of the technology
Greatly improves bonding of cutters to drill bit
Dominant (70%) DOE efforts helped
show that it is possible to overcome the short-comings of PDC drill bit technology with engineering and research
Influential (25%)
DOE’s efforts helped deliver PDC bits right before there was an increase in demand for a similar technology, which helped the adoption of PDC bits
Influential (25%)
DOE’s expertise remained available for the industry to use in their own R&D efforts
50%
Basis of evidence for influence
Interviews with experts
Articles Studies
Interviews with experts
Articles Studies
Interviews with experts
Articles Studies
Interviews with experts
Articles Studies
Interviews with experts
Articles Studies
Interviews with experts
Articles Studies
The DOE effect Accelerated technology entry
Improved performance
Improved performance
Changed costs
Improved performance
Improved performance

Retrospective Benefit-Cost Evaluation of U.S. DOE Geothermal Technologies R&D Program Investments: Impacts of a Cluster of Energy Technologies
5-14
Sandia National Laboratories also helped with initial PDC bit development and commercial introduction. GE acknowledges that SNL helped deliver PDC drill bits to market several years before GE could on its own. As such, PDC drill bits were introduced on the eve of the drilling boom of the early 1980s, and the increased demand for drill bits during this period overcompensated for PDC bits’ initial negative reputation. Had the PDC bits been introduced just a few years later, they would have failed to achieve significant market penetration because of the widespread entrenchment of roller bit technology (Papadakis and Link, 1997; Falcone and Bjornstad, 2005). The published literature documents that, overall, SNL played a crucial role in innovation and market success of PDC drill bits. The PDCWEAR program code was used by almost half of the industry companies and represents a discrete piece of technology transferred from SNL to industry. Nevertheless, equally important was the incalculable amount of knowledge transferred since the beginning of SNL-industry collaboration in the 1970s, which included research on mechanics, physics, and hydraulics of PDC bit operation. As a result, based on the observable technology transfer, findings from published papers, and interviews, this study attributes 50% of the economic benefits from PDC bits to DOE. As shown in Table 5-6, DOE’s influence varied across the stages of technology research development and commercialization, with DOE’s greatest impact occurring during system development and validation/demonstration. This attribution estimate is consistent with previous analysis. Papadakis and Link (1997) mention that about half of industry references to major improvements during a critical stage of the PDC drill bit product cycle were to Sandia’s research. Papadakis and Link (1997) assigned 50% of economic benefits of PDC drill bit technology to SNL. Falcone and Bjornstad (2005) state that even though SNL’s research was a critical precondition to market success, SNL partnered with industry stakeholders to bring innovation to the market. These partnerships were often equal; thus, Falcone and Bjornstad (2005) also assigned 50% of economic profits to SNL. The total benefits of PDC drill bit technology were calculated in the previous section, and, as fifty percent of those savings are attributable to SNL, the total benefit from SNL’s contributions to developing drill bit technology equaled $37.4 billion. The timeline of benefits is presented in Figure 5-3.

Chapter 5 — Polycrystalline Diamond Compact Drill Bits: Technology Impact Assessment
5-15
Figure 5-3. PDC Drill Bit Technology Benefits Attributable to DOE, 1982–2008
$0
$1,000,000
$2,000,000
$3,000,000
$4,000,000
$5,000,000
$6,000,000
$7,000,000
Total Benefits ($2008 Thousand Dollars)
Total Benefits (Billion $2008) = $37,4
5.6 Benefit-Cost Analysis DOE program expenditures and benefits associated with PDC drill bit research are presented in Table 5-7. These expenditures are based on a time series of appropriation items provided by DOE for EERE budgets from 1976 to 2008. The expenditures in Table 5-7 derive from appropriation line items associated with PDC drill bit research and demonstration activities, and represent approximately 1.6% of EERE’s total GTP budget during this time period (see Appendix D for additional detail on GTP cost estimates). The PV of total expenditures (adjusted to $2008) equaled $26.5 million discounted at 7% from 1976 to 2008 ($41 million discounted at 3%). DOE’s investment in PDC drill bit technology yielded net benefits with PV of $7.8 billion in net benefits ($18.5 billion discounted at 3%).
Total Benefits (Billion $2008) = $ 37.4
Total Benefits (thousands $2008)

Retrospective Benefit-Cost Evaluation of U.S. DOE Geothermal Technologies R&D Program Investments: Impacts of a Cluster of Energy Technologies
5-16
Table 5-7. PDC Drill Bit Technology Net Benefits Attributable to DOE, 1976–2008 (thousands $2008)
Year Total Benefits Program Expenses Net Benefits 1976 $0 $2,081 -$2,081 1977 $0 $2,081 -$2,081 1978 $0 $2,081 -$2,081 1979 $0 $2,081 -$2,081 1980 $0 $2,081 -$2,081 1981 $0 $2,081 -$2,081 1982 $319,823 $2,081 $317,742 1983 $400,600 $2,081 $398,519 1984 $630,196 $2,081 $628,115 1985 $662,306 $2,081 $660,225 1986 $436,938 $2,081 $434,857 1987 $443,817 $1,844 $441,973 1988 $474,236 $1,683 $472,553 1989 $465,778 $1,601 $464,177 1990 $619,142 $1,490 $617,652 1991 $610,952 $1,586 $609,366 1992 $548,896 $1,575 $547,321 1993 $655,894 $1,455 $654,439 1994 $640,427 $1,335 $639,092 1995 $618,012 $1,341 $616,671 1996 $731,344 $1,474 $729,870 1997 $922,792 $1,558 $921,234 1998 $778,133 $1,817 $776,316 1999 $564,958 $1,979 $562,979 2000 $862,685 $2,045 $860,640 2001 $1,454,710 $2,188 $1,452,522 2002 $1,454,567 $2,188 $1,452,379 2003 $2,025,308 $2,188 $2,023,120 2004 $2,497,349 $2,188 $2,495,161 2005 $3,429,701 $2,188 $3,427,513 2006 $4,631,182 $2,188 $4,628,994 2007 $5,589,616 $2,188 $5,587,428 2008 $6,081,340 $2,188 $6,079,152
Undiscounted Totals $38,550,702 $63,178 $38,487,524 PVa at 7% $7,813,212 $26,461 $7,786,751 PVa at 3% $18,514,201 $41,015 $18,473,186
a Base year is 1976, which is the first year of DOE program expenses.

Chapter 5 — Polycrystalline Diamond Compact Drill Bits: Technology Impact Assessment
5-17
Table 5-8 summarizes the results of benefit-cost analysis. In addition to net benefits with PV of $7.8 billion discounted at 7%, the ratio of benefits relative to DOE’s expenditures was calculated (referred to as the BCR). The BCR discounted at 7% is calculated to be 295.3 (451.4 discounted at 3%), signifying large social benefits relative to program expenditures. The BCR deceases at higher discount rates, reflecting the timing of expenditures and benefits. IRR serves as a measure of an investment’s return by comparing initial investments with discounted cash flows. The IRR for PDC drill bit technology project was 139%.
Table 5-8. PDC Drill Bit Technology Benefit-Cost Analysis Results
Net Benefits
(thousands $2008) Benefit-Cost Ratio Internal Rate of Return
PVa at 7% $7,786,751 295.3 139% PVa at 3% $18,473,186 451.4
a Base year is 1976, which is the first year of DOE program expenses.


Retrospective Benefit-Cost Evaluation of U.S. DOE Geothermal Technologies R&D Program Investments: Impacts of a Cluster of Energy Technologies
6-1
6. GEOTHERMAL BINARY CYCLE POWER PLANTS: TECHNOLOGY IMPACT ASSESSMENT
6.1 Introduction Binary cycle plants represented 16% of total installed geothermal capacity in the United States in 2008. Binary cycle geothermal power-plant technology enables efficient use of lower temperature resources through the use of a closed loop heat transfer system with a working fluid that has a low temperature boiling point. DOE assisted with the advancement of binary cycle plant technology in the United States by sponsoring research to lower costs and developing demonstration projects to showcase the technology’s viability. This chapter discusses the technology history and social benefits of geothermal binary cycle plant technology attributable to DOE and DOE’s role in accelerating its adoption. The PV of total benefits related to binary cycle technology is estimated to be approximately $237 million discounted at 7%. Approximately $42.8 million of these benefits (PV discounted at 7%) can be attributed to DOE through its research activities resulting from an investment with PV of $26.8 million discounted at 7%. 6.2 History of the Technology Binary cycle geothermal power plants contain a system in which the heat from geothermal fluid is transferred to a secondary working fluid. With the heat transfer, the working fluid (which has a low temperature boiling point) is vaporized. Pressurized vapor then rotates a turbine connected to an electric generator. After it rotates the turbine, the cooled and condensed working fluid is pumped back into geothermal heat exchangers, completing the closed loop (see Figure 6-1). The main advantage of the binary cycle technology is that it is applicable to lower temperature resources, and therefore can be used in areas where other geothermal plant types cannot be built or are less optimal. Another benefit is that geothermal fluid (which often has solids dissolved in it) is never exposed to the ambient environment, reducing environmental pollution and providing higher power production potential from a given geothermal fluid flow (EERE/GTP, 2008a). An assessment of geothermal resources carried out by the USGS in the 1970s found an abundance of lower temperature geothermal resources across the United States (EERE/GTP, 2008a). The power production of a geothermal plant varies with temperature, and without binary cycle technology, many of these lower temperature resources cannot be used economically (EERE/GTP, 2008a). For example, if the temperature of the resource is between 150°C and 190°C, flash-steam plants become less efficient, and hence, less economically attractive. The lower the temperature, the less economically feasible flash technology becomes. At temperatures below 150°C, even though wells could potentially flow spontaneously, the rates of flow would not be sufficient for economic viability. In addition, the chances of calcium carbonate buildup increase as compared to higher temperatures. One way to prevent the formation of buildup and to provide the production rates needed is to produce geofluid using down-well pumps. Once geofluid is produced in this manner, it is then not thermodynamically efficient to flash the

Retrospective Benefit-Cost Evaluation of U.S. DOE Geothermal Technologies R&D Program Investments: Impacts of a Cluster of Energy Technologies
6-2
fluid using a flash-steam plant, and it makes economic sense to use binary cycle technology instead (DiPippo, 2008).
Figure 6-1. Geothermal Binary Cycle Power Plant
Source: EERE/GTP (2008a).
The first prototype resembling today’s binary cycle technology was adopted for a 250 kW power plant in Italy in 1912. The steam from wells was too contaminated to be sent directly to turbines, so a heat exchanger was used. In that heat exchanger, geothermal steam boiled water that then drove the turbine (DiPippo, 2008). In later years, the enabling technology for geothermal binary plants, the Organic Rankine Cycle, was commercialized by the Ormat corporation in 1965 (Leslie et al., 2009). The first geothermal binary plant to use the Organic Rankine Cycle technology was put into operation in Russia in 1967. It was rated at 670 kW and ran successfully for several decades (DiPippo, 2008). Even though binary cycle technology was available in the 1960s and 1970s, it was widely viewed at that time as unproven and uneconomical, and attracted little commercial interest in the United States. As a result, in the mid-1970s, DOE began working to increase the efficiency and lower the operating costs of binary power plants. Most of DOE’s small and larger scale demonstration plants (Raft River, Heber, and Pleasant Bayou) included some innovative aspects. After building larger scale demonstration plants, DOE’s focus shifted to improving the efficiency of the binary cycle. These efforts were considered critical to demonstrating the viability and lowering the costs of binary cycle geothermal energy, making more resources economically viable (EERE/GTP, 2008b). To support its research activities, DOE developed a set of facilities in Idaho at Raft River, in California at East Mesa (Heber and Salton Sea), and later in Texas at Pleasant Bayou. Some of these facilities were constructed utilizing technologies that had not been previously used, including multiple boiling binary cycles, supercritical binary cycles using working fluid mixtures, and hybrid cycles for geo-pressured geothermal resources. DOE sponsored research at its laboratories and at universities, and granted contracts to private industry to perform a research at these facilities (EERE/GTP, 2008a).

Chapter 6 — Geothermal Binary Cycle Power Plants: Technology Impact Assessment
6-3
When the geothermal industry started to build binary cycle plants in the late 1980s, field validation of technologies shifted from DOE facilities to commercial geothermal plants. By the early 1990s, DOE had shut down the majority of its research facilities, but laboratory personnel continued to work closely with the industry on field validation of the economic feasibility of power production. The results of these efforts were technology improvements to the operation and maintenance of geothermal power plants (EERE/GTP, 2008a). Bolstered by the introduction of various state and federal policies in response to the 1976 energy crisis, installation of binary cycle plants saw significant growth in the late 1980s and early 1990s. Table 6-1 lists all the binary cycle geothermal plants operating in the United States in the summer of 2008. Among these 26 plants are 72 units with a total installed capacity of 408 MW. Even though binary cycle plants account for 55% of units built in the United States, they account for only 16% of the installed geothermal MW capacity. 6.3 Next Best Alternative Binary cycle power plants offer an improvement over existing geothermal plant technology. The next best alternative technology differs depending on the temperature of the reservoir where binary cycle is installed:
• In reservoir temperature ranges of 150°C to 190°C, flash cycle technology is economically viable, but has lower electricity generation productivity as compared to binary cycle due to lower conversion efficiency. Thus, in this temperature range, the next best alternative is a traditional flash cycle geothermal plant.
• In the temperature range below 150°C, flash cycle technology is not economically viable and no other geothermal technology is available. In this temperature range, the next best alternative is a generation from a mix of fossil fuels.
Given that more than 80% of U.S. geothermal resources fall below 150°C, binary cycle technology has increased the cost-effectiveness of constructing geothermal plants at sites otherwise unsuitable for geothermal electricity generation. As previously stated, in this temperature range, the next best alternative would be a coal factory.

Retrospective Benefit-Cost Evaluation of U.S. DOE Geothermal Technologies R&D Program Investments: Impacts of a Cluster of Energy Technologies
6-4
Table 6-1. Geothermal Binary Cycle Power Plants in the United States, 2008
Binary Power Plant State Start Year Number of Units
Installed Capacity
(MW)
Average Reservoir
Temperature (°C)
Mammoth Pacific I CA 1984 4 10.0 183 Wabuska NV 1984 3 2.2 118 Ormesa I CA 1986 1 44.0 154 Steamboat I NV 1986 7 8.4 188 Ormesa II CA 1987 1 18.0 154 San Emidio (Empire) NV 1987 4 4.8 152 Soda Lake I NV 1987 4 5.1 182 Amedee CA 1988 2 1.6 116 Ormesa IE CA 1988 1 10.0 154 Steamboat IA NV 1988 2 3.0 188 Ormesa IH CA 1989 1 13.2 154 Stillwater NV 1989 1 16.0 154 Mammoth Pacific II CA 1990 NA 15.0 183 Soda Lake II NV 1990 6 18.0 182 Cove Fort 2 UT 1990 3 2.3 NA Brady Hot Springs NV 1992 3 27.0 182 Steamboat II NV 1992 2 29.0 188 Steamboat III NV 1992 2 24.0 188 Heber II CA 1993 7 48.0 171 Puna Geo Venture HI 1993 10 20.0 149 Richard Burdett NV 2005 2 30.0 188 Chena Hot Springs AK 2006 2 0.5 74 Galena 2 NV 2007 1 15.0 188 Heber South CA 2008 1 10.0 171 Raft River ID 2008 1 13.0 149 Galena 3 NV 2008 1 20.0 188 Total Binary 72 408.1 Total Geothermal 130 2,600.0 Binary Share of All Geothermal 55% 16%
Source: GEA (2009a).
6.4 Benefits Calculations This section estimates the benefits associated with using binary cycle geothermal power plant technology.1 The benefits of binary cycle plant technology include the economic benefits of increased conversion efficiency of binary cycle technology over flash technology and the environmental benefits of switching away from fossil fuels. Benefits are calculated separately for the two temperature ranges of
1 Not all the benefit associated with binary cycle plants can be attributed to DOE. Some development and implementation of the
binary cycle technology came from commercial sector (e.g., Ormat commercialized binary cycle technology using solar ponds as the heat source). Thus, as discussed in Section 6.5, benefits attributed to DOE are based on the acceleration of the benefits quantified in this section.

Chapter 6 — Geothermal Binary Cycle Power Plants: Technology Impact Assessment
6-5
geothermal resources described above. Table 6-2 summarizes the key parameters and assumptions used to estimate benefits. Table 6-2. Key Parameters and Assumptions Used in the Binary Cycle
Power Plants Benefits Analysis Parameters/Assumptions Source
Binary plants are 15% more efficient than flash plants in the mid-level temperature range
Average of three efficiency studies (Brugman et al., 1994).
Geothermal energy offsets fossil fuel-fired generation 60% Coal, 39% natural gas, and 1% petroleum2 (see Appendix C for calculations and sources)
DOE activities accelerated the development and deployment of geothermal electricity generation by 2 years
Published literature, interviews with industry and DOE experts
6.4.1 Economic Benefits Economic Benefits for 150°C to 190°C Binary Plants In the 150°C to 190°C range (referred to as “mid-level temperature range” in the remainder of the report), the best alternative technology would be geothermal flash power plant technology. These temperature boundaries are determined by technological limitations of flash and binary cycle technologies (Bronicki, 2002). Most the benefits of binary plants are associated with the incremental productivity gains resulting from the conversion efficiency gains of the binary cycle technology. This is captured by the market value of the additional electricity produced.3 Binary cycle plant technology allowed more efficient power plants using mid-level temperature resources (150°C to 190°C) to be built. The Electric Power Resource Institute (EPRI) sponsored a study in the mid-1990s that evaluated the performance of binary and flash plants for different geothermal fields. The findings of these studies were published in EPRI’s Next Generation Geothermal Power Plants (Brugman et al., 1994). Three fields had both binary and flash plants in the mid-level temperature range: Raft River, Vale, and Surprise Valley (Brugman et al., 1994). Table 6-3 presents the brine rate (in thousands of pounds per hour) of the facilities in these fields. As the table shows, binary plants have higher conversion efficiency than flash plants (e.g., less brine is required to generate an equal amount of energy). It is also worth noting that conversion efficiency decreases as the temperature of the source increases. Based on these observations, binary plants are 15% more efficient than flash plants in the mid-level temperature range.
2 This is an average value of fuel mix across the states. 3 Through interviews with industry experts, it was determined that the capital and operating costs of binary cycle plants and flash
plants are comparable in the mid-level temperature range. Figures 5-2 and 5-4 in the Electric Power Research Institute’s (EPRI’s) Next Generation Geothermal Power Plants Report (Brugman et al., 1994) also support this claim. Thus, no cost differences are included in the analysis.

Retrospective Benefit-Cost Evaluation of U.S. DOE Geothermal Technologies R&D Program Investments: Impacts of a Cluster of Energy Technologies
6-6
Table 6-3. Increase in Conversion Efficiency of Binary vs. Flash Power Plants in the Mid-Level Temperature Range
Reservoir Brine Rate (1,000 lb/hr) Percentage Increase in Conversion Efficiency Binary Flash
Raft River, ID at 150°C 12,384 15,392 19.5% Vale, OR at 166°C 8,678 10,375 16.4% Surprise Valley, CA at 190°C 6,800 7,473 9.0% Average 15.0%
Source: Brugman et al. (1994).
This information allowed us to calculate total energy generated by binary plants in the mid-level temperature range. Fifteen percent of the electricity generated is attributable to higher conversion efficiency of binary plants over flash plants in the mid-level temperature range. That share was then multiplied by the historical price of electricity to calculate the economic benefits of binary technology. These calculations are presented in Table 6-4. Total conversion efficiency benefits equaled $109.9 million. Economic Benefits for Less than 150°C Binary Plants For geothermal resources less than 150°C (referred to as “low temperature range” in the remainder of the report), there was no best alternative technology available for producing geothermal power. Thus, in the absence of binary cycle technology, no geothermal plant would have been installed. As a result, the benefits are associated with the full output of the binary cycle geothermal plant. No economic benefits are calculated because the production costs for geothermal power plants are comparable to fossil fuel plants. Thus, the benefits are primarily environmental, producing renewable energy that offsets generation from a mix of fossil fuels (Glitnir, 2008). Environmental health benefits are quantified in Section 6.4.2.

Chapter 6 — G
eothermal Binary Cycle Power Plants: Technology Im
pact Assessment
6-7
Table 6-4. Conversion Efficiency Benefits of Binary Cycle Power Plants in the Mid-Level Temperature Range, 1984–2008
Year
(a) Geothermal Electricity Generated (MWh)a
(b) Share of Binary Plants Capacity Relative to All
Geothermal Plants Capacityb
(c) Share of Binary
Plants Capacity in Mid-Level
Temperature Relative to All Binary Plantsb
(d = a * b * c) Electricity
Generated By Binary Plants in
Mid-level Temperature
Range (MWh)
(e = d * 15% from Table 6-2) Electricity
Generated due to Conversion Efficiency of
Binary (MWh)
(f) Electricity
Price, Including
Taxes (thousands
$2008/MW)c
(g = f * e / 1,000) Conversion
Efficiency Benefits (thousands $2008)
1984 7,740,504 1.0% 82.0% 63,472 9,521 $113.4 $1,080 1985 9,325,230 0.8% 82.0% 61,174 9,176 $113.5 $1,041 1986 10,307,954 3.9% 96.6% 388,342 58,251 $111.0 $6,466 1987 10,775,461 5.2% 97.6% 546,876 82,031 $106.7 $8,753 1988 10,300,079 5.3% 96.5% 526,798 79,020 $102.8 $8,123 1989 14,593,443 5.9% 97.2% 836,905 125,536 $100.7 $12,641 1990 15,434,271 7.0% 97.8% 1,056,630 158,495 $98.7 $15,643 1991 15,966,444 7.0% 97.8% 1,093,063 163,959 $97.9 $16,052 1992 16,137,962 10.1% 98.5% 1,605,485 240,823 $96.7 $23,288 1993 16,788,565 12.4% 92.6% 1,927,730 289,160 $96.1 $27,788 1994 15,535,453 12.4% 92.6% 1,783,843 267,576 $93.9 $25,125 1995 13,378,258 12.4% 92.6% 1,536,145 230,422 $91.7 $21,130 1996 14,328,684 12.2% 92.6% 1,618,740 242,811 $89.6 $21,756 1997 14,726,102 12.2% 92.6% 1,663,637 249,546 $87.9 $21,935 1998 14,773,918 12.2% 92.6% 1,669,039 250,356 $85.5 $21,405 1999 14,827,013 12.2% 92.6% 1,675,037 251,256 $83.0 $20,854 2000 14,093,158 12.0% 92.6% 1,566,032 234,905 $83.3 $19,568 2001 13,740,501 12.0% 92.6% 1,526,844 229,027 $87.2 $19,971
a Source: U.S. DOE (2010d). (continued) b Source: GEA (2009a). c Source: U.S. DOE (2009). d Base year is 1976, which is the first year of DOE program expenses.

Retrospective Benefit-Cost Evaluation of U
.S. DO
E Geotherm
al Technologies R&D
Program Investm
ents: Impacts of a
Cluster of Energy Technologies
6-8
Table 6-4. Conversion Efficiency Benefits of Binary Cycle Power Plants in Mid-Level Temperature Range, 1984–2008, (continued)
Year
(a) Geothermal Electricity Generated (MWh)a
(b) Share of Binary Plants Capacity Relative to All
Geothermal Plants Capacityb
(c) Share of Binary
Plants Capacity in Mid-Level
Temperature Relative to All Binary Plantsb
(d = a * b * c) Electricity
Generated By Binary Plants in
Mid-level Temperature
Range (MWh)
(e = d * 15% from Table 6-2) Electricity
Generated due to Conversion Efficiency of
Binary (MWh)
(f) Electricity
Price, Including
Taxes (thousands
$2008/MW)c
(g = f * e / 1,000) Conversion
Efficiency Benefits (thousands $2008)
2002 14,491,310 12.0% 92.6% 1,610,274 241,541 $84.8 $20,483 2003 14,424,231 12.0% 92.6% 1,602,821 240,423 $85.8 $20,628 2004 14,810,975 12.0% 92.6% 1,645,796 246,869 $85.3 $21,058 2005 14,691,745 13.0% 93.2% 1,780,052 267,008 $88.3 $23,577 2006 14,568,029 12.7% 93.1% 1,722,480 258,372 $93.5 $24,158 2007 14,637,213 13.2% 93.4% 1,804,593 270,689 $93.3 $25,255 2008 14,859,238 14.5% 90.9% 1,958,522 293,778 $98.2 $28,849 Total 345,255,741 33,270,329 4,990,549
Undiscounted Total $456,627 PV d at 7% $109,939
a Source: U.S. DOE (2010d). b Source: GEA (2009a). c Source: U.S. DOE (2009). d Base year is 1976, which is the first year of DOE program expenses.

Chapter 6 — Geothermal Binary Cycle Power Plants: Technology Impact Assessment
6-9
6.4.2 Environmental Benefits The environmental benefits of geothermal binary plants make them valuable assets in reducing air pollutants such as particulate matter (PM), sulfur oxides (SOx) and nitrous oxides (NOx), and in reducing greenhouse gases such as carbon dioxide (CO2). Binary plants do not emit gases, as opposed to competing generation technologies such as coal-fired fossil fuel plants, which generate vast amounts of air pollutants. Environmental benefits are associated with both include:
• The environmental health benefit of this additional electricity offsetting generation from a mix of
fossil fuels (Glitnir, 2008), and • The incremental environmental health benefits associated with what would have been flash
cycle–generated electricity but is now binary cycle–generated electricity.3 1
The Co-Benefits Risk Assessment (COBRA) model was used to calculate the environmental health benefits of the reduction in air pollution resulting from the use of binary cycle power plants. A discussion of this model is contained in Appendix C. The input to the model is the reduction (tons/year) of PM, NOx, and SO2 from geothermal energy generated by binary cycle compared to the next best alternative. As discussed above, the next best alternative is generation from a mix of fossil fuels for low temperature range binary cycle and flash cycle geothermal for mid-level temperature binary cycle. Where flash technology is the alternative, the electricity generated due to increased productivity (approximately 15%, as was shown in Section 6.4.1) will offset fossil fuel generation. The remaining 85% will offset flash cycle geothermal generation. Table 6-5 shows that offsetting fossil fuel generation accounts for the majority of the emission reductions that are input into the COBRA model.4 Table 6-5. Emission Reductions Associated with Binary Cycle Power Plants, 2008
Total Emission Reduction
Temperature Range Scenario Alternative
Technology GWh (2008)
PM Tons (2008)
SO2 Tons (2008)
NOx Tons (2008)
Mid–level: 150°–190°C
Binary cycle Flash 1,665a 321 0 0 15% increased productivity Fossil fuel mixd 294b 757 382 200
Low: <150°C Binary cycle Fossil fuel mixd 196 c 451 255 134 Total (2008) 2,155 1,530 637 334
a Year 2008 value from Table 6-4 Column (d) x 85% (percentage offsetting flash cycle geothermal generation) b Year 2008 value from Table 6-4 Column (d) x 15% (efficiency gain offsetting fossil fuel generation) c Year 2008 value from Table 6-4 Column (a) x Table 6-4 Column (b) x (1 - Table 6-4 Column (c)) d See Appendix C for calculations.
3 Flash cycle has relatively low emissions (especially relative to fossil fuel plants). However, binary cycle has no emissions,
because it is a closed loop system. Hence, this incremental reduction in emissions is included in the benefit analysis. 4 It should be noted that flash cycle geothermal is a significant source of CO2 emissions, which historically have not been
classified as a pollutant, and hence are not included in the benefits analysis. However, in the future, reductions in CO2 are likely to have a monetary value as greenhouse gas emissions become increasingly important and potential CO2 mitigation policies are enacted.

Retrospective Benefit-Cost Evaluation of U.S. DOE Geothermal Technologies R&D Program Investments: Impacts of a Cluster of Energy Technologies
6-10
Table 6-6 shows the time series of emission reductions attributable to DOE, including GHG reductions.
Table 6-6. Binary Cycle Power Plants Emission Reductions
Year
Fossil Fuel Power Offset
by Binary Cycle Power Production
(MWh)b
Particulates (short tons)
SO2 (short tons)
NOx (short tons)
CO2 Equivalent Reductionc
(thousand metric tons)
1984 17,598 55 23 12 16 1985 16,961 53 22 12 15 1986 91,397 285 119 62 82 1987 127,390 398 166 87 115 1988 124,111 388 161 85 112 1989 195,751 611 255 133 176 1990 245,629 767 319 167 221 1991 254,098 794 330 173 229 1992 370,566 1,157 482 253 334 1993 473,293 1,478 615 323 426 1994 437,966 1,368 570 298 395 1995 377,152 1,178 490 257 340 1996 397,430 1,241 517 271 358 1997 408,453 1,276 531 278 368 1998 409,780 1,280 533 279 369 1999 411,252 1,284 535 280 370 2000 384,490 1,201 500 262 346 2001 374,868 1,171 487 255 338 2002 395,352 1,235 514 269 356 2003 393,522 1,229 512 268 355 2004 404,073 1,262 525 275 364 2005 434,222 1,356 565 296 391 2006 420,629 1,314 547 287 379 2007 439,266 1,372 571 299 396 2008 489,846 a 1,530 637 334 441 Total 8,095,095
25,280 10,527 5,517 7,293
a Total Binary Electricity Generated offsetting fossil fuel from table [Table 6-5] b Years 1984-2007 scaled back from 2008 data using Total Binary Power Production Table 6-4 column (a) X column (b) c Calculation based on Electricity Produced by Binary Plants (a) and Carbon Dioxide Emission Rates: Coal 2.117; Natural Gas
1.314; Oil 1.915 pounds per KWh (U.S. DOE, 2010c).
The annual health benefits associated with emission reductions from using binary cycle geothermal are estimated to be $37.1 million in 2008, and are presented in Table 6-7. At $34.1 million per year, avoided mortality accounts for the majority of benefits.5 For a detailed discussion of the environmental benefits calculation, refer to Appendix C.
5 The mean value for avoiding one statistical death in the COBRA model is $5.5 million ($2000) (USEPA, 2006).

Chapter 6 — Geothermal Binary Cycle Power Plants: Technology Impact Assessment
6-11
Table 6-7. Environmental Health Benefit Associated with Binary Cycle Power Plants, 2008
Health Risks Incidence (number) Cost (thousands $2008) Mortality 5 $34,113 Infant mortality 0 $104 Chronic bronchitis 4 $1,620 Nonfatal heart attacks 8 $860 Respiratory hospital admissions 1 $13 Cardiovascular-related hospital admissions 2 $60 Acute bronchitis 9 $3 Upper respiratory symptoms 81 $2 Lower respiratory symptoms 107 $2 Asthma emergency room visits 3 $1 Minor restricted activity days 4,500 $280 Lost work days 763 $61 Total 5,483 $37,119
The estimated benefits for 2008 have been scaled (accounting for the time series of binary cycle power plant total power production, as well as population growth) to estimate benefits for previous years. The time series of environmental health benefits is presented in Table 6-8. Table 6-8. Time Series of Environmental Health Benefits of Binary Cycle Power Plants
in the United States, 1984–2008
Year
(a) Fossil Fuel Power
Offset from Binary Cycle Power
Production (MWh)a
(b) U.S. Populationb
Environmental Health Benefitsc
(thousands $2008)
1984 17,598 235,824,902 $1,034 1985 16,961 237,923,795 $1,006 1986 91,397 240,132,887 $5,470 1987 127,390 242,288,918 $7,692 1988 124,111 244,498,982 $7,563 1989 195,751 246,819,230 $12,041 1990 245,629 249,464,396 $15,271 1991 254,098 252,153,092 $15,968 1992 370,566 255,029,699 $23,552 1993 473,293 257,782,608 $30,406 1994 437,966 260,327,021 $28,414 1995 377,152 262,803,276 $24,702
(continued) a Total Binary Electricity Generated [Table 6-5] – Binary Electricity Replacing Flash Technology [Table 6-5], scaled by Column
(a) x Column (b) [Table 6-4] b Source: U.S. Bureau of the Census (2000, 2009). c Health Benefits in 2008 [$37.1 Million from Table 6-7] scaled by Column (a) and Column (b). d Base year is 1976, which is the first year of DOE program expenses.

Retrospective Benefit-Cost Evaluation of U.S. DOE Geothermal Technologies R&D Program Investments: Impacts of a Cluster of Energy Technologies
6-12
Table 6-8. Time Series of Environmental Health Benefits of Binary Cycle Power Plants in the United States, 1984–2008 (continued)
Year
(a) Fossil Fuel Power Offset
from Binary Cycle Power Production
(MWh)a
(b) U.S. Populationb
Environmental Health Benefitsc
(thousands $2008)
1996 397,430 265,228,572 $26,270 1997 408,453 267,783,607 $27,259 1998 409,780 270,248,003 $27,599 1999 411,252 272,690,813 $27,948 2000 384,490 282,171,936 $27,038 2001 374,868 285,039,803 $26,629 2002 395,352 287,726,647 $28,349 2003 393,522 290,210,914 $28,462 2004 404,073 292,892,127 $29,495 2005 434,222 295,560,549 $31,984 2006 420,629 298,362,973 $31,277 2007 439,266 301,290,332 $32,983 2008 489,846 304,059,724 $37,119
Undiscounted Total $555,530 PVd at 7% $127,034
a Total Binary Electricity Generated [Table 6-5] – Binary Electricity Replacing Flash Technology [Table 6-5], scaled by Column (a) x Column (b) [Table 6-4]
b Source: U.S. Bureau of the Census (2000, 2009). c Health Benefits in 2008 [$37.1 Million from Table 6-7] scaled by Column (a) and Column (b). d Base year is 1976, which is the first year of DOE program expenses.
Figure 6-2 shows the total benefits of geothermal binary cycle plant technology, which include environmental health benefits and conversion efficiency benefits. Figure 6-2. Total Benefits of Binary Cycle Power Plants (thousands $2008)

Chapter 6 — Geothermal Binary Cycle Power Plants: Technology Impact Assessment
6-13
Total undiscounted benefits equaled approximately $556 million from 1984 to 2008 (PV of $237 million discounted at 7%). 6.4.3 Security Benefits Security benefits derive from reducing the probability and potential impact of oil and natural gas disruptions and price shocks or other energy system disruptions that would damage or disrupt the economy, environment, or national security of the United States. The benefits are realized through substitution of a volume of oil and natural gas, which otherwise would be combusted to produce electricity, with geothermal electricity generation technology. Table 6-9 presents the reduction in 4.9 billion cubic feet of natural gas or 862 thousand barrels of oil equivalent.
Table 6-9. Security Benefits of Binary Cycle Power Plants Attributable to DOE, 1984–2008
Year Fossil Fuel Power Offset from
Binary Cycle Power Production (MWh)a
Million Cubic Feet of Natural Gasb
BOE (Thousand Barrels of Oil Equivalent)b
1984 17,598 10.6 1.9 1985 16,961 10.2 1.8 1986 91,397 54.9 9.7 1987 127,390 76.5 13.6 1988 124,111 74.6 13.2 1989 195,751 117.6 20.8 1990 245,629 147.6 26.2 1991 254,098 152.6 27.1 1992 370,566 222.6 39.5 1993 473,293 284.3 50.4 1994 437,966 263.1 46.6 1995 377,152 226.6 40.2 1996 397,430 238.8 42.3 1997 408,453 245.4 43.5 1998 409,780 246.2 43.6 1999 411,252 247.1 43.8 2000 384,490 231.0 40.9 2001 374,868 225.2 39.9 2002 395,352 237.5 42.1 2003 393,522 236.4 41.9 2004 404,073 242.7 43.0 2005 434,222 260.9 46.2 2006 420,629 252.7 44.8 2007 439,266 263.9 46.8 2008 489,846 294.3 52.2
Total 8,095,095 4,863 861.8 a Total Binary Electricity Generated [Table 6-5] – Binary Electricity Replacing Flash Technology [Table 6-5], scaled by Column
(a) x Column (b) [Table 6-4] b DOE Attribution was applied by multiplying million cubic feet of natural gas or BOE by the attribution factor, 18.1% [Table 6-
11 discounted total-benefits attributable to DOE/ discounted total 2-year acceleration scenario]

Retrospective Benefit-Cost Evaluation of U.S. DOE Geothermal Technologies R&D Program Investments: Impacts of a Cluster of Energy Technologies
6-14
6.5 Attribution Share Since the 1970s, DOE’s GTP has dedicated substantial funding to conduct research and development of energy conversion technologies compatible with liquid dominated geothermal resources. The summary of DOE attribution is shown in Table 6-10. The goal of DOE’s energy conversion research was to lower the cost of producing electricity from lower temperature geothermal resources. DOE initially supported the construction and operation of a number of small (<100 kW) plants in the mid- to late-1970s. DOE developed test facilities in California at the Salton Sea, East Mesa, and Heber sites; in Idaho at the Raft River site, and in Texas at the Pleasant Bayou site (EERE/GTP, 2008a). The power plants constructed at these test sites used “first-use” technologies such as: multiple boiling binary cycles, supercritical binary cycles using working fluid mixtures, and hybrid cycles for geo-pressured geothermal resources. As DOE stopped building demonstration plants (in the mid-1980s), efforts shifted to improving efficiency of binary cycle. These improvements were then validated at both DOE’s field locations and commercial plants. In parallel with the energy conversion research taking place at national laboratories, DOE also contracted with geothermal industry to conduct research at their facilities. Following construction of test plants by DOE, there was little commercial development of binary plants by the industry. Construction took off the mid-1980s, when the first plant at Mammoth was built. After that, a number of binary plants were constructed until the mid-1990s, when activity slowed. Some of the entities involved in building the commercial plants were also involved in the earlier DOE research, and this experience provided some level of confidence in the binary technology. Early DOE work with binary prototype systems also demonstrated the viability of the technology to project developers and financiers. The main impact of DOE on binary cycle technology has been the demonstration of commercial applicability of binary cycle technology, and provision of guaranteed loans, which helped industry to obtain financing. Both of these factors accelerated the technology’s entry into the market. All interview participants mentioned that DOE had some effect on accelerating the market penetration of binary cycle technology. When asked to quantify DOE’s impact, estimates of the acceleration effect ranged from less than five years to more than six months. Based on these estimates, an acceleration effect of two years is used to capture DOE’s attribution.

Section 6 — G
eothermal Binary Cycle Power Plants: Technology Im
pact Assessment
6-15
Table 6-10. A Matrix for Assessing DOE Attribution of Binary Cycle Power Plants by Stage Categories of
Information Needed for Additionality
Assessment
Technology Timeline (Stage of Research, Development, and Commercialization) Preliminary &
Detailed Investigation
Develop Components Develop System Validate/Demonstrate Commercialize Market
Adoption DOE
Attribution
What DOE did Began work on efficiency of power plants and equipment operation.
First application of multiple boiling binary cycles and other technologies (including mixed working fluids, super-critical cycles, and metastable turbine expansions)
Raft River DOE demonstration 60 kW, 5 MW plants
Heber CA, East Mesa, CA, and Pleasant Bayou, TX plants
Mammoth Pacific MPI, Mammoth Lakes CA
DOE experts continued to work under contracts with the industry
2-year Acceleration
Effect
What others did (Rival Explanations)
Binary cycle plant built in Kamchatka, USSR, in 1967
Prototype for binary cycle developed in Israel by Ormat
Organic Rankine Cycle commer-cialized by Ormat
DOE used loan guarantee program to sponsor binary plant construction by Ben Holt, Ormat, and others
Granted contracts to perform research at test plants built by DOE
Driving/restraining policies/government forces (Rival Explanations)
Identified abundance of low temperature resources around United States (USGS)
Standard offer 4 tax credits
Renewable Portfolio Standards
Description of DOE influence
Tested new components and solutions on test plants built by DOE
Demonstrated commercial applicability of binary cycle plants
Sponsored research at laboratories and universities
Basis of evidence for influence
Articles Interviews with partners
Articles
Articles Interviews with partners and stakeholders
Articles
Interviews with stakeholders
The DOE effect Improved performance
Accelerated technology entry Accelerated technology entry
Source: DiPippo (2008).

Retrospective Benefit-Cost Evaluation of U.S. DOE Geothermal Technologies R&D Program Investments: Impacts of a Cluster of Energy Technologies
6-16
Figure 6-3 demonstrates the acceleration scenario. The benefits attributable to DOE are composed of the difference between benefits acquired under acceleration and base case benefits.
Figure 6-3. Benefits of Binary Cycle Power Plants Attributable to DOE
These benefits are represented by the area below the solid line and above the dotted line on the graph. Calculation of these benefits is also presented in Table 6-11. The PV of total benefits attributable to DOE equaled approximately $42.8 million (discounted at 7%) from 1984 to 2008. Table 6-11. Economic Benefits of Binary Cycle Power Plants Attributable to DOE by Year,
1984–2008 (thousands $2008)
Year (a)
2-Year Acceleration Scenarioa
(b) Base Case Scenario
(a − b) Benefits Attributable to
DOE 1984 $2,114 − $2,114 1985 $2,047 − $2,047 1986 $11,936 $2,114 $9,822 1987 $16,445 $2,047 $14,398 1988 $15,686 $11,936 $3,750 1989 $24,682 $16,445 $8,238 1990 $30,914 $15,686 $15,229 1991 $32,019 $24,682 $7,337 1992 $46,840 $30,914 $15,926 1993 $58,194 $32,019 $26,175 1994 $53,540 $46,840 $6,700 1995 $45,831 $58,194 -$12,363 1996 $48,026 $53,540 -$5,514 1997 $49,194 $45,831 $3,362 1998 $49,004 $48,026 $978 1999 $48,803 $49,194 -$391
(continued) a Economic Benefits = conversion efficiency benefits [Column (g), Table 6-4)] + health benefits [Column (c), Table 6-8)]

Chapter 6 — Geothermal Binary Cycle Power Plants: Technology Impact Assessment
6-17
Table 6-11. Economic Benefits of Binary Cycle Power Plants Attributable to DOE by Year,
1984–2008 (thousands $2008), (continued)
Year (a) 2-Year Acceleration Scenarioa
(b) Base Case Scenario
(a − b) Benefits Attributable to DOE
2000 $46,606 $49,004 -$2,399 2001 $46,601 $48,803 -$2,202 2002 $48,832 $46,606 $2,226 2003 $49,090 $46,601 $2,489 2004 $50,553 $48,832 $1,721 2005 $55,561 $49,090 $6,471 2006 $55,435 $50,553 $4,882 2007 $58,238 $55,561 $2,677 2008 $65,968 $55,435 $10,533
Undiscounted Total $1,012,158 $887,952 $124,206 PVa at 7% $236,973 $222,254 $42,848
a Benefits = conversion efficiency benefits [Column (g), Table 6-4)] + health benefits [Column (c), Table 6-8)] b Base year is 1976, which is the first year of DOE program expenses
6.6 Benefit-Cost Analysis DOE program expenditures associated with binary cycle research are presented in Table 6-12. These expenditures are based on a time series of appropriation items provided by DOE for EERE budgets from 1976 to 2008. The expenditures in Table 6-12 are built up from appropriation line items associated with binary cycle research and demonstration activities, and represent approximately 1.6% of EERE’s total GTP budget during this time period. The PV of total expenditures (adjusted to $2008) equaled $26.8 million discounted at 7% from 1976 to 2008 ($40.7 million discounted at 3%). Binary cycle expenditures peaked between 1978 and 1982. DOE’s investment in binary cycle power plant technology yielded net benefits with PV of $16.0 million discounted at 7% ($35.6 million discounted at 3%).
Table 6-12. Net Benefits of Binary Cycle Power Plants Attributable to DOE, 1976–2008
(thousands $2008) Year Total Benefitsa Program Expenditures Net Benefits 1976 $0 $2,036 -$2,036 1977 $0 $2,036 -$2,036 1978 $0 $2,036 -$2,036 1979 $0 $2,036 -$2,036 1980 $0 $2,036 -$2,036 1981 $0 $2,036 -$2,036 1982 $0 $2,036 -$2,036 1983 $0 $2,036 -$2,036 1984 $2,114 $2,036 $78 1985 $2,047 $2,036 $11 1986 $9,822 $2,036 $7,786 1987 $14,398 $1,639 $12,759 1988 $3,750 $1,335 $2,415 1989 $8,238 $1,015 $7,223 1990 $15,229 $1,025 $14,204 1991 $7,337 $2,277 $5,060 1992 $15,926 $3,542 $12,384 1993 $26,175 $3,745 $22,430
(continued)

Retrospective Benefit-Cost Evaluation of U.S. DOE Geothermal Technologies R&D Program Investments: Impacts of a Cluster of Energy Technologies
6-18
a Total Benefits = conversion efficiency benefits [Column (g), Table 6-4)] + health benefits [Column (c), Table 6-8)] Table 6-12. Net Benefits of Binary Cycle Power Plants Attributable to DOE, 1976–2008
(thousands $2008), (continued) Year Total Benefitsa Program Expenditures Net Benefits 1994 $6,700 $3,770 $2,930 1995 -$12,363 $2,890 -$15,253 1996 -$5,514 $1,844 -$7,358 1997 $3,362 $1,925 $1,437 1998 $978 $1,787 -$809 1999 -$391 $1,616 -$2,007 2000 -$2,399 $1,452 -$3,851 2001 -$2,202 $1,203 -$3,405 2002 $2,226 $1,040 $1,186 2003 $2,489 $971 $1,518 2004 $1,721 $953 $768 2005 $6,471 $972 $5,499 2006 $4,882 $972 $3,910 2007 $2,677 $972 $1,705 2008 $10,533 $972 $9,561
Undiscounted Total $124,206 $60,311 $63,893 PVb at 7% $42,848 $26,819 $16,029 PVb at 3% $76,269 $40,701 $35,568
a Total Benefits from Column (a-b), Table 6-11 b PV base year is 1976.
Table 6-13 summarizes the results of the benefit-cost analysis. In addition to net benefits with PV of $16.0 million discounted at 7%, the BCR is calculated to be 1.6 discounted at 7% (1.9 discounted at 3%). The BCR deceases at higher discount rates, reflecting the timing of expenditures and benefits. IRR serves as a measure of an investment’s return by comparing initial investments with discounted cash flows. The IRR for binary cycle plant technology is 16%.
Table 6-13. Benefit-Cost Analysis Results
Net Benefits Benefit-Cost Ratio Internal Rate of Return PVa at 7% $16,029 1.6 16% PVa at 3% $35,568 1.9
a PV base year is 1976.
6.7 Sensitivity Analysis When estimating the environmental health benefits, it was assumed that in the absence of geothermal electricity, additional gas, oil and coal-fired power plants would have been built to meet base load electricity demand. To investigate how sensitive our findings are to this assumption, this study estimated environmental health benefits from the binary cycle using an alternative assumption of 50% coal and 50% natural gas. The results are presented in Table 6-14. Using an assumption of 50% coal and 50% natural gas reduced the environmental health benefits by 15.9% or $3.6 million. This reduces the BCR ratio from 1.6 to 1.5.

Chapter 6 — Geothermal Binary Cycle Power Plants: Technology Impact Assessment
6-19
Table 6-14. Binary Cycle Power Plants Environmental Benefits Attributable to DOE: Sensitivity to Displaced Fuel Type
Displaced Generation Percentage Reduction
60% Coal, 39% NG,
1% Oil 50% Coal, 50% NG
PM (short tons) 4,572 3,807 16.7% SO2 (short tons) 1,903 1,581 16.9% NOX (short tons) 998 838 16.0% GHG (thousand tCO2e) 1,319 1,254 4.9% Monetized health benefit (PVa at 7%, thousands $2008) $22,970 $19,323 15.9%
a PV base year is 1976.


7-1
7. TOUGH SERIES OF RESERVOIR MODELS: TECHNOLOGY IMPACT ASSESSMENT
7.1 Introduction Reservoir modeling has become a widely practiced and accepted technique for studying flow and transport processes in subsurface flow systems. Reservoir modeling is used in many applications, including geothermal exploration and management, nuclear waste storage, and CO2 sequestration. This section discusses the social benefits of reservoir modeling in general and the Transport of Unsaturated Groundwater and Heat (TOUGH) series of models (the leading family of reservoir modeling codes) in particular. This section also discusses DOE’s role in the development and adoption of reservoir modeling in the United States. The PV of total benefits related to the TOUGH series of models is estimated to be approximately $954.1 million discounted at 7%. Approximately $219.4 million (PV discounted at 7%) of these benefits can be attributed to DOE through its research activities resulting from an investment with PV of $8.6 million (discounted at 7%). 7.2 History of the Technology Initially, the geothermal industry’s exploratory efforts were dominated by drilling near hot springs. As the industry expanded to take advantage of more challenging resources, there was a growing need for a better understanding of the characteristics of geothermal systems and the development of techniques to simulate systems in the subsurface. DOE’s research efforts helped identify the limitations of traditional exploration techniques and demonstrate the potential for imaging and characterizing subsurfaces, which provided the foundation for geothermal reservoir modeling (EERE/GEO, 2008). In general, reservoir models are used as analytical and management tools. As analytical tools, they are used in forecasting reservoir capacity, designing development activities, and identifying characteristics that may cause changes in the reservoir. Once a field is in operation and has accumulated data, reservoir modeling can then be used as a management and optimization tool. For example, modeling can be used to help position production and injection wells and to assist in optimizing the performance of the geothermal reservoirs by forecasting production scenarios and capacity of the field. Operating scenarios can also be modeled to help engineers better manage risk. A reservoir model can be used to estimate the long-term effects of shutting down individual wells on the entire field (Taylor, 2007). The growth and development of reservoir modeling closely paralleled the development of an array of supporting technologies, such as advances in computer technology. Advances in computational power enabled numerical solutions to complex differential equations and supported early applications of reservoir modeling in the 1970s. However, the acceptance of computer simulation by the geothermal industry did not become widespread until in the 1980s, when DOE released its 1980 Code Comparison Study (O’Sullivan, 1980). In this paper, several models were tested, compared, and contrasted using a set of test problems. Since then, geothermal reservoir simulation codes have significantly improved and been

Retrospective Benefit-Cost Evaluation of U.S. DOE Geothermal Technologies R&D Program Investments: Impacts of a Cluster of Energy Technologies
7-2
widely accepted for geothermal applications, as well as other areas such as nuclear waste storage, mining engineering, and environmental restoration. The use of computer simulation models in the planning and management stages of the development of geothermal fields has now been standard practice for more than two decades. Among the industry pioneers that introduced computer simulation code to a variety of applications were Lawrence Berkley National Laboratory (LBNL), Los Alamos National Laboratory (LANL), the United States Geological Service (USGS), GeothermEx, S-Cubed (which later became Maxwell Technologies), and Unocal (O’Sullivan et al., 2001). Researchers at LBNL developed a simulation code known as MULKOM (multicomponent model). MULKOM was a first-of-a-kind, complex, three-dimensional model based on the assumption that governing equations for flows of multicomponent, multiphase liquids had the same mathematical structure regardless of the number and the nature of fluid components and phases. These efforts took place during the component development stage of the technology timeline. During the reservoir modeling system development stage, MULKOM served as a testing bed for methodologies and approaches that were later implemented in the TOUGH (released in 1987) and TOUGH2 (released in 1991) models. TOUGH is both an acronym for “transport of unsaturated groundwater and heat” and a reference to tuff formations in Yucca Mountain, which was one of the first major applications of the code (Pruess, 2004). Subsequent versions of the TOUGH2 code focused on expanding beyond traditional application areas. T2VOC (released in 1995) and TMVOC (released in 2002) focused on environmental contamination problems of non-aqueous phase liquids. Inverse modeling, optimization, and sensitivity and uncertainty analysis were addressed with the iTOUGH2 code, which was released in 1999. TOUGHREACT (released in 2004) coupled TOUGH2 code with a general chemical speciation and reaction progress package. Finally, TOUGH-FLAC (not released to the public) coupled TOUGH2 with a commercial rock mechanics code, FLAC3D.1 TOUGH2 and its offshoot codes are currently in use at approximately 300 installations in more than 30 countries (Pruess, 2004). In addition to the TOUGH series of models, other entities were engaged in reservoir modeling activities in the 1980s and 1990s. Some of these were sponsored by the U.S. government (such as the Finite Element Heat and Mass Transfer Code (FEHM) at Los Alamos Laboratory), and others were conducted by the private sector. The two most prominent privately developed models were STAR and TETRAD. STAR, developed at approximately the same time as TOUGH, geothermal simulation capabilities similar to TOUGH, but does not include the flexibility that makes TOUGH the leading research tool in the field. Initially, STAR was developed exclusively for geothermal applications; however, according to experts interviewed for this study, it has since been expanded to new areas, such as steam flood and CO2 sequestration. 1 Release of the codes mentioned above was made through DOE’s Energy Science and Technology Software Center (ESTSC).

Chapter 7 — TOUGH Series of Reservoir Models: Technology Impact Assessment
7-3
TETRAD, developed several years after STAR and TOUGH, was created initially for oil and gas applications and has since been modified for geothermal applications (Taylor, 2007). Because TETRAD was applied to geothermal reservoir modeling later than TOUGH and STAR, its developers were able to draw from the best practices of those earlier models. Eventually, TETRAD became the main reservoir modeling software used for geothermal application in the United States. Industry experts interviewed as part of this study cited ease of use and a user-friendly interface as key selling points of TETRAD. In addition, a leading geothermal company at the time, Unocal Corporation, adopted TETRAD, creating a legacy of TETRAD usage that continues to this day.2 TOUGH’s main advantage versus other reservoir modeling software is its flexibility. As one of the interview participants mentioned, one can reprogram TOUGH models to handle additional chemicals in a reservoir or to fit new applications. Some of the interview participants mentioned that a few fields started using other software, but are now switching back to TOUGH because of its flexibility. Other advantages of TOUGH are that it is available for a small licensing fee, and continuously updated with enhancements from DOE and consultants who work with it. In general, the “publicness” of DOE’s scientific efforts has enhanced commercial acceptance of the technology (Papadakis and Link, 1997). Since 1990, LBNL has held a series of TOUGH workshops and symposiums drawing together the international scientific community. Several interviewed experts acknowledged that the success of the TOUGH series models is tied to promotion of the code through publications, workshops, and symposia. These events and publications enhance collaboration between industry and the scientific community, helping to disseminate information, and providing a forum for advancing the TOUGH series models. Table 7-1 presents a list of TOUGH series model workshops, their dates, attendance, and number of presentations. The first two workshops were held in 1990 and 1995 and focused on enhancements and additions to the TOUGH/MULKOM family of simulation programs. Table 7-1. TOUGH Workshops
Workshop Date Participants Presentations 1st TOUGH Workshop September 1990 62 21 2nd TOUGH/MULKOM Workshop March 1995 98 53 3rd TOUGH Workshop May 1998 82 53 4th TOUGH Workshop May 2003 81 62 5th TOUGH Workshop May 15–17, 2006 90 60 6th TOUGH Workshop September 14–16, 2009 124 89
Sources: Pruess (1995, 1998, 2009); LBNL (2009).
2 The experts interviewed suggested that the adoption of TETRAD by Unocal Corporation was also partially driven by concerns
that use of DOE-sponsored software might be viewed as compromising the company’s independence in terms of field valuation and decision making.

Retrospective Benefit-Cost Evaluation of U.S. DOE Geothermal Technologies R&D Program Investments: Impacts of a Cluster of Energy Technologies
7-4
The 1990 workshop included 62 participants from seven different countries, with 21 papers presented on the following topics: geothermal reservoir engineering, nuclear waste isolation, unsaturated zone hydrology, environmental problems, and laboratory and field experimentation (Pruess, 1990). The 1995 workshop included nearly 98 participants from 10 countries, with 53 papers presented on nuclear waste isolation, geothermal and oil and gas reservoir engineering, mining engineering, simulation methods, vadose zone hydrology, and other topics (Pruess, 1995). The two most recent workshops were held in 2006 and 2009. The 2006 workshop included 90 participants from more than 12 countries, with 60 papers presented (Oldenburg et al., 2007). The 2009 workshop included 124 participants, with 89 papers presented. In addition to the topics presented in the previous events, this meeting covered the additional topics of CO2 storage and carbonate diagenesis. In addition to TOUGH technical conferences and symposia, LBNL has held many training courses over the years, in Berkeley and elsewhere.3 Following the market adoption of reservoir modeling technology, LBNL was responsible for maintaining the TOUGH code, implementing changes made both internally at the lab and externally by other researchers. Several interviewed experts noted that Berkeley has consistently helped resolve challenging programming inquiries. LBNL has also kept a record of errors and released new versions of the software as they became available. Interviews also revealed that DOE and the TOUGH series of models have potentially had an even greater impact on geothermal industry outside the United States. A worldwide survey assessing the scope of and approaches to geothermal reservoir simulation studies (O’Sullivan et al., 2001) found that the TOUGH code was used in 48% of projects worldwide. The survey included 54 companies and individuals that documented 115 field simulations from 1990 to 1999. In contrast, TOUGH was used in approximately 5% of modeling activities in the United States during the same time period (O’Sullivan et al., 2001). 7.3 Next Best Alternative Geothermal reservoir modeling is a new technology representing analysis capabilities of much higher complexity than previously available. The next best alternative technology is so-called “lumped parameter” models. These models were used before capabilities for detailed computer simulation of geothermal reservoirs were developed. They simplified the reservoir to a “zero dimensional tank” and then considered the effect of fluid production or injection on thermodynamic conditions. Lumped parameter models may have been adequate for estimating the cumulatively recoverable thermal energy for a system, but they provided limited information about how fast this energy could be recovered and how many production and injection wells would be required. These models similarly offered few clues as to where these wells should be located and at what rate makeup wells would be required as the reservoir
3 An example of these courses is the “Subsurface Multiphase Fluid Flow and Remediation Modeling” workshop, held in May
2006 for training T2VOC users. Most recently, four such courses were offered before and after the 2009 symposium.

Chapter 7 — TOUGH Series of Reservoir Models: Technology Impact Assessment
7-5
was being depleted. This sometimes led to incorrect estimation of power plant capacity and increased installed cost (the Ohaki plant in New Zealand was mentioned as an example of this in the interviews). 7.4 Benefits Calculations This section estimates the benefits associated with reservoir modeling in general.4 Reservoir simulation provides both substantive and defensible analysis used to assess the productive capacity of a system, and the number and locations of production and injection wells. Industry experts identify two categories of benefits that can be quantified: (1) economic benefits resulting from increased field productivity of geothermal resources, valued at the market price of the additional electricity generated, and (2) the environmental benefits associated with the additional renewable energy offsetting fossil fuel generation. In addition, using reservoir modeling can reduce risk to investors, potentially accelerating and/or enabling geothermal developments; however, financing benefits are not included in the empirical analysis because they are difficult to document. Note that these benefits are somewhat offset by additional exploration costs associated with reservoir modeling. Yet, when these factors are taken together, reservoir modeling can be said to have been profitable for the geothermal industry by improving subsurface exploration. Table 7-2 summarizes the key parameters and assumptions used to estimate benefits. 7.4.1 Economic Benefits More efficient subsurface exploration improves well productivity by placing wells in the most efficient locations and leads to more optimal design for surface facilities. The increased productivity of geothermal reservoirs generates additional renewable energy.
Table 7-2. Key Parameters and Assumptions Used in the TOUGH Models Technology Benefits
Analysis Parameters/Assumptions Source
Reservoir modeling has resulted in a 10% increase in field productivity
Empirical studies by Long (2008) and Renner (2009)
The use of reservoir modeling increased the cost of geothermal capacity by $160/kW
Empirical studies by Long (2008) and Aaheim and Bundschuh (2002)
Reservoir modeling was widely used in the geothermal industry by 1980
DOE released the 1980 Code Comparison Study (O’Sullivan, 1980) that showed the usefulness of reservoir modeling
Geothermal energy offsets fossil fuel-fired generation
60% coal, 39% natural gas, and 1% petroleum5 (see Appendix C for calculations and sources)
The share of TOUGH usage for U.S. geothermal applications has historically been approximately 5%, with other reservoir models accounting for 95%
Study conducted by O’Sullivan (2001)
4 Section 7.5 discusses what share of these benefits can be attributed to DOE’s contribution through their development and
dissemination of the TOUGH2 series of models. 5 This is an average value of fuel mix across the states.
(continued)

Retrospective Benefit-Cost Evaluation of U.S. DOE Geothermal Technologies R&D Program Investments: Impacts of a Cluster of Energy Technologies
7-6
Table 7-2. Key Parameters and Assumptions and Used in the TOUGH Models Technology Benefits Analysis, (continued)
Parameters/Assumptions Source 80% of benefits associated with using the TOUGH series of models attributed to DOE
Published literature, interviews with industry and DOE experts
20% of benefits associated with using other reservoir models attributed to DOE
Published literature, interviews with industry and DOE experts
Productivity Benefits Productivity benefits are estimated by calculating the market value of the additional electricity generated as a result of using reservoir modeling. A Schlumberger report published in 2008 (Long, 2008) estimated that improvements in reservoir characterization have led to increases in well productivity in the oil and gas industry of up to 20%. No specific studies exist for geothermal reservoir modeling applications, but during our interviews with industry experts, several indicated substantial productivity benefits. They cited these models as essential for increasing productivity via well reinjections. In the California Geysers area, well reinjection has increased well productivity by approximately 10% (Renner, 2009). Therefore, this study assumes that reservoir modeling has resulted in a 10% increase in field productivity, a conservative estimate. To estimate the additional MWh associated with the use of reservoir modeling, this study applied the 10% productivity increase to geothermal plants installed after 1980 – the approximate date geothermal reservoir modeling became standard practice.6 As shown in Table 7-3, this yields an increase of 25.4 million MWh, which is valued at the average price of electricity over time to yield a total benefit with a PV of approximately $690.1 million discounted at 7%.
Table 7-3. Gain in Electricity Generated in the United States by the Geothermal Industry from
the Use of TOUGH Models Technology
Year
(a) Price of MWh of
Electricity, Including Taxes
($2008)a
(b) Geothermal
Electricity Generated (MWh)b
(c) Adjusted Share of
Electricity Generated Attributable to Reservoir
Modelingc (MWh)
(d) Benefits Attributable to
Reservoir Modeling (thousands $2008) d
1979 − 3,888,968 − − 1980 $106.8 5,073,079 118,411 $12,646 1981 $114.2 5,686,163 179,720 $20,524 1982 $119.4 4,842,865 95,390 $11,390 1983 $118.6 6,075,101 218,613 $25,928 1984 $113.4 7,740,504 385,154 $43,676 1985 $113.5 9,325,230 543,626 $61,702 1986 $111.0 10,307,954 641,899 $71,251 1987 $106.7 10,775,461 688,649 $73,479 1988 $102.8 10,300,079 641,111 $65,906 1989 $100.7 14,593,443 1,070,448 $107,794 1990 $98.7 15,434,271 1,154,530 $113,952
6 This study reports cost and benefits starting with 1980, which was the year that DOE released the 1980 Code Comparison Study
(O’Sullivan, 1980) that showed the usefulness of reservoir modeling. Based on the results of the study, reservoir modeling was widely accepted by the geothermal industry, and the majority of reservoir software and modeling techniques were developed during the 1980s (O’Sullivan et al., 2001).
(continued)

Chapter 7 — TOUGH Series of Reservoir Models: Technology Impact Assessment
7-7
Table 7-3. Gain in Electricity Generated in the United States by the Geothermal Industry from the Use of TOUGH Models Technology, (continued)
Year
(a) Price of MWh of
Electricity, Including Taxes
($2008)a
(b) Geothermal
Electricity Generated (MWh)b
(c) Adjusted Share of
Electricity Generated Attributable to Reservoir
Modelingc (MWh)
(d) Benefits Attributable to
Reservoir Modeling (thousands $2008) d
1991 $97.9 15,966,444 1,207,748 $118,238 1992 $96.7 16,137,962 1,224,899 $118,448 1993 $96.1 16,788,565 1,289,960 $123,965 1994 $93.9 15,535,453 1,164,649 $109,360 1995 $91.7 13,378,258 948,929 $87,017 1996 $89.6 14,328,684 1,043,972 $93,540 1997 $87.9 14,726,102 1,083,713 $95,258 1998 $85.5 14,773,918 1,088,495 $93,066 1999 $83.0 14,827,013 1,093,805 $90,786 2000 $83.3 14,093,158 1,020,419 $85,001 2001 $87.2 13,740,501 985,153 $85,905 2002 $84.8 14,491,310 1,060,234 $89,908 2003 $85.8 14,424,231 1,053,526 $90,393 2004 $85.3 14,810,975 1,092,201 $93,165 2005 $88.3 14,691,745 1,080,278 $95,389 2006 $93.5 14,568,029 1,067,906 $99,849 2007 $93.3 14,637,213 1,074,825 $100,281 2008 $98.2 14,859,238 1,097,027 $107,728
Undiscounted Total
25,415,288 2,385,545
PVd at 7% $690,113 a Source: U.S. DOE (2009). b Source: U.S. DOE (2010d). c This column is calculated as follows (starting with year 1980) : (Column (b) Year t –Year 1979) x 10%. d ((Column (a) x Column (c))/1000e Base year is 1976, which is the first year of DOE program expenses.
Increased Capital Costs Additional exploration and modeling costs are associated with the use of reservoir modeling. The Schlumberger report (Long, 2008) estimates that reservoir modeling increased costs of exploration by approximately 20%. For geothermal power plants, Aaheim and Bundschuh (2002) estimated that depending on plant capacity, exploration costs constitute 10% to 30% of total capital costs. Thus, on average, this study assumes that exploration costs account for 20% of total capital costs. In addition, the Geothermal Energy Association estimated that 1 kW of installed plant capacity equates to approximately $4,000 in capital costs (GEA, 2009b). From this it was calculated that the exploration costs per kW of power installed in a geothermal power plant as $4,000/kW × 20% = $800/kW, and the increase in cost per kW of using reservoir modeling as $800/kW × 20% = $160/kW.

Retrospective Benefit-Cost Evaluation of U.S. DOE Geothermal Technologies R&D Program Investments: Impacts of a Cluster of Energy Technologies
7-8
The factor of $160/kW is then applied to incremental (new) geothermal capacity installed each year after 1980 to estimate the time series of industry reservoir modeling costs (see Table 7-4).7 Incremental Installed plant capacity was calculated by subtracting cumulative plant capacity in the prior year from the cumulative capacity in the current year. Negative plant capacity installed meant that some plants were shut down and taken off the grid. It is assumed that the increase in capital costs in those years was zero. The PV of the industry cost related to reservoir modeling equaled $186.8 million discounted at 7%.
Table 7-4. Increase in Geothermal Exploration Costs in the United States due to TOUGH
Models Technology, 1980–2008
Year (a)
Geothermal Plant Capacitya (MW)
(b) Newly Installed
Geothermal Plant Capacityb (kW)
((b) x $160/kW) Increase in Capital Costs due to
Reservoir Modeling (thousands $2008)
1979 432 0 $0 1980 638 206,000 $32,960 1981 638 0 $0 1982 648 10,000 $1,600 1983 1,053 405,000 $64,800 1984 1,181 128,000 $20,480 1985 1,589 408,000 $65,280 1986 1,675 86,000 $13,760 1987 1,793 118,000 $18,880 1988 2,026 233,000 $37,280 1989 2,325 299,000 $47,840 1990 2,436 111,000 $17,760 1991 2,436 0 $0 1992 2,487 51,000 $8,160 1993 2,570 83,000 $13,280 1994 2,570 0 $0 1995 2,570 0 $0 1996 2,610 40,000 $6,400 1997 2,610 0 $0 1998 2,610 0 $0 1999 2,610 0 $0 2000 2,669 59,000 $9,440
7 Note that the development of geothermal fields is frequently an ongoing process with an expanding and changing number of
operational wells. The incremental costs associated with using simulation models are incurred throughout the development process of a field. This study uses incremental installed capacity coming on line each year to proxy for these capital costs. Admittedly, the more appropriate measure would be annual capital expenditures. However, this information is not available for the subset of geothermal power plants.
(continued)

Chapter 7 — TOUGH Series of Reservoir Models: Technology Impact Assessment
7-9
Table 7-4. Increase in Geothermal Exploration Costs in the United States due to TOUGH Models Technology, 1980–2008, (continued)
Year (a)
Geothermal Plant Capacitya (MW)
(b) Newly Installed
Geothermal Plant Capacityb (kW)
((b) x $160/kW) Increase in Capital Costs due to
Reservoir Modeling (thousands $2008)
2001 2,669 0 $0 2002 2,669 0 $0 2003 2,669 0 $0 2004 2,669 0 $0 2005 2,699 30,000 $4,800 2006 2,756 57,000 $9,120 2007 2,771 15,000 $2,400 2008 2,818 47,000 $7,520
Undiscounted Total
$381,760
PVc at 7% $186,763 a Source: GEA (2009a). b Column calculated as follows: (Column (a) Year t – Column (a) Year t-1). c Base year is 1976, which is the first year of DOE program expenses.
7.4.2 Environmental Benefits In the absence of reservoir modeling, the electricity generated due to improvement in geothermal productivity would have been otherwise generated by a mix of fossil fuels.8 The resulting decrease in key criteria and GHG emissions are presented in Table 7-5 and represent the environmental benefits of reservoir modeling. This study uses the U.S. Environmental Protection Agency’s (EPA’s) COBRA model to capture the monetary health benefits associated with the reduction in emissions. As described in Appendix C, the COBRA model uses changes in PM, NOx, and SO2 as inputs to estimate health impacts in terms of reductions in incidents. The reduction in incidents is then monetized using standard mortality, morbidity, and health care cost factors from the literature.
8 Generation from a mix of fossil fuels is used as the counterfactual if geothermal generation is removed because oil and gas are
the primary electricity fuel source in the United States. Although the majority of geothermal plants are located in California, , California is a net importer of electricity from other states. It is assumed that in the absence of geothermal power generation, California would have increased power imports, which would have been supplied primarily by generation from a mix of fossil fuesl from neighboring states.

Retrospective Benefit-Cost Evaluation of U.S. DOE Geothermal Technologies R&D Program Investments: Impacts of a Cluster of Energy Technologies
7-10
Table 7-5. TOUGH Models Technology Emission Reductions
Year
Electricity Generated
Attributable to Reservoir Modelinga
(MWh)
Particulates (short tons) SO2
(short tons)
SO2 (short tons)
NOx (short tons)
CO2 Equivalent Reductionb (thousand
metric tons)
1980 118,411 357 156 82 107 1981 179,720 542 237 124 162 1982 95,390 288 126 66 86 1983 218,613 659 288 151 197 1984 385,154 1,161 508 266 347 1985 543,626 1,639 717 376 490 1986 641,899 1,935 847 444 578 1987 688,649 2,076 908 476 620 1988 641,111 1,933 846 443 578 1989 1,070,448 3,227 1,412 740 964 1990 1,154,530 3,480 1,523 798 1040 1991 1,207,748 3,641 1,593 835 1088 1992 1,224,899 3,692 1,616 846 1104 1993 1,289,960 3,889 1,701 891 1162 1994 1,164,649 3,511 1,536 805 1049 1995 948,929 2,861 1,252 656 855 1996 1,043,972 3,147 1,377 721 941 1997 1,083,713 3,267 1,429 749 976 1998 1,088,495 3,281 1,436 752 981 1999 1,093,805 3,297 1,443 756 985 2000 1,020,419 3,076 1,346 705 919 2001 985,153 2,970 1,299 681 888 2002 1,060,234 3,196 1,398 733 955 2003 1,053,526 3,176 1,390 728 949 2004 1,092,201 3,292 1,441 755 984 2005 1,080,278 3,257 1,425 746 973 2006 1,067,906 3,219 1,409 738 962 2007 1,074,825 3,240 1,418 743 968 2008 1,097,027 3,307 1,447 758 988 Total 76,615 33,523 17,561 22,897
a Column (c) in Table 7-3. b Calculation based on Electricity Generated Attributable to Reservoir Modeling (a) and Carbon Dioxide Emission Rates: Coal
2.117; Natural Gas 1.314; Oil 1.915 pounds per KWh (U.S. DOE, 2010c).

Chapter 7 — TOUGH Series of Reservoir Models: Technology Impact Assessment
7-11
The results from the model are presented in Table 7-6. Total annual health effects in 2008 are valued at $81.6 million, with the majority of the benefits coming from avoided mortality.9 For a detailed discussion of the environmental benefits calculation, refer to Appendix C. Table 7-6. Annual Health Impacts of TOUGH Models Technology, 2008 (thousands $2008)
Health Risks Reduction in Incidents Decrease in Costs (thousands $2008)
Mortality 12 $75,000 Infant mortality 0 $230 Chronic bronchitis 8 $3,564 Nonfatal heart attacks 17 $1,890 Respiratory hospital admissions 2 $30 Cardiovascular-related hospital admissions 5 $134 Acute bronchitis 20 $8 Upper respiratory symptoms 178 $5 Lower respiratory symptoms 237 $4 Asthma emergency room visits 7 $2 Minor restricted activity days 9,939 $605 Work days lost 1,680 $134 Total Health Effects 12,105 $81,606
9 The mean value for avoiding one statistical death in the COBRA model is $5.5 million ($2000) (USEPA, 2006).

Retrospective Benefit-Cost Evaluation of U.S. DOE Geothermal Technologies R&D Program Investments: Impacts of a Cluster of Energy Technologies
7-12
The 2008 health impacts are then scaled by historical population and geothermal capacity in place to generate a time series of health benefits (see Table 7-7). Table 7-7. Environmental Health Benefits of TOUGH Models Technology, 1980–2008
Year U.S. Population a
(b) Adjusted Share of Electricity
Generated Attributable to Reservoir Modelingb (MWh)
(c) Environmental Health
Benefits Attributable to Reservoir Modelingc
(thousands $2008) 1980 227,224,681 118,411 $6,583 1981 229,465,714 179,720 $10,089 1982 231,664,458 95,390 $5,406 1983 233,791,994 218,613 $12,504 1984 235,824,902 385,154 $22,221 1985 237,923,795 543,626 $31,643 1986 240,132,887 641,899 $37,711 1987 242,288,918 688,649 $40,820 1988 244,498,982 641,111 $38,349 1989 246,819,230 1,070,448 $64,638 1990 249,464,396 1,154,530 $70,463 1991 252,153,092 1,207,748 $74,505 1992 255,029,699 1,224,899 $76,425 1993 257,782,608 1,289,960 $81,353 1994 260,327,021 1,164,649 $74,175 1995 262,803,276 948,929 $61,011 1996 265,228,572 1,043,972 $67,742 1997 267,783,607 1,083,713 $70,998 1998 270,248,003 1,088,495 $71,967 1999 272,690,813 1,093,805 $72,972 2000 282,171,936 1,020,419 $70,443 2001 285,039,803 985,153 $68,700 2002 287,726,647 1,060,234 $74,632 2003 290,210,914 1,053,526 $74,801 2004 292,892,127 1,092,201 $78,263 2005 295,560,549 1,080,278 $78,114 2006 298,362,973 1,067,906 $77,951 2007 301,290,332 1,074,825 $79,226 2008 304,059,724 1,097,027 $81,606
Undiscounted Total
$1,675,314
PVd at 7% $450,758 a Source: U.S. Bureau of Census (2000, 2009). b Column (c) from Table 7-3. c Health Benefits in 2008 [$81.6 Million from Table 7-6] scaled by Column (a) and Column (b) d Base year is 1976, which is the first year of DOE program expenses.
The PV of the health benefits from 1980 through 2008 (base year 1976) is calculated to be $450.8 million discounted at 7%.

Chapter 7 — TOUGH Series of Reservoir Models: Technology Impact Assessment
7-13
7.4.3 Security Benefits
Security benefits derive from reducing the probability and potential impact of oil and natural gas disruptions and price shocks or other energy system disruptions that would damage or disrupt the economy, environment, or national security of the United States. These benefits are realized through substitution of a volume of oil and natural gas, which otherwise would be combusted to produce electricity, with geothermal electricity generation technology. Table 7-8 presents the reduction in 19.4 billion cubic feet of natural gas or 3.4 million barrels of oil equivalent.
Table 7-8. Security Benefits of TOUGH Models Technology Attributable to DOE, 1980–2008
Year MWha Million Cubic Feet of Natural Gasb
BOE (Thousand Barrels of Oil Equivalent)b
1980 118,411 90 16 1981 179,720 137 24 1982 95,390 73 13 1983 218,613 167 30 1984 385,154 294 52 1985 543,626 415 74 1986 641,899 490 87 1987 688,649 526 93 1988 641,111 489 87 1989 1,070,448 817 145 1990 1,154,530 881 156 1991 1,207,748 922 163 1992 1,224,899 935 166 1993 1,289,960 985 175 1994 1,164,649 889 158 1995 948,929 724 128 1996 1,043,972 797 141 1997 1,083,713 827 147 1998 1,088,495 831 147 1999 1,093,805 835 148 2000 1,020,419 779 138 2001 985,153 752 133 2002 1,060,234 809 143 2003 1,053,526 804 143 2004 1,092,201 834 148 2005 1,080,278 825 146 2006 1,067,906 815 144 2007 1,074,825 820 145 2008 1,097,027 837 148
Total 25,415,288 19,401 3,438 a Column (c) from Table 7-3. b DOE Attribution was applied by multiplying million cubic feet of natural gas or BOE by the attribution factor, 23% [Table 7-11 discounted total-benefits attributable to DOE/ discounted total reservoir modeling benefits]
7.4.4 Total Benefits Finally, the total benefits of reservoir modeling were calculated by adding productivity and environmental health benefits and subtracting additional modeling costs. This calculation is presented in Table 7-9. The PV of the total benefits of reservoir modeling to the geothermal industry equaled $954.1 million discounted at 7%.

Retrospective Benefit-Cost Evaluation of U.S. DOE Geothermal Technologies R&D Program Investments: Impacts of a Cluster of Energy Technologies
7-14
Table 7-9. Total Benefits of TOUGH Models Technology in the Geothermal Industry in the United States, 1980–2008 (thousands $2008)
Year
Productivity Benefits
Attributable to Reservoir Modelinga
Environmental Health Benefits Attributable
to Reservoir Modelingb
Increase in Capital Costs due to
Reservoir Modeling
(d) Total Reservoir
Modeling Benefits
1980 $12,646 $6,583 $32,960 -$13,731 1981 $20,524 $10,089 $0 $30,613 1982 $11,390 $5,406 $1,600 $15,196 1983 $25,928 $12,504 $64,800 -$26,368 1984 $43,676 $22,221 $20,480 $45,418 1985 $61,702 $31,643 $65,280 $28,065 1986 $71,251 $37,711 $13,760 $95,201 1987 $73,479 $40,820 $18,880 $95,419 1988 $65,906 $38,349 $37,280 $66,975 1989 $107,794 $64,638 $47,840 $124,592 1990 $113,952 $70,463 $17,760 $166,655 1991 $118,238 $74,505 $0 $192,744 1992 $118,448 $76,425 $8,160 $186,713 1993 $123,965 $81,353 $13,280 $192,039 1994 $109,360 $74,175 $0 $183,536 1995 $87,017 $61,011 $0 $148,028 1996 $93,540 $67,742 $6,400 $154,881 1997 $95,258 $70,998 $0 $166,256 1998 $93,066 $71,967 $0 $165,034 1999 $90,786 $72,972 $0 $163,758 2000 $85,001 $70,443 $9,440 $146,004 2001 $85,905 $68,700 $0 $154,605 2002 $89,908 $74,632 $0 $164,540 2003 $90,393 $74,801 $0 $165,193 2004 $93,165 $78,263 $0 $171,428 2005 $95,389 $78,114 $4,800 $168,702 2006 $99,849 $77,951 $9,120 $168,681 2007 $100,281 $79,226 $2,400 $177,107 2008 $107,728 $81,606 $7,520 $181,814
Undiscounted Total $2,385,545 $1,675,314 $381,760 $3,679,098 PVc at 7% $690,113 $450,758 $186,763 $954,108
a Column (d) from Table 7-3. b Column (c) from Table 7-7. c Base year is 1976, which is the first year of DOE program expenses.
This study was unable to quantify non-geothermal applications of the TOUGH series of models in this analysis. Reservoir modeling has been adapted for other uses, such as nuclear waste storage and CO2 sequestration, and for these applications, the TOUGH model has been the primary modeling tool. Thus, this study presents a conservative retrospective estimate of the economic impact of this family of reservoir models.

Chapter 7 — TOUGH Series of Reservoir Models: Technology Impact Assessment
7-15
7.5 Attribution Share Section 7.4 estimated the economic and environmental impact of reservoir models used for geothermal application. This section assesses the share of these benefits that can be attributed to DOE’s development and dissemination of the TOUGH series of reservoir models. To assess the share of benefits attributable to the TOUGH series reservoir models, Table 7-10 presents a historic timeline of DOE’s and other organizations’ involvement with the development, demonstration, commercialization, and adoption of geothermal reservoir models. Before 1975, reservoir modeling was used for large-scale oil and gas reservoir applications, but computational power was costly and models were not designed to handle the more complex temperature and pressure characteristics of geothermal fields. Thus, DOE’s activities in the late 1970s and early 1980s were at the forefront of geothermal reservoir model development, and coincided with the evolution of computer capabilities that enabled complex simulation models to be run cost-effectively. To quantify attribution, this study sought to partition the suite of available reservoir models into two groups: (1) the TOUGH series of models, and (2) other reservoir models (e.g., TETRAD, STAR). It was assumed that the net benefits of using reservoir models (quantified in Section 7.4) are approximately the same for both groups. Industry experts interviewed as part of the study indicated that the fundamentals of most geothermal reservoir models are similar, and that for most applications, the leading models are comparable. Model selection was historically based more on familiarity with specific models (legacy use) rather than unique modeling capabilities and benefits. Yet, experts indicated that they expect the use of the TOUGH series of models to increase in the future because of the flexibility of the TOUGH models to simulate more diverse and complicated applications such as carbon sequestration and groundwater contamination. The DOE attribution between the two groups is different:
• DOE had overwhelming influence (80%) on the TOUGH series models.
• DOE efforts were influential (20%) on other reservoir models.

Retrospective Benefit-Cost Evaluation of U
.S. DO
E Geotherm
al Technologies R&D
Program Investm
ents: Impacts of a
Cluster of Energy Technologies
7-16
Table 7-10. A Matrix for Assessing DOE Attribution of the TOUGH Models Technology by Stage Categories of Information Needed for
Additionality Assessment
Technology Timeline (Stage of Research, Development, and Commercialization)
Preliminary & Detailed Investigation
Develop Components Develop System Validate/
Demonstrate Commercialize Market Adoption DOE Attribution
What DOE did Identified limitations of exploration techniques and potential for imaging subsurface
Organized 1980 Code Comparison Study
MULKOM model developed
MULKOM served as a testing bed for TOUGH and TOUGH2
Held a series of workshops and symposia, which enhanced collaborations between commercial and scientific communities
TOUGH code is distributed through DOE website
LBNL maintains, distributes, and adds to the code TOUGH is widely
used around the world
What others did STAR developed by S-Cubed
TETRAD developed
TETRAD became a primary software used for geothermal application in the United States
Driving forces More powerful computers are developed allowing for more sophisticated programming
Unocal Corporation chooses TETRAD as non-DOE-sponsored technology
Description of DOE influence
Overwhelming (90%) Industry was at the
inception, and DOE demonstrated validity of reservoir modeling
Overwhelming (100%) One of the first
models to use computing power to build an operational model
Overwhelming (100%)
DOE compiled best practices and state of modeling; introduced first-of-a-kind implicit approach
Overwhelming (90%) DOE encouraged
collaboration and publication of best practices
Very important (50%)
DOE provided some support to stakeholders that have chosen to run TOUGH
Very important (50%) DOE maintains
and updates the code, as some companies are switching to TOUGH because of its flexibility
(continued)
80% of benefits attributed to DOE for modeling using TOUGH series

Chapter 7 — TO
UG
H Series of Reservoir M
odels: Technology Impact Assessm
ent
7-17
Table 7-10. A Matrix for Assessing DOE Attribution of the TOUGH Models Technology by Stage, (continued) Categories of Information Needed for
Additionality Assessment
Technology Timeline (Stage of Research, Development, and Commercialization)
Preliminary & Detailed Investigation
Develop Components Develop System Validate/
Demonstrate Commercialize Market Adoption DOE Attribution
Basis of evidence for influence Public record,
patent citations Interviews
with third parties
Interviews with partners
Other
Attendance at DOE conferences and DOE publications
Interviews with partners Interviews with
third parties
Interviews with partners Interviews with
third parties
Other – research
80% of benefits attributed to DOE for modeling using TOUGH Series
The DOE effect Accelerated technology entry
Accelerated technology entry
Improved performance
Improved performance
Improved performance Increased market
size internationally
Improved performance Increased market
size internationally
The DOE effect Accelerated technology entry
Accelerated technology entry
Improved performance
Improved performance
Improved performance Increased market
size internationally
Improved performance Increased market
size internationally

Retrospective Benefit-Cost Evaluation of U.S. DOE Geothermal Technologies R&D Program Investments: Impacts of a Cluster of Energy Technologies
7-18
Based on a study conducted by O’Sullivan (2001), the share of TOUGH usage for U.S. geothermal applications has historically been approximately 5%, with other reservoir models accounting for 95% of U.S. geothermal reservoir modeling. Using these usage shares and the attribution rates, this study calculated PV of total benefits attributable to DOE to be $219.4 million discounted at 7% for the period 1980 to 2008 (see Table 7-11).
Table 7-11. Benefits of TOUGH Models Technology Attributable to DOE, 1980–2008
Year (a): (Column (d) from Table 7-9) Total Reservoir
Modeling Benefits
TOUGH Model Benefits Attributable to DOE (80%)
Other Model Benefits Attributable to DOE (20%)
(b) + (c) Total DOE
Benefits (thousands
$2008)
(b): (a) * 80% * 5% 5% of All Reservoir
Models
(c): (a) * 20% * 95% 95% of All Reservoir
Models 1980 -$13,731 -$549 -$2,609 -$3,158 1981 $30,613 $1,225 $5,817 $7,041 1982 $15,196 $608 $2,887 $3,495 1983 -$26,368 -$1,055 -$5,010 -$6,065 1984 $45,418 $1,817 $8,629 $10,446 1985 $28,065 $1,123 $5,332 $6,455 1986 $95,201 $3,808 $18,088 $21,896 1987 $95,419 $3,817 $18,130 $21,946 1988 $66,975 $2,679 $12,725 $15,404 1989 $124,592 $4,984 $23,673 $28,656 1990 $166,655 $6,666 $31,664 $38,331 1991 $192,744 $7,710 $36,621 $44,331 1992 $186,713 $7,469 $35,475 $42,944 1993 $192,039 $7,682 $36,487 $44,169 1994 $183,536 $7,341 $34,872 $42,213 1995 $148,028 $5,921 $28,125 $34,046 1996 $154,881 $6,195 $29,427 $35,623 1997 $166,256 $6,650 $31,589 $38,239 1998 $165,034 $6,601 $31,356 $37,958 1999 $163,758 $6,550 $31,114 $37,664 2000 $146,004 $5,840 $27,741 $33,581 2001 $154,605 $6,184 $29,375 $35,559 2002 $164,540 $6,582 $31,263 $37,844 2003 $165,193 $6,608 $31,387 $37,994 2004 $171,428 $6,857 $32,571 $39,428 2005 $168,702 $6,748 $32,053 $38,802 2006 $168,681 $6,747 $32,049 $38,797 2007 $177,107 $7,084 $33,650 $40,735 2008 $181,814 $7,273 $34,545 $41,817
Undiscounted Total $3,679,098 $147,164 $699,029 $846,193 PVa at 7% $954,108 $38,164 $181,280 $219,445
a PV base year is 1976.
7.6 Benefit-Cost Analysis DOE program expenditures associated with the TOUGH family of reservoir models are presented in Table 7-12. These expenditures are based on appropriation items provided by DOE for EERE budgets

Chapter 7 — TOUGH Series of Reservoir Models: Technology Impact Assessment
7-19
from 1976 to 2008. The expenditures in Table 7-12 are built up from the number of full-time equivalents (FTEs) spent on developmental work associated with the TOUGH models, and they represent approximately 0.1% of EERE’s total GTP budget during this time period (Pruess, 2009). The PV of total expenditures (adjusted to $2008) equaled $8.6 million discounted at 7% from 1976 to 2008. DOE’s investment in the TOUGH models yielded net benefits with PV of $210.8 million discounted at 7% ($446.3 million discounted at 3%).
Table 7-12. Net Benefits of TOUGH Models Technology Attributable to DOE, 1976–2008
(thousands $2008) Year Total Benefits Expenses Net Benefits 1976 $0 $797 -$797 1977 $0 $797 -$797 1978 $0 $797 -$797 1979 $0 $797 -$797 1980 -$3,158 $797 -$3,955 1981 $7,041 $797 $6,244 1982 $3,495 $797 $2,698 1983 -$6,065 $797 -$6,862 1984 $10,446 $797 $9,649 1985 $6,455 $797 $5,658 1986 $21,896 $797 $21,099 1987 $21,946 $797 $21,149 1988 $15,404 $797 $14,607 1989 $28,656 $797 $27,859 1990 $38,331 $797 $37,534 1991 $44,331 $797 $43,534 1992 $42,944 $159 $42,785 1993 $44,169 $159 $44,010 1994 $42,213 $159 $42,054 1995 $34,046 $159 $33,887 1996 $35,623 $159 $35,464 1997 $38,239 $159 $38,080 1998 $37,958 $159 $37,799 1999 $37,664 $159 $37,505 2000 $33,581 $159 $33,422 2001 $35,559 $159 $35,400 2002 $37,844 $159 $37,685 2003 $37,994 $159 $37,835 2004 $39,428 $159 $39,269 2005 $38,802 $159 $38,643 2006 $38,797 $159 $38,638 2007 $40,735 $159 $40,576 2008 $41,817 $159 $41,658
Undiscounted Total $846,193 $15,462 $831,670 PVa at 7% $219,445 $8,619 $210,826 PVa at 3% $457,957 $11,655 $446,302
a PV base year is 1976.

Retrospective Benefit-Cost Evaluation of U.S. DOE Geothermal Technologies R&D Program Investments: Impacts of a Cluster of Energy Technologies
7-20
Table 7-13 summarizes the results of the benefit-cost analysis. In addition to net benefits with PV of $210.8 million discounted at 7%, the ratio of benefit attributed to DOE expenditures was calculated (referred to as the BCR). The BCR decreases at higher discount rates, reflecting the timing of expenditures and benefits. The BCR (discounted at 7%) equaled 25.5 (39.3 discounted at 3%). The IRR serves as a measure of an investment’s return by comparing initial investments with discounted cash flows. The IRR for the TOUGH program was 48%.
Table 7-13. Benefit-Cost Analysis Results
Net Benefits (thousands $2008) Benefit-Cost Ratio Internal Rate of
Return
PVa at 7% $210,826 25.5 48% PVa at 3% $446,302 39.3 a PV base year is 1976.
7.7 Sensitivity Analysis When estimating the environmental health benefits, it was assumed that in the absence of geothermal electricity, additional oil, gas and coal-fired power plants would have been built to meet base load electricity demand. To investigate how sensitive our findings are to this assumption, this study estimated environmental health benefits from TOUGH series of models using an alternative assumption of 50% coal and 50% natural gas. The results are presented in Table 7-14. Using an assumption of 50% coal and 50% natural gas reduced the environmental health benefits by 14.9% or $15.5 million. This reduces the BCR for the TOUGH series of models from 25.5 to 23.7. Table 7-14. TOUGH Models Technology Benefits Attributable to DOE: Sensitivity to Displaced
Fuel Type Displaced Generationa Percentage
Reduction 60% Coal, 39% NG,
1% Oil 50% Coal, 50% NG
PM (short tons) 17,621 14,973 15.0% SO2 (short tons) 7,710 6,410 16.9% NOX (short tons) 4,039 3,389 16.1% GHG (thousand tCO2e) 5,266 5,014 4.8% Monetized health benefit (PVa at7%, thousands $2008) $103,674 $88,178 14.9%
a PV base year is 1976.

8-1
8. HIGH-TEMPERATURE CEMENT: TECHNOLOGY IMPACT ASSESSMENT
8.1 Introduction In the late 1970s, DOE’s GTP set out to develop new enabling technologies that would lower the costs of geothermal energy production and expand our ability to capture and fully utilize this sustainable energy resource. Early geothermal energy projects revealed that the use of Portland cement in geothermal wells was problematic, leading to frequent and costly repairs and significantly shorter well lifetimes. For this reason, DOE began funding basic research on well cements with the long-term goal of applying this research to the development of new well cements that address the shortcomings of existing Portland cements in geothermal wells. Over the next 30 years, DOE funded Brookhaven National Laboratory’s (BNL’s) basic materials research and applied research on the cementitious properties of various chemical formulations. BNL’s research led to the patenting and commercialization of a calcium aluminate phosphate (CaP) cement system that is resistant to acidic corrosion and maintains structural integrity at extremely high temperatures. The following sections detail the historical events leading to the development of high-temperature cement; identifies the alternative technology scenario; values the benefits of the technology and determines the proportion of the benefits attributable to DOE; and concludes with a benefit-cost ratio estimate computed for high-temperature cement. 8.2 History of the Technology Accessing geothermal resources deep beneath the Earth’s surface requires drilling wells to depths typically greater than 1,000 meters, with some projects requiring deeper wells that can exceed 5,000 meters (Augustine et al., 2006). The harsh environmental conditions at these depths have presented numerous challenges to geothermal projects in terms of well construction and long-term stability. Portland cement has long been used in well completions for cementing in place the steel casing that lines the inside of the well borehole. The cement and casing combined prevent well borehole collapse and maintain well pressure. The American Petroleum Institute Specification 10A defines the standards for oil and gas well cementing (Bensted, 1998). The Institute’s standard specifies eight classes of Portland cements commonly used in the oil and gas industry. Although Portland cement continues to be the industry standard for most oil and gas wells, it has proven problematic for use in geothermal wells, deep oil and gas wells, and steam and CO2 injection wells due to the harsh environmental conditions characterized by extremely high temperatures, high concentrations of CO2, and acidic sulfuric acid (H2SO4) brine (pH < 1.5) (U.S. DOE, 2005a).

Retrospective Benefit-Cost Evaluation of U.S. DOE Geothermal Technologies R&D Program Investments: Impacts of a Cluster of Energy Technologies
8-2
A 2006 report by BNL lead scientist Toshifumi Sugama identifies two major regions of geothermal wells that are particularly susceptible to cementing failures: the “deep hot downhole area (~1,700 m depth at temperature ~320oC)” and the “upper well region consisting of the area between the surface and ~1000 m depth at temperatures ~200oC” (Sugama, 2006). Sugama explains that when placed in these environments, Portland cement’s chemical composition reacts with “hot CO2 and H2SO4” causing rapid deterioration of the cement’s structural integrity and increased porosity due to acidic erosion, allowing acidic brine to permeate and accelerating corrosion of the steel casing. The cement deterioration leads to impaired performance or complete failure of a geothermal well, typically within one year. In more severe cases wells collapsed in less than 3 months (Sugama, 2006). This leads to costly well remediation, including redrilling and recementing failed wells (U.S. DOE, 2005a). See Chapter 9 for discussion of patents and knowledge benefits. Between 1994 and 2006, BNL conducted R&D work to address the cement issues with a stated goal of reducing well drilling and reservoir management costs by 25% (Sugama, 2006). The BNL research team worked to develop novel alternative cements that would resist CO2 and acidic brine at higher temperatures (up to 320oC). This research program succeeded in developing two novel cements, CaP and sodium silicate-activated slag (SSAS) (Sugama, 2006). CaP is a non-Portland–based cement composed of calcium aluminate cement, sodium polyphosphate, Class F fly ash, and water. CaP cements demonstrated resistance to high concentrations of CO2 in downhole environments with low acidity levels (pH ~5.0) (Sugama, 2006). SSAS is also a non-Portland–based cement composed of slag, Class F fly ash, sodium silicate, and water. SSAS was designed to be heat tolerant and to resist strong acids with low concentrations of CO2 (Sugama, 2006). In 1997, Unocal and Halliburton field tested the CaP cement formulation, using it in the completion of four geothermal wells in northern Sumatra and Indonesia (Sugama, 2006). In parallel with the field tests, BNL conducted an in-house exposure test to monitor the integrity of the cement over a period of seven months in environmental conditions that mirrored those found in the Indonesian wells (~20,000 ppm CO2, and 400 ppm hydrogen sulfide at 280oC) (Sugama, 2006). Results of the BNL exposure test confirmed that the cement demonstrated excellent durability in the extreme environments of geothermal wells (Sugama, 2006). In 1999, only two years after field testing, Halliburton commercialized CaP cement under the trade name ThermaLock which has since been used in a number of international and domestic geothermal well completion projects (Sugama, 2006). The applications of ThermaLock extend beyond geothermal wells to uses in enhanced oil recovery applications for cementing of CO2, steam, and sour-gas re-injection wells; and deep sea offshore oil recovery in the North Sea (Sugama, 2006; U.S. DOE, 2005a). The BNL-developed cement commercialized under the trade name ThermaLock has the potential to extend the life expectancy of geothermal wells by 20 years, mitigating the need for frequent and costly

Chapter 8 — High-Temperature Cement: Technology Impact Assessment
8-3
well remediation (Sugama, 2006). This technology lowers maintenance costs over the life of the geothermal well; however, it increases initial costs due to special requirements for handling equipment and cementing expertise. Although the total NPV is positive, the up-front increased well completion costs have been a barrier to widespread adoption of ThermaLock by geothermal energy projects in the United States. Halliburton is the only supplier of ThermaLock and is also the leading supplier of Portland cement for geothermal wells. However, there is no evidence that market structure (power) has influenced the slow penetration of ThermaLock. Halliburton views this product as having higher potential profitability compared with Portland cement because of its higher value added in the manufacturing process. The commonly cited barrier to adopting ThermaLock is the higher upfront capital costs and asymmetric incentives between developers wanting to bring geothermal plants online at the lowest initial investment costs and owners that would benefit from the lowest life-cycle costs. Availability and cost of capital are also cited by industry as reasons for minimizing upfront capital costs. 8.3 Next Best Alternative High-temperature well cement is an example of a technology improvement. The next best alternative technology is the traditional Portland-based well cements commonly used in geothermal, oil, and gas wells. Originally developed for use in geothermal wells, high-temperature cement has also been used for enhanced oil recovery projects and offshore well drilling. The DOE-developed cement technology impacts new well construction and ongoing maintenance at high-temperature geothermal production wells. The DOE-developed cement is expected to have similar impacts on CO2, steam, and sour-gas re-injection wells at enhanced oil recovery projects as well as in deep sea offshore oil recovery in the North Sea. Portland-based cement blends are used for well construction and maintenance to ensure structural integrity of the well borehole and steel casing, and to ensure adequate internal pressure; however, exposure to extremely high temperatures can lead to cracking and buckling of the cement sheath. In addition, Portland cements are susceptible to corrosion by carbonic acid formed from water saturated with CO2 (Brothers, 2006). Exposure to high temperatures and highly acidic solutions in geothermal brines compromises Portland cement’s physical properties and can result in cement sheath cracking, buckling, and corrosion (Berard et al., 2009; Sugama, 2006). The rapid deterioration of Portland cement in geothermal wells (<12 months) resulted in frequent well workovers1 and costly well remediation (U.S. DOE, 2005a). The use of high-temperature cements enhances performance in terms of structural stability and corrosion resistance and is estimated to eliminate $150,000 in annual well remediation costs and extend the working life of geothermal
1 Well workovers are defined as repair or maintenance activities on an existing well intended to extend the useful life of the well
(Schlumberger, 2009).

Retrospective Benefit-Cost Evaluation of U.S. DOE Geothermal Technologies R&D Program Investments: Impacts of a Cluster of Energy Technologies
8-4
production wells to 20 years or more (Sugama, 2006). These estimates were confirmed through interviews with industry experts. Despite enhanced performance characteristics, the geothermal industry has been slow to adopt ThermaLock, due in large part to its significantly higher initial costs compared to traditional Portland cements. Using ThermaLock for a cementing job is likely to cost twice as much as the same job using conventional Portland cement. ThermaLock’s higher costs are largely the result of specialized equipment and expertise required to handle this product. For example, contamination of ThermaLock with Portland cement will result in a chemical reaction that drastically reduces the pumping time before the cement begins to set up. Avoiding this problem requires segregated transportation and pumping equipment, as well as specialized expertise to handle the cement. 8.4 Benefits Calculations The economic benefits obtained through DOE’s development of high-temperature cements can be separated into two categories: (1) cost savings to the end users of CaP cement, and (2) increased profits attributable to the cement manufacturing company. End users include geothermal operators and oil/gas producers that used the ThermaLock cement in well completions and casing repairs. Table 8-1 summarizes the key parameters and assumptions used to estimate benefits.
Table 8-1. Key Parameters and Assumptions Used in the High-Temperature Cement Benefits
Analysis Parameters/Assumptions Source
Life-cycle costs for a prototypical well by application and cement type
U.S. DOE (2005a), U.S. DOE (2007), Augustine et al. (2006), and interviews with well cementing service industry experts.
ThermaLock wells have a 20-year life expectancy. Wells with Portland cement are reworked every 5 years.
Author interviews with well cementing service industry experts.
Manufacturers’ profit margin of 6.8% Corporate Income and Profitability for Support Activities for Mining (NAICS 2131110), IRS (2008)
48% of benefits associated with ThermaLock applications are attributed to DOE
Published literature, interviews with industry and DOE experts
8.4.1 Economic Benefits from Corporate Profits Estimating the sales revenue realized by the cement manufacturer is a relatively straightforward task, given that the CaP cement technology was commercialize by a single company. Halliburton commercialized CaP cement as ThermaLock in February 1999 and in the same year exported ~116 tons of the cement to Japan for use in two major steam producing – well completion projects conducted by the Japanese energy company JAPEX (U.S. DOE, 2000b). In April of 2000, JAPEX purchased an additional 60 tons for other geothermal well completions (U.S. DOE, 2000b). By July 2006, Halliburton had sold

Chapter 8 — High-Temperature Cement: Technology Impact Assessment
8-5
more than 1,000 tons of ThermaLock cement for geothermal and oil recovery applications around the globe (Sugama, 2006). Benefits from increased taxable sales revenue were developed by estimating the share of company profits attributable to ThermaLock cementing services between 1999 and 2007. Halliburton’s annual financial reports do not disclose sales at this level of detail. Therefore, this study estimated a time series of sales revenue based on information obtained in interviews with Halliburton combined with published case studies on projects that used ThermaLock. The time series revenue estimates include ThermaLock cementing services provided to both domestic and international customers, because all profits accrue to the U.S. division of Halliburton. Annual corporate income and profitability data published by the Internal Revenue Service (IRS) were used to calculate a before-tax profit margin for the Support Activities for Mining (NAICS 2131110), which includes Halliburton. Table 8-2 reports the profit margin calculated from the IRS data for 2004 through 2006.
Table 8-2. Corporate Income and Profitability for Support Activities for Mining
(NAICS 2131110) Value Description 2004 2005 2006
Number of corporations 6,481 7,866 9,059 Number of corporations with net income 4,264 5,075 7,275 Total receipts (thousands $) $49,983,340 $64,294,768 $84,474,588 Business receipts (thousands $) $45,546,332 $60,774,902 $79,060,261 Before-tax profit margin 6.57% 7.17% 20.61% After-tax profit margin 5.68% 5.02% 15.90%
Source: IRS (2008).
After reviewing IRS data for the 3-year period, a before-tax profit margin of 6.87% was chosen as a representative ratio, calculated as the before-tax income divided by total business receipts for 2004 and 2005. Starting in 2006, the mining support service industry’s profit margins quadrupled, closely following a dramatic rise in oil prices that signaled a sudden shift in demand for mining support services from the oil producers. For this reason, the analysis omits the 2006 profit margin estimates. This represents a conservative estimate of Halliburton’s profit margins, given that it is one of the largest firms in the support activities for mining industry. The benefits estimation methodology assumes that profits associated with ThermaLock would be similar to other products and services provided by Halliburton. Hence, the analysis applies the average profit margin to a historical time series of ThermaLock sales for 1999 to 2008. The profit ratio of 6.87% was multiplied by the annual sales of ThermaLock in each year to estimate the before-tax profits Halliburton realized from the product line since its commercialization. Table 8-3 presents the sales and net profits estimated in 2008 dollars.

Retrospective Benefit-Cost Evaluation of U.S. DOE Geothermal Technologies R&D Program Investments: Impacts of a Cluster of Energy Technologies
8-6
Table 8-3. Manufacturer Profits from High-Temperature Cement Technology, 1999–2008
Year No. of Cemented Wells Annual Sales (thousands $current)
Before-Tax Profits (thousands $current)
Before-Tax Profits (thousands $2008) International Domestic
1999 2 0 $1,000 $69 $86 2000 1 2 $786 $54 $66 2001 0 2 $286 $20 $24 2002 1 2 $786 $54 $64 2003 0 2 $286 $20 $23 2004 2 2 $1,286 $88 $99 2005 1 2 $786 $54 $59 2006 0 2 $286 $20 $21 2007 0 2 $286 $20 $20 2008 0 2 $286 $20 $20
Undiscounted Total 7 18 $6,071 $417 $480 PVa at 7% $81
Source: Author estimates based on interviews with Sugama, Brothers, Bour, and Hernandez in 2009 and an estimated before-tax profit margin of 6.87% based on IRS tax data for the Mining Support Services Industry (NAICS 2131110). See Table 8-1.
a PV base year is 1976.
Despite the dramatic improvements in heat tolerance and corrosion resistance, well construction managers have been reluctant to invest in ThermaLock due to higher upfront costs compared to conventional Portland cements. To date, ThermaLock remains a niche product, used in fewer than 30 well cementing jobs since its commercialization a decade ago. Industry experts interviewed for this analysis cited the incentive structure of well construction project managers as a primary obstacle to increased adoption of ThermaLock. Mangers are rewarded for delivering newly completed wells under budget. The existing incentive structure rewards tangible short-term cost savings, while failing to consider the implications to overall life-cycle well maintenance costs over the well’s productive life. Despite this obstacle, experts predict an increase in the rate of adoption over the next five years. Since commercialization in 1999, ThermaLock has been used in approximately 25 wells, a figure which includes 7 international wells and 18 domestic wells. Geothermal production wells account for 5 international and 9 domestic wells in Table 8-3. The balance of international and domestic wells represent steam or gas injection wells associated with enhanced oil recovery projects.
8.4.2 Economic Benefits to End Users DOE-developed cement technology embodied in the commercialized product ThermaLock has provided estimated benefits with PV of $15.7 million discounted at 7% to domestic well operators in the geothermal and oil industries. This estimate of benefits to end users was obtained using a well life-cycle cost comparison approach using well construction costs and expected annual maintenance costs for a prototypical well cemented with ThermaLock in place of traditional Portland-based well cement. Table 8-4 presents the benefits estimate for each well type.

Chapter 8 — High-Temperature Cement: Technology Impact Assessment
8-7
Table 8-4. Total Benefits to End Users of High-Temperature Cement, 1999–2008
Well Type Average Annual Avoided
Cost Per Well (thousands $2008)
Well Count
End-User Benefits (thousands $2008)
Geothermal production wells $1,061 9 $9,549 Enhanced oil recovery injection wells $684 9 $6,156 Total — 18 $15,705
Note: Avoided cost per well for a depth of 5,000 feet with industry standard borehole diameters. Cost savings reflect avoided annual well remediation costs and avoided new well construction every 5 years over a 20-year time horizon. Well count based on estimates provided in industry interviews.
Given the fundamental difference in initial costs for geothermal production wells with injection wells, the analysis was conducted for both types of wells. The net cost savings per year are discounted to the point of investment using an industry appropriate discount rate. The resulting average avoided cost per well is then multiplied by the number of wells cemented with ThermaLock in the United States since its commercialization to estimate national benefits. International wells completed with ThermaLock were omitted from this analysis as the benefits associated with these wells are not directly attributed to a U.S. entity. Average annual avoided costs per well were estimated for a prototypical well by comparing the expected life-cycle costs for a well completed with conventional cement to the costs for the same well completed with ThermaLock over a 20-year time horizon. The resulting average annual avoided costs were $1,061,000 and $684,000 for the prototypical geothermal and enhance oil recovery (EOR) injection well, respectively. Table 8-5 presents the projected life-cycle costs for each well type for the alternative cementing scenarios, as well as other underlying assumptions and inputs used in the analysis.
Table 8-5. Comparison of Lifecycle Costs for a Prototypical Well by Application and Cement
Type
Application Cement Type Portland ThermaLock
Geothermal Production Wells Drilling and completion costsa,b $1,750,000 $2,000,000 Annual maintenance costsc $150,000 $0 Useful lifetimeb,c 5 years 20 years Enhanced Oil Recovery Injection Wells Drilling and completion costs $500,000 $571,000 Annual maintenance costs $150,000 $0 Useful lifetime 5 years 20 years
Note: Assumed well depth of 5,000 feet in all cases. a Source: U.S. DOE (2007). b Source: Author interviews with well cementing service industry experts. c Source: U.S. DOE (2005a).
Based on the previous work of Augustine et al. (2006), a cost multiplier of 3.5 was used to adjust the initial drilling and completion costs in geothermal wells compared to EOR injection wells.1 Annual
2 Augustine et al. (2006) found that normalized well costs at geothermal sites were often 2 to 5 times greater than costs for oil and
gas wells at comparable depths.

Retrospective Benefit-Cost Evaluation of U.S. DOE Geothermal Technologies R&D Program Investments: Impacts of a Cluster of Energy Technologies
8-8
maintenance costs and expected lifetimes were assumed to be similar for both geothermal and EOR injection wells. Costs projected over a 20-year time horizon to estimate each well’s total life-cycle costs. Using the assumptions listed in Table 8-5, time series of expected costs were developed for each type of well under two scenarios. Table 8-6 presents the time series of expected cost savings for 5,000-foot deep geothermal and EOR injection wells cemented using ThermaLock in lieu of Portland cement. The annual avoided costs per well presented in Table 8-6 were then applied to the number of domestic wells cemented with ThermaLock since its commercialization in 1999 (see Table 8-7). Cementing experts from Halliburton that were interviewed estimated that fewer than 20 wells have been completed using ThermaLock in the United States over the last 10 years. Published case studies and information obtained from interviews were used to develop a timeline of the number of domestic projects completed each year. The sum of annual cost savings from domestic wells is added to the before-tax profits yields the total social benefits for each year.
Table 8-6. Annual Avoided Costs per Well by Well Type (thousands $2008)
Period Annual Avoided Costs Per Well Geothermal EOR Injection
0 –$250 –$71 1 $150 $150 2 $150 $150 3 $150 $150 4 $150 $150 5 $1,750 $500 6 $150 $150 7 $150 $150 8 $150 $150 9 $150 $150
10 $1,750 $500 11 $150 $150 12 $150 $150 13 $150 $150 14 $150 $150 15 $1,750 $500 16 $150 $150 17 $150 $150 18 $150 $150 19 $150 $150
Undiscounted Total $7,400 $3,829

Chapter 8 — High-Temperature Cement: Technology Impact Assessment
8-9
Table 8-7 summarizes the total social benefits directly attributable to ThermaLock cement.
Table 8-7. Total Benefits of High-Temperature Cement, 1999–2008 (thousands $2008)
Year Domestic Wells Cost Savings Before-Tax Profits Total Benefits
1999 $0 $86 $86 2000 -321 $66 -$255 2001 -21 $24 $3 2002 $279 $64 $343 2003 $579 $23 $602 2004 $879 $99 $978 2005 $3,129 $59 $3,188 2006 $3,429 $21 $3,450 2007 $3,729 $20 $3,749 2008 $4,029 $20 $4,049
Undiscounted Total $15,711 $480 $16,191 PVa at 7% $2,097
Note: In 1999, there were only international sales of ThermaLock. No sales reported in 2009. a Base year is 1976, which is the first year of DOE program expenses.
Corporate before-tax profits account for 3% of total social benefits, while the overwhelming majority of social benefits are derived from cost savings to well operators. The fourth column in Table 8-7 is the PV of the net avoided costs per year from using ThermaLock. Totaling the net avoided costs over the 20-year time horizon yields the average estimated life-time cost savings per well. The next step is determining the share of total benefits that are attributable to research funded by and/or conducted through DOE’s GTP. 8.4.3 Environmental Benefits No environmental benefits are associated with using high-temperature cement. The technology lowers the cost of well maintenance. However, there is no evidence that it has increased the production of geothermal energy. 8.4.4 Security Benefits No security benefits were identified associated with using high-temperature cement. 8.5 Attribution Share A review of existing publications and internal reports, combined with technical interviews of participating scientists and industry experts, provided information to assess the relative share of the benefits that are attributable to DOE. The development timeline for this technology occurred in three major phases over a 24-year period starting in 1976. Figure 8-1 summarizes the R&D stages and major technology milestones.

Retrospective Benefit-Cost Evaluation of U.S. DOE Geothermal Technologies R&D Program Investments: Impacts of a Cluster of Energy Technologies
8-10
Figure 8-1. High-Temperature Cement Technology Development Timeline, 1976–2006
▲The U.S. Patent and Trademark Office awards DOE a patent on CaP cement on September 21, 1993.
▲Halliburton commercializes CaP cement under the trade name ThermaLock, February 1999.
Phase I consisted of basic research conducted at Sandia National Laboratories, Los Alamos National Laboratory, and Oak Ridge National Laboratories over a seven-year period to develop a fundamental understanding of the chemical and physical properties of various cement formulations resulting in a cementious material. Although materials research was underway before the geothermal program was created, 1976 marked the beginning of a more formal effort pursuing improved well cements specifically for geothermal wells. Phase II consisted of applied research over a 10-year period between 1984 and 1994. Brookhaven National Laboratory, in collaboration with selected industry partners, conducted field tests to identify cementious materials for use in geothermal wells. In 1993, BNL patented the high-temperature cement technology under the title Phosphate-Bonded Calcium Aluminate Cements (Sugama, 1993). Phase III, the final stage of the BNL cement program, began in 1994 and continued until 1999, culminating in the commercialization of the high-temperature cement by Halliburton under the trade name ThermaLock. Phase III primarily consisted of additional field testing in harsh well environments and final commercial product development by BNL’s corporate cost-sharing partners. Development activities under Phase III were co-funded by DOE’s Office of Geothermal Technologies and three corporate partners: Halliburton, Unocal Corporation, and CalEnergy Operating Corporation. Halliburton was the primary cost-sharing partner and was responsible for conducting technical and economic feasibility studies for the BNL-developed cements and for contributing to the formulation of the
Basic R&D Materials Research
(BNL and SNL)
Applied R&D CaP Cement Technology
(BNL)
Development& Field Verification
(BNL and Corporate Partners)
19851975 1995 2005
Commercialization & Market Adoption(Halliburton)
2000
Phase I1976 - 1984
Phase II1985 - 1994
Phase III1995 - 1998
2009
Phase IV1999 - Present
▲ DoE Patent
1980 1990
▲ DoE Funding Ends

Chapter 8 — High-Temperature Cement: Technology Impact Assessment
8-11
final field tested cements. Unocal provided information on compatibility of BNL cements with cementing equipment, operations, and processes currently used in the field. CalEnergy was responsible for field testing BNL-developed cements to validate the cements’ integrity and reliability following prolonged exposure in functioning geothermal wells. Table 8-8 provides a matrix of the sequential elements of the R&D timeline presented in Figure 8-1. During interviews, experts were asked to assessing DOE’s contribution to the development of CaP cements was considered at each stage, from preliminary investigations and basic materials research, component and systems development, and validation and testing through to commercialization. Based on these interviews, published literature, and observable technology transfer, DOE’s influence at each stage is assigned a corresponding percentage based on the following descriptors and ranges of influence:
• Overwhelming (80–100%)
• Dominant (60–80%)
• Very important (40–60%)
• Influential (20–40%)
• None to minimal (0–20%)

Retrospective Benefit-Cost Evaluation of U.S. D
OE G
eothermal Technologies R&
D Program
Investments:
Impacts of a Cluster of Energy Technologies
8-12
Table 8-8. A Matrix for Assessing DOE Attribution of High-Temperature Cement Technology by Stage Categories of
Information Needed for Additionality Assessment
Technology Timeline (Stage of Research, Development, and Commercialization)
Preliminary & Detailed Investigation
Develop Components Develop System Validate/
Demonstrate Commercialize Market Adoption
DOE Attribution
What DOE did – Funds – Activities (e.g., R&D,
catalyze) – Outputs
GTP initiated to assist in removing barriers to expanded development of geothermal resources
Conducted basic research on cement chemistry and physical properties
Laboratory evaluation of cement performance including compression, tensile strength, and corrosion resistance
Provided cost sharing opportunity to conduct field demonstration. Patented initial
CaP cement formulation.
48% of benefits attributed to DOE
What others did (Rival explanations)
ANL developed parallel ceramic based cement with Schlumberger, commercialized as CemCrete
HAL made CaP cement usable in the field by improving pumpability and setup time
Unocal provided Indonesian geothermal wells for field testing.
HAL commercializes CaP cement under trade name ThermaLock
HAL actively markets ThermaLock for apps in geothermal, EOR.
Driving/restraining policies/government forces (Rival explanations) – Requirements
influencing investments in subject technologies
Historical evidence of high cost in geothermal well completions limiting expansion energy production from geothermal resources
DOE effort to reduce drilling costs by 25%
Description of DOE influence
Dominant (70%) Early understanding of
the importance of specialized cement technology required for geothermal wells
Overwhelming (90%) Determined the
trajectory of cement chemistry
Dominant (70%) Coordinated with
HAL to improve initial formulation
Very Important (50%) Provided cost
sharing for field testing and laboratory support for evaluation
Minimal (10%) None (0%)
Basis of evidence for influence
DOE reports Interviews with
partners
DOE reports Interviews with
partners
DOE reports Interviews with
partners
DOE reports Interviews with
partners
Interviews with partners
Interviews with partners
The DOE effect Accelerated technology entry Improved performance
Accelerated technology entry Improved
performance
Accelerated technology entry Improved
performance
Accelerated technology entry Improved
performance Reduced O&M
costs
Notes: BNL – Brookhaven National Lab; ANL – Argonne National Lab; HAL – Halliburton; O&M – Operation and Maintenance

Chapter 8 — High-Temperature Cement: Technology Impact Assessment
8-13
The preliminary and detailed investigation stage relates to targeted materials research conducted by DOE over the first 10 years of the technology timeline. DOE had a dominant influence (70%) in the earliest stage of research to identify and characterize materials to use in cements specially designed for geothermal wells. DOE had an overwhelming influence (90%) on determining the direction of cement research, choosing to pursue a ceramic-based cement formulation over a more conventional Portland-based design. Also during this period, efforts by researchers at Argonne National Laboratories (ANL) successfully developed a ceramic-based concrete known as Ceramicrete, which is viewed as a limited competing technology, as it is designed for use in extremely low temperature environments (U.S. DOE, 2003). Although ANL cement can be used in oil and gas wells, it was not characterized for use in higher temperature geothermal wells. Therefore, this study does not consider this a rival technology that can directly compete with the geothermal cement technology. BNL research had a dominant influence (70%) on the final chemical formulations of the CaP cement for which they obtained a patent in 1993. However, the final stages of the systems development stage were facilitated by Halliburton chemists in residence at BNL. Over this time, BNL contributed materials and laboratory space for Halliburton R&D staff that altered the original patented CaP cement formulation to overcome performance characteristics related to the application of the cement at well sites. Halliburton’s contributions improved the cement’s pumpability and extended the setup time by adding chemical retardants to the BNL formulation. Brookhaven National Laboratories continued to have a very important influence (50%) on the technology during the validation and testing stages by providing analytical testing equipment and laboratory space to conduct environmental exposure tests in parallel with field testing in Indonesian geothermal wells. Following initial field testing, BNL continued to pursue research aimed at lowering the costs of CaP cements by substituting some inputs with lower cost materials, such as fly ash and slag material, to lower the production price. This DOE-funded research continued through 2008. Since commercialization in 1999, Halliburton has marketed ThermaLock for use in domestic and international geothermal and EOR injection wells. DOE has had no direct involvement (0% influence) in the market adoption of ThermaLock. Although the market adoption of ThermaLock has been slow due to a higher initial cost compared with conventional cements, the adoption rate is expected to increase in the near future. Availability of long-term well performance data at existing ThermaLock cemented wells will further reduce investment risk and uncertainty, allowing for increased adoption by the geothermal industry and ultimately leading to both an increase in sales and a reduction in operation and maintenance costs in the future.

Retrospective Benefit-Cost Evaluation of U.S. DOE Geothermal Technologies R&D Program Investments: Impacts of a Cluster of Energy Technologies
8-14
Averaging the influence factors over each stage in the technology development cycle yields an estimated 48.3%. Table 8-9 reports the total benefits developed in Section 8.3 and the benefits attributable to DOE. Roughly half of the total benefits realized from the development of CaP cement, or approximately $1.0 million (PV at 7%), are directly attributable to the GTP’s research and development activities.
Table 8-9. High-Temperature Cement Technology Benefits Attributable to DOE, 1999–2008
(thousands $2008) Year Total Benefits DOE Attributed Benefitsa 1999 $86 $41 2000 -$255 -$123 2001 $3 $1 2002 $343 $165 2003 $602 $291 2004 $978 $472 2005 $3,188 $1,540 2006 $3,450 $1,666 2007 $3,749 $1,811 2008 $4,049 $1,955
Undiscounted Total $16,191 $7,820 PVb at 7% $2,097 $1,013
a Based on 48.3% attribution. b Base year is 1976, which is the first year of DOE program expenses.
8.6 Benefit-Cost Analysis Table 8-10 lists the economic benefits attributed to DOE that were developed in Sections 8.3 and 8.4. The PV of total benefits (adjusted to $2008) equaled $1.0 million discounted at 7% from 1976 to 2008 ($3.2 million discounted at 3%). DOE program expenditures associated with cement materials research are also presented in Table 8-10. The expenditures in Table 8-10 are built up from program expenses associated with cement materials research and demonstration activities (Sugama, 2010) and represent approximately 0.1% of DOE’s total GTP budget over this time period (PV of $9.1 million discounted at 7%). DOE’s investment in high-temperature cement technology yielded −$925 million in net benefits discounted at 7% ($162 million discounted at 3%).

Chapter 8 — High-Temperature Cement: Technology Impact Assessment
8-15
Table 8-10. High-Temperature Cement Technology Net Benefits Attributable to DOE, 1976–2008 (thousands $2008)
Year Total Benefits DOE Expenditures Net Benefits 1976 $0 $142 -$142 1977 $0 $142 -$142 1978 $0 $142 -$142 1979 $0 $142 -$142 1980 $0 $142 -$142 1981 $0 $142 -$142 1982 $0 $142 -$142 1983 $0 $142 -$142 1984 $0 $142 -$142 1985 $0 $142 -$142 1986 $0 $142 -$142 1987 $0 $142 -$142 1988 $0 $142 -$142 1989 $0 $142 -$142 1990 $0 $142 -$142 1991 $0 $142 -$142 1992 $0 $142 -$142 1993 $0 $142 -$142 1994 $0 $142 -$142 1995 $0 $142 -$142 1996 $0 $142 -$142 1997 $0 $142 -$142 1998 $0 $142 -$142 1999 $41 $142 -$101 2000 -$123 $142 -$265 2001 $1 $150 -$149 2002 $165 $150 $15 2003 $291 $150 $141 2004 $472 $120 $352 2005 $1,540 $130 $1,410 2006 $1,666 $150 $1,516 2007 $1,811 $142 $1,669 2008 $1,955 $142 $1,813
Undiscounted Total $7,820 $4,684 $3,136 PVa at 7% $1,013 $1,938 -$925 PVa at 3% $3,199 $3,037 $162
a PV base year is 1976.

Retrospective Benefit-Cost Evaluation of U.S. DOE Geothermal Technologies R&D Program Investments: Impacts of a Cluster of Energy Technologies
8-16
Table 8-11 summarizes the results of the benefit-cost analysis. In addition to net benefits with PV of $925 million discounted at 7%, the ratio of DOE-attributed benefits to total program expenditures was calculated (referred to as the BCR). The BCR (discounted at 7%) equaled 0.5 (1.1 discounted at 3%). The BCR deceases at higher discount rates, reflecting the timing of expenditures and benefits.
Table 8-11. Benefit-Cost Analysis Results
Net Benefits
(thousands $2008) Benefit-Cost Ratio (thousands $2008)
Internal Rate of Return
PVa at 7% -$925 0.5 NA PVa at 3% $162 1.1 a PV base year is 1976.
IRR serves as a measure of an investment’s return by comparing initial investments with discounted cash flows. The IRR for the cement program is undefined because the net benefits are negative. These results suggest a negative return on DOE’s investment, in part because the technology is still in its infancy. Allowing more time for industry to adopt the existing CaP cement technology in geothermal wells would significantly increase the total economic benefits realized and alter the results of this analysis. Depending on the rate of adoption, economic benefits may potentially exceed the total development costs, yielding a positive return on DOE’s investment in the near term.

9-1
9. KNOWLEDGE BENEFITS1 9.1 Introduction This chapter presents an overview of knowledge output creation and dissemination from R&D supported by DOE’s GTP. It also points out specific ties uncovered between the knowledge base and the technologies treated in the detailed benefit-cost analysis presented elsewhere in this report. It is derived from a larger source report (also by Ruegg and Thomas [2010]) that employed bibliometrics, document and database review, and interview in a historical tracing framework to explore linkages between GTP’s knowledge outputs from 1976 through 2008, and downstream developments in geothermal power production. Knowledge outputs resulting from the GTP include patents, papers, presentations, models and codes, resource maps, prototypes, technology demonstrations, test data, research tools, and trained and experienced people. Patents and publications are featured in this brief treatment. Patent and publication citation analyses offer the advantages of providing objectively derived measures to trace knowledge dissemination from government research to other organizations and to innovations close to market. Appendix E provides background on the methodology and construction of data sets used in the analysis; the focus here is on findings. Principal conclusions, in summary, are that the knowledge base resulting from GTP’s expenditures has provided a foundation for further innovation in the geothermal energy industry and also in the gas and oil industries. Multiple technologies important to recent advances in producing power from geothermal resources and in increasing efficiency in gas and oil extraction trace back strongly to GTP-funded research. Specific findings in support of these conclusions include the following:
• From 1976 through 2008, DOE funded a number of organizations to develop a variety of
geothermal technologies, resulting in knowledge captured in approximately 90 DOE-attributed patents families (i.e., groups of patents based on the same invention) and more than 3,000 publications, in addition to the resulting prototypes and process advances.
• Of a total population of more than 1,000 geothermal patent families assigned to numerous organizations, 21% were found linked to earlier DOE-attributed geothermal patents and publications. This percentage is second only to that of Chevron, which is billed as the world’s largest producer of geothermal energy. Furthermore, greater than 40% of Chevron’s own patents were found to have built extensively on earlier DOE-attributed geothermal patents and papers. Among the notable DOE-attributed patent families and publications are those describing Organic Rankine and Kalina thermodynamic cycles, the generation of geothermal energy from hot dry rocks, techniques for treating geothermal brine, advanced drill bits, downhole electronics and data
1 This Chapter, prepared by Rosalie Ruegg, TIA Consulting, Inc., and Patrick Thomas, 1790 Analytics, LLC, is based on a larger
impact evaluation report coauthored by Ruegg and Thomas, entitled Linkages from DOE’s Geothermal Program R&D to Commercial Power Generation. (Ruegg and Thomas, 2010). For more details about the approach and findings, consult Appendix E and the larger source report by Ruegg and Thomas.

Retrospective Benefit-Cost Evaluation of U.S. DOE Geothermal Technologies R&D Program Investments: Impacts of a Cluster of Energy Technologies
9-2
transmission, improved cements to withstand conditions in wells, and other innovations describing geothermal power plants and power generation.
• In addition to the knowledge base captured in patents, papers, and other tacit forms, DOE-funding of geothermal research has trained many technologists and researchers.
9.2 Trends in Geothermal Patents Attributed to DOE and to Others The study identified 90 geothermal patent families attributable to DOE-funded geothermal R&D. These 90 patent families are constructed from a total of 115 U.S. patents, 16 European Patent Office (EPO) patents, and 17 World Intellectual Property (WIPO) patents. Grouping all the patents that result from the same original patent application into a family avoids multiple counting of what is essentially the same invention. Figure 9-1 shows the trend of geothermal patenting attributable to DOE in comparison with the wider trend in geothermal patenting from 1978 through 2007, in 5-year increments. To provide the wider trend, the study conducted a patent search that identified a total of 1,016 patent families describing geothermal technologies (made up of a total of 871 U.S. patents, 180 EPO patents, and 234 WIPO patents). The figure reveals that DOE-attributed patent filings in geothermal technology peaked between 1978 and 1982, and fell to a low between 2003 and 2007. The figure also shows that DOE-attributed patents in geothermal comprised a relatively modest share of total geothermal patenting. Yet, this small share has provided a foundation for a large number of further advancements.

Chapter 9 — Knowledge Benefits
9-3
Figure 9-1. Comparison of DOE-Attributed Geothermal Patent Families with Those Attributed to Others, Grouped in 5-Year Intervals by Priority-Year, 1978–2007
9.3 The DOE-Attributed Knowledge Base in Patents Has Provided a Foundation for
Subsequent Innovation in Geothermal Technology To determine the extent to which the 90 DOE-attributed patents have provided a foundation for further innovation in geothermal technologies, the study analyzed and compared linkages of all of 1,016 geothermal patent families back to earlier geothermal patent families attributed to DOE and to earlier geothermal patent families attributed to other organizations. Figure 9-2 lists in declining order the organizations whose earlier geothermal patents were linked to the largest number of the 1,016 total geothermal patents that came later. At the head of the figure are Chevron and DOE, with 24.9% of the 1,016 geothermal patent families linked through patent citations to Chevron’s earlier geothermal patents, and 20.6% linked to earlier DOE-attributed geothermal patent families. The results in Figure 9-2 indicate the comparative importance of the patent families attributed to DOE and those assigned to Chevron in the subsequent development of geothermal technology.

Retrospective Benefit-Cost Evaluation of U.S. DOE Geothermal Technologies R&D Program Investments: Impacts of a Cluster of Energy Technologies
9-4
Figure 9-2. Organizations Whose Earlier Geothermal Patent Families are Linked to the Largest Number of Later Geothermal Patent Families
Chevron’s position is not surprising given that it currently claims to be largest producer of geothermal energy in the world. Much of Chevron’s technology in geothermal appears to result from its 2005 merger with Union Oil Company of California (Unocal). Of the 83 Chevron geothermal energy patent families, 80 were originally assigned to Unocal. These Unocal patent families describe a wide variety of technologies related to geothermal energy, including drilling techniques, well casings, and methods for processing geothermal brine and steam. To better appreciate the influence of the DOE-attributed geothermal patent set, it should also be noted that Chevron’s portfolio of geothermal patents has itself built extensively on earlier DOE-attributed geothermal patents and papers. In fact, Chevron, together with Ormat, a leading geothermal energy company, are the two organizations with the largest number (as well as the largest percentages) of their geothermal patents linked back to DOE-attributed geothermal patents. Over half of Ormat’s geothermal patents families, and over 40% of Chevron’s, are linked to earlier DOE-attributed geothermal patent families. Both companies have a series of patent families that build on multiple DOE-attributed patent families. The Chevron patent families that build on the earlier DOE set are focused mainly on methods for treating geothermal brine in order to modify its pH and to control salt precipitation and scale deposition. Ormat’s patent families that build on the earlier DOE set describe geothermal power plants and the use of geothermal energy to produce an uninterruptible power supply. These different technologies suggest that the influence of DOE geothermal R&D has been relatively broad.

Chapter 9 — Knowledge Benefits
9-5
9.4 DOE-Attributed Geothermal Patent Families Have Influenced Developments Beyond Geothermal, Particularly in the Oil and Gas Industries
The results of tracing forward from the DOE-attributed 90 geothermal patent families to all future patent families as classified by the International Patent Classifications (IPC) show a prominence of linkages of the DOE-attributed patents to later patents in the “Earth & Rock Drilling” IPC class. The second most linkages occur in the IPC category “Geophysics,” which includes seismic testing and exploration. Other IPC areas linked to DOE-funded geothermal research are water and sewage treatment, cements, sprayers and nozzles, and remediation. Organizations with the largest number of their patents (in all topic areas – not just geothermal) linked through patent citations to earlier DOE-attributed geothermal energy patents are listed in Figure 9-3. The main point to note is the dominance of oilfield services corporations when the industry field is broadened. The three largest of these companies – Halliburton, Schlumberger, and Baker Hughes – have the most patents linked back to the DOE-attributed geothermal energy patents. Figure 9-3. Organizations with the Largest Number of Patent Families in All Topic Areas
Linked to Earlier DOE-Attributed Geothermal Energy Patent Families
Patent families describing lightweight cements for use in wells, including geothermal wells, stem from research by a DOE research team headed by Toshifumi Sugama at Brookhaven National Laboratory, and the related cement technology is featured in the benefit-cost analysis (see Chapter 8). These patent families are linked extensively to subsequent Halliburton patent families describing elements of its

Retrospective Benefit-Cost Evaluation of U.S. DOE Geothermal Technologies R&D Program Investments: Impacts of a Cluster of Energy Technologies
9-6
ThermaLock cements. These cements are designed for use in wells operating in harsh environmental conditions, such as geothermal wells and subsea oil and gas wells. All three leading oilfield services companies also have extensive patent portfolios related to drilling techniques and downhole data transmission, and these patent portfolios have large numbers of links to earlier geothermal patent families attributed to DOE in these same areas. 9.5 Individual DOE-Attributed Geothermal Patents with Strong Influence
Some of the DOE-attributed geothermal patents stand out as being particularly notable – some because they are cited by a large number of subsequent geothermal patent families, some because they are highly cited by patents in fields outside the geothermal industry, and others because they are linked to high-impact patents assigned to others.
Table 9-1 shows the DOE-attributed geothermal energy patents linked to the largest number of later geothermal energy patents, implying that these DOE-attributed patents have had a particularly extensive influence on subsequent research in geothermal energy. Table 9-1. DOE-Attributed Geothermal Patent Families Linked to Largest Number of Later
Geothermal Patent Families
Anchor Patent
Issue Date
# Linked Patent
Families Assignee Title
3640336 1972 58 DOE Recovery of geothermal energy by means of underground nuclear detonations
3786858 1974 42 DOE Method of extracting heat from dry geothermal reservoirs
4489563 1984 32 Exergy Inc. Generation of energy 4196183 1980 24 DOE Process for purifying geothermal steam
4328106 1982 21 DOE Method for inhibiting silica precipitation and scaling in geothermal flow systems
4342197 1982 12 Unisys Corp. Geothermal pump downhole energy regeneration system
3938334 1976 10 Unisys Corp. Geothermal energy control system and method
5685362 1997 10 University of
California Storage capacity in hot dry rock reservoirs
4380903 1983 8 Unisys Corp. Enthalpy restoration in geothermal energy processing system
4358930 1982 8 DOE Method of optimizing performance of Rankine cycle power plants
4167099 1979 6 Occidental Petroleum
Countercurrent direct contact heat exchange process and system
4556109 1985 5 Dow Chemical Co. Process for cementing geothermal wells
6251179 2001 5 DOE Thermally conductive cementitious grout for geothermal heat pump systems
4078904 1978 5 DOE Process for forming hydrogen and other fuels utilizing magma

Chapter 9 — Knowledge Benefits
9-7
Most of the patents in this figure are relatively old and have long since expired. For example, the two at the head of Table 9-1 – U.S. #3,640,336 and U.S. #3,786,858 – both date from the first half of the 1970s. These patents describe methods for generating geothermal energy from unpromising sites; the former via underground detonations, and the latter through injection of fluid into dry reservoirs. These patents are linked to many later patents describing methods for generating geothermal energy from unpromising locations. One such linked patent that is also listed in Table 9-1 is U.S. #5,685,362. This patent was issued in 1997 and describes methods for generating geothermal energy from hot dry rocks. These are geological strata that exist at high temperatures but do not act like geysers or hot springs because no ground water percolates into them. Geothermal energy is extracted from hot dry rocks by pumping liquid into a well drilled into them, where the liquid is then heated by the rocks. The ‘362 patent describes such a system and is linked to numerous subsequent geothermal patent families, including families assigned to Ormat. Another patent in Table 9-1 of particular interest is U.S. #4,489,563. This 1984 patent describes the basic elements of the Kalina thermodynamic cycle for power generation, which is named after Alexander Kalina, the inventor of this patent, whose research was funded by DOE. The Kalina cycle is often used in heat exchangers in geothermal power plants. The ‘563 patent is linked to 32 subsequent geothermal patents (in addition to 81 other patents). The later patents describe the use of Kalina cycles for low temperature geothermal systems. It is also relevant to examine highly cited patent families of other organizations that are linked back to earlier DOE-attributed geothermal patent families. Among the highly cited geothermal patent assigned to geothermal companies and connected back to the earlier DOE set, a focus was found on the treatment of geothermal brine and the reduction of contaminants in geothermal fluids. Looking more broadly at all industries, the most highly cited patents that link back to earlier DOE-attributed geothermal patent families include Halliburton patents describing lightweight well cements. These patents link back to research at DOE’s Brookhaven National Laboratory headed by Sugama, as mentioned earlier. Others include patents describing power and data transmission in downhole applications assigned to Novatek Engineering and National Oilwell Varco (whose patents were originally assigned to Intelliserv, which was acquired in turn by Grant Prideco and by National Oilwell Varco). 9.6 Trends in Geothermal Publications Attributed to DOE and to Others Figure 9-4 shows the total output of DOE publications in geothermal by year, in comparison with “all” geothermal publications, including DOE publications and those of other organizations. The number of publications from all sources (totaling 18,858) dwarfs the number from DOE (totaling 3,038).

Retrospective Benefit-Cost Evaluation of U.S. DOE Geothermal Technologies R&D Program Investments: Impacts of a Cluster of Energy Technologies
9-8
Figure 9-4. DOE Geothermal Publications Compared with All Geothermal Publications, 1965–2009
Source: DOE Office of Scientific & Technical Information (OSTI), geothermal publication database.
Furthermore, during the 65 years prior to the period shown in the figure there had been at least another 500 to 600 papers in geothermal produced by others. Figure 9-4 also shows that the output of geothermal publications from all sources peaked in the early 1980s, while the number attributed to DOE did not peak until the early 1990s. Furthermore, the share of the total comprised by DOE increased over time from 4% of the total in 1981, to 93% of the total by 2005. DOE’s funding of geothermal research produced knowledge during a time when other sources appear to have diminished. Evidence presented below suggests that DOE’s knowledge base in publications has also supported the development of new enabling advancements in geothermal and other industries. 9.7 Characterization of DOE-Funded Geothermal Publications by Research Organization
and by Type Stanford University’s Geothermal Program, which receives funding from DOE through Lawrence Berkeley National Laboratory, led in the number of identified DOE-funded geothermal publications, followed by Idaho National Laboratory, one of several key laboratories carrying out DOE’s Geothermal Program, and then by NREL. Technical reports (50%) and conference papers (44%) were the principal modes of these publications. The rest were journal articles, books, thesis/dissertations, and miscellaneous. This distribution differs
Num
ber o
f Pub
licat
ions
DOE-sponsored All

Chapter 9 — Knowledge Benefits
9-9
from the body of non-DOE sponsored geothermal publications, which had a larger proportion of journal articles and books, and a smaller proportion of technical reports and conference papers. 9.8 Authorship and Citing of Samples of DOE-Funded Geothermal Publications For each set of publications from the three leading producers of DOE-funded geothermal publications –Stanford, INL, and NREL – authorship and citations were analyzed. For the larger populations of Stanford and INL publications, the analyses were based on random samples. For the smaller population of NREL publications, the analysis was based on the whole population of geothermal publications found in the OSTI database.2
9.8.1 Stanford Geothermal Publications Funded by DOE The distribution of the sample of Stanford papers by topic showed a clear topical focus, with approximately 50% on reservoirs or wells and 35% on exploration. Most of the publications were conference papers. A strong international component was found in the authoring of these Stanford publications, which may have helped connect U.S. geothermal researchers to knowledge developments in other parts of the world and may also signal global interest in Stanford’s research. Most of the authors of the conference papers were affiliated with companies, foreign universities, and institutes and ministries of foreign governments. Other authors were from domestic universities, and U.S. federal, state, and regional government organizations. About half the sample of Stanford publications had received one to five citations, and several had received more. Those citing the publications were heavily affiliated with universities, foreign government organizations, and companies, including Calpine Corporation and Unocal Geothermal, as well as major petroleum companies. 9.8.2 INL Geothermal Publications Most of the INL publications were technical reports. The major topical focus was reservoirs or wells (34%), followed by exploration (26%), and plant and drilling (8% and 7%, respectively). Other publications pertained to “economic/efficiency and financial studies” (5%) and “information about geothermal “(4%), while 16% were categorized as “other.” Most of these publications are authored by universities (52%) and companies (13%) under contract with INL. Other organizations, such as other federal, state, and regional government organizations and associations authored 11%. The participation of many universities across the nation suggests that INL funding of university geothermal research is building expertise in this field across the nation. The presence of companies suggests a commercial interest in sponsored INL research. The presence of state and regional bodies provides an element typically involved in large geothermal projects for power generation, and the participation of associations 2 Of 678 publications identified as Stanford University geothermal publications, a random sample of 62 was drawn, sufficient for
a confidence level of 90% with an interval of +/- 10. Of 287 papers identified as INL geothermal publications, a random sample of 162 was drawn, sufficient for a confidence level of 95% and an interval of +/- 5. Of 58 publications identified as NREL geothermal publications, one duplicate was eliminated, and the entire population of 57 was used in the analyses.

Retrospective Benefit-Cost Evaluation of U.S. DOE Geothermal Technologies R&D Program Investments: Impacts of a Cluster of Energy Technologies
9-10
is an indicator of connections of INL into key dissemination paths. Although a small percentage of these publications had received multiple citations, citing of most of the publications was not strong. 9.8.3 NREL Geothermal Publications Brochures and booklets comprised the largest share (42%) of NREL publications, followed by technical reports (33%) and conference publications (25%). Reflective of a different role for NREL than Stanford or INL, the predominant topic was informational (61%), followed by economic, efficiency, and financial studies (18%). However, there were also publications in the major technical categories of plant (7%), reservoirs or wells (7%), drilling (2%), and exploration (2%). Almost all the NREL geothermal publications are authored in house by one or more NREL authors, indicating that collaboration with other organizations on these reports was not a major mode of knowledge dissemination. A few of these reports were highly cited, but many had not been cited yet. Most active among those citing the NREL geothermal publications were researchers in universities. The other affiliations of those citing included companies, research institutes, interest groups, and other DOE laboratories, namely BNL, INL, and ORNL. 9.9 DOE Geothermal Publications Cited by Geothermal Patents The previous patent analysis found that at least 45 DOE geothermal publications were cited by geothermal patents. A dozen of these publications were cited heavily – between 30 and 200 times by patents. This finding signals the importance of these publications to technology development and indicates that DOE publications can also provide a major, direct route of knowledge dissemination to downstream innovators. This is not surprising given that DOE laboratory researchers typically publish in the open literature the results of their in-house R&D and do not always patent the results. The most prominent of the DOE geothermal publications cited by patents are those based on BNL’s research in lightweight cement, a featured technology in the benefit-cost analysis. These publications were authored by the Brookhaven group headed by Toshifumi Sugama, identified earlier. A second area of technology for which later company patents heavily cite earlier DOE geothermal publications concerns data for the performance of PDC drill bits – another technology featured in the benefit-cost analysis. DOE researchers at SNL carried out extensive field tests of PDC drill bit performance and potential application. These publications are linked through citations to large numbers of drilling patents assigned to leading oilfield services companies, notably Halliburton, Schlumberger, Baker Hughes, and Smith International.
Other technologies for which later company patents extensively cite earlier DOE geothermal publications include data communications through drill strings and direct-contact condensers for use in geothermal power plants. The first pertains to publication of the results of SNL’s research on the acoustical properties of drill strings and propagation of sound waves in drill string. These publications were heavily cited by

Chapter 9 — Knowledge Benefits
9-11
subsequent company patents on innovations to increase knowledge of conditions within the drill hole. The second pertains to NREL’s publishing of the results of its research on direct-contact condensers which were heavily cited by subsequent company patents on innovations relating to the handling of geothermal fluids in power plants. 9.10 Other Knowledge Outputs Some important types of DOE knowledge outputs are not well captured by patent and publication analyses. This section provides a brief overview of additional categories of DOE geothermal knowledge outputs. 9.10.1 Computer Models/Codes, Maps of Geothermal Resources, and Test Data The DOE web site provides links to DOE-supported software programs for modeling geothermal systems and economics, as well as to geothermal resource maps, and databases. Most of these resources can be freely downloaded.3 In some cases the software must be licensed, but the fees are generally modest. DOE-supported models in geothermal include the TOUGH series of reservoir models. These are used to study fluid processes in geothermal reservoirs, project reservoir capacity, and aid in the planning and management of reservoirs as part of larger systems. Related workshops and symposia held by LBNL have helped disseminate the models and train researchers in their use. (Publications have also helped explain and disseminate the code and are reflected in the publication analysis presented previously.) The TOUGH series of reservoir models is one of the technologies selected for detailed benefit-cost analysis elsewhere in this report, where its use in geothermal projects worldwide, as well as for nuclear storage and CO2 sequestration, is noted. INL and others have produced geothermal maps that show subterranean temperatures to provide information about the location and nature of geothermal resources. Again, these maps are freely available, and their creation and dissemination are not adequately captured by the patent and publication analyses. 9.10.2 Human Capital Trained students and experienced researchers who embody knowledge (human capital) provide another major knowledge benefit not adequately captured by bibliometric analysis. As indicated earlier, universities across the nation have been funded by DOE’s GTO. Some of these universities are funded to carry out specific geothermal research projects, such as the New Mexico Technical University, Northern Arizona University, Duke University, Pennsylvania State University, University of North Carolina, University of Utah, and University of California. Beyond this, several other university earth science groups are funded more extensively and some on an ongoing basis. These DOE-supported/university-based geothermal centers include the Energy and Geosciences Institute at the University of Utah; the
3 Resources can be found at the following website: www1.eere.energy.gov/geothermal/software_data.html.

Retrospective Benefit-Cost Evaluation of U.S. DOE Geothermal Technologies R&D Program Investments: Impacts of a Cluster of Energy Technologies
9-12
Great Basin Center for Geothermal Energy at the University of Nevada, Reno; the Department of Earth Sciences at Southern Methodist University; the Geo-Heat Center at the Oregon Institute of Technology; and Stanford University’s Geothermal Program. Recently, DOE committed funding support to Boise State University over 5 years to lead a consortium of academic institutions and government agencies to establish a National Geothermal Data System (NGDS). Trained geothermal technologists are a result of this funding, in addition to other outputs. The Program also has funded state agencies as way to foster expertise in geothermal energy among those who often play a role in developing geothermal resources within a state. State agencies receiving DOE geothermal funding are primarily located in the West and include agencies in California, Nevada, New Mexico, Utah, Washington, Wyoming, Alaska, Idaho, and Oregon. The building of a network among geothermal researchers and their organizations also serves to enhance knowledge creation and dissemination. This network, depicted by Figure 9-5, fosters both knowledge creation and flow. A core element of the network is the many partnerships formed by the DOE Geothermal Program over its history. These partnerships link DOE directly to companies that develop new technologies and are positioned to apply the resulting innovations commercially to generate power from geothermal energy. More than 60 companies have entered into cost-sharing partnerships in geothermal research with DOE. Among them are those working principally in geothermal, others known mainly as oil and gas companies, electric power companies, engineering and consulting companies, among others. Participating universities are another core element, as are state and regional offices, associations, other federal agencies, and counterpart organizations abroad.

Chapter 9 — Knowledge Benefits
9-13
Figure 9-5. A Network of Organizations Facilitates Geothermal Energy Knowledge Creation and Dissemination

Retrospective Benefit-Cost Evaluation of U.S. DOE Geothermal Technologies R&D Program Investments: Impacts of a Cluster of Energy Technologies
9-14

R-1
REFERENCES Aaheim, H., & Bundschuh, J. (2002). The value of geothermal energy for developing countries. In D. Chandrasekharam and J. Bundschuh, (Eds.), Geothermal energy resources for developing countries (pp. 37–52). Lisse, The Netherlands: A.A. Balkema (Swets and Zeitlinger). Augustine, C., Tester, J., Anderson, A., Petty, S., & Livesay, B. (2006). A comparison of geothermal with oil and gas well drilling costs. (Paper SGP-TR-179). Presented at the 2006 Thirty-First Workshop on Geothermal Reservoir Engineering, Stanford University Stanford, CA, January 30 to February 1, 2006. Bensted, J. (1998). Special cements. In P.C. Hewlett (ed.) Lea’s chemistry of cement and concrete (4th Edition). Burlington, MA: Butterworth Heinemann.
Berard, B., Hernandez, R., & Nguyen H. (2009). Foamed calcium aluminate phosphate cement enables drilling and cementation of California geothermal wells. (SPE 120845) Presented at the 2009 SPE Western Regional Meeting in San Jose, CA, March 24 to 25, 2009.
Blankenship, D., Sandia National Laboratory (2009). Personal communication between Michael Gallaher and Alex Rogozhin, RTI International. Boudreaux, R., & Massey, K. (1994, March). Turbodrills and innovative PDC bits economically drilled hard formations. Oil and Gas Journal, 92 (13), 52–5.
Bour, D., AltaRock Energy, Inc. (2009, September 18). Personal communication with Jeffrey Petrusa, RTI International.
Bronicki, L. (2002). Geothermal power stations. In R.A. Meyers (Series Ed.) Encyclopedia of physical science and technology (Vol. 6.,3rd ed., pp. 709–18). Academic Press (Elsevier). Brothers, L. (2006, December 1). CPC resists acid corrosion. E&P Magazine. Available at http://www.epmag.com/archives/techWatch/153.htm. Brothers, L., Halliburton. (2009, August 31). Personal communication with Jeffrey Petrusa, RTI International. Brugman, J., Hattar, M., Nichols, K., & Esaki, Y. (1994, December). Next generation power plants. (EPRI Report 3657-01). Palo Alto, CA: Electric Power Research Institute (EPRI). Casto, R. (1995, November). Use of bicenter PDC bit reduces drilling cost. Oil and Gas Journal, 93 (46), 92–6. DiPippo, R. (2008). Geothermal power plants: Principles, applications, case studies and environmental impact. Burlington, MA: Butterworth-Heinemann. EERE/GEO (Energy Efficiency and Renewable Energy/Geothermal Technologies Program). (2008). A history of geothermal energy research and development in the United States: Drilling 1976–2006. Washington, DC: U.S. Department of Energy. EERE/GTP (Energy Efficiency and Renewable Energy/Geothermal Technologies Program). (2010). A history of geothermal energy in the united states. Available at http://www1.eere.energy.gov/geothermal/history.html.

Retrospective Benefit-Cost Evaluation of U.S. DOE Geothermal Technologies R&D Program Investments: Impacts of a Cluster of Energy Technologies
R-2
EERE/GTP (Energy Efficiency and Renewable Energy/Geothermal Technologies Program). (2008a, December 31). A history of geothermal energy research and development: Drilling 1976 to 2006. Final Lab Draft. Washington DC: U.S. Department of Energy. EERE/GTP (Energy Efficiency and Renewable Energy/Geothermal Technologies Program). (2008b, December 31). A history of geothermal energy research and development: Exploration 1976 to 2006. Final Lab Draft. Washington DC: U.S. Department of Energy. EERE/GTP (Energy Efficiency and Renewable Energy/Geothermal Technologies Program). (2008c, December 31). A history of geothermal energy research and development: Reservoir engineering 1976 to 2006. Final Lab Draft. Washington DC: U.S. Department of Energy. EERE/GTP (Energy Efficiency and Renewable Energy/Geothermal Technologies Program). (2008d, December 31). A history of geothermal energy research and development: Energy conversion 1976 to 2006. Final Lab Draft. Washington DC: U.S. Department of Energy. Falcone, S., & Bjornstad, D. (2005, December). Leveraging defense research: Social impact of the transfer of polycrystalline diamond drill bit research. Comparative Technology Transfer and Society, 3, 267–300. doi: 10.1353/ctt.2006.0004. Finger, J., & Glowka, D. (1989). PDC bit research at Sandia National Laboratories. Sandia Corporation. Washington, DC: Department of Energy. Available at http://www.osti.gov/geothermal/servlets/purl/6107005-GL9XS0/6107005.pdf.
Freedonia Group. (2009). Drilling products and services to 2012. Drill bit and realer demand by product: Fixed cutter drill bits. Cleveland, OH: The Freedonia Group, Inc. Available at http://www.freedoniagroup.com/FractionalDetails.aspx?DocumentId=405397.
Gani, R. (1982, November 29). Diamond shear bits pass test in Indonesia’s Arun gas field. Oil and Gas Journal.
GEA (Geothermal Energy Association). (2009a). Listing of U.S. geothermal power plants. Available at http://www.geo-energy.org/information/plants.asp.
GEA (Geothermal Energy Association). (2009b). Geothermal basics: Notes and references. Washington, DC: Geothermal Energy Association. Available at http://www.geo-energy.org/aboutGE/notes.asp.
Glitnir (Glitnir Geothermal Research). (2008). United States geothermal energy market report. Iceland: Reykjavik. Glowka, D., & Schafer, D. (1993, September). Program plan for the development of advanced synthetic-diamond drill bits for hard-rock drilling. Washington, DC: Department of Energy. doi: 10.2172/10104670. Glowka, D., Dennis, T., Le, P., Cohen, J., & Chow, J. (1995). Progress in the advanced synthetic-diamond drill bit program. Washington, DC: Department of Energy. Available at http://www.osti.gov/bridge/servlets/purl/127986-TvmMq5/webviewable/127986.pdf.
Griliches, Z. (1958). Research costs and social returns: Hybrid corn and related innovations. Journal of Political Economy, 66.

Chapter 10 — References
R-3
Hernandez, R., Halliburton. (2009, October 13). Personal communication with Jeffrey Petrusa, RTI International. Internal Revenue Service (IRS). (2008). Statistics of income. Corporation source book. Washington, DC: Internal Revenue Service. Available at www.irs.gov/pub/irs-soi/04sb1mn213110.xls. Jones, P. (1988). Oil: A practical guide to the economics of world petroleum. Cambridge, UK: Woodhead-Faulkner. LBNL (Lawrence Berkeley National Laboratory). (2009). TOUGH workshops and symposia. Berkeley, CA: LBNL. Available at http://www-esd.lbl.gov/TOUGH2/ TOUGHWORKSHOPS.html. Leslie, N. P., Zimron, O., Sweetser, R. S., & Stovall, T. K. (2009). Recovered energy generation using an organic Rankine cycle system. ASHRAE Transactions, 115 (1), 220. Long, A. (2008). Improving the economics of geothermal development through an oil and gas industry approach. Houston, TX: Schlumberger Consulting. Available at http://www.slb.com/media/services/consulting//thermal_dev.pdf. Madigan, J., & Caldwell, R. (1981). Application for polycrystalline diamond compact bits form analysis of carbide insert and steel tooth bit performance. Journal of Petroleum Technology, 33, 1171–9. Mansfield, E., Rapoport, J., Romeo, A., Wagner, S., & Beardsley, G. (1977). Social and private rates of return from industrial innovations. Quarterly Journal of Economics, 91, 221–40. Masters, G. M. (2004). Renewable and efficient electric power systems. Hoboken, NJ: Wiley and Sons. McDonald, S., & Felderhoff, F. (1996, March). New bits, motors improve economics of slim hole horizontal wells. Oil and Gas Journal, 94 (11). Mensa-Wilmot, G. (1997, October). New PDC cutters improve drilling efficiency. Oil and Gas Journal, 95 (43), 64–70. Mensa-Wilmot, G. (2003, September 9). PDC drill bit having cutting structure adapted to improve high speed drilling performance. U.S. Patent No. 6,615,934. Washington, DC: U.S. Patent and Trademark Office. O’Sullivan, M., Pruess, K., & Lippmann, M. (2001). State of the art of geothermal reservoir simulation. Geothermics, 30, 395–429. O’Sullivan, M. J. (1980, December). The DOE code comparison study: Summary of results for problem 4-expanding two-phase system with drainage. U.S. DOE Contract W-7405-ENG-48. Berkeley, CA: LBNL. Oldenburg, C., Kneafsey, T., & Rutqvist, J. (2007). Foreword to the special issue containing research results generated using the TOUGH codes. Energy Conversion and Management, 48, 1759. Papadakis, M., & Link, A. (1997). Measuring the unmeasurable: Cost-benefit analysis for new business start-ups and scientific research transfers. Evaluation and Program Planning, 20 (1), 99–102.
Retrospective Benefit-Cost Evaluation of U.S. DOE Geothermal Technologies R&D Program Investments: Impacts of a Cluster of Energy Technologies
R-4
Pruess, K. (1990). Proceedings of the TOUGH workshop. Workshop held in Berkeley, CA, September 13–14, 1990. Berkeley, CA: LBNL. Available at http://adsabs.harvard.edu//abs/1990beca.work...13P. Pruess, K. (1995, March). Proceedings of the TOUGH workshop. Lawrence Berkeley Laboratory Report LBL-37200. Berkeley, CA: LBNL. Available at http://www-esd.lbl.gov/TOUGH2//T95.doc.html. Pruess, K. (1998). Proceedings of the TOUGH workshop ‘98. Lawrence Berkeley Laboratory Report LBL-41995. Berkeley, CA: LBNL. Pruess, K. (2004). The TOUGH codes—A family of simulation tools for multiphase flow and transport processes in permeable media. Vadose Zone J., 3, 738–46. Pruess, K. (2009). Personal communication between Karsten Pruess and Mike Gallaherheld September 12–14, 2009. Berkeley, CA: LBNL. Pruess, K. (2009, December). E-mail from Karsten Pruess to Mike Gallaher . Renner, J. (2009). Personal communication. Mike Gallaher and Alex Rogozhin, RTI International. REPP (Renewable Energy Policy Project). (2003). Geothermal energy for electric power: A REPP issue brief. Washington DC: Renewable Energy Policy Project. Available at http://www.repp.org/repp/index.html. Ruegg, R., and Jordan, G. (2009). Guidelines for conducting retrospective benefit-cost studies. (Internal DOE draft report, not yet released). Ruegg, R. & Thomas, P. (2010). Linkages from DOE’s geothermal program R&D to commercial power generation. U.S. Department of Energy, Energy Efficiency and Renewable Energy, publication expected in 2010. Slack, J.B., & Wood, J. (1982, August 24). Stratapax bits prove economical in Austin chalk. Oil and Gas Journal, 79,164–5. Sugama, T. (1993, September 21). Phosphate-bonded calcium aluminate cements. U.S. Patent No. 5,246,496. Sugama, T. (2006). Advanced cements for geothermal wells: Final report. BNL-77901-2007-IR. Upton, NY: Brookhaven National Laboratory. Sugama, T. U.S. Department of Energy. (2009, July 20). Personal communication with Jeffrey Petrusa, RTI International. Sugama, T. (2010, February 22). Based on e-mail from Toshifumi Sugama to RTI on February 22, 2010. Taylor, M. (2007, November). The state of geothermal technology: Part I: subsurface technology. Washington, DC: Geothermal Energy Association. U.S. Bureau of the Census (U.S. Census). (2000). Historical national population estimates: July 1, 1900 to July 1, 1999. Washington DC: U.S. Census Bureau, Population Estimates Program, Population Division. Available at http://www.census.gov/popest/archives/1990s/.txt.

Chapter 10 — References
R-5
U.S. Bureau of the Census (U.S. Census). (2009). Annual estimates of the resident population for the United States, regions, states, and Puerto Rico: April 1, 2000 to July 1, 2008. NST-EST2008-01. Washington DC: U.S. Census Bureau. Available at http://www.census.gov/popest/states/NST-ann-est.html. U.S. DOE (Department of Energy). (1993). Drilling sideways: A review of horizontal well technology and its domestic application. DOE/EIA-TR-0565. Washington, DC: Department of Energy, Energy Information Administration. Available at http://tonto.eia.doe.gov/ftproot/petroleum/tr0565.pdf. U.S. DOE (Department of Energy). (2000a). Diamond cutter drill bits. Washington, DC: Department of Energy, Geothermal Energy Program. Available at http://www.nrel.gov/docs/fy00osti/23692.pdf. U.S. DOE (Department of Energy). (2000b, September). Geothermal technologies. Washington DC: U.S. Department of Energy, Geothermal Energy Program. U.S. DOE (Department of Energy). (2003). Ceramicrete: Chemically bonded ceramic, a technology profile. Chicago, IL: Argonne National Laboratory. Available at: http://www.anl.gov/techtransfer/Available_Technologies/Material_Science/Ceramicrete/.
U.S. DOE (Department of Energy). (2005a). Geothermal today: 2005 Geothermal Technologies Program highlights. DOE/GO-102005-2189. Golden, CO: National Renewable Energy Laboratory. U.S. DOE (Department of Energy). (2005b). Production tax credit for renewable electricity generation. Issues in Focus AEO2005. Washington, DC: U.S. DOE, Energy Information Administration. Available at http://www.eia.doe.gov/oiaf/aeo/otheranalysis/ aeo_2005analysispapers/prcreg.html. U.S. DOE (Department of Energy). (2007). Final report and strategic plan on the feasibility study to asses geothermal potential on Warm Springs Reservation tribal lands. DE-FG36-05GO15177. Washington, DC: U.S. Department of Energy. U.S. DOE (Department of Energy). (2008a). Geothermal Technologies Program, multi-year, development and demonstration plan. Draft. Washington DC: U.S. Department of Energy. U.S. DOE (Department of Energy). (2008b). A history of geothermal energy R&D in the United States: GeoPowering the West. Draft. Washington, DC: U.S. Department of Energy. U.S. DOE (Department of Energy). (2009). Monthly energy review: average retail price of electricity. Available at tonto.eia.doe.gov/merquery/mer_data. asp?table=T09.09. Accessed on November 19, 2009. U.S. DOE (Department of Energy). (2010a). U.S. footage drilled for crude oil developmental wells (thousand feet) . Available at http://tonto.eia.doe.gov/dnav/pet/hist/ e_ertwo_xwfd_nus_mfa.htm. Accessed on February 19, 2010. U.S. DOE (Department of Energy). (2010b). U.S. footage drilled for natural gas exploratory and developmental wells (thousand feet). Available at http://tonto.eia. doe.gov/dnav/pet/hist/LeafHandler.ashx?n=PET&s=EERTWG_XWF0_NUS_MF&f=A. Accessed on February 19, 2010.

Retrospective Benefit-Cost Evaluation of U.S. DOE Geothermal Technologies R&D Program Investments: Impacts of a Cluster of Energy Technologies
R-6
U.S. DOE (Department of Energy). (2010c). Table 4. Estimated carbon dioxide emissions rate from generating units at U.S. electric plants by Census Division, 1998 and 1999 (pounds per kilowatthour). Available at http://www.eia.doe.gov/cneaf/ electricity/page/co2_report/co2report.html#electric. Accessed on February 19, 2010. U.S. DOE (Department of Energy). (2010d). Table 8.2a Electricity net generation:1949–2008. [web page]. Available at http://www.eia.doe.gov/emeu/aer/txt/stb0802a.xls. Accessed on February 19, 2010. Wampler, C., & Myhre, K. (1990). Methodology for selecting PDC bits cuts drilling costs. Oil and Gas Journal, 88 (3), 39–44. Wise, J. L., Roberts, T., Schen, A., Matthews, O., Pritchard, W., Mensa-Wilmot, G., Ernst, R., Radtke, R., Riedel, R., & Hanaway, J. (2004). Hard-rock drilling performance of advanced drag bits. Geothermal Resources Council Transactions, 28.

A-1
APPENDIX A:
GOVERNMENT’S ROLE IN TECHNOLOGY DEVELOPMENT
Underlying the benefits analysis is a conceptual question of what the role of government is in developing and deploying new technologies. The theoretical basis for government’s role in market activity is based on the concept of market failure. Market failure is typically attributed to market power, imperfect information, externalities, and public goods. The explicit application of market failure to justify government’s role in innovation, and in R&D activity in particular, is a relatively recent phenomenon within public policy. Market failure, particularly technological or innovation market failure, results from conditions that prevent organizations from fully realizing or appropriating the benefits created by their investments. This happens when conditions prevent the full appropriation of the benefits by the R&D-investing firm from a marketable technology produced through an R&D process. Typically other firms in the market or in related markets will realize some of the profits from the innovation. The R&D-investing firm will then calculate, because of such conditions, that the marginal benefits it can receive from a unit investment in such R&D will be less than could be earned in the absence of the conditions, reducing the appropriated benefits of R&D below their potential, namely the full social benefits. Thus, the R&D-investing firm might underinvest in R&D, relative to what it would have chosen as its investment in the absence of the conditions. Stated another way, the R&D-investing firm might determine that its private rate of return is less than its private hurdle rate (i.e., the firm’s minimum acceptable rate of return); therefore, it will not undertake socially valuable R&D. A number of non-mutually exclusive factors can explain why a firm will perceive that its expected rate of return will fall below its hurdle rate:
• High technical risk (i.e., the outcomes of its R&D might not be technically sufficient to meet needs) might cause market failure, given that when the firm is successful, the private returns fall short of the social returns.
• High technical risk can relate to high commercial or market risk, as well as to technical risk, when the requisite R&D is highly capital intensive. The investment could require too much capital for a firm—any firm—to feel comfortable with the outlay; thus, the firm will not make the investment, even though it would be better off if it had, and so would society.
• Many R&D projects are characterized by a lengthy time interval until a commercial product reaches the market.

Retrospective Benefit-Cost Evaluation of U.S. DOE Geothermal Technologies R&D Program Investments: Impacts of a Cluster of Energy Technologies
A-2
• It is not uncommon for the scope of potential markets to be broader than the scope of the individual firm’s market strategies, so the firm will not perceive economic benefits from all potential market applications of the technology.
• The evolving nature of markets requires investment in combinations of technologies that, if they existed, would reside in different industries that are not integrated. Due to the fact that such conditions often transcend the R&D strategy of individual firms, such investments are not likely to be pursued.
• A situation can exist when the nature of the technology is such that it is difficult to assign intellectual property rights.
• Industry structure can raise the cost of market entry for applications of the technology.
• Situations can exist where the complexity of a technology makes agreement with respect to product performance between buyers and sellers costly.
These factors, individually or in combination, can create barriers to innovation and thus lead to private underinvestment in R&D because of market failure. As a result, there is frequently a role for government to support the development of technologies that have large spillover benefits or are characterized by high risk and high return.

B-1
APPENDIX B:
INTERVIEWS
As shown in Table B-1, a total of 22 informal interviews were conducted as part of the study. The interviews were structured discussions and no formal interview guide was used. The majority of the interviews were with private-sector industry experts and academics that participated in the research or led the commercialization of the technologies. The interviews were used primarily to identify how technology development and industry practices would have evolved in the absence of DOE’s activities. Table B-1. Interviews by Technology
Technology Number of Interviews DOE Non-DOE
PDC drill bits 1 1 TOUGH Models 2 7 Binary Cycle 2 4 High-temperature cement 2 4 Total 7 15
Industry and academic experts were selected for interviews based on their knowledge of the technology area and their familiarity with the R&D activities conducted by DOE. Initial contacts were provided by DOE. In all instances RTI asked the initial contacts to recommend additional experts who could comment on the subject area and these “networks” were fully explored. In addition, RTI identified and pursued authors of key papers published in the professional literature. The fewest number of interviews were conducted for the PDC drill bit technology. For this technology, there is a well-developed base of literature from which to assess the technology development and DOE’s role. For example, over 10 published studies document the economic benefits of PDC drill bits. In addition, economic impact studies were conducted in the late 1990s that had used an extensive number of interviews to assess and document DOE’s role in the development and commercialization of PDC drill bits. RTI leveraged the information from past studies and past interviews rather than re-contacting the same individuals 10 years later and asking them to recall similar information. Human recollection is a common impediment to conducting retrospective impact studies; hence, earlier studies are likely to have more accurate information regarding DOE’s contributions.


C-1
APPENDIX C:
SUMMARY OF THE CO-BENEFITS RISK ASSESSMENT (COBRA) MODEL1
The Co-Benefits Risk Assessment (COBRA) model provides estimates of health effect impacts and the economic value of these impacts resulting from emission changes. The COBRA model was developed by the U.S. Environmental Protection Agency (EPA) to be used as a screening tool that enables users to obtain a first-order approximation of benefits due to different air pollution mitigation policies. At the core of the COBRA model is a source-receptor (S-R) matrix that translates changes in emissions to changes in particulate matter (PM) concentrations. The changes in ambient PM concentrations are then linked to changes in mortality risk and changes in health incidents that lead to health care costs and/or lost workdays. Figure C-1 provides an overview of the modeling steps. Figure C-1. COBRA Model Overview
Source: EPA (2006) C.1 Changes in Emission Changes in Ambient PM Concentrations The user provides changes (decreases) in emissions of pollutants (PM2.5, SO2, NOx) and identifies the economic sector from which the emissions are being reduced. These changes are in total tons of pollutants by sector for the U.S. economy for the chosen analysis year. The economic sectors chosen determine the underlying spatial distribution of emissions and hence the characteristics of the human population that is affected. 2 For example, emissions reductions due to the use of geothermal technology are typically applied to coal plants in electric utilities. Reductions due to the use of geothermal technology are applied to coal, oil, and natural gas plants in electric utilities. The S-R matrix consists of fixed transfer coefficients that reflect the relationship between annual average PM2.5 concentration values at a single receptor in each county (a hypothetical monitor located at the county centroid) and the contribution by PM2.5 species to this concentration from each emission source. This matrix provides quick but rough estimates of the impact of emission changes on ambient PM2.5 levels as compared to the detailed estimates provided by more sophisticated air quality models (U.S. EPA, 2006).
1 This Appendix was prepared by Michael Gallaher, RTI International. 2 The COBRA model has a variety of spatial capabilities. However, for this study there was limited information on the specific
location of pollution reductions. Thus, a national analysis was conducted where the national distribution of emissions by fuel type, by sector (e.g., special distribution of national coal emissions in the electricity sector) was used to determine the emission location as input to the S-R matrix.

Retrospective Benefit-Cost Evaluation of U.S. DOE Geothermal Technologies R&D Program Investments: Impacts of a Cluster of Energy Technologies
C-2
C.2 Changes in Ambient PM Concentrations Changes in Health Effects The model then translates the changes in ambient PM concentration to changes in incidence of human health effects using a range of health impact functions and estimated baseline incidence rates for each health endpoint. The data used to estimate baseline incidence rates, and the health impact functions used vary across the different health endpoints. To be consistent with prior EPA analyses, the health impact functions and the unit economic value used in COBRA are the same as the ones used for the Regulatory Impact Analysis of the Clean Air Interstate Rule (U.S. EPA, 2005).3
The model provides (in the form of a table or map) changes in the number of cases for each health effect between the baseline emissions scenario (included in the model) and the analysis scenario. The different health endpoints are included in Table C-1. Table C-1. Health Endpoints Included in COBRA
Health Effect Description/Units Mortality Number of deaths Chronic bronchitis Cases of chronic bronchitis Nonfatal heart attacks Number of nonfatal heart attacks Respiratory hospital admissions
Number of cardiopulmonary-, asthma-, or pneumonia-related hospitalizations
Cardiovascular related hospital admissions
Number of cardiovascular-related hospitalizations
Acute bronchitis Cases of acute bronchitis Upper respiratory symptoms
Episodes of upper respiratory symptoms (runny or stuffy nose; wet cough; and burning, aching, or red eyes)
Lower respiratory symptoms
Episodes of lower respiratory symptoms: cough, chest pain, phlegm, or wheeze
Asthma emergency room visits
Number of asthma-related emergency room visits
Minor restricted activity days
Number of minor restricted activity days (days on which activity is reduced but not severely restricted; missing work or being confined to bed is too severe to be MRAD)
Work days lost Number of work days lost due to illness Source: COBRA User Manual
Each health effect is described briefly below. For additional detail on the epidemiological studies, functional forms, and coefficients used in COBRA, see Appendices C of the COBRA user’s manual (U.S. EPA, 2006) and Abt (2009). Mortality researchers have linked both short-term and long-term exposures to ambient levels of air pollution to increased risk of premature mortality. COBRA uses mortality risk estimates from an epidemiological study of the American Cancer Society cohort conducted by Pope et al. (2002). COBRA includes different mortality risk estimates for both adults and infants. Because of the high monetary value
3 For a detailed discussion of studies used for health impact functions and unit values, see U.S. EPA (2005).

C-3
associated with prolonging life, mortality risk reduction is consistently the largest health endpoint valued in the study. Chronic bronchitis is defined as a persistent wet cough and mucus in the lungs for at least 3 months for several consecutive years, and it affects approximate 5% of the population (Abt, 2009). A study by Abbey et al. (1995) found statistically significant relationships between PM2.5 and PM10 and chronic bronchitis. Nonfatal heart attacks were linked by Peters et al. (2001) to PM exposure. Nonfatal heart attacks are modeled separately from hospital admissions because of their lasting impact on long-term health care costs and earning. Hospital admissions include two major categories: respiratory (such as pneumonia and asthma) and cardiovascular (such as heart failure, ischemic heart disease). Using detailed hospital admission and discharge records, Sheppard et al. (1999) investigated asthma hospital emissions associated with PM, carbon monoxide (CO), and ozone, and Moolgavkar (2000 and 2003) and Ito (2003) found a relationship between hospital admissions and PM. COBRA includes separate risk factors for hospital admissions for people aged 18 to 64 and aged 65 and older. Acute bronchitis, defined as coughing, chest discomfort, slight fever, and extreme tiredness lasting for a number of days, was found by Dockery et al. (1996) to be related to sulfates, particulate acidity, and, to a lesser extent, PM. COBRA estimates the episodes of acute bronchitis in children aged 8 to 12 from pollution using the findings from Dockery et al. Upper respiratory symptoms include episodes of upper respiratory symptoms (runny or stuffy nose; wet cough; and burning, aching or red eyes). Pope et al. (2002) found a relationship between PM and the incidence of a range of minor symptoms, including runny or stuffy nose; wet cough, and burning; aching or red eyes. Lower respiratory symptoms in COBRA are based on Schwarz and Neas (2000) and focus primarily on children’s exposure to pollution. Children were selected for the study based on indoor exposure to PM and other pollutants resulting from parental smoking and gas stoves. Episodes of lower respiratory symptoms are coughing, chest pain, phlegm, or wheezing. Asthma related emergency room visits are primarily associated with children under the age of 18. Norris et al. (1999) found significant associations between asthma ER visits and PM and CO. To avoid double counting, hospitalization costs (discussed above) do not include the cost of admission to the emergency room. Minor restricted activity days (MRAD) in COBRA were based on research by Ostro and Rothschild (1989). MRADs include days on which activity is reduced but not severely restricted (e.g., missing work

Retrospective Benefit-Cost Evaluation of U.S. DOE Geothermal Technologies R&D Program Investments: Impacts of a Cluster of Energy Technologies
C-4
or being confined to bed is too severe to be an MRAD). They estimated the incidence of MRADs for a national sample of the adult working population, aged 18 to 65, in metropolitan areas. Due to the fact that this study is based on a “convenience “sample of nonelderly individuals, the impacts may be underestimated because the elderly are likely to be more susceptible to PM-related MRADs). Work loss days were estimated by Ostro (1987) to be related to PM levels. Based on an annual national survey of people aged 18 to 65, Ostro found that 2-week average PM levels were significantly linked to work loss days. Yet, the findings showed some variability across years. C.3 Changes in Health Effects Changes in Monetary Impacts COBRA translates the health effects into changes in monetary impacts using estimated unit values of each health endpoint. The per-unit monetary values are described in Appendix F of the COBRA user’s manual (U.S. EPA, 2006). Estimation of the monetary unit values vary by the type of health effect. For example, reductions in the risk of premature mortality are monetized using value of statistical life (VSL) estimates. Other endpoints such as hospital admissions use cost of illness (COI) units that include the hospital costs and lost wages of the individual but do not capture the social (personal) value of pain and suffering. C.4 Limitations It should be noted that COBRA does not incorporate effects of many pollutants, such as carbon emissions or mercury. This has two potential implications. First, other pollutants may cause or exacerbate health endpoints that are not included in COBRA. This would imply that reducing incidences of such health points are not captured. Second, pollutants other than those included in COBRA may also cause a higher number of incidences of the health effects that are part of the model. This is also not captured in this analysis. Thus, the economic value of health effects obtained from COBRA may be interpreted as a conservative estimate of the health benefits from reducing emissions. C.5 Calculating Environmental Benefits for the TOUGH Series of Reservoir Models and
Binary Cycle Plant Technologies Environmental benefits of the TOUGH series of reservoir models and binary cycle plant technologies are related to the proportion of energy that would have been generated using fossil fuels but was displaced by energy generated by geothermal power plants. Electricity production associated with these two technologies that offset fossil fuels included:
• For binary cycle plants: o efficiency gains (binary compared to flash at mid-level temperatures) o all low temperature binary plant generation
• For the TOUGH series: o all efficiency gains from reservoir modeling

C-5
Emissions reductions in air pollutants that result from using geothermal technologies as compared to the next best technology alternative are calculated. EPA’s Co-Benefits Risk Assessment (COBRA) model was used to calculate the health benefits of these reductions in air pollutants (see also Sections 6.3 and 7.3). The steps to calculate these emission reductions and apply them to COBRA are described below. To calculate the benefits, first, the proportion of each fossil fuel type (coal, petroleum, and natural gas) providing power was reviewed in each state. Four states (California, Nevada, Utah, and Hawaii) account for 99.9% of the geothermal energy produced in the United States with California alone accounting for 87%. Table C-2. Energy Imported by California
Year Generationa (Megawatthours)
Consumptionb (Megawatthours)
Difference: Import (Megawatthours)
1990 165,784,909 211,092,922 45,308,013 1991 158,947,642 208,650,489 49,702,847 1992 177,155,459 213,447,241 36,291,782 1993 186,990,642 210,499,926 23,509,284 1994 186,191,991 213,684,302 27,492,311 1995 181,463,341 212,604,724 31,141,383 1996 175,263,204 218,112,485 42,849,281 1997 172,797,595 227,880,126 55,082,531 1998 189,600,706 236,433,970 46,833,264 1999 188,319,223 234,830,879 46,511,656 2000 208,082,483 244,057,202 35,974,719 2001 198,596,075 247,758,778 49,162,703 2002 184,210,031 235,213,332 51,003,301 2003 192,788,542 243,221,316 50,432,774 2004 194,780,355 252,025,973 57,245,618 2005 200,292,818 254,249,507 53,956,689 2006 216,798,688 262,958,528 46,159,840 2007 210,847,581 264,234,911 53,387,330 2008 207,984,263 268,155,219 60,170,956
a Source: EIA (2009). b Source: EIA (2010).
California imports approximately 20% of the total energy consumed within the state (see Table C-2). In the absence of geothermal power plants, the next alternative for California would be to buy additional electricity from neighboring states. The World Nuclear Association (WNA) estimates that 43.5% of electricity imported by California comes from the Pacific Northwest and 56.5% from the Southwest (WNA, 2009). The Pacific Northwest includes Washington and Oregon, and the Southwest includes New Mexico, Arizona, and Nevada. This study assumed that imports were composed of marginally generated electricity (i.e., electricity generated by burning fossil fuels – coal, natural gas, and petroleum).

Retrospective Benefit-Cost Evaluation of U.S. DOE Geothermal Technologies R&D Program Investments: Impacts of a Cluster of Energy Technologies
C-6
Data on electricity generated per year in each state were added to calculate totals for each region (Pacific Northwest and Southwest). That data were then weighted by the annual amount of electricity imported to California (see Table C-2) and multiplied by the respective share (43.5% for the Pacific Northwest, and 56.5% for the Southwest). Table C-3 presents the outcome of this calculation, as well as the proportion of each fossil fuel type providing power for import to California. These shares are also reported in Table C-4. Table C-4also presents the share of geothermal energy generated by each state and proportion of each fossil fuel type for the other states producing geothermal power. Table C-3. Weighted Average Fossil Fuel Mix of California Imports (MWh)
Zone Natural Gas Coal Petroleum
Pacific Northwest 5,532,650 15,086,344 51,315 Southwest 13,194,925 13,522,802 153,674 Total 18,727,575 28,609,146 204,989 Percentage share 39.4% 60.2% 0.4%
Source: EIA (2009).
Table C-4. Geothermal Energy Generation and the Offset Mix by Fuel Type by State, 2008
State Share of Geothermal
Energy Produced in the U.S.
Natural Gas Coal Petroleum
Californiaa 87% 39.4% 60.2% 0.4% Nevada 11% 44.2% 55.3% 0.5% Utah ~1% 5.1% 94.8% 0.1% Hawaii ~1% — 14.1% 85.9% Weighted average 39.2% 60.0% 1.3%
Source: EIA (2009). a California Fuel Mix represents the mix in energy California reports from other states (calculated in Table C-3). The share of geothermal in each state was applied respectively to generation due to binary cycle plants (offsetting fossil fuels) and the tough series of reservoir models to obtain the statewide generation offsets from each of the two technologies. emissions factors shown in Table C-5 were then applied to the average fossil fuel mix offset to obtain emissions reductions. These are thus the emission reductions for pollutants such as PM, NOx, and SO2 that result from using the geothermal technologies in lieu of the next best technology. These emission reductions were applied to the respective states in the COBRA model. For California, the reductions were applied to the states from the Pacific Northwest and the Southwest. Generation from each of the states was used to determine the share of emissions reductions that were applied to each state.

C-7
Table C-5. Emissions Factors Underlying Health Effects (Avoided Emissions [kg/kWh])
Technology Natural Gas Coal
PM SO2 NOx PM SO2 NOx
Binary Cycle Offsetting fossil fuel plants 0.0001100 0.0014804 0.0000700 0.0051919 0.0021550 0.0011155 Offsetting geothermal flash plants NA NA NA NA NA NA TOUGH Offsetting fossil fuel plants 0.0000578 0.0014801 0.0000700 0.0051396 0.0021547 0.0011155
Technology Petroleum Flash Plants
PM SO2 NOx PM SO2 NOx
Binary Cycle Offsetting fossil fuel plants 0.0003568 0.0011670 0.0000297 NA NA NA Offsetting geothermal flash plants NA NA NA 0.0001750 0 0 TOUGH Offsetting fossil fuel plants 0.0003045 0.0011667 0.0000297 NA NA NA
C.6 References Abbey, D. E., Ostro, B. E., Petersen, F., & Burchette, R. J. (1995). Chronic respiratory symptoms associated with estimated long-term ambient concentrations of fine particulates less than 2.5 microns in aerodynamic diameter (PM2.5) and other air pollutants. Journal of Exposure Analysis and Environmental Epidemiology, 5 (2), 137–159. Abt Associates Inc. (2009, January). Economic impact of Wise County, Virginia coal-fired power plant. Prepared for Wise Energy for Virginia Coalition. Dockery, D. W., Cunningham, J., Damokosh, A. I., Neas, L. M., Spengler, J. D., Koutrakis, P., Ware, J. H., Raizenne, M., & Speizer, F. E. (1996). Health effects of acid aerosols on North American children—Respiratory symptoms. Environmental Health Perspectives, 104 (5), 500–505. EIA (Energy Information Administration). (2009). U.S. Electric Power Industry Net Generation. Electric Power Annual with data for 2007. Released January 20, 2009. Washington, DC: U.S. Department of Energy. EIA (Energy Information Administration). (2010). Retail Sales of Electricity by State by Sector by Provider, 1990-2008. States Historical Tables for 2008. Released January 21, 2010. Washington, DC: U.S. Department of Energy. Ito, K. (2003). Associations of particulate matter components with daily mortality and morbidity in Detroit, Michigan. In: Revised analyses of time-series studies of air pollution and health. Boston, MA: Health Effects Institute.

Retrospective Benefit-Cost Evaluation of U.S. DOE Geothermal Technologies R&D Program Investments: Impacts of a Cluster of Energy Technologies
C-8
Moolgavkar, S. H. (2000). Air pollution and hospital admissions for chronic obstructive pulmonary disease in three metropolitan areas in the United States. Inhalation Toxicology, 12 (Suppl 4), 75–90. Moolgavkar, S. H. (2003). Air pollution and daily deaths and hospital admissions in Los Angeles and Cook Counties. In: Revised analyses of time-series studies of air pollution and health. Boston, MA: Health Effects Institute. Norris, G., YoungPong, S. N., Koenig, J. Q., Larson, T. V., Sheppard, L., & Stout, J. W. (1999). An association between fine particles and asthma emergency department visits for children in Seattle. Environmental Health Perspectives, 107 (6), 489–93. Ostro, B. D. (1987). Air pollution and morbidity revisited: A specification test. Journal of Environmental Economics and Management, 14, 87–98. Ostro, B. D., & Rothschild, S. 1989. Air pollution and acute respiratory morbidity – an observational study of multiple pollutants. Environmental Research, 50(2), 238–247. Peters, A., Dockery, D. W., Muller, J. E., & Mittleman, M. A. (2001). Increased particulate air pollution and the triggering of myocardial infarction. Circulation, 103 (23), 2810–5. http://www.ncbi.nlm.nih.gov/htbinpost/Entrez/query?db=m&form=6&dopt=r&uid=11401937. Pope, C. A., 3rd, Burnett, R. T., Thun, M. J., Calle, E. E., Krewski, D., Ito, K., & Thurston, G. D. (2002). Lung cancer, cardiopulmonary mortality, and long-term exposure to fine particulate air pollution. Journal of the American Medical Association, 287 (9), 1132–41. Schwartz, J., & Neas, L. M. (2000). Fine particles are more strongly associated than coarse particles with acute respiratory health effects in schoolchildren. Epidemiology, 11 (1), 6–10. Sheppard, L., Levy, D., Norris, G., Larson, T. V., & Koenig, J. Q. (1999). Effects of ambient air pollution on nonelderly asthma hospital admissions in Seattle, Washington, 1987–1994. Epidemiology, 10 (1), 23–30. U.S. EPA (Environmental Protection Agency). (2005, March). Regulatory impact analysis for the final Clean Air Interstate Rule. EPA-452/R-05-002. Research Triangle Park, NC: Office of Air Quality Planning and Standards; Emission, Monitoring, and Analysis Division and Clean Air Markets Division. Available at http://www.epa.gov/cair/pdfs/finaltech08.pdf. U.S. EPA (Environmental Protection Agency). (2006, June). User’s manual for the Co-Benefits Risk Assessment (COBRA) screening model. Developed by Abt Associates Inc. World Nuclear Association (WNA). December 2009. California’s Electricity. Available at http://www.world-nuclear.org/info/inf65.html.

D-1
APPENDIX D:
GEOTHERMAL R&D PROGRAM FUNDING TIME SERIES
DOE provided a time series of total GTP expenditures with a breakout of appropriation line items from 1976 to 2008. Total GTP expenditures over this time period are shown in Table 4-4 and the total was $2,601 million ($2008). These costs were used in the cluster analysis. Technology-specific cost estimates were also developed for the four case studies. Note that the individual technology cost estimates do not affect the overall cluster findings but do provide insights into the individual economic return for the four technologies selected. D.1 Expense Methodology for Case Study Technologies For high temperature cement, DOE cost records were available from 2001 to 2006 (see Table D-1). The annual average of $141,667 was used for the remaining years of the time series from 1976 through 2008, when research was ongoing but cost information was not available. Table D-1. High-Temperature Cement DOE Costs
Year Cement Project ($2008) 2001 $150,000 2002 $150,000 2003 $150,000 2004 $120,000 2005 $130,000 2006 $150,000
Annual average $141,667 For TOUGH series of reservoir models, DOE indicated that between two and three FTE were supporting this research between 1976 and 1991. After 1991, the research involved about ½ and FTE. Thus, the following costs were used:
• 1976 to 1991: 2.5 FTEs x $159,000/yr/FTE1 • 1991 to 2008: 0.5 FTE x $159,000/yr/FTE
These numbers were multiplied by a factor of 2 to account for overhead expenditures; however, DOE was not able to provide expenditures associated with the PDC drill bit and binary cycle power plant technologies. Thus, RTI estimated technology-specific expenditures based on the appropriation line items. From 1986 to 2002, appropriation line items were available with sufficient detail to allocate costs to the specific technologies. Table D-2 lists the line items and shares used to build up DOE costs for each of the technologies from 1986 through 2002. 1 $159,000/yr/FTE reflects a Ph.D. physicist, 90th percentile wage rate (BLS, 2009).

Retrospective Benefit-Cost Evaluation of U.S. DOE Geothermal Technologies R&D Program Investments: Impacts of a Cluster of Energy Technologies
D-2
Table D-2. Budgetary Line Items Used to Develop Technology Costs Budgetary Line Items by Technology Years Reported in Time Series
PDC Drill Bit Hard rock penetration researcha 1986–1989 Drilling technologyb 1994–1998 Binary Cycle Power Plant Technology Heat cycle research 1986 Hydrothermal systemsc 1986; 1988; 1990–1992 Energy conversion technologyc 1987–1989; 1993–1994; and 1996–1998 Advanced heat & power systemsc 1999–2002
a Assumes 50% of hard rock penetration research funding is associated with PDC drill bits. b Assumes 25% of drilling technology funding is associated with PDC drill bits. c Assumes 25% of hydrothermal systems, 25% energy conversion technology, and 25% of advanced heat power systems funding
is associated with binary cycle power plant technology.
Before 1986 and after 2002, funding was appropriated to aggregated research categories, and separate cost information for the four technologies selected for this study was not available. DOE staff indicated that for both technologies associated research was conducted before 1986 and after 2002. Thus, the time series of available technology-specific costs (1986 to 2002) was extrapolated to generate a cost time series from 1976 to 2008. Table D-3 summarizes the costs used in the analysis. Table D-3. Allocation of GTP Funding by Technology Category, 1976 –2008 (thousands $2008)
Categories: Total Costs by
Technology Average
Annual Costs Percentage of Total
DOE Costs PDC drill bit $63,183 $1,914 3.8% High-temperature geothermal well cements $4,675 $142 0.2% TOUGH series of reservoir models $15,462 $468 0.6% Binary cycle power plant technology $60,311 $1,827 3.6% Total GTP Costs (Cluster Analysis) $2,627,966
D.2 References Bureau of Labor Statistics (BLS). (May 04, 2009). Occupational Employment and Wages, May 2008: 19-2012 Physicists. Table: Percentile wage estimates for this occupation. Washington DC: U.S. Department of Labor. Available at http://www.bls.gov/oes/2008/ may/oes192012.htm#ind

E-1
APPENDIX E1:
BIBLIOMETRICS METHODOLOGY USED IN THE KNOWLEDGE BENEFITS CHAPTER
This appendix provides a brief treatment of the bibliometric methods of evaluation—particularly patent analysis—used in the source report from which this appendix is derived. For additional information about these and other methods used in the source report, please refer to Ruegg and Thomas, Linkages from EERE’s Geothermal Program R&D to Commercial Power Generation, 2010.
Bibliometric methods of evaluation tend to be useful in historical tracing studies, such as the source study, which traces from DOE’s geothermal R&D to downstream power generation. Bibliometric methods can be used to provide objectively derived, quantitative measures of linkages from publication and patent outputs of the R&D program to other publications and patents outside the program. The related analyses can indicate that knowledge has been created, who created it, the extent that it is being disseminated and used (or at least referenced) by others, and who is using or referencing it.
E.1 Why Patent Analysis? When looking for connections from knowledge creation in a research program to commercialized technologies, patents are of particular interest because they are considered close to application. The use of patents as indicators of technology creation, and patent citation analysis to locate technology diffusion, reflects the central role of patents in the innovation system. Patent citation analysis has been used extensively in the study of technological change. In patent analysis, a reference from a patent to a previous patent is regarded as recognition that some aspect of the earlier patent has had an impact on the development of the later patent. In the patent analysis presented in this report, the idea that the technologies represented by patents that cite DOE-supported patents have built in some way on the patents attributable to research funded by DOE. Patent citation analysis also has been employed in other studies, as it is here, to evaluate the impact of particular patents on technological developments. This approach is based on the idea that highly cited patents (i.e., patents cited by many later patents) tend to contain technological information of particular importance, because they form the basis for many new innovations, they are cited frequently by later patents. Although it is not true to say that every highly cited patent is important, or that every infrequently cited patent is unimportant, research studies have shown a correlation between the rate of citations of a patent and its technological importance.2
1 This appendix was prepared by Rosalie Ruegg, TIA Consulting Inc. and Patrick Thomas, 1790 Analytics LLC. 2 For background on using patent citation analysis, including a summary of validation studies supporting its use, see Breitzman
A. & Mogee M. “The many applications of patent analysis,” Journal of Information Science, 28 (3), 2002, 187–205. For a similar background on the use of paper citation analysis, see Chapter 3 of Thomas P. “Fashions in Management Research,” 1999, Ashgate Press.

Retrospective Benefit-Cost Evaluation of U.S. DOE Geothermal Technologies R&D Program Investments: Impacts of a Cluster of Energy Technologies
E-2
E.2 “Prior Art” A patent discloses to society how an invention is practiced, in return for the right, during a limited period of time, to exclude others from using the patented invention without the patent assignee’s permission. The front page of a patent document contains a list of references to prior art. “Prior art“ refers to all information that previously has been made available publicly such that it might be relevant to a patent’s claim of originality and, hence, its validity. Prior art may be in the form of previous patents, or published items such as scientific papers, technical disclosures, and trade magazines. Patent citation analysis centers on the links between generations of patents and between patents and scientific papers that are made by these prior art references. In basic terms, this type of analysis is based on the idea that the prior art referenced by patents has had some influence, however slight, on the development of these patents. The prior art is thus regarded as part of the foundation for the later invention. In assessing the influence of individual patents and papers, citation analysis centers on the idea that highly cited patents/papers (i.e., patents/papers cited by many later patents) tend to contain scientific or technological information of particular interest or importance. As such, they form the basis for many new innovations and research efforts and are cited frequently by later patents. E.3 Forward and Backward Patent Tracing Two approaches to patent analysis were used in this study—forward tracing and backward tracing—paralleling the two perspectives of the broader historical tracing framework. E.3.1 Forward Patent Tracing The idea of forward tracing is to take a given body of research and to trace the influence of this research on subsequent technological developments. In the context of the current analysis, forward tracing involves identifying all geothermal energy patents and papers resulting from research programs funded by DOE. The impact of these patents and papers on subsequent generations of technology is then evaluated. This tracing is not restricted to later geothermal energy patents, since the influence of a body of research may extend beyond its immediate technology. Hence, the purpose of the forward tracing element of this project is to determine the impact of EERE-funded geothermal energy patents on developments both inside and outside geothermal energy technology. E.3.2 Backward Patent Tracing The idea of backward tracing is to take a particular technology, product, or industry and to trace back to identify the earlier technologies on which it has built. In the context of this project, the idea of backward

Appendix E — Bibliometrics Methodology Used in the Knowledge Benefits Chapter
E-3
patent tracing is to trace back to identify the earlier technologies on which the geothermal industry has built. To do this required first identifying the set of total geothermal patents. By tracing backward from this total set of geothermal patents to earlier geothermal patents attributed to EERE-funded geothermal R&D, it is possible to determine the extent to which later innovations built on earlier DOE-funded research. Furthermore, comparing the extent of the linkage of the total set back to earlier DOE-attributed patents versus the linkages back to other organizations provides an indication of the relative importance of DOE in establishing a knowledge base on which other organizations built further innovations in geothermal. E.4 Extensions of the Patent Citation Analysis The simplest form of patent tracing is based on a single generation of citation links between U.S. patents. Such a study identifies U.S. patents that cite, or are cited by, a given set of U.S. patents as prior art. This study extends the patent analysis in three ways, as discussed below. E.4.1 Extension to Patents Citing Publications This study extends the analysis to include patent citations of publications authored by DOE-funded researchers. The rationale for this extension is that DOE scientists may produce publications that are considered directly relevant to a technology’s development. Adding prior art references to DOE-supported publications thus takes into account the influence of the research described in these publications on innovations captured in patents. E.4.2 Extension to Multiple Generations of Citation Links This study extends the analysis by adding a second generation of citation links. This means that the study traces forward through two generations of citations starting from DOE-supported geothermal energy patents and papers and backwards through two generations starting from the patents of leading geothermal-energy innovating companies. The idea behind adding this second generation of citations is that federal agencies such as DOE often support scientific research that is more basic than applied. It may take time and multiple generations of research for this basic research to be used in an applied technology, such as that described in a patent. The impact of the basic research may not therefore be reflected in a study based on referencing a single generation of prior art. Introducing a second generation of citations provides greater access to these indirect links between basic and applied research and technology development. One potential problem with adding a second generation of citations should be acknowledged. This is a problem common to many networks, whether these networks consist of people, institutions, or scientific documents, as in this case. The problem is that, if one uses enough generations of links, eventually almost every node in the network will be linked. By the same logic, if one takes a starting set of patents, and

Retrospective Benefit-Cost Evaluation of U.S. DOE Geothermal Technologies R&D Program Investments: Impacts of a Cluster of Energy Technologies
E-4
extends the network of prior art references far enough, eventually almost all earlier patents and papers will be linked to this starting set. Based on our previous experience, using two generations of citation links is appropriate for tracing studies such as this; however, adding additional generations may bring in too many patents with little connection to the starting patent and paper sets. E.4.3 Extension beyond the U.S. Patent System The report looked beyond the U.S. patent system to include patents from the European Patent Office (EPO) and patent applications filed with the World Intellectual Property Organization (WIPO). The analysis thus allows for a wide variety of possible linkages between DOE-funded geothermal energy research and subsequent technological developments. E.5 Patent Data Sets for Analysis The backward tracing elements of the study starts from the set of all geothermal energy patents, while the forward tracing starts from the set of geothermal energy patents attributed to DOE funding. Neither of these data sets existed; both had to be constructed for this the study. E.5.1 Identifying DOE-Attributed Geothermal Energy Patents for Forward Tracing Identifying patents funded by government agencies is often more difficult than identifying patents funded by companies. When a company funds internal research, any patented inventions emerging from this research are likely to be assigned to the company itself. To construct a patent set for a company, one simply has to identify all patents assigned to the company, along with all of its subsidiaries, acquisitions etc. In contrast, a government agency such as DOE may fund research in a variety of organizations. For example, DOE operates a number of laboratories and research centers. Patents emerging from these laboratories and research centers may be assigned to DOE, or they may be assigned to the organization that manages the laboratories or research centers. For example, patents from Sandia may be assigned Lockheed Martin, while Livermore patents may be assigned to the University of California.
A further complication is that DOE does not only fund research in its own labs and research centers. It also funds research carried out by private companies and universities. If this research results in patented inventions, these patents are likely to be assigned to the company or university carrying out the research, rather than to DOE.
To identify geothermal patents resulting from DOE-funded research, the study first searched within the set of patents identified by the geothermal patent filter and matched this patent set to three sources to identify those attributable to DOE funding:

Appendix E — Bibliometrics Methodology Used in the Knowledge Benefits Chapter
E-5
• OSTI Database – The first source used was a database provided by DOE’s Office of Scientific & Technical Information (OSTI) for use in DOE-related projects. This database contains information on research grants provided by DOE since its inception. It also links these grants to the organizations or DOE centers carrying out the research, the sponsor organization within DOE, and the U.S. patents that resulted from these DOE grants.
• Patents assigned to DOE – The study identified a number of U.S. patents assigned to DOE that were not in the OSTI database because they have been issued since the latest version of that database. These patents were added to the list of DOE-attributed patents.
• Patents with DOE Government Interest – A U.S. patent has on its front page a section entitled “Government Interest,” which details the rights that the government has in a particular invention. For example, if a government agency funds research at a private company, the government may have certain rights to patents granted based on this research. The study identified all patents within the set identified by the geothermal patent filter that refer to “Department of Energy” or “DOE” in their Government Interest field, along with patents that refer to government contracts beginning with DE- or ENG-, since these abbreviations denote DOE grants. Patents in this set that were not in the OSTI database and were not assigned to DOE were added to the list of DOE-attributed patents.
In addition to this procedure, the study identified DOE-attributed geothermal patents found through a search of DOE reports. These reports detail the history of DOE funding in geothermal energy (for example the 2006 report “Geothermal Power Today” http://www.nrel.gov/docs/fy06osti/39479.pdf).
The DOE reports often identify specific geothermal patents resulting from funding by DOE. These patents were added to the DOE-attributed patent set resulting from the geothermal filter. The reports also in some cases identify organizations whose geothermal energy research has been funded by DOE, the period of funding, and technologies funded. By matching the organizations, time periods, and technologies from these documents with patent data, it was possible to identify additional patents from these organizations that are likely to have been funded (at least in part) by DOE, even if they did not formally acknowledge DOE’s support.
The next step was to send the list of candidate patents identified through this multistep process to DOE scientists and program managers. They in turn provided feedback on which of the candidate patents should be included in the study’s final set of DOE-attributed patents and which should be omitted.

Retrospective Benefit-Cost Evaluation of U.S. DOE Geothermal Technologies R&D Program Investments: Impacts of a Cluster of Energy Technologies
E-6
E.5.2 Identifying the Set of All Geothermal Energy Patents for Backward Tracing To identify the set of all geothermal patents for the backward tracing, the study designed a patent filter. To identify U.S. patents, the filter used a combination of keywords and Patent Office Classifications (POCs). Meanwhile the filter to identify EPO and WIPO patents used a combination of keywords and International Patent Classifications (IPCs). The patent filter consisted of four separate searches, as described in detail in the source report.
Patents identified by any of the four searches were considered for inclusion in the final set of geothermal patents. The titles of all these candidate patents were read individually, and irrelevant patents removed from the set. This resulted in a final geothermal patent set consisting of 871 U.S. patents, 180 EPO patents, and 234 WIPO patents.
The design of the patent filter has important implications for the backward tracing element of the analysis presented in this report. It is this filter that determines which patents are included in the geothermal patent set used as the starting point for this backward tracing. More specifically, keyword restrictions require that a patent must refer specifically to a geothermal, hot rock, or hot spring application in its title or abstract in order to be considered a geothermal patent.
The keyword restriction is included because of the nature of geothermal technology. Some technologies are relatively self-contained, and their patents use unique terminologies. This is not the case with geothermal technology, which shares many similarities with oilfield technology. For example, technologies such as drill bits, downhole sensors, data transmission techniques, and well cements and casings may have applications for both the oilfield and geothermal industries. Including all such patents would swamp the geothermal patents with the much larger set of oilfield patents (for example, there are over 11,000 U.S. patents in POC 175 “Boring or Penetrating the Earth” alone). The keyword restriction is designed to prevent this from happening. The effects of this approach is to produce a conservative estimate of geothermal patents for the backward tracing analysis; one that focuses more on geothermal power plants and geothermal fluid treatments that tend to make specific reference to their geothermal focus.
This highlights the benefit of carrying out the analysis in two directions, since the forward tracing element helps demonstrate DOE’s impact on patents that do not specifically refer to a geothermal application but may be related to geothermal technology.

Appendix E — Bibliometrics Methodology Used in the Knowledge Benefits Chapter
E-7
E.6 Constructing Patent Families Based on the “Priority Application” Organizations often file for protection of their inventions across multiple patent systems. For example, a U.S. company may file to protect a given invention in the United States and also file for protection of this invention in other countries. Also, inventors may apply for a series of patents in the same country based on the same underlying invention. As a result, there may be multiple patent documents for the same invention. In the case of this project, one or more U.S., EPO, and WIPO patents may result from a single invention. A search for equivalents of each of the DOE-attributed patents was made in the EPO and WIPO systems to avoid counting patents on the same invention more than once. An equivalent is a patent filed in a different patent system covering essentially the same invention. A search was also made for U.S. patents that are continuations, continuations-in-part, or divisionals of each of these patents. In total, 115 U.S. patents, 16 EPO patents, and 17 WIPO patents were identified. Patents that are all based on the same underlying invention are constructed into patent families. A patent family contains all of the patents and patent applications that result from the same original patent application (named the priority application). A family may include patents/applications from multiple countries, and also multiple patents/applications from the same country. For this study, it was necessary to construct patent families for DOE and also for all of the patents/applications linked through citations to DOE. To construct these patent families, the priority documents of the U.S., EPO and WIPO patents/applications were matched, to group them in the appropriate families. Fuzzy matching algorithms were used to achieve this, along with a small amount of manual matching, since priority documents have different number formats in different patent systems. It should be noted that the priority document need not necessarily be a U.S., EPO, or WIPO application. For example, a Japanese patent application may result in U.S., EPO, and WIPO patents/applications, which are grouped in the same patent family because they share the same Japanese priority document. As a result of this process, the 90 patent families attributed to DOE-funded research were identified, containing U.S., EPO, and WIPO geothermal energy patents/applications. Meanwhile the set of all U.S., EPO, and WIPO geothermal energy patents/applications were grouped into 1,016 patent families. E.7 Publication Coauthoring and Citation Analyses Past similar studies suggest that analyses of publications may offer additional insights into the creation and dissemination of knowledge from EERE’s geothermal R&D program. The volume of publications over time provides an indication of the extent of publications as a knowledge output. Coauthoring of publications in advanced combustion by EERE researchers with researchers from other organizations may indicate collaboration and links between EERE researchers and researchers involved in downstream

Retrospective Benefit-Cost Evaluation of U.S. DOE Geothermal Technologies R&D Program Investments: Impacts of a Cluster of Energy Technologies
E-8
technology development and commercialization. Citations of publications resulting from EERE geothermal research show paths of knowledge flow. The publication citation search is facilitated by using a publication citation database and search engine. For a long period, the U.S.-based firm Thomson Scientific (formerly the Institute for Scientific Information [ISI]) was the principal tool facilitating publication citation analysis. But today a growing number of publication citation databases and search tools, such as Scopus, CiteSeer, and Google Scholar, provide comprehensive coverage beyond the major journals, including, for example, conference proceedings, book chapters, dissertations, and research reports.3 For this study’s publication-to-publication citation analysis, conference papers and research reports were prominent, and Google Scholar was used because it included these kinds of publications in its search capability. A comparison of alternative publication search tools rated Google Scholar among the best.4
3 Meho, Lokman I. The rise and rise of citation analysis. Physics World, 20, 1, 32-36. 4 Ibid., 31-36.


Retrospective Benefit-Cost Evaluation of U.S. DOE Geothermal Technologies R&D Program Investments: Impacts of a Cluster of Energy Technologies
E-2