retrieval of co from simulated orbiting carbon observatory...
TRANSCRIPT
Retrieval of XCO2from simulated Orbiting Carbon Observatory
measurements using the fast linearized R-2OS radiative
transfer model
Vijay Natraj,1 Hartmut Boesch,2,3 Robert J. D. Spurr,4 and Yuk L. Yung1
Received 29 May 2007; revised 23 August 2007; accepted 11 December 2007; published 14 June 2008.
[1] In a recent paper, we introduced a novel technique to compute the polarization in avertically inhomogeneous, scattering-absorbing medium using a two orders ofscattering (2OS) radiative transfer (RT) model. The 2OS computation is an order ofmagnitude faster than a full multiple scattering scalar calculation and can be implementedas an auxiliary code to compute polarization in operational retrieval algorithms. In thispaper, we employ the 2OS model for polarization in conjunction with a scalar RTmodel (Radiant) to simulate backscatter measurements in near infrared (NIR) spectralregions by space-based instruments such as the Orbiting Carbon Observatory (OCO).Computations are performed for six different sites and two seasons, representinga variety of viewing geometries, surface and aerosol types. The aerosol extinction(at 13000 cm�1) was varied from 0 to 0.3. The radiance errors using the Radiant/2OS(R-2OS) RT model are an order of magnitude (or more) smaller than errors arising fromthe use of the scalar model alone. In addition, we perform a linear error analysis study toshow that the errors in the retrieved column-averaged dry air mole fraction of CO2 (XCO2
)using the R-2OS model are much lower than the ‘‘measurement’’ noise and smoothing errorsappearing in the inverse model. On the other hand, we show that use of the scalar model aloneinduces XCO2
errors that could dominate the retrieval error budget.
Citation: Natraj, V., H. Boesch, R. J. D. Spurr, and Y. L. Yung (2008), Retrieval of XCO2from simulated Orbiting Carbon
Observatory measurements using the fast linearized R-2OS radiative transfer model, J. Geophys. Res., 113, D11212,
doi:10.1029/2007JD009017.
1. Introduction
[2] Satellite measurements have played a major role inweather and climate research for the past few decades,and will continue to do so in the future. For most remotesensing applications, interpretation of such measurementsrequires accurate modeling of the interaction of light withthe atmosphere and surface. In particular, polarizationeffects due to the surface, atmosphere and instrumentneed to be considered. Aben et al. [1999] suggested theuse of high spectral resolution polarization measurementsin the O2 A band for remote sensing of aerosols in theEarth’s atmosphere. Stam et al. [2000] showed that forpolarization-sensitive instruments, the best way to mini-mize errors in quantities derived from the observed signalis by measuring the state of polarization of the observed
light simultaneously with the radiances themselves.Hasekamp et al. [2002] demonstrated the need to modelpolarization effects in ozone profile retrieval algorithmsbased on moderate-resolution backscattered sunlightmeasurements in the ultraviolet (UV). Jiang et al.[2004] proposed a method to retrieve tropospheric ozonefrom measurements of linear polarization of scatteredsunlight from the ground or from a satellite.[3] Typically, trace gas retrieval algorithms neglect
polarization in the forward model radiative transfer (RT)simulations, mainly because of insufficient computerresources and lack of speed. This can result in significantloss of accuracy in retrieved trace gas column densities,particularly in the UV, visible and near infrared (NIR)spectral regions, because of appreciable light scattering byair molecules, aerosols and clouds. It has been shown thatneglecting polarization in a Rayleigh scattering atmo-sphere can produce errors as large as 10% in thecomputed intensities [Mishchenko et al., 1994; Lacis etal., 1998].[4] The inclusion of polarization in forward modeling has
been handled by methods such as the use of lookup tables[Wang, 2006], or the combination of limited polarizationmeasurement data with interpolation schemes [Schutgensand Stammes, 2003]. Such methods have been implementedwith reasonable success for certain applications. However,
JOURNAL OF GEOPHYSICAL RESEARCH, VOL. 113, D11212, doi:10.1029/2007JD009017, 2008ClickHere
for
FullArticle
1Division of Geological and Planetary Sciences, California Institute ofTechnology, Pasadena, California, USA.
2Jet Propulsion Laboratory, California Institute of Technology,Pasadena, California, USA.
3Now at Department of Physics and Astronomy, University of Leicester,Leicester, UK.
4RT Solutions Inc., Cambridge, Massachusetts, USA.
Copyright 2008 by the American Geophysical Union.0148-0227/08/2007JD009017$09.00
D11212 1 of 14
there are situations where the required retrieval precision isvery high, so that such simplifications will fail to providesufficient accuracy. For instance, it has been shown thatretrieving the sources and sinks of CO2 on regional scalesrequires the column density to be known to 2.5 ppmv(0.7%) precision to match the performance of the existingground-based network [Rayner and O’Brien, 2001] and to1 ppmv (0.3%) to reduce flux uncertainties by 50% [Milleret al., 2007]. Recent improvements in sensor technology aremaking very high precision measurements feasible forspace-based remote sensing. Clearly, there is a need forpolarized RT models that are not only accurate enough toachieve high retrieval precision, but also fast enough tomeet operational requirements regarding the rate of dataturnover.[5] In a recent paper [Natraj and Spurr, 2007], we
presented the theoretical formulation for the simultaneouscomputation of the top of the atmosphere (TOA) reflectedradiance and the corresponding weighting function fieldsusing a two orders of scattering (2OS) RT model. In thispaper, we apply the 2OS polarization model in conjunc-tion with the full multiple scattering scalar RT modelRadiant [Benedetti et al., 2002; Christi and Stephens,2004; Gabriel et al., 2006; Spurr and Christi, 2007] forthe simulation of polarized backscatter measurements I =(I, Q, U, V) in the spectral regions to be measured by theOrbiting Carbon Observatory (OCO) mission [Crisp etal., 2004]. I, Q, U and V are the Stokes parameters[Stokes, 1852], which describe the polarization state ofelectromagnetic radiation. I refers to the total intensity, Qand U are measures of linear polarization, and Vdescribes the state of circular polarization. I is the Stokesvector. The purpose of the 2OS model is to supply acorrection to the total scalar intensity delivered by Radi-ant, and to compute the other elements (Q, U, V) in thebackscatter Stokes vector. The 2OS model provides a fastand accurate way of accounting for polarization in theOCO forward model. The Radiant/2OS (R-2OS) combi-nation thus obviates the need for prohibitively slow fullvector multiple scatter simulations.[6] The R-2OS scheme is a simplification of the forward
model. For the OCO retrieval error budget, it is important toquantify the errors in the retrieved column-averaged dry airmole fraction of CO2 (XCO2
) and ancillary state vectorelements such as surface pressure induced by this forwardmodel assumption. The magnitude of the forward modelerrors are established as the differences between totalbackscatter radiances from the R-2OS forward model andthose calculated by means of the full vector RT modelVLIDORT [Spurr, 2006]. In order to ensure consistency, wenote that the Radiant model as used in the OCO retrievalalgorithm has been fully validated against the scalarLIDORT code [Spurr et al., 2001; Spurr, 2002] and alsoVLIDORT operating in scalar mode (polarization turnedoff); this validation is discussed by Spurr and Christi[2007].[7] The paper is organized as follows. In section 2, we
give a brief description of the 2OS model. In section 3, wedescribe the test scenarios and introduce the solar andinstrument models. The spectral radiance errors are ana-lyzed in section 4. In section 5, we study the usefulness ofthe R-2OS model for CO2 retrievals by calculating XCO2
errors using a linear sensitivity analysis procedure. Weconclude with an evaluation of the implication of theseresults for the OCO mission in section 6.
2. The 2OS Model
[8] Multiple scattering is known to be depolarizing[Hansen, 1971; Hansen and Travis, 1974]. However, ig-noring polarization in the RT modeling leads to two types oferror. First, polarization components (Q, U, V ) of the Stokesvector are neglected and will therefore be unknown sourcesof error in any retrievals using polarized backscatter meas-urements. The second type of error is in the intensity itself:the scalar value is different from the intensity componentof the Stokes vector calculated with polarization included inthe RT calculation. The significance of the second kind oferror is that even if the instrument were completely insen-sitive to polarization, errors would still accrue if polarizationwere neglected in the RT model.[9] A single scattering RT model provides the simplest
approximation to the treatment of polarization. However,for unpolarized incident light, polarization effects on theintensity are absent in this approximation. Hence, thesecond type of error mentioned above would remain unre-solved with this approximation. RT models with three (andhigher) orders of scattering give highly accurate results, butinvolve nearly as much computation as that required for afull multiple scattering treatment (see, e.g., Kawabata andUeno [1988] for the scalar three-orders case). The 2OStreatment represents a good compromise between accuracyand speed when dealing with polarized RT.[10] In our 2OS model, the computational technique is a
vector treatment extension (to include polarization) ofprevious work done for a scalar model [Kawabata andUeno, 1988]. Full details of the mathematical setup aregiven elsewhere [Natraj and Spurr, 2007]. The followingrelation summarizes the approach:
I
Q
U
V
0BB@
1CCA ffi
Isca0
0
0
0BB@
1CCAþ
IcorQ2OS
U2OS
V2OS
0BB@
1CCA; ð1Þ
where I, Q, U and V are the Stokes parameters, andsubscripts sca and 2OS refer to a full multiple scatteringscalar RT calculation and to a vector computation using the2OS model, respectively. Icor is the scalar-vector intensitycorrection computed using the 2OS model. Note that the2OS calculation only computes correction terms due topolarization; a full multiple scattering scalar computation isstill required to compute the intensity.[11] The advantage of this technique is that it is fully
based on the underlying physics and is in no way empirical.If the situation were such that two (or lower) orders ofscattering are sufficient to account for polarization, thismethod would be exact. There are some situations, suchas an optically thick pure Rayleigh medium or an atmo-sphere with large aerosol or ice cloud scattering, where theapproach will fail. However, for most NIR retrievals, this islikely to be a very accurate approximation. Validation of the2OS model has been done against scalar results for an
D11212 NATRAJ ET AL.: OCO XCO2RETRIEVAL USING R-2OS RT MODEL
2 of 14
D11212
inhomogeneous atmosphere [Kawabata and Ueno, 1988]and vector results for a homogeneous atmosphere [Hovenier,1971]. In the earlier work [Natraj and Spurr, 2007], weperformed backscatter simulations of reflected sunlight in theO2 A band for a variety of geometries, and compared ourresults with those from the VLIDORT model. In thesesimulations, the effects of gas absorption optical depth, solarzenith angle, viewing geometry, surface reflectance and windspeed (in the case of ocean glint) on the intensity, polarizationand corresponding weighting functions were investigated.Finally, we note that the 2OS model is completely linearized;that is, the weighting functions or Jacobians (analytic deriv-atives of the radiance field with respect to atmospheric andsurface properties) are simultaneously computed along withthe radiances themselves.
3. Simulations
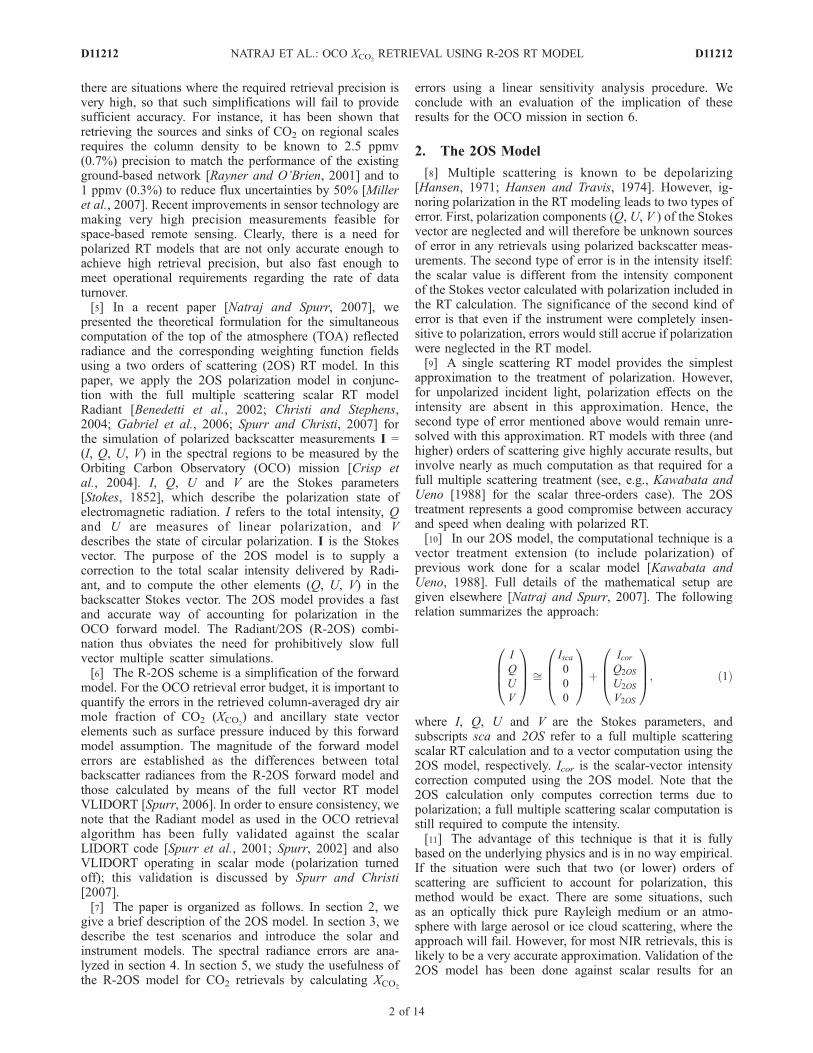
[12] In this work, we use the spectral regions to bemeasured by the OCO instrument to test the 2OS model.This includes the 0.76 mm O2 A band, and two vibration-rotation bands of CO2 at 1.61 mm and 2.06 mm [Kuang etal., 2002]. Six different locations and two seasons wereconsidered for the simulations (see Figure 1 for geograph-ical location map). These six sites are all part of the ground-based validation network for the OCO instrument [Crisp etal., 2006; Washenfelder et al., 2006; Bosch et al., 2006]. Foreach location/season combination, 12 tropospheric aerosolloadings were specified (extinction optical depths 0, 0.002,0.005, 0.008, 0.01, 0.02, 0.03, 0.04, 0.05, 0.1, 0.2, 0.3 at13000 cm�1). Details of the geometry, surface and tropo-
spheric aerosol types for the various scenarios are summa-rized in Table 1.[13] The atmosphere comprises 11 optically homoge-
neous layers, each of which includes gas molecules andaerosols. The 12 pressure levels are regarded as fixed, andthe altitude grid is computed recursively using the hydro-static approximation. Spectroscopic data are taken from theHITRAN 2004 molecular spectroscopic database [Rothmanet al., 2005]. The tropospheric aerosol types have beenchosen according to the climatology developed by Kahn etal. [2001]. The stratospheric aerosol is assumed to be a 75%solution of H2SO4 with a modified gamma function sizedistribution [World Climate Research Programme, 1986].The complex refractive index of the sulfuric acid solution istaken from the tables prepared by Palmer and Williams[1975]. For spherical aerosol particles, the optical propertiesare computed using a polydisperse Mie scattering code[de Rooij and van der Stap, 1984]; in addition to extinctionand scattering coefficients and distribution parameters,this code generates coefficients for the expansion of thescattering matrix in generalized spherical functions (a re-quirement of all the RT models used in this study). Fornonspherical aerosols such as mineral dust, optical propertiesare computed using a Tmatrix code [Mishchenko and Travis,1998]. The atmosphere is bounded below by a Lambertianreflecting surface. The surface reflectances are taken from theASTER spectral library (http://speclib.jpl.nasa.gov). Notethat all RT models in this paper use a pseudo-sphericalapproximation, in which all scattering is regarded as takingplace in a plane-parallel medium, but the solar beam atten-uation is treated for a curved atmosphere. The pseudo-
Figure 1. Geographical location map of test sites. The color bar denotes XCO2for 1 July (1200 UT)
calculated using the MATCH/CASA model [Olsen and Randerson, 2004]. The coordinates of thelocations are as follows: Ny Alesund (79�N, 12�E), Park Falls (46�N, 90�W), Algeria (30�N, 8�E),Darwin (12�S, 130�E), South Pacific (30�S, 210�E) and Lauder (45�S, 170�E).
D11212 NATRAJ ET AL.: OCO XCO2RETRIEVAL USING R-2OS RT MODEL
3 of 14
D11212
spherical treatment is based on the average-secant approxi-mation [see, e.g., Spurr, 2002].[14] The OCO instrument is a polarizing spectrometer
measuring backscattered sunlight in the O2 A band, and theCO2 bands at 1.61 mm and 2.06 mm [Haring et al., 2004,2005; Crisp et al., 2006]. OCO is scheduled for launch inDecember 2008, and will join NASA’s ‘‘A-train’’ along asun-synchronous polar orbit with 1326 local equator cross-ing time (ascending node), about 5 min ahead of the Aquaplatform [Crisp et al., 2006]. OCO is designed to operate inthree modes: nadir, glint (utilizing specular reflection overthe ocean) and target (to stare over a fixed spot, such as a
validation site), and has a nominal spatial footprint dimen-sion of 1.3 km � 2.3 km in the nadir mode. The OCOpolarization axis is always perpendicular to the principalplane, so that the backscatter measurement is, in terms ofStokes parameters, equal to I-Q.[15] In the OCO retrieval algorithm, the complete for-
ward model describes all physical processes pertaining tothe attenuation and scattering of sunlight through theatmosphere (including reflection from the surface) to theinstrument. Thus, the forward model consists of the RTmodel, a solar model and an instrument model. The R-2OSRT model computes a monochromatic top-of-atmosphere
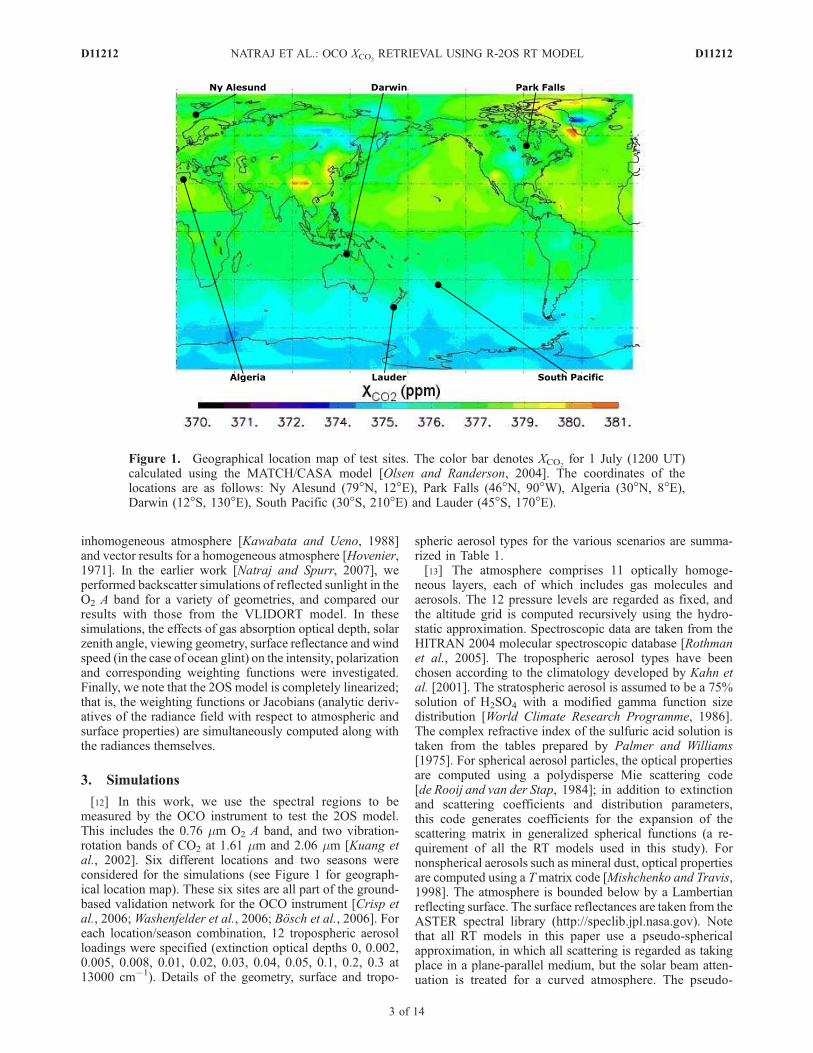
Figure 2. Radiance errors using the R-2OS model for South Pacific in January. The black, blue, cyan,green and red lines refer to aerosol extinction optical depths (at 13000 cm�1) of 0, 0.01, 0.05, 0.1 and 0.3,respectively. (top) The O2 A band, (middle) the 1.61 mm CO2 band and (bottom) the 2.06 mm CO2 band.
Table 1. Scenario Descriptiona
Solar Zenith Angle, deg Surface Type Aerosol Type [Kahn et al., 2001]
Algeria 1 Jan 57.48 desert (0.42, 0.5, 0.53) dusty continental (4b)Algeria 1 Jul 21.03 desert (0.42, 0.5, 0.53) dusty continental (4b)Darwin 1 Jan 23.24 deciduous (0.525, 0.305, 0.13) dusty maritime (1a)Darwin 1 Jul 41.44 deciduous (0.525, 0.305, 0.13) black carbon continental (5b)Lauder 1 Jan 34.22 grass (0.47, 0.3, 0.11) dusty maritime (1a)Lauder 1 Jul 74.20 frost (0.975, 0.305, 0.145) dusty maritime (1b)Ny Alesund 1 Apr 80.77 snow (0.925, 0.04, 0.0085) dusty maritime (1b)Ny Alesund 1 Jul 62.43 grass (0.47, 0.3, 0.11) dusty maritime (1b)Park Falls 1 Jan 72.98 snow (0.925, 0.04, 0.0085) black carbon continental (5b)Park Falls 1 Jul 31.11 conifer (0.495, 0.235, 0.095) dusty continental (4b)South Pacific 1 Jan 24.62 ocean (0.03, 0.03, 0.03) dusty maritime (1a)South Pacific 1 Jul 58.84 ocean (0.03, 0.03, 0.03) dusty maritime (1b)
aThe surface reflectances in the O2 A band, 1.61 mm CO2 band and 2.06 mm CO2 band are given in parentheses after the surface type. For the aerosoltypes, the values in parentheses are the mixing groups assigned by Kahn et al. [2001].
D11212 NATRAJ ET AL.: OCO XCO2RETRIEVAL USING R-2OS RT MODEL
4 of 14
D11212
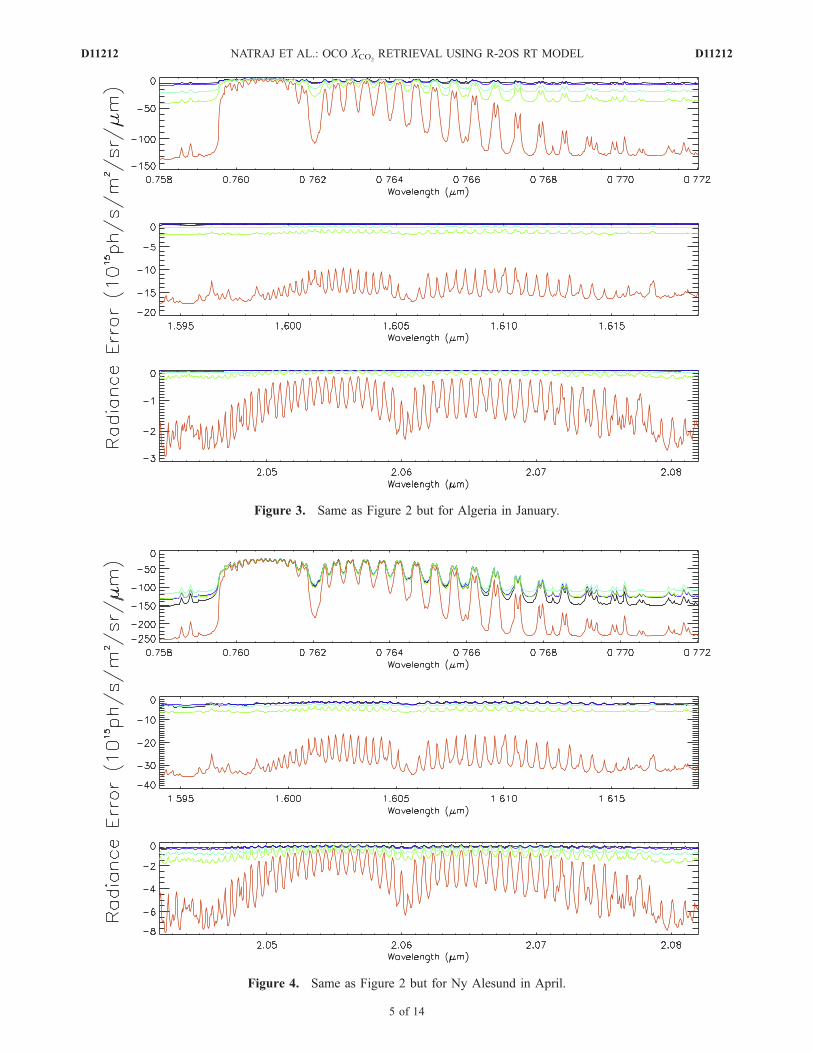
Figure 3. Same as Figure 2 but for Algeria in January.
Figure 4. Same as Figure 2 but for Ny Alesund in April.
D11212 NATRAJ ET AL.: OCO XCO2RETRIEVAL USING R-2OS RT MODEL
5 of 14
D11212
(TOA) reflectance spectrum at a wave number resolution of0.01 cm�1; this is sufficient to resolve the individual O2,CO2 and H2O lines in the OCO spectral regions with 5–8 points per Lorentz full-width for typical surface condi-tions and at least 2 points throughout the troposphere. TheOCO solar model is based on an empirical list of solar lineparameters which allows computation of a solar spectrumwith arbitrary spectral resolution and point spacing [Boschet al., 2006]. The instrument model simulates the instru-ment’s spectral resolution and spectral sampling by con-volving the highly resolved monochromatic radiancespectrum with the instrument line shape function (ILS),and subsequently with a boxcar function to take into accountthe spectral range covered by a detector pixel. The ILS isassumed to be Lorentzian with Half Width at Half Maxi-mum (HWHM) 2.25 � 10�5 mm, 4.016 � 10�5 mm and5.155 � 10�5 mm for the 0.76 mm O2 A band, 1.61 mm CO2
band and 2.06 mm CO2 band, respectively.
4. Forward Model Uncertainties
[16] For the three OCO spectral bands, Figures 2–4 showthe forward model radiance errors caused by the R-2OSmodel. Results are shown for July scenarios in South Pacific(Figure 2), Algeria (Figure 3) and Ny Alesund (Figure 4).These are scenarios with low solar zenith angle and lowsurface reflectance, low solar zenith angle and moderatesurface reflectance, and high solar zenith angle, respectively.
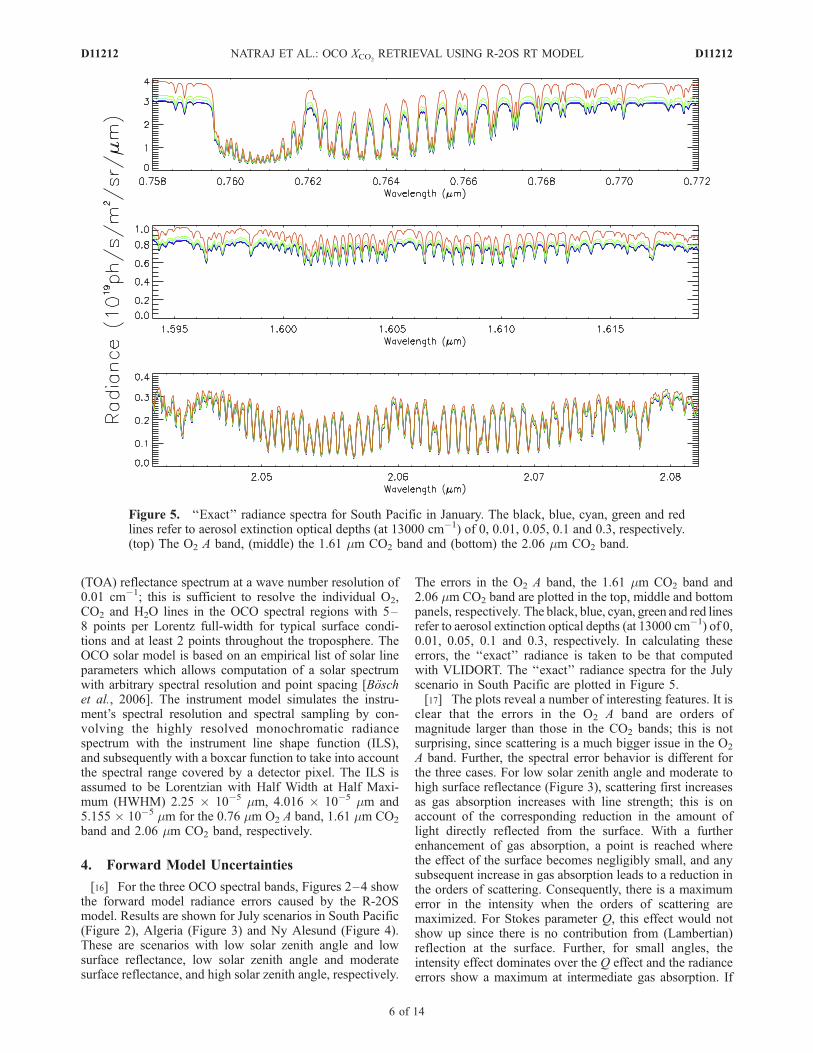
The errors in the O2 A band, the 1.61 mm CO2 band and2.06 mm CO2 band are plotted in the top, middle and bottompanels, respectively. The black, blue, cyan, green and red linesrefer to aerosol extinction optical depths (at 13000 cm�1) of 0,0.01, 0.05, 0.1 and 0.3, respectively. In calculating theseerrors, the ‘‘exact’’ radiance is taken to be that computedwith VLIDORT. The ‘‘exact’’ radiance spectra for the Julyscenario in South Pacific are plotted in Figure 5.[17] The plots reveal a number of interesting features. It is
clear that the errors in the O2 A band are orders ofmagnitude larger than those in the CO2 bands; this is notsurprising, since scattering is a much bigger issue in the O2
A band. Further, the spectral error behavior is different forthe three cases. For low solar zenith angle and moderate tohigh surface reflectance (Figure 3), scattering first increasesas gas absorption increases with line strength; this is onaccount of the corresponding reduction in the amount oflight directly reflected from the surface. With a furtherenhancement of gas absorption, a point is reached wherethe effect of the surface becomes negligibly small, and anysubsequent increase in gas absorption leads to a reduction inthe orders of scattering. Consequently, there is a maximumerror in the intensity when the orders of scattering aremaximized. For Stokes parameter Q, this effect would notshow up since there is no contribution from (Lambertian)reflection at the surface. Further, for small angles, theintensity effect dominates over the Q effect and the radianceerrors show a maximum at intermediate gas absorption. If
Figure 5. ‘‘Exact’’ radiance spectra for South Pacific in January. The black, blue, cyan, green and redlines refer to aerosol extinction optical depths (at 13000 cm�1) of 0, 0.01, 0.05, 0.1 and 0.3, respectively.(top) The O2 A band, (middle) the 1.61 mm CO2 band and (bottom) the 2.06 mm CO2 band.
D11212 NATRAJ ET AL.: OCO XCO2RETRIEVAL USING R-2OS RT MODEL
6 of 14
D11212
the surface reflectance is reduced to a low level (Figure 2),the effect of direct reflected light becomes very small, andthe I and Q errors behave similarly, with the result that theerrors are maximized when gas absorption is at a minimum.The same effect occurs if the solar zenith angle is increased(Figure 4). Increasing aerosol extinction reduces the surfacecontribution; hence, the spectral behavior for high aerosolamounts is the same as that for low surface reflectance orhigh solar zenith angle.[18] On the other hand, the errors (at constant gas absorp-
tion) increase with augmenting aerosol extinction, except inthe high solar zenith angle case (Figure 4), where they decreaseat first and reach minimum values for certain low aerosolamounts. This special case can be explained as follows. Smallaerosol amounts have the effect of reducing the contribution ofRayleigh scattering relative to aerosol scattering. The former isconservative, while the latter is not. The net effect is thatscattering is reduced. However, at a certain point, the contri-bution from Rayleigh scattering becomes insignificant, andfurther increase in aerosol extinction simply increases theoverall scattering and the level of error.[19] For the January scenarios (not plotted here), the
spectral error behavior generally follows the pattern dis-cussed above. The only exception is Darwin (tropicalAustralia), where the error initially decreases as aerosol isadded, even though the solar zenith angle is small. This isbecause Darwin has been assigned a continental aerosol typewith significant amounts of carbonaceous and black carboncomponents [Kahn et al., 2001], both of which are strongly
absorbing. This has the effect of reducing scattering up to thepoint where Rayleigh scattering is no longer significant.[20] The radiance errors caused by the scalar model have
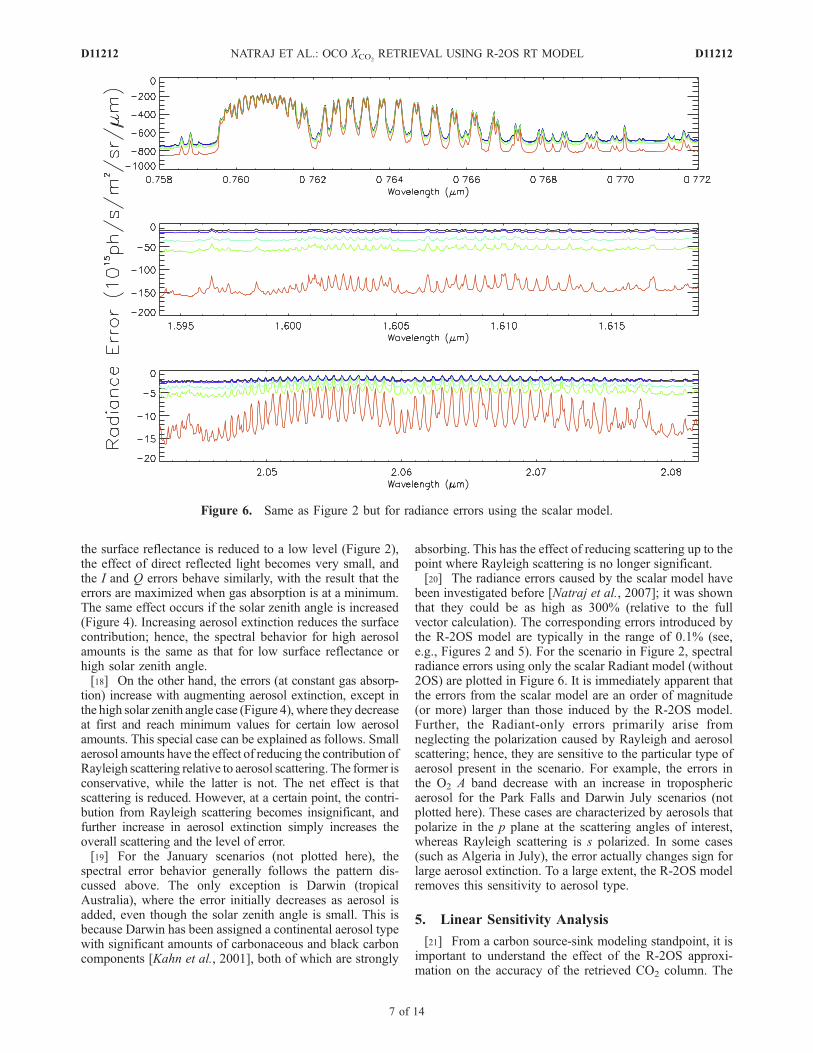
been investigated before [Natraj et al., 2007]; it was shownthat they could be as high as 300% (relative to the fullvector calculation). The corresponding errors introduced bythe R-2OS model are typically in the range of 0.1% (see,e.g., Figures 2 and 5). For the scenario in Figure 2, spectralradiance errors using only the scalar Radiant model (without2OS) are plotted in Figure 6. It is immediately apparent thatthe errors from the scalar model are an order of magnitude(or more) larger than those induced by the R-2OS model.Further, the Radiant-only errors primarily arise fromneglecting the polarization caused by Rayleigh and aerosolscattering; hence, they are sensitive to the particular type ofaerosol present in the scenario. For example, the errors inthe O2 A band decrease with an increase in troposphericaerosol for the Park Falls and Darwin July scenarios (notplotted here). These cases are characterized by aerosols thatpolarize in the p plane at the scattering angles of interest,whereas Rayleigh scattering is s polarized. In some cases(such as Algeria in July), the error actually changes sign forlarge aerosol extinction. To a large extent, the R-2OS modelremoves this sensitivity to aerosol type.
5. Linear Sensitivity Analysis
[21] From a carbon source-sink modeling standpoint, it isimportant to understand the effect of the R-2OS approxi-mation on the accuracy of the retrieved CO2 column. The
Figure 6. Same as Figure 2 but for radiance errors using the scalar model.
D11212 NATRAJ ET AL.: OCO XCO2RETRIEVAL USING R-2OS RT MODEL
7 of 14
D11212
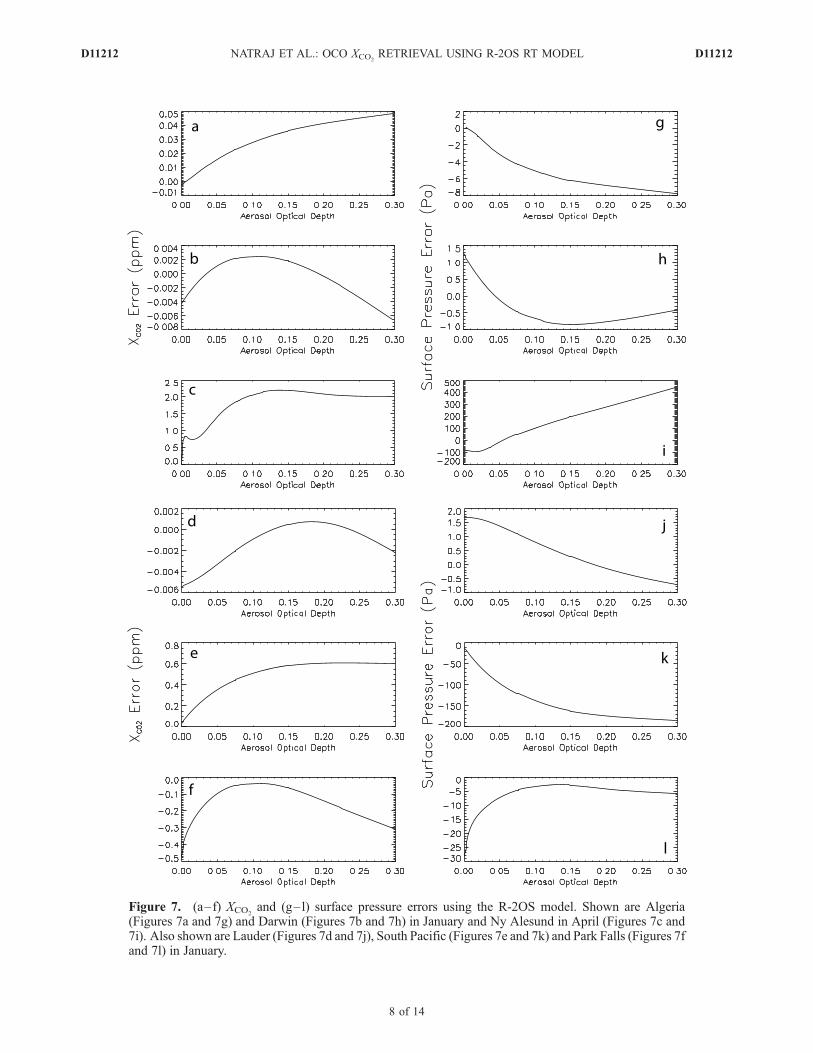
Figure 7. (a–f) XCO2and (g–l) surface pressure errors using the R-2OS model. Shown are Algeria
(Figures 7a and 7g) and Darwin (Figures 7b and 7h) in January and Ny Alesund in April (Figures 7c and7i). Also shown are Lauder (Figures 7d and 7j), South Pacific (Figures 7e and 7k) and Park Falls (Figures 7fand 7l) in January.
D11212 NATRAJ ET AL.: OCO XCO2RETRIEVAL USING R-2OS RT MODEL
8 of 14
D11212
linear error analysis technique [Rodgers, 2000] can be usedto quantify biases caused by uncertainties in nonretrievedforward model parameters (such as absorption cross sec-tions), or by inadequacies in the forward model itself (suchas the R-2OS approximation). Here we perform this linear
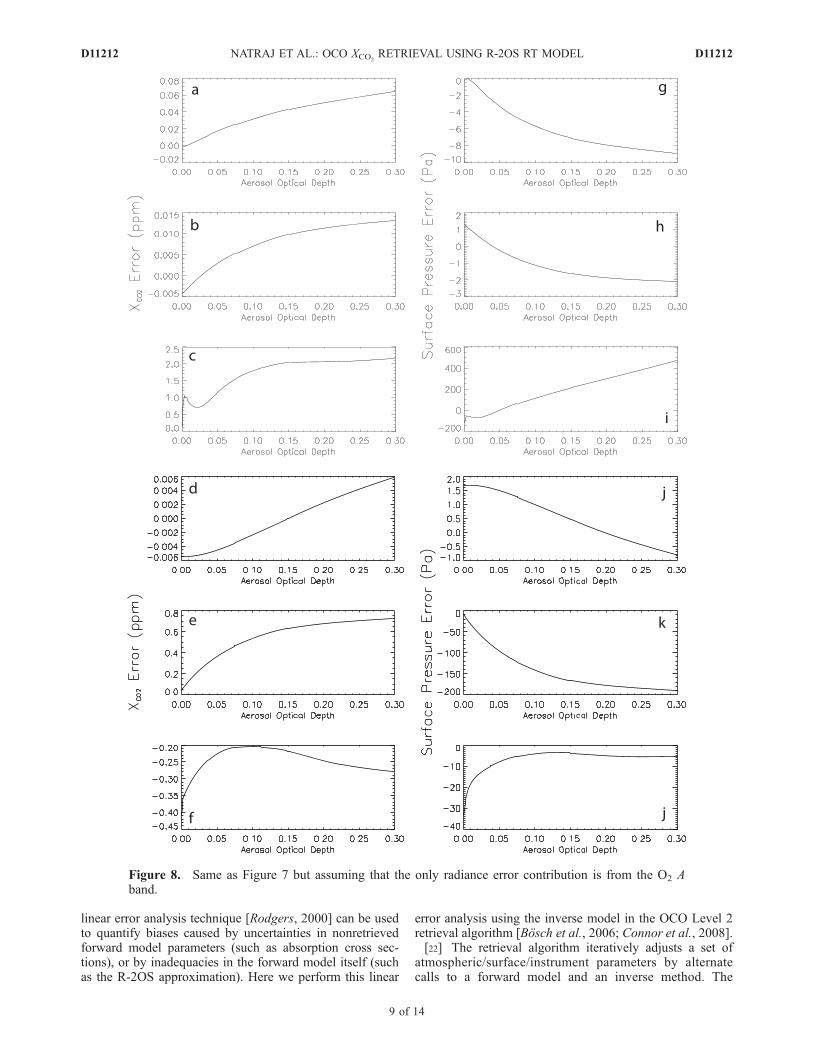
error analysis using the inverse model in the OCO Level 2retrieval algorithm [Bosch et al., 2006; Connor et al., 2008].[22] The retrieval algorithm iteratively adjusts a set of
atmospheric/surface/instrument parameters by alternatecalls to a forward model and an inverse method. The
Figure 8. Same as Figure 7 but assuming that the only radiance error contribution is from the O2 Aband.
D11212 NATRAJ ET AL.: OCO XCO2RETRIEVAL USING R-2OS RT MODEL
9 of 14
D11212
measurement y can be simulated by a forward model f(x):
y ¼ f x;bð Þ þ e; ð2Þ
where x and b represent retrieved and nonretrieved forwardmodel parameters, respectively, and e is themeasurement noise.
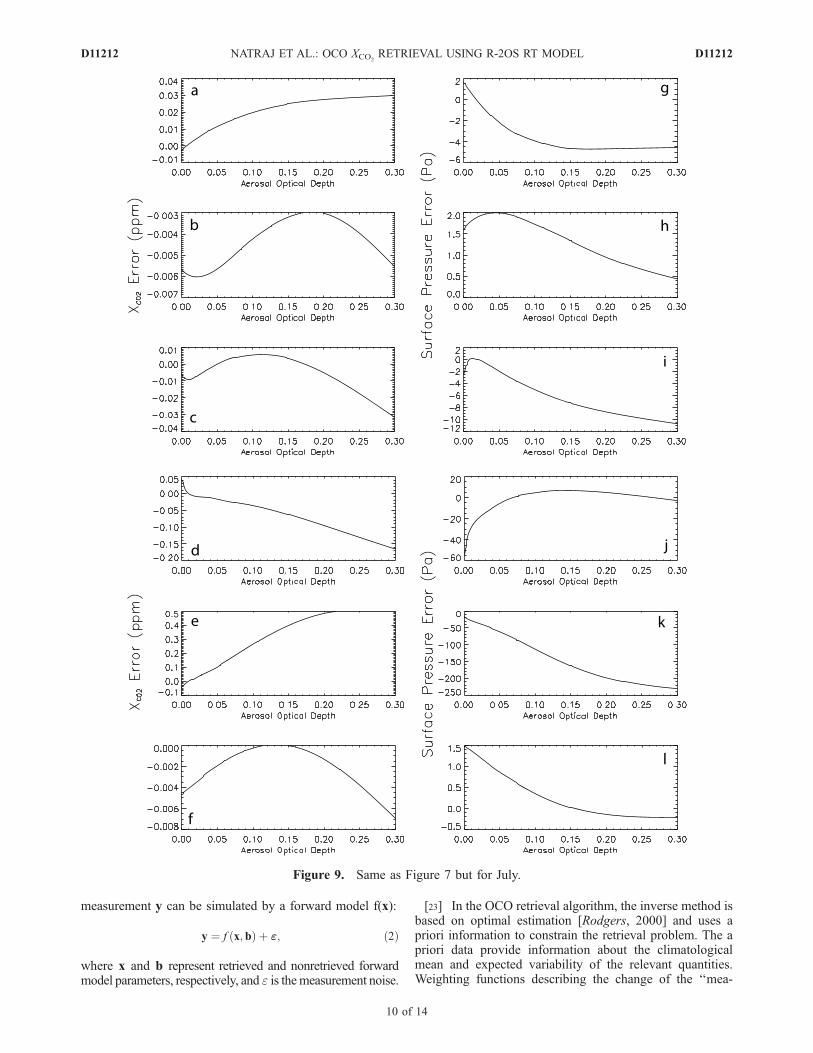
[23] In the OCO retrieval algorithm, the inverse method isbased on optimal estimation [Rodgers, 2000] and uses apriori information to constrain the retrieval problem. The apriori data provide information about the climatologicalmean and expected variability of the relevant quantities.Weighting functions describing the change of the ‘‘mea-
Figure 9. Same as Figure 7 but for July.
D11212 NATRAJ ET AL.: OCO XCO2RETRIEVAL USING R-2OS RT MODEL
10 of 14
D11212
sured’’ spectrum with respect to a change in the retrievedparameters are calculated analytically by repeated calls tothe linearized R-2OS model. The OCO algorithm simulta-neously fits the spectra of the 3 absorption bands, andretrieves a set of 61 parameters for a 12-level atmosphere.
These retrieved elements consist of 4 vertical profiles (CO2
volume mixing ratio (vmr), H2O vmr, temperature andaerosol extinction optical depth), as well as a number ofother elements including surface pressure, surface reflec-tance and its spectral dependence, spectral shift and
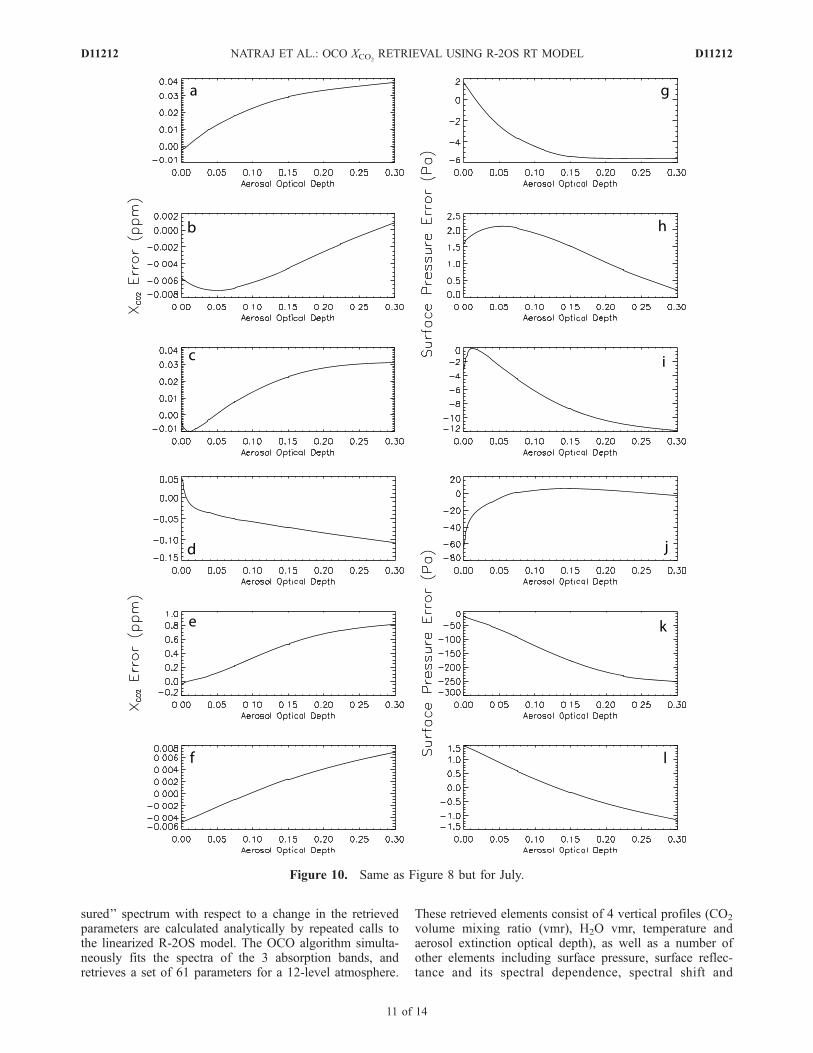
Figure 10. Same as Figure 8 but for July.
D11212 NATRAJ ET AL.: OCO XCO2RETRIEVAL USING R-2OS RT MODEL
11 of 14
D11212
squeeze/stretch. Optimal estimation involves minimizing aregularized cost function c2:
c2 ¼ y� f xð Þ½ TS�1e y� f xð Þ½ þ x� xað ÞTS�1
a x� xað Þ; ð3Þ
where xa is the a priori state vector, Sa is the a prioricovariance matrix and Se is the measurement errorcovariance matrix. The measurement errors are assumedto have no correlation between different detector pixels; thatis, Se is a diagonal matrix. The superscript T indicates thetranspose of the vector.[24] The column-weighted CO2 vmr XCO2
is given by:
XCO2¼ hTx; ð4Þ
where h is the pressure weighting operator [Connor et al.,2008], whose elements are zero for all non-CO2 elements.Clearly, XCO2
depends on the surface pressure and the CO2
vmr profile.[25] In the error analysis, we apply the OCO inverse
model once to a set of simulated spectra calculated assum-ing that the state vector is the truth; that is, we assume thatthe iterative retrieval scheme has already converged. Theretrieval and smoothing errors and the gain matrix arecalculated by the retrieval algorithm. The smoothing errordescribes the error in the retrieved parameters due to thelimited sensitivity of the retrieval to fine structures ofatmospheric profiles. The analysis of smoothing errorsrequires knowledge about the real atmospheric variability;we use an a priori CO2 covariance that represents a total,global variability of 12 ppmv to avoid overconstraining the
retrieval [Connor et al., 2008]. Consequently, the calcu-lated smoothing errors will represent a global upper limit.For all other retrieval parameters, ad hoc a priori con-straints are used, with no cross correlation betweendifferent parameters.[26] Forward model errors are typically systematic and
result in a bias Dx in the retrieved parameters. This bias canbe expressed as:
Dx ¼ GDF; ð5Þ
where G is the gain matrix, that represents the mapping ofthe measurement variations into the retrieved state vectorvariations, and DF is the vector of radiance errors madeusing the R-2OS model. Since OCO measures perpendi-cular to the principal plane, DF has the followingcomponent at wave number nj corresponding to the jthdetector pixel:
DF½ j¼ I nj� �
� Q nj� �� �
� Ivec nj� �
� Qvec nj� �� �
; ð6Þ
where the subscript vec refers to a full vector multiplescattering calculation.[27] The XCO2
errors using the R-2OS model for theJanuary and July scenarios are presented in Figures 7 and8, respectively. Figures 7 and 8 also show the correspondingerrors in surface pressure. With very few exceptions, theXCO2
errors are very small and much below the OCOprecision requirement of 1 ppmv. This is in contrast to theobservation that ignoring polarization generates errors thatcould dominate the error budget for many scenarios [Natrajet al., 2007].
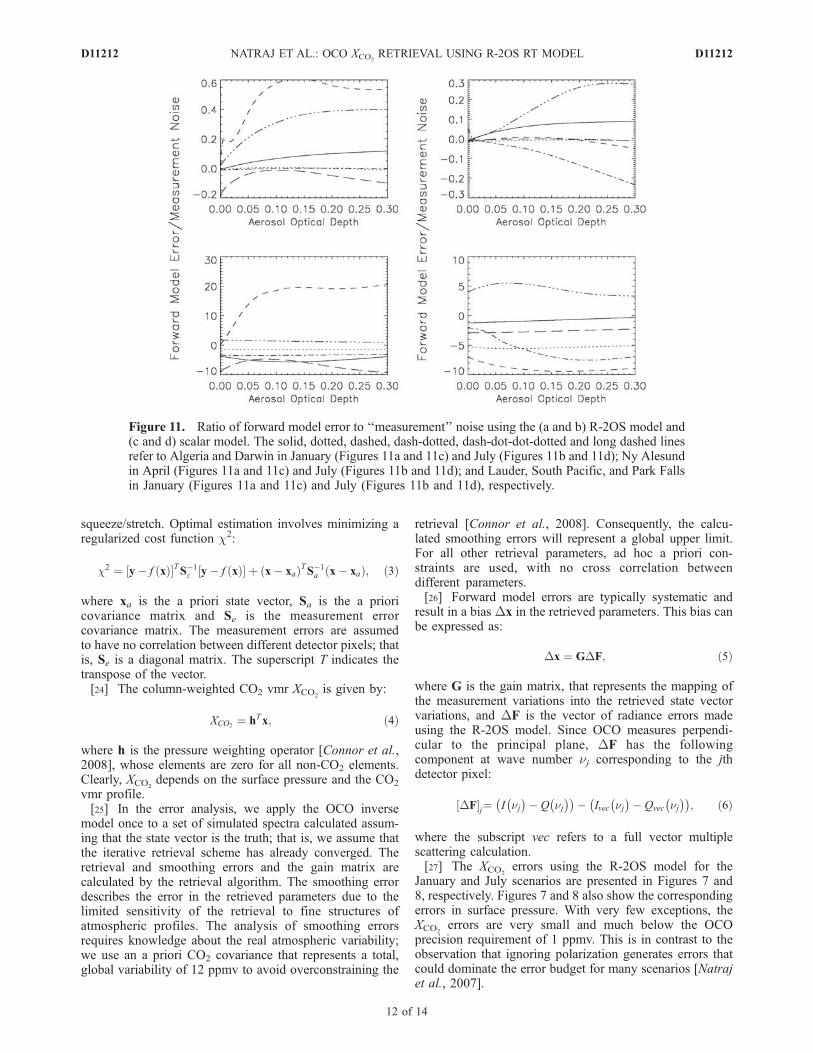
Figure 11. Ratio of forward model error to ‘‘measurement’’ noise using the (a and b) R-2OS model and(c and d) scalar model. The solid, dotted, dashed, dash-dotted, dash-dot-dot-dotted and long dashed linesrefer to Algeria and Darwin in January (Figures 11a and 11c) and July (Figures 11b and 11d); Ny Alesundin April (Figures 11a and 11c) and July (Figures 11b and 11d); and Lauder, South Pacific, and Park Fallsin January (Figures 11a and 11c) and July (Figures 11b and 11d), respectively.
D11212 NATRAJ ET AL.: OCO XCO2RETRIEVAL USING R-2OS RT MODEL
12 of 14
D11212
[28] To understand the error trend, we also plot the errorsin XCO2
and surface pressure assuming that there is noradiance error in the CO2 absorption bands (Figures 9 and10). XCO2
errors have contributions from errors in surfacepressure and CO2 vmr. The former is primarily due toradiance errors in the O2 A band, while the latter comesfrom incorrectly evaluating the radiances in the 1.61 mmCO2 band. There are also cross correlations between thetwo. It is evident from Figures 7–10 that the XCO2
errorsmirror the surface pressure errors for low aerosol amounts.This is to be expected since the maximum radiance errorsare in the O2 A band, as previously noted. As we increasethe aerosol extinction, the errors in the CO2 bands start tobecome more significant. The turnaround at large aerosolextinction optical depths is because of the competing effectsof surface pressure and CO2 vmr errors. In addition, asexpected, there is an inverse correlation between XCO2
andsurface pressure errors. The only exceptions are the winterscenarios in Ny Alesund and Park Falls. These cases havesurface type snow, which is extremely bright in the O2 Aband and extremely dark in the CO2 bands. The very lowalbedo in the 1.61 mm CO2 band causes significant polar-ization and gives rise to positive pressure partials; that is,the TOA radiance increases as we increase surface pressure.[29] The ratio of forward model (FM) error to ‘‘measure-
ment’’ noise is plotted in Figure 11, with the top and bottomrows referring to the R-2OS and scalar models, respectively.The R-2OS forward model error is typically less than 20%of the noise error and only in a few cases exceed 50%. Incontrast, errors using the scalar model exceed unity inalmost all cases and can be up to 20 times larger. Thebehavior of the smoothing errors is very similar and is notplotted here.
6. Conclusions
[30] For high-resolution accurate forward modeling inremote sensing applications, we have developed a jointRT model (R-2OS) which computes intensities using ascalar multiple scattering model along with corrections forpolarization effects by means of a two orders of scatteringRT code. The R-2OS model was employed to simulatebackscatter measurements of spectral bands by the OCOinstrument. A variety of scenarios was considered, repre-senting different viewing geometries, surface and aerosoltypes, and aerosol extinctions. It was found that the errors inthe radiance were an order of magnitude or more less thanthe errors when polarization was neglected. Further, theerror characteristics were largely independent of the aerosoltype.[31] Sensitivity studies were performed to evaluate the
errors in the retrieved CO2 column resulting from using theR-2OS model. It was seen that the XCO2
errors using the R-2OS model were much lower than the smoothing error and‘‘measurement’’ noise. This is in contrast to the observationthat the retrieval error budget could be potentially dominat-ed by polarization if the scalar model was used. Theretrieval error was dominated by incorrect estimation ofthe surface pressure (due to radiance errors in the O2 Aband), with other effects becoming important for largeaerosol amounts. It is worth noting that the 2OS computa-tion adds about 10% to the RT calculation time.
[32] Acknowledgments. The research described in this paper wasperformed for the Orbiting Carbon Observatory Project at the Jet Propul-sion Laboratory, California Institute of Technology, under contracts withNASA. This work was supported in part by NASA grant NAG1-1806. Theauthors would like to thank Hari Nair for assistance with the forward modeland error analysis simulations; Ralph Kahn for discussions on aerosols;Michael Mishchenko, Joop Hovenier and Johan de Haan for providing Tmatrix and Mie codes; Dave Crisp for assistance with detector optics; Run-Lie Shia and Dan Feldman for helpful comments on the manuscript; andtwo anonymous reviewers for suggestions to revise the manuscript.
ReferencesAben, I., F. Helderman, D. M. Stam, and P. Stammes (1999), Spectral fine-structure in the polarisation of skylight, Geophys. Res. Lett., 26(5), 591–594,doi:10.1029/1999GL900025.
Benedetti, A., P. Gabriel, and G. L. Stephens (2002), Properties of reflectedsunlight derived from a Green’s function method, J. Quant. Spectrosc.Radiat. Transfer, 72(3), 201–225, doi:10.1016/S0022-4073(01)00055-3.
Bosch, H., et al. (2006), Space-based near-infrared CO2 measurements:Testing the Orbiting Carbon Observatory retrieval algorithm and valida-tion concept using SCIAMACHYobservations over Park Falls, Wisconsin,J. Geophys. Res., 111, D23302, doi:10.1029/2006JD007080.
Christi, M. J., and G. L. Stephens (2004), Retrieving profiles of atmo-spheric CO2 in clear sky and in the presence of thin cloud using spectro-scopy from the near and thermal infrared: A preliminary case study,J. Geophys. Res., 109, D04316, doi:10.1029/2003JD004058.
Connor, B. J., H. Boesch, G. Toon, B. Sen, C. Miller, and D. Crisp (2008),Orbiting Carbon Observatory: Inverse method and prospective erroranalysis, J. Geophys. Res., 113, D05305, doi:10.1029/2006JD008336.
Crisp, D., et al. (2004), The Orbiting Carbon Observatory (OCO) mission,Adv. Space Res., 34(4), 700–709, doi:10.1016/j.asr.2003.08.062.
Crisp, D., C. E. Miller, and P. L. DeCola (2006), The NASA OrbitingCarbon Observatory: Measuring the column-averaged atmospheric CO2
mole fraction abundance from space, in Proc. SPIE, Sensors, Systems,and Next-Generation Satellites X, 6361, 63610H, R. Meynart, S. P.Neeck, and H. Shimoda (Eds.), doi:10.1117/12.689570.
de Rooij, W. A., and C. C. A. H. van der Stap (1984), Expansion of Miescattering matrices in generalized spherical functions, Astron. Astrophys.,131(2), 237–248.
Gabriel, P., M. Christi, and G. L. Stephens (2006), Calculation of Jacobiansfor inverse radiative transfer: An efficient hybrid method, J. Quant. Spec-trosc. Radiat. Transfer, 97(2), 209–227, doi:10.1016/j.jqsrt.2005.05.060.
Hansen, J. E. (1971), Multiple scattering of polarized light in planetary atmo-spheres. Part II. Sunlight reflected by terrestrial water clouds, J. Atmos. Sci.,28(8), 1400–1426, doi:10.1175/1520-0469(1971)028<1400:MSOPLI>2.0.CO;2.
Hansen, J. E., and L. D. Travis (1974), Light scattering in planetary atmo-spheres, Space Sci. Rev., 16(4), 527–610, doi:10.1007/BF00168069.
Haring, R., R. Pollock, B. M. Sutin, and D. Crisp (2004), The OrbitingCarbon Observatory instrument optical design, in Proc. SPIE - CurrentDevelopments in Lens Design and Optical Engineering V, 5523, P. Z.Mouroulis, W. J. Smith, and R. B. Johnson (Eds.), 51–62, doi:10.1117/12.562693.
Haring, R., R. Pollock, B. M. Sutin, and D. Crisp (2005), Current devel-opment status of the Orbiting Carbon Observatory instrument opticaldesign, Proc. SPIE Int. Soc. Opt. Eng., 5883, 61–70, doi:10.1117/12.617706.
Hasekamp, O. P., J. Landgraf, and R. F. van Oss (2002), The need ofpolarization modeling for ozone profile retrieval from backscattered sun-light, J. Geophys. Res., 107(D23), 4692, doi:10.1029/2002JD002387.
Hovenier, J. W. (1971), Multiple scattering of polarized light in planetaryatmospheres, Astron. Astrophys., 13, 7–29.
Jiang, Y., Y. L. Yung, S. P. Sander, and L. D. Travis (2004), Modeling ofatmospheric radiative transfer with polarization and its application to theremote sensing of tropospheric ozone, J. Quant. Spectrosc. Radiat. Trans-fer, 84(2), 169–179, doi:10.1016/S0022-4073(03)00140-7.
Kahn, R., P. Banerjee, and D. McDonald (2001), Sensitivity of multiangleimaging to natural mixtures of aerosols over ocean, J. Geophys. Res.,106(D16), 18,219–18,238, doi:10.1029/2000JD900497.
Kawabata, K., and S. Ueno (1988), The first three orders of scattering invertically inhomogeneous scattering-absorbing media, Astrophys. SpaceSci., 150(2), 327–344, doi:10.1007/BF00641728.
Kuang, Z., J. S. Margolis, G. C. Toon, D. Crisp, and Y. L. Yung (2002),Spaceborne measurements of atmospheric CO2 by high-resolution NIRspectrometry of reflected sunlight: An introductory study, Geophys. Res.Lett., 29(15), 1716, doi:10.1029/2001GL014298.
Lacis, A. A., J. Chowdhary, M. I. Mishchenko, and B. Cairns (1998),Modeling errors in diffuse-sky radiation: Vector vs. scalar treatment,Geophys. Res. Lett., 25(2), 135–138, doi:10.1029/97GL03613.
D11212 NATRAJ ET AL.: OCO XCO2RETRIEVAL USING R-2OS RT MODEL
13 of 14
D11212
Miller, C. E., et al. (2007), Precision requirements for space-based XCO2
data, J. Geophys. Res., 112, D10314, doi:10.1029/2006JD007659.Mishchenko, M. I., and L. D. Travis (1998), Capabilities and limitations ofa current Fortran implementation of the T-matrix method for randomlyoriented, rotationally symmetric scatterers, J. Quant. Spectrosc. Radiat.Transfer, 60(3), 309–324, doi:10.1016/S0022-4073(98)00008-9.
Mishchenko, M. I., A. A. Lacis, and L. D. Travis (1994), Errors induced bythe neglect of polarization in radiance calculations for Rayleigh-scatteringatmospheres, J. Quant. Spectrosc. Radiat. Transfer, 51(3), 491–510,doi:10.1016/0022-4073(94)90149-X.
Natraj, V., and R. J. D. Spurr (2007), A fast linearized pseudo-spherical twoorders of scattering model to account for polarization in vertically inho-mogeneous scattering-absorbing media, J. Quant. Spectrosc. Radiat.Transfer, 107(2), 263–293, doi:10.1016/j.jqsrt.2007.02.011.
Natraj, V., R. J. D. Spurr, H. Bosch, Y. Jiang, and Y. L. Yung (2007),Evaluation of errors from neglecting polarization in the analysis of O2A band measurements from space, J. Quant. Spectrosc. Radiat. Transfer,103(2), 245–259, doi:10.1016/j.jqsrt.2006.02.073.
Olsen, S. C., and J. T. Randerson (2004), Differences between surface andcolumn atmospheric CO2 and implications for carbon cycle research,J. Geophys. Res., 109, D02301, doi:10.1029/2003JD003968.
Palmer, K. F., and D. Williams (1975), Optical constants of sulfuric acid;application to the clouds of Venus?, Appl. Opt., 14(1), 208–219.
Rayner, P. J., and D. M. O’Brien (2001), The utility of remotely sensed CO2
concentration data in surface source inversions, Geophys. Res. Lett.,28(1), 175–178, doi:10.1029/2000GL011912.
Rodgers, C. D. (2000), Inverse Methods for Atmospheric Sounding: Theoryand Practice, World Sci., Singapore.
Rothman, L. S., et al. (2005), The HITRAN 2004 molecular spectroscopicdatabase, J. Quant. Spectrosc. Radiat. Transfer, 96(2), 139 – 204,doi:10.1016/j.jqsrt.2004.10.008.
Schutgens, N. A. J., and P. Stammes (2003), A novel approach to thepolarization correction of spaceborne spectrometers, J. Geophys. Res.,108(D7), 4229, doi:10.1029/2002JD002736.
Spurr, R. J. D. (2002), Simultaneous derivation of intensities and weightingfunctions in a general pseudo-spherical discrete ordinate radiative transfertreatment, J. Quant. Spectrosc. Radiat. Transfer, 75(2), 129 –175,doi:10.1016/S0022-4073(01)00245-X.
Spurr, R. J. D. (2006), VLIDORT: A linearized pseudo-spherical vectordiscrete ordinate radiative transfer code for forward model and retrievalstudies in multilayer multiple scattering media, J. Quant. Spectrosc.Radiat. Transfer, 102(2), 316–342, doi:10.1016/j.jqsrt.2006.05.005.
Spurr, R. J. D., and M. J. Christi (2007), Linearization of the interactionprinciple: Analytic Jacobians in the ‘‘Radiant’’ model, J. Quant. Spectrosc.Radiat. Transfer, 103(3), 431–446, doi:10.1016/j.jqsrt.2006.05.001.
Spurr, R. J. D., T. P. Kurosu, and K. V. Chance (2001), A linearized discreteordinate radiative transfer model for atmospheric remote-sensing retrie-val, J. Quant. Spectrosc. Radiat. Transfer, 68(6), 689–735, doi:10.1016/S0022-4073(00)00055-8.
Stam, D. M., J. F. De Haan, J. W. Hovenier, and I. Aben (2000), Detectingradiances in the O2 A band using polarization-sensitive satellite instru-ments with application to the Global Ozone Monitoring Experiment, J.Geophys. Res., 105(D17), 22,379–22,392, doi:10.1029/2000JD900313.
Stokes, G. G. (1852), On the composition and resolution of streams ofpolarized light from different sources, Trans. Cambridge Philos. Soc.,9, 399–416.
Wang, M. (2006), Aerosol polarization effects on atmospheric correctionand aerosol retrievals in ocean color remote sensing, Appl. Opt., 45(35),8951–8963, doi:10.1364/AO.45.008951.
Washenfelder, R. A., et al. (2006), Carbon dioxide column abundances atthe Wisconsin tall tower site, J. Geophys. Res., 111, D22305,doi:10.1029/2006JD007154.
World Climate Research Programme (1986), A preliminary cloudlessstandard atmosphere for radiation computation, Rep. WCP-112, WorldMeteorol. Organ., Geneva, Switzerland.
�����������������������H. Boesch, Department of Physics and Astronomy, University of
Leicester, Leicester LE1 7RH, UK.V. Natraj and Y. L. Yung, Division of Geological and Planetary Sciences,
California Institute of Technology, MC 150-21, Pasadena, CA 91125, USA.([email protected])R. J. D. Spurr, RT Solutions Inc., 9 Channing Street, Cambridge, MA
02138, USA.
D11212 NATRAJ ET AL.: OCO XCO2RETRIEVAL USING R-2OS RT MODEL
14 of 14
D11212