retinal image classification using a histogram based approach
TRANSCRIPT
Retinal Image Classification using a Histogram Based Approach
Mohd Hanafi Ahmad Hijazi, Frans Coenen and Yalin Zheng
Abstract— An approach to classifying retinal images using ahistogram based representation is described. More specifically,a two stage Case Based Reasoning (CBR) approach is proposed,to be applied to histogram represented retina images to identifyAge-related Macular Degeneration (AMD). To measure thesimilarity between histograms, a time series analysis technique,Dynamic Time Warping (DTW), is employed. The advocatedapproach utilises two “case bases” for the classification process.The first case base consists of green and saturation histogramswith retinal blood vessels removed. The second case basecomprises the same histograms, but with the Optic Disc (OD)removed as well. The reported experiments demonstrate thatthe proposed two stage classification process outperforms thesingle stage classification process with respect to a number ofevaluation metrics: specificity, sensitivity and accuracy.
I. INTRODUCTION
In this paper a mechanism for classifying retina imagesto identify Age related Macular Degeneration (AMD), themost common cause of reduced vision in people over sixtyyears of age, is described. The mechanism uses a histogrambased approach to represent retina images. The classification,in turn, is founded on a Case Based Reasoning (CBR)mechanism coupled with a Dynamic Time Warping (DTW)technique. A given, pre-labelled, training set is processedso that each retina image is represented by a collection ofhistograms, extracted with respect to the RGB (Red, Greenand Blue) and HSI (Hue, Saturation and Intensity) colourmodels. The number of histograms was reduced by selectingonly the green channel and saturation component histograms.The green channel was selected as it has been show tooffer the best discriminatory power between the main retinalanatomy (blood vessels, fovea and optic disc) and the retinalbackground [1]. Saturation was chosen because it has alsobeen shown to give a good performance in identifying AMDimages, as established by a series of experiments conductedby the authors [2]. These histograms are conceptualisedas time series, i.e. a set of curves. The curves are storedin two Case Bases (CBs). The first case base (CB1)comprises green and saturation histograms generated fromretina images that have been enhanced and had blood vesselpixels removed. The second case base (CB2) comprisesgreen and saturation histograms from retina images that havebeen further processed by removal of the Optic Disc (OD)pixels. Removed pixels are replaced with “null” pixels.
Mohd Hanafi Ahmad Hijazi is with the Department of Computer Sci-ences, The University of Liverpool, Liverpool, L69 3BX (phone: +44 151795 4294; email: [email protected]).
Frans Coenen is with the Department of Computer Sciences, The Univer-sity of Liverpool, Liverpool, L69 3BX (phone: +44 151 795 4253; email:[email protected]).
Yalin Zhang is with the Unit of Ophthalmology, School of ClinicalSciences, The University of Liverpool, Liverpool, L69 3GA (phone: +55151 706 4083; email: [email protected]).
The classification is a two stage process. During the firststage “unseen data” is classified by finding the most similarmatch in CB1. (The unseen data is usually presented as acollection of retina images, rather than a single image.) Thesimilarity matching is conducted using the DTW technique.For those unseen images that can be classified with a certaindegree of certainty the process stops. For the remainingimages that cannot be classified with any certainty theprocess is repeated with CB2. CB2 is not used immediatelybecause the optic disc removal process, in some cases, has theeffect of removing significant pixels. The results presented inthis paper demonstrate that this two pass approach producesbetter results than when using a one pass approach (usingeither CB1 or CB2 in isolation).
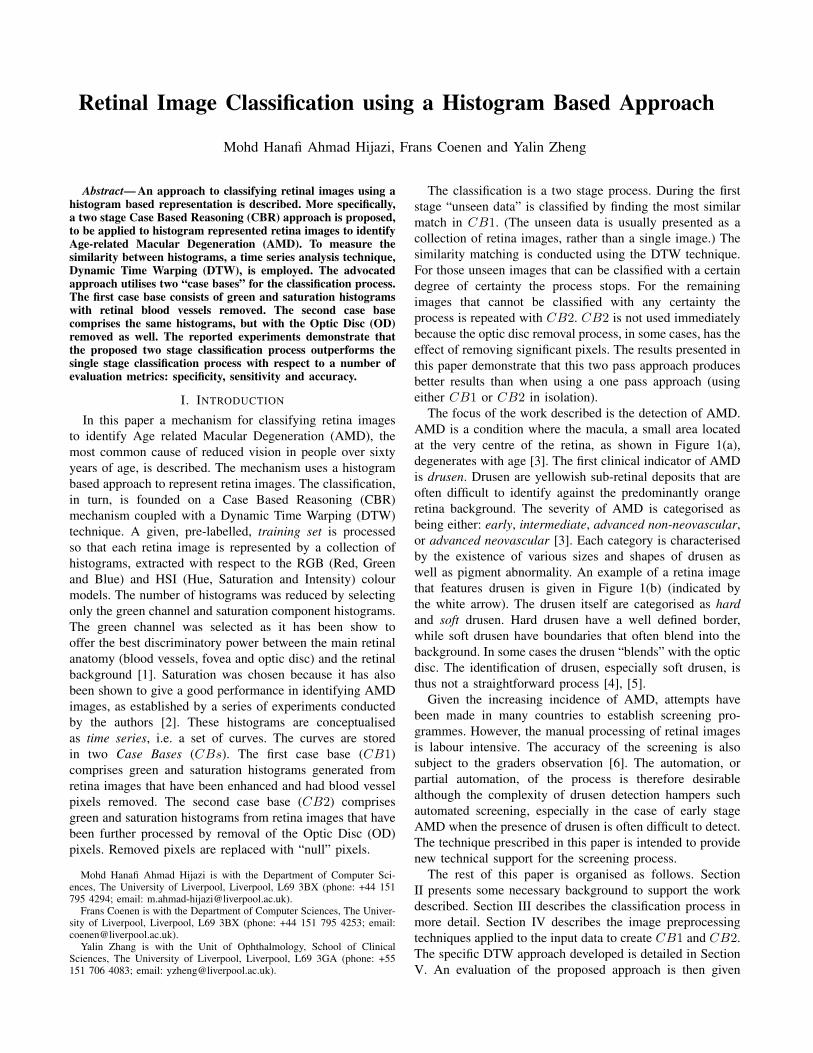
The focus of the work described is the detection of AMD.AMD is a condition where the macula, a small area locatedat the very centre of the retina, as shown in Figure 1(a),degenerates with age [3]. The first clinical indicator of AMDis drusen. Drusen are yellowish sub-retinal deposits that areoften difficult to identify against the predominantly orangeretina background. The severity of AMD is categorised asbeing either: early, intermediate, advanced non-neovascular,or advanced neovascular [3]. Each category is characterisedby the existence of various sizes and shapes of drusen aswell as pigment abnormality. An example of a retina imagethat features drusen is given in Figure 1(b) (indicated bythe white arrow). The drusen itself are categorised as hardand soft drusen. Hard drusen have a well defined border,while soft drusen have boundaries that often blend into thebackground. In some cases the drusen “blends” with the opticdisc. The identification of drusen, especially soft drusen, isthus not a straightforward process [4], [5].
Given the increasing incidence of AMD, attempts havebeen made in many countries to establish screening pro-grammes. However, the manual processing of retinal imagesis labour intensive. The accuracy of the screening is alsosubject to the graders observation [6]. The automation, orpartial automation, of the process is therefore desirablealthough the complexity of drusen detection hampers suchautomated screening, especially in the case of early stageAMD when the presence of drusen is often difficult to detect.The technique prescribed in this paper is intended to providenew technical support for the screening process.
The rest of this paper is organised as follows. SectionII presents some necessary background to support the workdescribed. Section III describes the classification process inmore detail. Section IV describes the image preprocessingtechniques applied to the input data to create CB1 and CB2.The specific DTW approach developed is detailed in SectionV. An evaluation of the proposed approach is then given
(a)
(b)
Fig. 1. (a) Normal and (b) AMD retinal images in greyscale. The circledarea indicates the Macula. The white arrow indicates drusen
in Section VI, followed by some conclusions presented inSection VII.
II. PREVIOUS WORK
There are a number of references to image classificationand retrieval using histogram comparison techniques thathave been reported in the literature, examples include [7],[8], [9]. The fundamental idea is to encode the colourinformation in an image as a feature vector and then representthe vectors as histograms. The distinguishing element ofthese methods is the similarity measures utilised to comparehistograms; examples include Earth Mover’s Distance (EMD)[10], Manhattan distance (L1) and Euclidean distance (L2)[11].
The above histogram comparison techniques assume thatthe collection of histograms each have an equal number ofsample points, time series analysis techniques are directedat more varied categories of sequential data representation.For example Al-Aghbari [7] proposed a time series analysisapproach to address the histogram based image classificationproblem, which has similarities with the work reported inthis paper. Using a time series data representation, calledSymbolic Aggregate approXimation (SAX), and the K-nearest neighbour technique for classification, the results in[7] demonstrated a promising approach to the use of timeseries analysis for image mining. The distinction between
Al-Aghbari’s approach and that presented in this paper isin terms of the time series data representation and theclassifier used. High data dimensionality is not an issuewith respect to colour histograms as the length of the timeseries data is bounded (typically to 256 sample points). Theapproach described here can thus use a “normal” histogramrepresentation. A DTW technique has been proposed in thispaper to compare histograms.
Histograms can be generated from images in a numberways. The most straight forward is to to generate sets ofhistograms from the three colour channels used to representimages (Red-Green-Blue or RGB). Another option is to useHue-Saturation-Intensity (HSI) values. Experiments reportedin [4], [12] and [1], have shown that the most appropriatecolour channel for object identification (including drusen)in retina images is the Green colour channel. Since theclassification of AMD images is entirely based on the retinalcolour distribution which will be severely affected by thequality of the captured images, this paper proposes theuse of saturation histograms for additional coroboration.Saturation was selected, as opposed to hue or intensity, asit also demonstrated good performance in identifying AMDin retinal images, this was established through a series ofexperiment conducted by the authors and reported in [2].
CBR [13] is an established AI technique founded on theobservation that humans solve new problems by referringback to similar problems they have solved in the past, i.e. aCase Base of past cases. Given a new case a CBR systemwill find the most similar past cases (or cases) in its CaseBase and present the solution(s) to the identified case(s) assolution(s) to the new case. One of the most significant issuesin CBR is the nature of the similarity checking mechanismsused to identify similar cases in the Case Base. In the workdescribed here we use a DTW technique.
DTW [14] is a time series analysis technique [15] forcomparing two curves and generating a similarity measure.It uses a dynamic programming approach to align two timeseries and then generates a “warping path” that maps (aligns)the two sequences onto each other. Further details on the useof DTW, in the context of this paper, are given in Section V.
III. RETINA IMAGE CLASSIFICATION PROCESS
An overview of the retina image classification process,to identify AMD, is presented in this section. The processcan be conceptualised as a two stage process: (i) case basegeneration, and (ii) classification of unseen data.
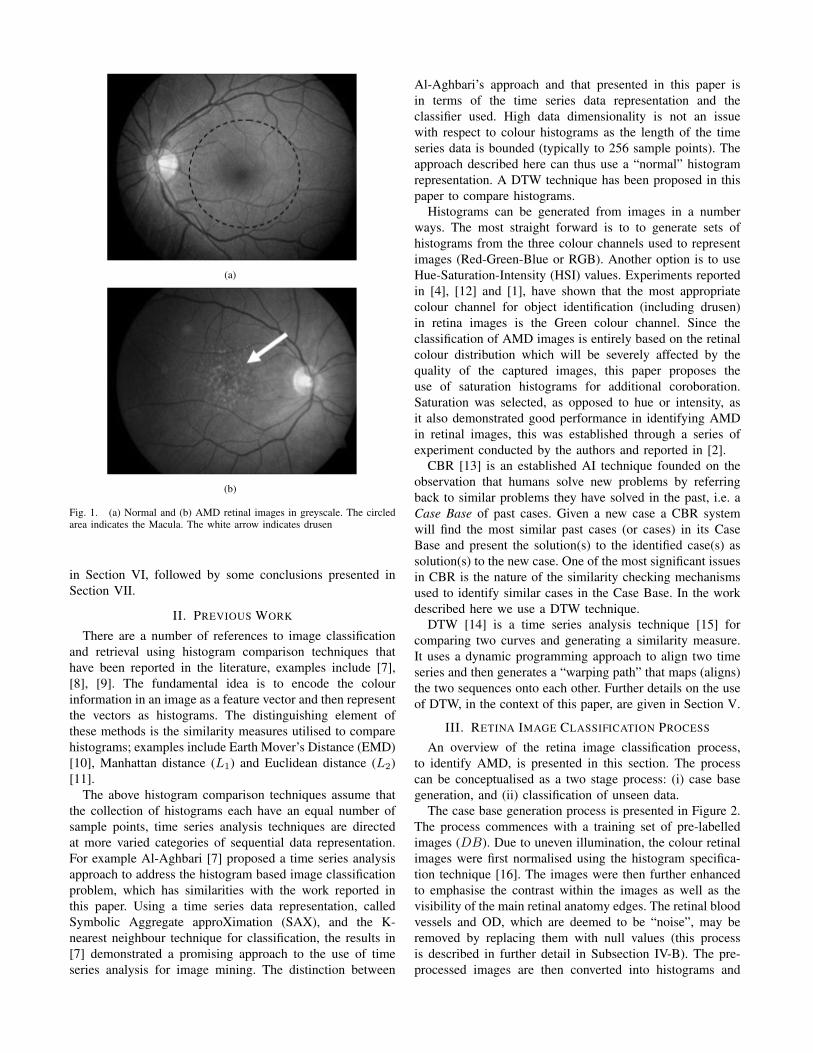
The case base generation process is presented in Figure 2.The process commences with a training set of pre-labelledimages (DB). Due to uneven illumination, the colour retinalimages were first normalised using the histogram specifica-tion technique [16]. The images were then further enhancedto emphasise the contrast within the images as well as thevisibility of the main retinal anatomy edges. The retinal bloodvessels and OD, which are deemed to be “noise”, may beremoved by replacing them with null values (this processis described in further detail in Subsection IV-B). The pre-processed images are then converted into histograms and
the green and saturation histograms retained (for reasonsdescribed in Section II above. These are then convertedinto time series (curves) and stored in the first case base(CB1). The images are then processed further and the opticdisc removed and replaced with null pixels. It should benoted that removal of the optic disc is not 100% accurate,especially in images of severely damaged retinas. However,the classification of images with severely damaged retinas isrelatively straightforward. Thus the expectation is that suchimages will be classified solely with reference to CB1 andwill not need to reference the second case base (CB2); theckassification process is described in further detail below.Once the second image pre-processing stage is complete,a second set of histograms are produced (again green andsaturation only) and CB2 generated.
Fig. 2. Case base generation
Once both CB1 and CB2 are in place the classificationof unseen data can commence. The process (Figure 3), likethe case base generation process described above, is a twostage process. The process commences with a collection ofone or more retina images to be labeled as AMD or notAMD. These are initially pre-processed in the same wayas before to enhance the images and remove blood vesseldata. These are then passed to a “Case Based Reasoner”which interacts with CB1 to find the most similar curves in
the case base. Comparison is undertaken using the proposedDTW technique (see Section V). The curves for the currentretina image are compared with those in the case base anda similarity measure (σ) produced for each comparison. If:
1) There are no values of σ above a similarity threshold;or
2) More than one curve, with different associated classlabels, have a similar σ,
we go onto stage two. If there is a clear “winner” thelabel for the most similar curve in CB1 is selected andthe classification process, with respect to the current image,stops. Otherwise we go onto stage two. The current imageis processed further and the optic disc removed, and thenpassed to the second ”Case Based Reasoner” which interactswith CB2. Using the same DTW technique as before, thelabel associated with the most similar curve in the case baseis selected as the class for the current retina image.
Fig. 3. Classification process applied to unseen data
IV. IMAGE PREPROCESSING
This section describes the two principle image pre-processes used during the processing of images as describedabove: namely image enhancement (Sub-section IV-A) andnoise elimination (Sub-section IV-B).

A. Image Enhancement
The quality of the retinal images, which are acquired witha digital fundus camera, is heavily effected by factors thatare difficult to control. The most common problem is non-uniform illumination ([17], [18]), where the luminosity andcontrast variability are unevenly distributed across the image.Figure 4(a) shows that the illumination exposure is lowertowards the perimeter of the retina but higher in the middle.This may be caused by number of conditions, such as thesubject’s eye movement and presence of other diseases thatmay block the light reaching the retina (such as cataracts),and retinal colour variations. Thus, colour normalisation andcontrast enhancement are necessary before any diagnosis cantake place.
In this paper, a histogram specification approach wasapplied to normalise the retinal images colour. This approachis used to normalise each image to a desired property, suchas its frequency histogram, to a reference image distribution([16], [18]). First, a reference image that displays the bestcolour distribution and contrast, is carefully selected by atrained clinician. The histograms of the reference image arethen generated. Next, the histograms of the other images areextracted and each of these histograms is tuned to match thereference image histograms. This approach has been provento produced colour normalised retinal images [18]. Figure4(b) shows the colour normalised image of Figure 4(a).
Once the colour is normalised, contrast enhancement is ap-plied to make objects in the retina more visible. One commoncontrast enhancement technique, in the context of histograms,is histogram equalisation (HE). HE spreads out the mostfrequent intensity values to produced a better distributedhistogram. Through this transformation, the contrast of animage is improved globally; unfortunately, the enhancementresults in some bright parts of the image being furtherenhanced to the extent that they are “over exposed” andconsequently edges become less distinct. To overcome thisproblem, Contrast Limited Adaptive Histogram Equalisation(CLAHE) [19] was adopted. CLAHE computes several his-tograms that correspond to different sections of an image andequalise each histograms independently. The authors haveconducted empirical experiments with a variety of histogrambased contrast enhancement techniques (not reported here)from which it was concluded that CLAHE gave the bestperformance. The retina edges and the OD boundary inFigure 4(c), to which CLAHE enhancement has been applied,is clearly more visible and identifiable.
B. Noise Elimination
The identification of fundamental retinal anatomies, suchas retinal vessels and the optic disc, is necessary before anycomplex tasks of identifying pathological entities can be un-dertaken ([4], [5], [20]). Knowledge of the location of thesestructures is often used to provide reference points to whichthe detection of eye related diseases can be related. However,the process is not straightforward because their appearanceson the fundus images are affected by illumination variations
(a)
(b)
(c)
(d)
(e)
(f)
Fig. 4. Retinal green channel image: (a) original image, (b) colournormalised, (c) contrast enhanced, (d) retinal vessels binary image, (e) OpticDisc (OD) segmented binary image and (f) retinal vessels and OD removed
as well as the severity of the retinal disease. With respect toAMD classification the optic disc in particular is sometimesidentified as drusen because they share similar features (bothare yellowish in colour, and brighter when compared to thebackground of the retina). The retinal vessels, on the otherhand, may effect the colour distribution of an image, whichin our case is not desirable. It is has been established, by theauthors, that by focusing only on the colour distribution ofthe retinal background and the sypmtoms of AMD (if any),a better classifier will be produced.
To segment the retinal vessels, a common matched filtersalgorithm as proposed by Chaudhuri et al. [1] was used. Thisapproach has been proved to achieved a good performance ifapplied to a well enhanced image [12]. For the segmentationof retinal vessels, a kernel of size 15 × 15 is generatedand rotated into twelve different orientations (0◦ to 165◦).These kernels are applied to each pixel where only themaximum response is kept for each pixel. To obtain a retinalvessels binary image (Figure 4(d)), the response image isthen thresholded using the Otsu’s threshold algorithm [21].The images with enhancement and blood vessels removedare then used to create CB1
An approach where by the 2D retinal image is projectedonto two 1D signals (representing the horizontal and verticalaxis of the retinal image), similar to that proposed in [22]and [5], was adopted to identify the location of the OD. Thenumber of horizontal and vertical edges together with the

intensity value of a retinal image were used as features tolocalised the OD. Instead of using the original green channelimage, as proposed in [22], the authors propose the uses ofthe retinal vessels image and the enhanced green channelimage to generate the (vertical and horizontal) 1D signals.To identify the horizontal location of the OD, a slidingwindow of double the thickness of the identified main retinalvessel, $, and the image height was used to scan the edgemaps image from left to right and project the image featuresof each window onto the horizontal axis 1D signal. Thehorizontal location of the OD was identified by the maximumpeak of the 1D signal. A vertically sliding window, with thesize of the OD diameter, δ, was then used to scan the imagefrom top to bottom in-line with the OD’s identified horizontallocation. A vertical axis 1D signal was thus produced and thevertical location of the OD identified by the maximum peakof the vertical axis 1D signal. The OD is then segmentedusing a template with a prescribed radius, ρ, whose valueis dependent on the image size. In this paper, the values of$, δ and ρ have been predetermined through experiments($ = 13 pixels, δ = 131 pixels and ρ = 45 pixels). Figure4(e) shows the OD segmented binary image. The identifiedretinal vessels and OD location can then be removed fromthe retinal image (Figure 4(f)). The OD removal process isapplied to create CB2.
V. DYNAMIC TIME WARPING
As noted in Section II DTW is a well established timeseries analysis technique. The particular variation of DTWdeveloped by the authors for comparing retinal histograms isdescribed in this section.
The application of DTW to time series analysis ([23],[24]) is as follows. To map two time series T and S, oflength n and m respectively, where T = t1, t2, ..., tn andS = s1, s2, ...sm, a n-by-m matrix will be formed, wherethe (ith, jth) grid points corresponds to the alignment ordistance between any two points ti and sj . The warpingpath, W , is then the set of matrix elements that identifies amapping between T and S, defined as W = w1, w2, ...wK ,where max(m,n) ≤ K < m+n− 1. The distance d(ti, sj)between two points ti and sj is used to identify potentialwarping paths. There are many distance measure that maybe used, the most common is the Euclidean distance, andthis is the measure used in this paper. Thus,
d(ti, sj) = wk = (ti − sj)2 (1)
The minimal warping path is selected by calculating theminimum cumulated distance between T and S as:
DTW (T, S) = min
√√√√ K∑
k=1
wk
(2)
In this paper, the green channel and saturation componenthistograms are extracted from the colour normalised andcontrast enhanced (as described in Subsection IV-A) retinalimages, represented in the form of histograms. The retinal
blood vessel pixels (generated as described in SubsectionIV-B) are subsequently removed by subtracting the ves-sels intensity value from the generated histograms. Thesehistograms formed the first “case base” CB1 comprising:green, G = g0, g1, ..., gi, and saturation, S = s0, s1, ..., sI ,histograms (where I is the number of case base images andG,S ∈ CB1). Next, the optic disc pixels are removed aswell and formed the second “case base” CB2. New “unseen”images to be classified formed a set of J “new cases”C, comprising: green, G = g0, g1, ..., gJ , and saturation,S = s0, s1, ..., sj , histograms (where J is the number ofunseen images and G, S ∈ C). In the classification stage,each curve in G is compared with the content of G usingDTW. A list of the n most similar g ∈ G (n = 5 in thispaper), sim(g) is produced for each g:
sim(gj) ={(g0, δ
j0
), ...,
(gn, δ
jn
)}(3)
δjn = DTW (gj , gi) (4)
DTW (g, g) is the minimal warping path or distance ofthe green channel “new case” histogram, g ∈ G and itsmost similar green channel “case base” histogram, g ∈ G(equation 2), 0 ≤ i < I and 0 ≤ j < J . Next, a similardistance measuring process is applied to S and S only onn saturation histograms, s ∈ S, which are deemed as mostsimilar to the unseen image according to sim(g). This stepwill produce a list of saturation curve distances, sim(s), foreach s ∈ S, of length n:
sim (sj) ={(s0, δ
j0
), ...,
(sn, δ
jn
)}(5)
δjm = DTW (sj , si) (6)
Finally, the final list of n most similar cases, cb1 ∈ CB1 foreach c ∈ C is generated as follows:
sim (cj) = {(cb10, µ0) , ..., (cb1n, µn)} (7)
µn =1
2
(δjn + δjn
)(8)
If at least two of cb1 ∈ CB1 of sim(c) have a similar µ, thedistance measure processes (equation 1 to equation 8) willbe applied to CB2. Each “new case”, c ∈ C will then beclassified as belonging to the same class of its most similarhistogram in the second “case base”, cb2 ∈ CB2 . Otherwise,by default, c ∈ C is classified according to the results ofcb1 ∈ CB1.
VI. EVALUATION
To evaluate the proposed retina image classification ap-proach a data set comprising 144 images was used1. 86 ofthe image were known to feature AMD, and the remaining56 were “normal” control images. The images were collectedas part of the ARIA project2. A Ten-fold Cross Validation
1In the context of data mining this is considered to be a relatively smalldata set, however real retina image data to be used for research purposes isdifficult to acquire for reasons of ”ethical approval”.
2http://www.eyecharity.com/aria online/

(TCV) approach was adopted with respect to all the experi-ments. To illustrate the advantage obtained by the proposedprocess five sets of experiments were conducted: the first twowere using the original image histograms, Ior, and enhancedimage histograms, Ien, each, one using CB1 only, one usingCB2 only, and one using the method proposed in this paper(using both CB1 and CB2). Three evaluation metrics wereused: Specificity, Sensitivity and Accuracy. Sensitivitywill measure the effectiveness of the classifier to identifytrue positives (AMD images), while specificity is used tomeasure the performance of the classifier in identifying thenormal control images (true negatives). Accuracy is used tomeasure the overall performance of the classifier in term ofclassifying retinal images correctly according to their class(AMD or normal).
The results of the first two sets of experiments arepresented in Table I. The results show the feasibility ofusing retinal image colour histograms (green and saturationin this paper) in AMD image classification, and a moredistinguished class labels (AMD and normal) can be obtainedthrough image enhancement. This is clearly indicated by anaverage improvement of 2% in all evaluation metrics used.
TABLE IEXPERIMENTAL RESULTS GENERATED USING TCV: (I) ORIGINAL GREEN
AND SATURATION HISTOGRAMS, Ior , AND (II) ENHANCED GREEN AND
SATURATION HISTOGRAMS, Ien
TCV Specificity (%) Sensitivity (%) Accuracy (%)run Ior Ien Ior Ien Ior Ien1 80 40 78 89 79 712 50 67 88 75 71 713 67 67 67 67 67 674 50 67 67 89 60 805 50 67 100 89 80 806 67 50 67 100 67 807 67 33 100 88 86 648 40 60 67 50 57 649 33 50 100 75 71 6410 50 67 50 75 50 71Ave. 55 57 78 79 69 71
The effect of noise removal on the retinal images is shownin Table II. Both CB1 and CB2 achieved better resultscompared to the results given in Table I. From the table it canbe seen that the the use of CB2 only results in better resultsthan when using CB1. CB2 however, fails on a small sub-set of the images because, as noted above, the removal of theOD results in obscuration of drusen and consequently miss-classifications result. As will be demonstrated (Table III), thecombination of the two processes, resolves this problem.
Table III gives the results produced using the proposedapproach. By comparing the results presented in Tables II andIII it can be seen that the proposed two stage histogram basedimage classification process (using both CB1 and CB2)outperforms classification using CB2 only, which in turnoutperforms classification using CB1 only. The combinationof both case bases achieves an average accuracy improvementof 4% and 2% with respect to CB1 and CB2 respectively.
TABLE IIEXPERIMENTAL RESULTS GENERATED USING TCV: (I) CB1, AND (II)
CB2
TCV Specificity (%) Sensitivity (%) Accuracy (%)run CB1 CB2 CB1 CB2 CB1 CB21 40 60 89 89 71 792 67 67 75 88 71 793 67 67 67 78 67 734 67 67 89 89 80 805 67 67 89 67 80 676 50 50 100 89 80 737 33 50 88 100 64 798 60 60 67 67 64 649 50 67 75 88 64 7910 67 67 75 63 71 65Ave. 57 62 81 81 71 73
The improvement in average specificity is 8% and 3% withrespect to CB1 and CB2, and 1% in the case of averagesensitivity. The best average performance recorded is 82%sensitivity.
TABLE IIIEXPERIMENTAL RESULTS GENERATED USING TCV FOR CB1 AND CB2
COMBINED
TCV run Specificity(%) Sensitivity (%) Accuracy (%)1 60 89 792 67 88 793 67 78 734 67 89 805 83 67 736 67 89 807 50 88 718 60 67 649 67 88 7910 67 75 71Average 65 82 75
A thorough analysis of the results found that OD re-moval effected only a small part of the histograms. Figure5 compares a green channel histograms curve before ODremoval (but with blood vessel pixels removed), and afterOD removal. As can be seen from the figure the resultingmodifications of the histogram curves is small. Most of thechanges are located on the right side of the horizontal axisof the histogram. This is expected since most of the OD isconstructed of the brightest pixels in the retinal image. How-ever, the features of DTW that measures distance between apoint in a time series curve to all points in the comparatortime series curve to identify the shortest distance, makes theclassifier sensitive to small changes in the generated curves(sufficient to give an increase in accuracy of 2% as shownin Table III). Consequently, a more distinctive pattern canbe observed between classes (AMD and normal classes) thatreflects the classification performance. It is also worth notingthat all images that went to the second stage classification arethose images where the OD was successfully segmented (i.e.there were no images where the OD could not be identified).

0
0.2
0.4
0.6
0.8
1
1.2
Vessel pixels removed
Vessel and OD pixels
removed
Fig. 5. Green channel histogram curves before and after OD removal
VII. SUMMARY AND CONCLUSIONS
An approach to classify retinal images, in the context ofAMD, using histograms and a DTW comparison techniquehas been proposed in this paper. Two content based his-tograms, green and saturation, were used to represent eachimage. Prior to histograms extraction, pre-processing wasapplied so as to enhance the images and remove unwantednoise (blood vessels, or blood vessels and the OD). Theenhancement was directed at reducing both colour and illumi-nation variation. A 2D matched filter approach was appliedto filter out retinal blood vessels. The main advantage of thistechnique was simplicity. OD removal was achieved using2D to two 1D projection for OD localisation.
The idea of employing a two stage image classificationprocess founded on two case bases has been demonstrated, atleast in the case of the AMD application, to produced betterclassification results than one stage methods. In this paper,the first case base, CB1, comprised histograms without reti-nal blood vessels information. The second case base (CB2)also excluded OD information. The best result achieved wassensitivity of 82%. It is worth noted that in other work [6],the mean sensitivity achieved through graders observation ondifferent set of retinal images was 86%.
The authors intend to take the work forward by applyingan image segmentation technique that will allow differentparts of the retina images to be analised independently.The intention is to focus the classification process on thecentral area of the retinal image (the macula), the most likelylocation for drusen. The authors are also investigating waysto increase the size of the available data set.
REFERENCES
[1] S. Chaudhuri, S. Chatterjee, N. Katz, M. Nelson, and M. Goldbaum,“Detection of blood vessels in retinal images using two-dimensionalmatched filters,” IEEE Transactions on Medical Imaging, vol. 8, no. 3,pp. 263–269, 1989.
[2] M. H. A. Hijazi, F. Coenen, and Y. Zheng, “A histogram approach forthe screening of age-related macular degeneration,” in Medical ImageUnderstanding and Analysis 2009. BMVA, 2009, pp. 154–158.
[3] R. D. Jager, W. F. Mieler, and J. W. Mieler, “Age-related maculardegeneration,” The New England Journal of Medicine, vol. 358, no. 24,pp. 2606–2617, 2008.
[4] K. Rapantzikos, M. Zervakis, and K. Balas, “Detection and segmen-tation of drusen deposits on human retina: Potential in the diagnosisof age-related macular degeneration,” Medical Image Analysis, vol. 7,pp. 95–108, 2003.
[5] C. Kose, U. Sevik, and O. Gencalioglu, “Automatic segmentation ofage-related macular degeneration in retinal fundus images,” Computersin Biology and Medicine, vol. 38, pp. 611–619, 2008.
[6] S. Jain, S. Hamada, W. L. Membrey, and V. Chong, “Screeningfor age-related macular degeneration using nonstereo digital fundusphotographs,” Eye, vol. 20, pp. 471–475, 2006.
[7] Z. A. Aghbari, “Effective image mining by representing color his-tograms as time series,” Journal of Advanced Computational Intelli-gence and Intelligent Informatics, vol. 13, no. 2, pp. 109–114, 2009.
[8] A. Conci and E. M. M. Castro, “Image mining by content,” ExpertSystem with Applications, vol. 23, pp. 377–383, 2002.
[9] P. G. Foschi, D. Kolippakkam, H. Liu, and A. Mandvikar, “Feature ex-traction for image mining,” in International Workshop on MultimediaInformation Systems, 2002, pp. 103–109.
[10] Y. Rubner, C. Tomasi, and L. J. Guibas, “The earth mover’s distanceas a metric for image retrieval,” International Journal of ComputerVision, vol. 40, no. 2, pp. 99–121, 2000.
[11] R. Brunelli and O. Mich, “Histograms analysis for image retrieval,”Pattern Recognition Letters, vol. 34, pp. 1625–1637, 2001.
[12] A. A.-H. A.-R. Youssif, A. Z. Ghalwash, and A. A. S. A.-R. Ghoneim,“Optic disc detection from normalized digital fundus images by meansof a vessel’s direction matced filter,” IEEE Transactions on MedicalImaging, vol. 27, no. 1, pp. 11–18, 2008.
[13] J. Kolodner, Case-based reasoning. Morgan Kaufmann, 1993.[14] C. S. Myers and L. R. Rabiner, “A comparative study of several
dynamic time-warping algorithms for connected word recognition,”The Bell System Technical Journal, vol. 60, no. 7, pp. 1389–1409,1981.
[15] J. D. Cryer and K.-S. Chan, Time Series Analysis: With Applicationsin R. Springer, 2008.
[16] R. C. Gonzalez and R. E. Woods, Digital image processing, R. C.Gonzalez and R. E. Woods, Eds. Pearson Prentice Hall, 2008.
[17] M. Foracchia, E. Grisan, and A. Ruggeri, “Luminosity and contrastnormalization in retinal images,” Medical Image Analysis, vol. 9, pp.179–190, 2005.
[18] A. Osareh, “Automated identification of diabetic retinal exudates andthe optic disc,” Ph.D. dissertation, University of Bristol, UK, 2004.
[19] K. Zuiderveld, Contrast limited adaptive histogram equalization, ser.Academic Press Graphics Gems Series. Academic Press Professional,Inc., 1994, pp. 474–485.
[20] N. Patton, T. M. Aslam, and T. MacGillivray, “Retinal image analysis:Concepts, applications and potential,” Progress in Retinal and EyeResearch, vol. 25, pp. 99–127, 2006.
[21] N. Otsu, “A threshold selection method from gray level histograms,”IEEE Transactions on Systems, Mans and Cybernetics, vol. SMC-9,no. 1, pp. 62–66, 1979.
[22] A. E. Mahfouz and A. S. Fahmy, “Ultrafast localisation of theoptic disc using dimensionality reduction of the search space,” inproceedings of Medical Image Computing and Computer-AssistedIntervention, 2009, pp. 985–992.
[23] D. J. Berndt and J. Clifford, “Using dynamic time warping to findpatterns in time series,” in AAAI Workshop on Knowledge Discoveryin Databases, 1994, pp. 229–248.
[24] E. J. Keogh and M. J. Pazzani, “Derivative dynamic time warping,”in First SIAM International Conference on Data Mining, 2001.