rethinking minority attitudes toward the police - ncjrs · pdf filedepartment of justice and...
TRANSCRIPT

The author(s) shown below used Federal funds provided by the U.S. Department of Justice and prepared the following final report: Document Title: Rethinking Minority Attitudes toward the Police Author(s): Ronald Weitzer, Steven Tuch Document No.: 207145 Date Received: October 5, 2004 Award Number: 2001-IJ-CX-0016 This report has not been published by the U.S. Department of Justice. To provide better customer service, NCJRS has made this Federally-funded grant final report available electronically in addition to traditional paper copies.
Opinions or points of view expressed are those
of the author(s) and do not necessarily reflect the official position or policies of the U.S.
Department of Justice.

Final Technical Report
Rethinking Minority Attitudes toward the Police
Submitted to: National Institute of Justice
Department of Justice Grant no. 2001-IJ-CX-0016
August 1, 2001-October 31, 2003
Ronald Weitzer (PI) & Steven Tuch (Co-PI)
Department of Sociology George Washington University
Washington, DC 20052 202-994-6895
[email protected] [email protected]
June 26, 2004 Views expressed in the report are those of the authors and do not necessarily reflect the official position or policies of the U.S. Department of Justice.
This document is a research report submitted to the U.S. Department of Justice. This report has not been published by the Department. Opinions or points of view expressed are those of the author(s) and do not necessarily reflect the official position or policies of the U.S. Department of Justice.

Summary Report
Rethinking Minority Attitudes toward the Police
National Institute of Justice Grant no. 2001-IJ-CX-0016
Ronald Weitzer & Steven Tuch
Project Objectives
Race is one of the most consistent predictors of attitudes toward and reported experiences of
the police and other criminal justice institutions. Much of the literature on police-citizen relations
documents these race differences, but does not adequately explain them. This literature has
concentrated on individual-level demographic predictors of attitudes and experiences with the police
(with the notable exception of a few studies on neighborhood-level effects). The present study
examined a number of micro- and macro-level factors, in addition to the standard demographic
variables, in order to better understand why race structures attitudes toward the police. More
specifically, the project examined the role of personal experience, knowledge of others’
experiences (vicarious experience), mass media reporting on the police, neighborhood crime
conditions, and several demographic factors.
Data and Methods
Data for this study come from a national survey of white, African American, and Hispanic
residents of U.S. metropolitan areas (N = 1,792 adults). The sample is representative of adults
living in telephone households in urban and suburban areas with at least 100,000 population. The
survey instrument was pretested twice, and revised after each pretest, and subsequently
iThis document is a research report submitted to the U.S. Department of Justice. This report has not been published by the Department. Opinions or points of view expressed are those of the author(s) and do not necessarily reflect the official position or policies of the U.S. Department of Justice.

administered to the full sample in 2002. Under supervision of the principal investigators, the
survey was administered to respondents by Knowledge Networks, Inc. (KN), which provided the
full data set and a report to the investigators. KN is an innovative and highly respected web-based
survey research firm that combines probability sampling with the reach and capabilities of the
Internet to yield representative samples of respondents without sacrificing data quality. Research
comparing the quality of data yielded by KN’s survey methodology with that of random digit dial
(RDD) telephone surveys has found that KN yields representative samples that produce parameter
estimates very similar to the estimates of RDD samples.
The survey is distinctive in several key respects: (1) it has large subsamples of African
Americans and Hispanics, in contrast to the small number of minority respondents in most
surveys of police-citizen relations; (2) it includes a number of questions never or rarely asked in
prior studies; (3) it focuses on both respondents’ attitudes and experiences with the police; (4) it
examines perceptions and experiences in both the respondent’s neighborhood and elsewhere in
their city of residence; and (5) it includes both fixed-choice and open-ended questions.
Independent variables include race/ethnicity, other demographic variables, neighborhood
crime conditions, personal/vicarious experience with police misconduct, personal/vicarious
experience with racially biased police conduct, and citizen exposure to mass media reports on
police misconduct.
Four major substantive issues constitute the dependent variables: (1) overall satisfaction with
the police in one’s city and neighborhood (2) perceptions of four types of police misconduct
(corruption, verbal abuse, excessive force, unwarranted stops), (3) perceptions of police racial
bias and discrimination (differential treatment of minority and white individuals, differential
services in minority and white neighborhoods, racial profiling, perceived police prejudice), and
(4) evaluations of and support for a large number of changes or reforms in policing (racial
diversification of police departments, enhanced mechanisms of accountability, ways of increasing
procedural justice during encounters, increasing police sensitivity and responsiveness toward the
iiThis document is a research report submitted to the U.S. Department of Justice. This report has not been published by the Department. Opinions or points of view expressed are those of the author(s) and do not necessarily reflect the official position or policies of the U.S. Department of Justice.

public, and intensification of law enforcement). Each dependent variable is a construct referring
to several types under the general conceptual rubrics of Satisfaction, Misconduct, Racial Bias,
and Reform. Reliability analyses indicated high alpha reliability coefficients for each of the multi-
item dependent variable indices. Both bivariate and multivariate analyses were performed for
each of the four substantive issues.
Major Findings and Conclusions
Major study findings are summarized very briefly below:
(1) Racial differences in attitudes toward the police are found across the four substantive domains
examined. With the exception of overall Satisfaction, these racial differences remain after
controlling for other variables.
African Americans are more critical of the police than whites.
Hispanics are also less likely than whites to hold favorable opinions of the police. On
some issues, they are less likely than African Americans to view the police
negatively, while on other issues they tend to align with blacks. With regard to police
misconduct and racially biased policing, we find that blacks and Hispanics do differ
significantly; on some questions, Hispanics are much less likely to perceive problems
than are blacks. They do not differ statistically from blacks, however, on the issue of
police reform. When it comes to the question of reforming the police, in various
ways, both minority groups are strongly supportive.
Whites, often in large numbers, express positive views of the police. Many whites
reject the idea that police engage the four types of misconduct examined here, and
they tend question whether police discriminate against minorities. More than three-
quarters of whites, for example, believe that police treat Hispanics and blacks the
same as they treat whites. That many whites are skeptical with regard to police racial
iiiThis document is a research report submitted to the U.S. Department of Justice. This report has not been published by the Department. Opinions or points of view expressed are those of the author(s) and do not necessarily reflect the official position or policies of the U.S. Department of Justice.

discrimination, or see it as isolated rather than widespread, is consistent with their
views of racial discrimination elsewhere in American society. For most whites, racial
discrimination in general, and police discrimination in particular, is not a serious
problem in America. Whites are also less likely than Hispanics and blacks to support
various reforms in policing.
(2) Demographic factors, with the exception of race, play a limited role in shaping general
satisfaction with police as well as citizen views on misconduct, racial bias, and reform.
(3) Neighborhood crime conditions exert an effect on some of the dependent variables, especially
satisfaction and misconduct. Personal safety in one’s neighborhood and the perception that crime
is not serious increase overall satisfaction with the police and decrease the perception that police
misconduct occurs frequently.
(4) Citizen experiences with police officers strongly influence citizen attitudes in two areas
explored in this study. Either personal or vicarious experience of police abuse increases citizens’
belief that police misconduct and racially biased policing occur. Experience has mixed effects
regarding overall satisfaction with the police (it depends on the racial group) and it does not
predict support for reforms in policing. Reform preferences are shaped by larger views of the
police (such as the belief that misconduct is widespread), which transcend one’s experiences with
officers. But experience with the police is a fairly robust predictor in two of our areas—perceived
misconduct and racial bias.
(5) The mass media influence perceptions of the police. Repeated exposure to media reports on
police abuse was found to be a strong predictor of perceptions of police misconduct, racialized
policing, and support for reforms. Previous studies have documented the impact of single
incidents of misconduct on coloring the image of the police in a particular city, and our results
extend this finding to persons who are exposed to recurrent media reports over time. The role of
the media has not received the attention it deserves from policing scholars; it may be an important
dimension of any comprehensive explanatory framework of police-citizen relations.
ivThis document is a research report submitted to the U.S. Department of Justice. This report has not been published by the Department. Opinions or points of view expressed are those of the author(s) and do not necessarily reflect the official position or policies of the U.S. Department of Justice.

In sum, our findings address the question of why race structures attitudes toward the police
by highlighting several micro- and macro-level factors that foster or reinforce racial differences in
evaluations of the police. The greater tendency for blacks and Hispanics to hold critical views of the
police is largely a function of their disproportionate adverse experiences with police officers,
exposure to media reports of police abuse, and (less consistently) residence in high-crime
neighborhoods where police practices may be contentious.
While several of the findings could be interpreted as having policy implications, one in
particular is most salient for policy—citizen support for reforms in policing. Prior to this study,
very little was known about the level of public support for specific kinds of reform or about the
determinants of public evaluations of changes in policing.
Our findings identify the kinds of reform that register the greatest public approval. Where
popular support for a specific change is widespread, this may be indicative of a problem that
needs to be addressed. If implemented, the reform (e.g., recording drivers’ race, intensive
sensitivity training, greater monitoring, etc.) may help to reduce the amount of police misconduct
or improve police practices more generally. Moreover, certain kinds of reforms may have a
significant impact on public trust and confidence in the police. Whether or not police practices
actually change (e.g., by hiring more minority officers) certain kinds of reforms may thus be
symbolically important and enhance public confidence in a police department. Finally, reforms
that affect police-citizen encounters (e.g., explaining the reason for a stop) may increase citizen
compliance with the police. Although this effect on citizen demeanor and cooperation has rarely
been studied, the limited data available suggest that citizen behavior is indeed influenced by
officer behavior, and when officers communicate well and treat citizens with respect, citizens
respond in kind. Police can do more to dispel beliefs that stops are racially motivated, for example,
and also prevent altercations with citizens, by offering more information to justify stops. Citizens
are much more likely to cooperate with officers when they are given a reason for the stop, and
people put a premium on officers being polite, listening to citizens, and explaining their actions.
vThis document is a research report submitted to the U.S. Department of Justice. This report has not been published by the Department. Opinions or points of view expressed are those of the author(s) and do not necessarily reflect the official position or policies of the U.S. Department of Justice.

Abstract
Rethinking Minority Attitudes toward the Police
National Institute of Justice Grant no. 2001-IJ-CX-0016
Ronald Weitzer & Steven Tuch
June 26, 2004
This study of citizen attitudes and reported experiences with the police in the United States is based on a nationally representative sample of 1,792 African Americans, Hispanics, and whites. Though citizen attitudes have been surveyed in past research, much remains unknown about the factors that shape relations with the police. The study (1) systematically examined and compared the responses of the three groups (Hispanic opinion of the police has rarely been examined), (2) investigated both attitudes and personal experiences, (3) included an adolescent subsample, and (4) contained a number of questionnaire items never or rarely asked in previous surveys, questions that address key aspects of police-citizen relationships. Data for this study come from a national survey conducted by the authors between October and December, 2002 of residents of U.S. metropolitan areas with at least 100,000 population. The sample is representative of persons living in telephone households in urban and suburban areas that meet this population size criterion. The survey data were collected by Knowledge Networks—an innovative, web-based survey research firm that combines probability sampling with the reach and capabilities of the internet to yield representative samples of respondents without sacrificing data quality. The findings yield important information on the scope and dimensions of problems in the relations between police and minority citizens, data that are crucial to formulating effective policies and remedies to these problems.
This document is a research report submitted to the U.S. Department of Justice. This report has not been published by the Department. Opinions or points of view expressed are those of the author(s) and do not necessarily reflect the official position or policies of the U.S. Department of Justice.

1
Final Technical Report
Rethinking Minority Attitudes toward the Police
National Institute of Justice Grant no. 2001-IJ-CX-0016
Ronald Weitzer & Steven Tuch
June 26, 2004
Relations between the police and minority groups are a continuing problem in the United States
and other multiracial societies. While a majority of the public appears to be satisfied with the police at the
most general level, specific aspects of policing generate more critical assessments. Moreover, surveys
consistently document racial differences in perceptions of the police, with minorities more likely than whites
to harbor negative views. While racial differences have been amply documented, less is known about the
sources of these differences. Our study explored this and related issues through an examination of citizens’
perceptions of police and policing in four major areas: overall satisfaction with the police, perceptions of
police misconduct, perceptions of police racial bias, and evaluations of and support for policing reforms.
EXPLAINING PUBLIC PERCEPTIONS OF THE POLICE
Race is one of the most consistent predictors of attitudes toward the police and other criminal
justice institutions. African Americans are significantly more likely than whites to be dissatisfied with the
police. Much less is known, however, about Hispanics’ views of the police. Do Hispanics take a
This document is a research report submitted to the U.S. Department of Justice. This report has not been published by the Department. Opinions or points of view expressed are those of the author(s) and do not necessarily reflect the official position or policies of the U.S. Department of Justice.

2
perspective similar to that of African Americans, are their views are more closely aligned with those of
whites, or do they take an intermediate position between whites and blacks? Studies that examine
Hispanics’ relations with the police typically focus on Hispanics alone (Carter 1985; Mirande 1981) or in
comparison to whites (Holmes 1998); only a few studies compare all three groups (Bayley and
Mendelsohn 1969; Weitzer 2002). The literature is thus insufficient to determine how Hispanics’
perceptions of the police relate to the modal views of whites and blacks.
Little is also known about the factors (other than race) that influence citizens’ perceptions of the
police. One recent review concluded that “there is no consensus as to which combinations of variables
explain the greatest variance in attitudes toward the police” (Brown and Benedict 2002). Certain factors
(e.g., age) are fairly reliable predictors of attitudes toward the police, but the literature has also produced
mixed findings on the effects of other variables (e.g., social class) (Weitzer and Tuch 2002).
Most of the literature is exclusively centered on individual-level, demographic characteristics.
The role of other factors remains underexamined, and this is particularly true for “the public’s personal
experiences with the police, what they learn second-hand from friends and acquaintances, and what they
learn from the media” (Gallagher et al. 2001:v). The project examined each of these potential predictors
of perceptions of the police—personal experience, vicarious experience, mass media—in addition to
demographic factors. We investigated how citizens’ views and experiences of the police are shaped by
race and ethnicity, other demographics, neighborhood crime, personal experiences, knowledge of others’
experiences, and exposure to media reporting on the police.
Experiences with the Police
Personal experiences with police officers have at least some influence on general satisfaction with
the police. However, unpleasant contacts tend to have a stronger effect than positive contacts. The former
tend to lower opinions of the police, while the latter may or may not engender favorable views of the
police. Moreover, it appears that police treatment of citizens during encounters has a larger effect on
This document is a research report submitted to the U.S. Department of Justice. This report has not been published by the Department. Opinions or points of view expressed are those of the author(s) and do not necessarily reflect the official position or policies of the U.S. Department of Justice.
3
citizens’ views of the police than the positive or negative outcome of the encounter (e.g., problem
resolution, a citation, an arrest) (Tyler 1990; Tyler and Huo 2002). When police treat citizens in a
discourteous, brusque, or unfair manner, this experience colors not only citizens’ assessments of the
immediate encounter but also their overall opinions of the police (Reisig and Chandek 2001; Skogan and
Hartnett 1997; Wortley et al. 1997). There also appears to be variation by race. African Americans are
more likely than whites to report negative experiences with, and to feel that they have not received fair
treatment from, the police (Tyler and Huo 2002; Walker et al. 1972).
Personal experience is not a necessary condition for evaluating the police. Some persons who
have had no contact with officers still view police negatively. For example, far more people believe that
police verbally and physically abuse citizens than the number who report a personal experience with these
actions. Similarly, positive contacts with officers do not necessarily translate into favorable attitudes.
Some people who have had a good interaction with the police still hold very critical views of the police,
and experiences themselves may be colored by preexisting opinions of the police (Brandl et al. 1994).
While personal experience appears to influence at least some types of attitudes for those who have had
contact with police, perceptions are also shaped by other predictors.
One such factor is an individual’s knowledge of other persons’ encounters with the police. Such
information may be internalized and “vicariously experienced” by an individual and may be
communicated to yet other friends, family members, acquaintances, and neighbors—amplifying the effect
of the initial experience and perhaps reinforcing larger (neighborhood, subcultural) beliefs about the
police. Researchers have rarely explored the frequency and effects of such vicarious experience, but it is
likely that minorities are more likely than whites to know someone who has had a negative interaction
with the police. We expected that both personal and vicarious experiences with abusive police behavior
will increase negative perceptions of the police, and that such experience will have a more pronounced
effect on the attitudes of blacks and Hispanics than on whites.
This document is a research report submitted to the U.S. Department of Justice. This report has not been published by the Department. Opinions or points of view expressed are those of the author(s) and do not necessarily reflect the official position or policies of the U.S. Department of Justice.
4
Mass Media Reporting on the Police
It is reasonable to expect public opinion regarding the police to be shaped by media reports on
police actions, though this has rarely been studied. Indeed, it is surprising that researchers have given so
little attention to media influences on citizens’ views of the police, especially in light of the abundant
research documenting media influences on citizens’ views of crime and fear of crime. Some research has
found that attitudes toward police appear to be influenced by media coverage of incidents of police
misconduct. These studies document an increase in negative views of the police immediately after news
coverage of brutality incidents (such as Rodney King) or corruption scandals (such as the Rampart
Division scandal in Los Angeles) (Kaminski and Jefferis 1998; Sigelman et al. 1997; Tuch and Weitzer
1997; Weitzer 2002).
If exposure to media reports on a single incident of police misconduct influences public opinion,
cumulative exposure to media coverage of separate instances of abuse should also affect citizens’ views
of the police. The study therefore treated the frequency of consumption of media reports on misconduct as
a possible predictor of citizens’ views of the police.
Neighborhood Crime Conditions
The present study examined the effect of selected aspects of neighborhood context, but only to a
limited extent. Research designs best suited to the examination of neighborhood-contextual effects are
single-city case studies, where the number of neighborhoods, and the number of respondents in each
neighborhood, is substantial (Sampson and Bartusch 1998). As a national-level survey, our study did not
focus on neighborhoods. However, some questionnaire items did ask respondents about certain
neighborhood-level factors, namely neighborhood crime conditions. Such conditions may affect at least
some types of citizen attitudes toward the police—such as overall satisfaction or assessments of the job
performance of the police in one’s city and neighborhood. Such conditions include the amount or
seriousness of crime, residents’ fear of crime, and personal victimization. Some research has found that
This document is a research report submitted to the U.S. Department of Justice. This report has not been published by the Department. Opinions or points of view expressed are those of the author(s) and do not necessarily reflect the official position or policies of the U.S. Department of Justice.

5
living in a high-crime community lowers residents’ approval of the police—whether the measure is
residents’ perception of neighborhood crime (Reisig and Parks 2000) or officially recorded local crime
rates (Sampson and Bartusch 1998). Regarding residents’ fear of crime, a twelve-city study found that
fear of neighborhood crime increased dissatisfaction toward the police who work in the respondents’
neighborhood (Bureau of Justice Statistics 1999), but overall, the literature reports mixed results on the
association between fear of crime and opinions of the police (Brown and Benedict 2002).
While the literature is inconclusive, there appears to be a slight preponderance of evidence that
neighborhood crime conditions have some influence on residents’ overall satisfaction with the police. But
do neighborhood crime / personal safety also increase the perception that police misconduct is pervasive?
It is possible that our two crime measures are related to local policing problems. High-crime areas are also
the sites where police-community relations tend to be problematic—where police, in their efforts to fight
crime, are more prone to act obtrusively and aggressively against residents. Residents of such areas are
more vulnerable to being stopped on the street, verbally abused, and physically roughed up (Fagan and
Davies 2000; Mastrofski, Reisig, and McCluskey 2002; Smith 1986; Terrill and Reisig 2003). Also more
prevalent in high-crime areas is police corruption—including theft of money or drugs from suspects,
bribe-taking, and falsification of evidence (Mollen Commission 1994). Police appear to cast a wide net of
suspicion in neighborhoods that they view as especially troublesome, resulting in more indiscriminate
treatment and mistreatment of residents (Smith 1986). Police typifications of residents of high-crime
neighborhoods may thus increase the aggregate level of police misconduct toward those residents.
Therefore, we expect perceptions regarding police misconduct to be influenced by residents’ personal
safety (a proxy for fear of crime) and assessment of the seriousness of crime in their neighborhood.
* * * * *
Based on the literature reviewed above, we predicted that—net of other variables—attitudes
toward the police and policing practices will be affected by:
citizens’ race and ethnicity,
This document is a research report submitted to the U.S. Department of Justice. This report has not been published by the Department. Opinions or points of view expressed are those of the author(s) and do not necessarily reflect the official position or policies of the U.S. Department of Justice.

6
citizens’ personal and vicarious experience of police misconduct,
citizens’ personal and vicarious experience of racially biased police action,
exposure to media reports on police misconduct, and
perceived neighborhood crime conditions.
DATA AND METHODS
Data for this study come from a national survey of the United States conducted by the authors
between October and December, 2002 of white, African American, and Hispanic adult residents of
metropolitan areas (N = 1,792).1 The sample is representative of persons living in telephone households in
urban and suburban areas with at least 100,000 population.2
The survey: (1) had large over-samples of African Americans and Hispanics, in contrast to the
small number of minority respondents in many other surveys of police-citizen relations; (2) included a
number of questions rarely or never asked in prior studies; (3) focused on both attitudes toward and
reported personal and vicarious experiences with the police; (4) examined perceptions and experiences in
both the respondent’s neighborhood and elsewhere in the city; and (5) included both fixed-choice and
open-ended questions. This report summarizes the quantitative findings; the qualitative data will be
presented in other writings.
The survey instrument was pretested twice. After each pretest, the instrument was amended,
including reordering of questions, addition of new questions, and restructuring of other questions. The
investigators also benefited from feedback from NIJ officials and other experts at two formal workshops
on Minority Trust and Confidence in the Police, sponsored by NIJ and held in Washington, DC in 2002
1 We also sampled 310 adolescents aged 13-17, in equal proportions from each racial group. Since the adolescents do not constitute an independent random sample—only those adolescents living in households already selected for inclusion in the sample were eligible—we excluded them from the current analyses. Adolescent responses will be analyzed in a separate context. 2 Only respondents living in cities or suburban areas adjacent to cities were included in the sample because it is cities where policing is likely to be especially salient for residents (Weisheit, Falcone, and Wells 1995).
This document is a research report submitted to the U.S. Department of Justice. This report has not been published by the Department. Opinions or points of view expressed are those of the author(s) and do not necessarily reflect the official position or policies of the U.S. Department of Justice.

7
and 2003. This feedback was utilized in refining the instrument and informing our subsequent data
analysis.
Sampling
The survey was conducted for the authors by Knowledge Networks, Inc. (KN), a web-based
survey research firm that combines probability sampling with the reach and capabilities of the Internet.
The advantages of using the Internet as a mode of survey data collection include economy of cost,
elimination of interviewer-related bias, and fast turnaround, but do these advantages come at the cost of
data quality, either in terms of population coverage or sample representativeness? Fortunately, the answer
is no: research comparing the quality of data yielded by KN’s web-based survey methodology with that of
random digit dial (RDD) telephone surveys has found that KN yields representative samples that produce
parameter estimates very similar to the estimates of RDD samples (Baker et al. 2003a, 2003b; Berrens et
al. 2003; Krosnick and Chang 2001).
Knowledge Networks utilizes list-assisted RDD sampling techniques on a sample frame
consisting of the entire United States telephone population, so any household with a telephone has the
potential to be selected for the KN panel, including computer users and non-users alike. In exchange for
free internet hardware (such as a television set-top box), connectivity (an internet connection paid for by
KN), and on-site installation, participants agree to complete a maximum of 3-4 surveys per month.
Selected households remain on the panel for two to three years. Currently, KN has over 25,000
households in its web-enabled panel.
Panel Representativeness
When using panels for survey research, potential sampling bias can occur at different stages.
First, respondents consent to become panel members; this is referred to as the panel acceptance rate. At
the time of this study, Knowledge Network’s panel acceptance rate was 40 percent, calculated by
This document is a research report submitted to the U.S. Department of Justice. This report has not been published by the Department. Opinions or points of view expressed are those of the author(s) and do not necessarily reflect the official position or policies of the U.S. Department of Justice.

8
standards established by the American Association for Public Opinion Research (AAPOR).3 Second, the
within-survey completion rate—or percentage of panel members who completed our questionnaire among
those who received it—was 67 percent.
Despite KN’s modest panel acceptance rate, the panel is representative of and closely mirrors the
U.S. population on key demographic, geographic, economic, and social characteristics. Four factors
account for the representativeness of the panel. First, as mentioned above, the panel is selected using list-
assisted RDD telephone methodology, providing a probability-based starting sample of telephone
households.4 Second, the panel weights are adjusted to Census demographic benchmarks to reduce error
due to noncoverage of households without telephones and to reduce bias due to nonresponse and other
nonsampling errors. Third, samples selected from the panel for individual studies are selected using
probability methods and sample design weights for each study are calculated based on the specific design
parameters. Fourth, nonresponse and poststratification weighting adjustments are applied to the final
survey data to reduce the effects of nonsampling error. The result is that the weighted demographic
estimates from the Census and the KN panel differ very little across gender, age, race/ethnicity,
education, and region. Moreover, analyses of panel attrition indicate that no significant differences
differentiate those who remain on the panel from those who do not (Dennis and Li 2003).5
Compared to whites, blacks and Hispanics in our sample report significantly less education and
lower incomes; are younger; reside in cities rather than suburbs; live in neighborhoods with more serious
crime; feel less safe in their neighborhoods; report greater exposure to media coverage of police
misconduct; and have more frequent experiences with, and greater perceptions of, both police racial bias
and police misconduct (verbal and physical abuse, improper street stops, and corruption). Blacks and
Hispanics do not differ on income or neighborhood safety/crime, or personal/vicarious experience of
police misconduct, but blacks are more likely than Hispanics to report media exposure to police
3 The AAPOR response rate definitions can be viewed at www.aapor.org. 4 According to the 2000 Census, 98 percent of white households, 95 percent of Hispanic households, and 94 percent of African American households have telephone access. 5 A detailed demographic panel analysis is available at www.knowledgenetworks.com.
This document is a research report submitted to the U.S. Department of Justice. This report has not been published by the Department. Opinions or points of view expressed are those of the author(s) and do not necessarily reflect the official position or policies of the U.S. Department of Justice.

9
misconduct, personal/vicarious experience with racially biased policing, and to perceive the existence of
our four types of police racial bias.
Independent Variables
Race. We use the term “race” broadly to include both racial and ethnic groups—blacks, whites,
and Hispanics. Our sample consists of respondents who self-identify as African American, non-Hispanic
white, or Hispanic on KN’s demographic profile of panel members.6
Experiences with police misconduct. Questionnaire items address both personal and vicarious
experience with several types of police misconduct: unwarranted police stops, use of insulting language,
use of excessive force, and corruption. Each question stipulates the site of misconduct as either the
respondent’s own neighborhood or elsewhere in his/her city (but outside the neighborhood), and with the
exception of the corruption item, the questions examine both personal and vicarious experiences: (1)
“Have you ever7 been stopped by police on the street without good reason?” (2) “Has anyone else in your
household ever been stopped on the street by police without good reason?” (3) “Have the police ever used
insulting language toward you?” (4) “Have the police ever used insulting language toward anyone else in
your household?” (5) “Have police ever used excessive force against you?” (6) “Have police ever used
excessive force against anyone else in your household?” and (7) “Have you ever seen a police officer
engage in any corrupt activities (such as taking bribes or involvement in drug trade)?”8 We used
responses to the four misconduct questions to create two composite indices of experience with
misconduct: personal experiences (questions 1, 3, 5, 7)9 and vicarious experiences (questions 2, 4, 6). The
6 Hispanics were asked to identify their ancestry: 50% were Mexican, 14% Puerto Rican, 3% Cuban, 13% Central or South American, and 22% Caribbean or other Hispanic. Because of the low Ns for some of these groups, the within-Hispanic findings presented below should be considered tentative. It is also for this reason that our primary analyses compare the three main racial groups rather than the Hispanic nationality groups. 7 The recall window (“Have you ever…?”), while frequently used in survey research, is, admittedly, open-ended. Some caution is thus in order in interpreting the personal/vicarious contact findings. 8 Corruption takes many forms, but the two examples in the question are central: bribery is the quintessential form of corruption and the control of drug crimes is especially prone to corrupting the police (Newburn 1999). 9 Observation of police corruption is treated as a personal, rather than vicarious, experience because the actor has
This document is a research report submitted to the U.S. Department of Justice. This report has not been published by the Department. Opinions or points of view expressed are those of the author(s) and do not necessarily reflect the official position or policies of the U.S. Department of Justice.

10
indices are coded such that higher scores reflect more frequent experiences with misconduct. The alpha
reliability coefficient is .78 for the personal experience index, and .86 for the vicarious experience index.
Experiences with police racial discrimination. Personal and vicarious perceived experiences with
discriminatory police behavior were measured by the following questions: “Have you ever felt that you
were treated unfairly by the police specifically because of your race in [your city/your own
neighborhood]?” “Have you ever felt that you were stopped by the police just because of your race or
ethnic background?” Parallel questions tapped vicarious experience, with reference to whether this had
happened to “anyone else” in the respondent’s household.10 Responses to the personal experience
questions were combined to form an index of reported personal experience with police bias; responses to
the vicarious experience questions were combined to create an index of reported vicarious experience
with police bias. The alpha reliability coefficient is .80 for the personal experience index and .84 for the
vicarious index.11
Media exposure. We asked the following question in order to gauge respondents’ exposure to
media accounts of police misconduct: “How often do you hear or read about (on the radio, television, or
in the newspapers) incidents of police misconduct (such as police use of excessive force, verbal abuse,
corruption, and so on) that occur somewhere in the nation?” Response options were “never,” “rarely,”
“sometimes,” and “often” on a 4-point scale coded so that higher scores indicate more frequent exposure.
This item has the advantage of tapping respondents’ specific exposure to reports on police misconduct,
unlike some other studies that measure exposure to media sources more generally.12
personally witnessed it, rather than learning of it from others. 10 Only one type of vicarious experience is measured by our question. It does not include others, such as friends, coworkers, neighbors, etc. 11 Both of our experience-with-police measures (misconduct and racial bias) involve negative contacts with police. We do not examine the influence of positive contacts—something that should be included in future research. 12 Because our media exposure measure is based on respondents’ self-reports, some caution is in order in interpreting media effects. Some self-selection may be involved in exposure to media coverage of the police, with people who are acutely interested being more attentive than others. The media variable is also fairly broad, asking about exposure to reports of police abuse anywhere in the country. An alternative measure would ask specifically about media coverage of incidents in the respondent’s own city.
This document is a research report submitted to the U.S. Department of Justice. This report has not been published by the Department. Opinions or points of view expressed are those of the author(s) and do not necessarily reflect the official position or policies of the U.S. Department of Justice.

11
Controls. We control on several demographic factors: age, in years; gender (1 = male, 0 =
female); place of residence, measured with a dummy variable for central city (coded 1) vs. all other areas
(coded 0); region (1 = south, 0 = nonsouth); education, measured on a 9-point ladder ranging from less
than high school (coded 1) to doctorate degree (coded 9); and household income, measured on a 17-step
ladder ranging from less than $5000 per year (coded 1) to $125,000 or more (coded 17). Respondents’
assessment of neighborhood crime conditions were measured with the following questions: “Overall, how
safe do you feel being alone outside in your neighborhood [during the day/at night]—very safe, somewhat
safe, somewhat unsafe, or very unsafe?” “How serious a problem is crime in your neighborhood—very
serious, somewhat serious, not serious, or not a problem at all?” Responses to these questions are coded
so that higher scores reflect less safety and more perceived neighborhood crime.
Dependent Variables
Four major substantive issues define the dependent variables: (1) overall satisfaction with the
police in one’s city and neighborhood (2) perceptions of police misconduct, (3) perceptions of police
racial bias,13 and (4) evaluations of and support for reforms in policing. The dependent variables are
referred to using the general rubrics of Satisfaction, Misconduct, Racial Bias, and Reform. The specific
questionnaire items measuring each of the four constructs are presented in Tables 1, 3, 6, and 8 at the end
of this report.
Reliability analyses indicated high alpha reliability coefficients for each of the multi-item dependent
variable indices—Satisfaction .92; Misconduct .80; Racial Bias between .73 and .91; Reform between .68
and .79. Below, we summarize both the bivariate and multivariate analyses performed for each of the four
substantive issues.
13 We use the term “racial bias” as a construct referring to differential treatment of individuals and neighborhoods, racial profiling, and police prejudice. We recognize that differential treatment of individuals and neighborhoods may or may not reflect outright racially motivated discrimination.
This document is a research report submitted to the U.S. Department of Justice. This report has not been published by the Department. Opinions or points of view expressed are those of the author(s) and do not necessarily reflect the official position or policies of the U.S. Department of Justice.

12
MAJOR FINDINGS
Satisfaction with Police
To measure citizens’ overall satisfaction with police in their city and neighborhood, respondents
were asked: “In general, how satisfied or dissatisfied are you with the police department in your city?”
and “In general, how satisfied or dissatisfied are you with the police officers who serve your
neighborhood?” Table 1 presents frequencies for these two items. In both city and neighborhood contexts,
satisfaction varies significantly by race. Nearly half of whites are “very satisfied” with the police in their
cities and neighborhoods, compared to only about a quarter of blacks and slightly more than a third of
Hispanics.
Do these racial differences persist net of the influence of other variables? And what other factors
besides race shape satisfaction? To answer these questions, we performed multivariate analyses, fitting
OLS regression models to the data both for the total sample and for each racial group separately (see
Table 2). In the total sample we fit, first, a term for race-ethnicity only and, next, we incremented the
race-only model with the demographic, neighborhood, and policing predictors, in turn. We then fit the
fully-specified model to the data for each group—whites, blacks, and Hispanics—separately, in order to
examine across-group differences in the effects of the predictors on satisfaction with police.
The results from the race-only model (Model 1 in Table 2) were consistent with the findings
reported in Table 1 as well as with the conclusions of other studies: blacks and Hispanics are significantly
more dissatisfied with the police than are whites (the unstandardized regression coefficients were -.782
[p<.001] and -.474 [p<.001] for blacks and Hispanics, respectively).
Do these zero-order effects change once other potentially cogent predictors of attitudes toward
the police are considered? To address this question, we fit the demographic, neighborhood, and policing
variables in blocks. First, we incremented the race-only model with the block of demographic variables;
in this model, the coefficient for blacks was -.523 (p<.001) and for Hispanics -.149 (n.s.). Next, we added
the neighborhood variables; here, the black and Hispanic coefficients were -.286 (p<.001) and .065 (n.s.),
This document is a research report submitted to the U.S. Department of Justice. This report has not been published by the Department. Opinions or points of view expressed are those of the author(s) and do not necessarily reflect the official position or policies of the U.S. Department of Justice.

13
respectively. Finally, we fit the block of policing variables, with the result that neither the black (-.065,
n.s.) nor Hispanic (.029, n.s.) coefficients remained significant. Thus, for blacks, the effect of race on
satisfaction with police persists net of the influences both of demographic and neighborhood factors,
losing significance only when the policing variables are controlled. For Hispanics, on the other hand,
these race differences disappear once the demographic variables are controlled, suggesting that it is the
demographics, not race per se, that shape Hispanics’ views. For blacks, however, the disparity with whites
cannot be accounted for on the basis of demographic factors alone.
Turning to results for the race-specific models, we found that police effectiveness in fighting
crime (as perceived by respondents) is a significant predictor for each racial group: Effective crime-
control increases overall satisfaction with police. This is what we would expect, given that the public
considers crime-fighting the core function of the police—even though officers actually spend more time
on order-maintenance than crime-control per se. It would be surprising indeed if perceived effectiveness
in controlling crime did not affect global satisfaction with the police.
The existence of community policing in one’s neighborhood increases satisfaction with police in
the total sample, and for whites and blacks in the separate sample models. This finding supports the
claims of advocates of community policing, who argue that community policing leads to improved
relations between residents and the police—a claim that has been empirically tested in only a handful of
studies.
Frequent exposure to media coverage of incidents of police misconduct significantly decreases
satisfaction only among African Americans. The perception that police misconduct is widespread in one’s
city or neighborhood decreases overall satisfaction with the police for all three racial groups. People who
believe that police are frequently involved in corruption, verbal abuse, brutality, and unjustified street
stops are inclined to be dissatisfied more generally with their local police.
This document is a research report submitted to the U.S. Department of Justice. This report has not been published by the Department. Opinions or points of view expressed are those of the author(s) and do not necessarily reflect the official position or policies of the U.S. Department of Justice.

14
The results are more mixed for personal and vicarious experiences of police mistreatment.
Personal experience of abuse lowers satisfaction with the police among whites, and vicarious experience
decreases satisfaction among both whites and blacks.
Perceptions of Police Misconduct
Table 3 presents frequencies for each of the items that comprise the indices of perceived
misconduct and experience with such misconduct. Questions 1-4 display respondents’ perceptions of
police use of inappropriate street stops, insulting language, excessive force, and corruption. For each type
of misconduct, blacks are the most likely to harbor negative views, whites are the least likely, and
Hispanics fall between the two. For example, only 16% of whites believe that police often stop people on
the streets of their city without good reason, compared to 54% of blacks and 38% of Hispanics. Regarding
the other types of misconduct, it is particularly noteworthy that almost half of the black respondents
believe that police often engage in excessive force and corruption in their city.
African Americans are also much more likely than whites to take the extreme view that police
misconduct occurs “very often.” Depending on the question, blacks are three to five times more likely to
believe that misconduct frequently occurs in their city and at least three times more likely to say that it
happens very often in their neighborhood. The white-Hispanic gap is also wide, though less so than for
whites and blacks.
The remaining entries in Table 3 present frequencies for our experiential variables—personal and
vicarious experience of street stops, verbal abuse, excessive force, and corruption. In each case, blacks
and Hispanics are more likely than whites to report experience with police misconduct. However, the two
minority groups do not differ appreciably from each other, except with regard to unwarranted street stops.
About a third of African Americans and a fifth of Hispanics report having been stopped by police in their
city without good reason, and nearly as many say that this has happened to someone else in their
household. Blacks may be stopped more often than Hispanics because skin color heightens their visibility.
This document is a research report submitted to the U.S. Department of Justice. This report has not been published by the Department. Opinions or points of view expressed are those of the author(s) and do not necessarily reflect the official position or policies of the U.S. Department of Justice.

15
In addition to the question of whether one has ever experienced some type of police misconduct,
it is important to consider the issue of repeated abuse. Respondents who reported that they had been
subjected to misconduct were asked how many times this had happened. Whites differ from the two
minority groups in their lower vulnerability to such repeated abuses (data not shown in table). Such
repeated experience with police mistreatment is likely to have adverse, cumulative effects on the
recipients and, if others are told about these experiences, on the latter’s vicarious experiences.
People are somewhat less likely to regard police misconduct as common, and to experience some
type of abuse, in their neighborhood than elsewhere in their city, and this is especially the case for blacks
and Hispanics. One explanation for this is the police tendency to regard minorities as being “out of place”
and more “suspicious” when they are observed in areas outside their own neighborhoods, which increases
the chances of street stops and perhaps other abuse in the city context (Fagan and Davies 2000; Weitzer
1999).
The results in Table 3 point to race differences in perceptions of and reported experiences with
police misconduct. To determine if these differences persist after controlling for other variables, we fit
regression models to the data for the total sample (see Table 4) and separately by racial group (see Table
5). The total sample coefficients showed that significant race differences in perceptions of police
misconduct persist net of the influences of the other predictors. Blacks in both the city (b = 1.161, p<.001)
and neighborhood (b = .663, p<.001) contexts are significantly more likely than whites and Hispanics to
believe that police engage in misconduct, and Hispanics (b = .297 and b = .229, respectively, p<.05) are
significantly more likely than whites to hold this belief.14
As a general rule, the demographic factors other than race have fairly limited or inconsistent
effects. Our micro- and macro-level variables, however, have more explanatory power. First, both
14Net of the other predictors: (1) Puerto Ricans perceive significantly higher levels of police misconduct (in both their city and neighborhood) than all other Hispanic groups (the only exception being that no difference exists between Puerto Ricans and Central/South Americans on neighborhood misconduct); and (2) the other nationality groups do not differ among themselves. On the other major dependent variables in this study (Satisfaction, Racial Bias, Reform), we found no significant differences among the Hispanic nationality groups.
This document is a research report submitted to the U.S. Department of Justice. This report has not been published by the Department. Opinions or points of view expressed are those of the author(s) and do not necessarily reflect the official position or policies of the U.S. Department of Justice.

16
personal and vicarious experiences with police misconduct increase the view that misconduct is common
in both city and neighborhood contexts for each racial group.
Second, we expected that frequent exposure to media accounts of police abuse of citizens would
increase the belief that misconduct is common, for each racial group and at both the city and
neighborhood levels. This expectation was supported (with one exception: whites’ views about
neighborhood misconduct). The effect of media exposure—especially among blacks and Hispanics—is
robust, among the strongest effects in each model. Frequent exposure to media accounts of police abuse
has a powerful influence, increasing the belief that police misconduct happens often.
Third, fears about personal safety at night (for whites and blacks) and a belief that neighborhood
crime is serious (for Hispanics) increase the perception that police misconduct occurs frequently at the
city level. But the more salient question is whether neighborhood crime conditions affect perceptions of
the police in the neighborhood context. For all three groups, where neighborhood crime is viewed as
serious, residents are more likely to believe that police misconduct occurs in their neighborhood (blacks
and Hispanics significantly more so than whites). Fears about personal safety during the day (among
whites) and at night (among blacks) also increase the perception of misconduct at the neighborhood level.
As indicated above, high-crime areas are also the sites where police-community relations tend to
be problematic. Police in such areas, in their efforts to fight crime, are more inclined to act aggressively
and indiscriminately against residents, which may thus increase the amount of police misconduct in these
neighborhoods (Smith 1986). This may help to explain the association between the neighborhood crime
situation and perceptions of police misconduct.
A final neighborhood condition was examined in the misconduct analysis. We expected that
residents of neighborhoods with community policing would be less inclined than those living in areas
lacking community policing to believe that police misconduct happens frequently. Community policing
was defined in the questionnaire as follows: “Community policing involves police officers working with
community members to address the causes of crime and to prevent crimes from occurring, rather than just
This document is a research report submitted to the U.S. Department of Justice. This report has not been published by the Department. Opinions or points of view expressed are those of the author(s) and do not necessarily reflect the official position or policies of the U.S. Department of Justice.
17
responding to crimes after they have occurred. Based on this definition, do you think the police in your
neighborhood practice community policing?”
Results show that community policing (as perceived by respondents) indeed makes a difference
in assessments of the level of misconduct in either the respondent’s neighborhood or elsewhere in their
city. Whites and Hispanics who reportedly live in neighborhoods with community policing are less likely
to believe that misconduct occurs frequently in their city, and blacks whose neighborhoods have
community policing are less likely to believe that misconduct is prevalent in their neighborhood.
Consistent with arguments advanced by advocates of community policing, it appears that community
policing does engender better relations between citizens and the police in the neighborhood or more
broadly at the city level.
Perceptions of Police Bias
Table 6 presents distributions on the racial bias items. The first set of questions (Questions 1-6)
asks respondents about police bias toward individuals. A majority of blacks and Hispanics believe that
police in their city treat blacks worse than whites, and treat Hispanics worse than whites. Few whites
share this view; most whites (three-quarters) believe that police in their city treat whites and the two
minority groups “equally.” When asked to compare police treatment of blacks and Hispanics, most
Hispanics, blacks, and whites group the two minority groups together, believing that blacks and Hispanics
are treated similarly by the police. The same racial group patterns are evident with regard to disparate
treatment of neighborhoods populated by different racial groups (Questions 7-9).
Citizen perceptions of police prejudice have almost never been explored in public opinion
surveys. We find that the overwhelming majority of Americans believe that police prejudice is either very
or somewhat common in the United States (Questions 10-12). And a substantial number of people take
the view that police prejudice is “very common” throughout the nation: 60% of blacks, 46% of Hispanics,
and 20% of whites subscribe to this position. Smaller percentages believe that racial prejudice among
This document is a research report submitted to the U.S. Department of Justice. This report has not been published by the Department. Opinions or points of view expressed are those of the author(s) and do not necessarily reflect the official position or policies of the U.S. Department of Justice.

18
police officers is common in the respondents’ own city or neighborhood. The substantial numbers of
blacks and Hispanics who believe that police prejudice is widespread in the nation is consistent with data
on police officers themselves (Jefferson 1988).
Respondents were asked to evaluate racial profiling, with follow-up questions tapping how
firmly these views were held (Questions 13-15). There is substantial consensus that racial profiling is
wrong: 90% of blacks, 73% of whites, and 77% of Hispanics disapprove of the practice. Moreover,
people who disapprove of profiling tend not to alter their positions when confronted with the hypothetical
possibility that profiling “works.” Respondents who disapprove of profiling were asked whether they
would still disapprove if it could be shown “that racial profiling helps to catch criminals.” Substantial
majorities in each group said they would still disapprove of the practice.
Respondents who initially approved of profiling were asked a similar hypothetical question—
whether they would still approve if studies show that it “does not help to catch criminals.” The approvers
were more likely change their views than the disapprovers, when confronted with counter-evidence
regarding profiling: A majority of all three racial groups said they would no longer approve of profiling if
it was shown to be ineffective in catching criminals. Approval thus appears to be softer than disapproval
of profiling.
Large majorities of each group—92% of blacks, 83% of Hispanics, and 70% of whites—believe
that profiling is widespread in the United States (Question 16). A majority of blacks and Hispanics (but
not whites) also believe that profiling is pervasive in their own city (Question 17), but they less so in their
own residential neighborhood (Question 18). This is consistent with prior surveys, which show less
criticism of police serving one’s own neighborhood than elsewhere in their city or nationwide. Few
whites (18%) believe that profiling is widespread in their own neighborhood, probably because so many
white neighborhoods are predominantly or exclusively white.
Most African Americans (8 in 10) believe that black drivers are more likely than whites to be
stopped by police for the same kinds of traffic violations; two-thirds of Hispanics, but only one-third of
This document is a research report submitted to the U.S. Department of Justice. This report has not been published by the Department. Opinions or points of view expressed are those of the author(s) and do not necessarily reflect the official position or policies of the U.S. Department of Justice.

19
whites, concur (Question 19). Virtually the same percentages also believe that Hispanic drivers are more
likely to be stopped than white drivers (Question 20). But, when asked to compare blacks and Hispanics,
fewer people perceive a disparity in stops of members of these two groups (Question 21).
A large gulf separates minorities and whites when it comes to their experiences with racial
discrimination by the police (Questions 22-27). Whether the question refers to being “stopped just
because of your race or ethnic background” or the more general experience of being “treated unfairly by
police specifically because of your race,” significant percentages of Hispanics and blacks, but almost no
whites (1-3%) believe that they have been the victims of discriminatory police treatment. The same
pattern is found for the experiences of others in the respondent’s household. Of course, perceived
experience of police discrimination is not necessarily equivalent to actual discrimination—since the sheer
exercise of police authority (typically in a brusque and authoritarian manner) may be misconstrued as
racial bias by citizens. Still, respondents’ self-reports, in the aggregate, are consistent with the limited
independent evidence—from police records and street observations of police-citizen interactions—
indicating that police indeed tend to target minorities, who are viewed with a high degree of suspicion and
as having criminal propensities. Minorities tend to be stopped more often than whites (Fagan and Davies
2000; Harris 2002) and treated more harshly in encounters (Smith 1986; Terrill and Reisig 2003).
Multivariate analyses, reported in four models in Table 7, indicate that:
race differences remain after controlling for other variables. In all four domains—differential
treatment of individuals and neighborhoods, police prejudice, and racial profiling—blacks and
Hispanics are significantly more likely than whites to adopt a critical view of the police;
in every model, blacks’ are significantly more likely than Hispanics to believe that police racial
bias exists. This indicates that the two minority groups are far from monolithic, at least on the
issue of racially biased policing;
This document is a research report submitted to the U.S. Department of Justice. This report has not been published by the Department. Opinions or points of view expressed are those of the author(s) and do not necessarily reflect the official position or policies of the U.S. Department of Justice.

20
demographic variables other than race have sporadic effects on citizen perceptions of police bias,
with the exception of class effects on perceptions of racial profiling;15
neighborhood crime conditions (perceived seriousness of crime, personal safety) have fairly
limited effects;
exposure to media reports of police misconduct as well as personal and/or vicarious experience
with police discrimination increases perceived police bias with regard to each of the four types—
either for all three groups or for the two minority groups, depending on the issue. The magnitudes
of the standardized coefficients associated with many of these variables indicate that these effects
are among the strongest in the analysis.
Popular Support for Reforms
We expected that blacks and Hispanics would be more likely than whites to support various
reforms in policing. The types of reforms examined include racial diversification of police departments,
enhanced accountability, and measures to increase officer sensitivity toward citizens. The specific items
under each category, and the bivariate results, are presented in Table 8.
In general, support for police reform is more widespread among Hispanics and African Americans
than among whites. For example, very high percentages of blacks and Hispanics favor “early warning”
systems in police departments to help identify officers who receive several citizen complaints16 and more
sensitivity training for police officers to improve their relations with citizens. White support for reforms
varies from substantial to tepid.
After controlling for other variables, race differences in views of police reform remain
15 An earlier study (Weitzer and Tuch 2002) reported class effects on attitudes toward racial profiling among African Americans, with more highly educated blacks expressing more disapproval of the practice and greater belief that it is widespread than less educated blacks. When we selected from our index of profiling attitudes the two questions that we replicated from our earlier study—approval and perceived scope of profiling—we found class effects consistent with the previous findings: higher income blacks are more likely than lower income blacks to disapprove of profiling and higher educated blacks are more likely than their less educated counterparts to believe that profiling is widespread. 16 On early warning systems, see Walker, Alpert, and Kenney (2001).
This document is a research report submitted to the U.S. Department of Justice. This report has not been published by the Department. Opinions or points of view expressed are those of the author(s) and do not necessarily reflect the official position or policies of the U.S. Department of Justice.

21
significant. Specifically, we regressed the three indices of reform preferences—support for racial
diversity, accountability, and sensitive policing—on the demographic and policing predictors, both for the
total sample and for each racial group separately (see Table 9). We found that:
demographic factors, with the exception of race, play a limited role in shaping reform
preferences,
blacks are significantly more likely than whites to endorse every reform,
Hispanics are more likely than whites to favor reforms in police diversity and in sensitive
policing, and
Hispanics and blacks generally do not differ significantly from each other in their views of
reforms. When it comes to policing reforms, the two minority groups are on the same page.
We expected that either personal or vicarious experience with police misconduct would increase
support for police reform among all groups, but especially among blacks and Hispanics. The regression
results provide little support for these predictions. In the total sample, vicarious experience with police
misconduct increases support for police racial diversification, but neither of the experience variables
impacts endorsement of policies to increase police accountability or sensitive policing. Overall, therefore,
experiences with police, whether personal or vicarious, matter little with respect to support for reforms in
policing. As indicated earlier, the literature is somewhat mixed regarding the effect of police-citizen
contact on larger attitudes toward the police. While negative contact has been found to influence general
views of the police, it is by no means a necessary condition for the formation of either general or specific
attitudes.
The mass media, however, does shape public opinion toward police reform. Frequent exposure to
media reports on police abuse is one of the strongest predictors of support for reforms, net of other
factors. People who frequently hear or read about incidents of misconduct, as transmitted by the media,
are inclined to support police reforms, and such media effects are generally stronger among blacks and
Hispanics than among whites. It appears that frequent exposure to such reports leads respondents to
This document is a research report submitted to the U.S. Department of Justice. This report has not been published by the Department. Opinions or points of view expressed are those of the author(s) and do not necessarily reflect the official position or policies of the U.S. Department of Justice.

22
conclude that there are serious problems with their police department, problems that require substantial
changes.
We expected that the perception that police misconduct is common in one’s city or neighborhood
would increase support for reform, and this prediction is generally borne out. Citizens who believe that
corruption, excessive force, verbal abuse, and/or unwarranted stops are a serious problem in their
neighborhood or city are more likely to feel that a host of reforms are necessary to reduce misconduct.
CONCLUSION
Several major conclusions can be drawn from this study:
Racial differences in attitudes toward the police are found across the four substantive domains
examined. With the exception of overall Satisfaction, these racial differences remain after
controlling for other variables.
African Americans are more critical of the police than whites. This finding is supported
by virtually all other studies.
Hispanics are less likely than whites to hold favorable opinions of the police. On some
issues, they are less likely than African Americans to view the police negatively, while on
other issues they tend to align with blacks. With respect to police misconduct and racially
biased policing, blacks and Hispanics do differ significantly, with Hispanics being less
likely to hold negative views. Indeed, on some questions, Hispanics are much less likely
to perceive policing problems than are blacks. With regard to assessments and
preferences concerning reform of the police, however, Hispanics and blacks do not differ
significantly. They are fairly closely aligned in support for a whole host of policing
reforms. These findings are especially noteworthy in light of the fact that few previous
studies of citizen views of policing have examined Hispanics.
This document is a research report submitted to the U.S. Department of Justice. This report has not been published by the Department. Opinions or points of view expressed are those of the author(s) and do not necessarily reflect the official position or policies of the U.S. Department of Justice.

23
Whites, often in large numbers, express positive views of the police. Many reject the idea
that police engage in the types of misconduct and racial bias examined here. Very few
whites believe that the police frequently stop people without cause, abuse citizens
verbally or physically, or engage in corruption. More than three-quarters of whites
believe that police treat Hispanics and blacks the same as they treat whites, and a
majority of whites believe that minority neighborhoods are treated the same as white
neighborhoods.17 That many whites are skeptical with regard to police racial
discrimination, or see it as isolated rather than widespread, is consistent with their views
of racial discrimination elsewhere in American society, such as education, housing, and
employment (Schuman et al. 1997). For most whites, racial discrimination in general, and
police discrimination in particular, is not a serious problem in America—episodic rather
than routine. Whites are also less likely than Hispanics and blacks to support various
reforms in policing.
Demographic factors, with the exception of race, play a limited role in shaping general
Satisfaction with police as well as citizen views on Misconduct, Racial Bias, and Reform.
Neighborhood crime conditions exert an effect on some of the dependent variables, especially
Satisfaction and Misconduct. Personal safety in one’s neighborhood and the perception that crime
is not serious increase overall satisfaction with the police and decrease the perception that police
misconduct occurs frequently. (It should be noted, however, that the national sampling frame
precluded definitive conclusions regarding neighborhood-level effects.)
As a sidebar to the neighborhood issue, police officers who work in the respondents’
neigthborhoods are rated more favorably than police elsewhere in the respondent’s city,
especially by Hispanics and blacks. Police misconduct, for instance, is seen as more
frequent outside one’s neighborhood than inside.
17 The exception is that 70 percent of whites believe that racial profiling is widespread in the United States.
This document is a research report submitted to the U.S. Department of Justice. This report has not been published by the Department. Opinions or points of view expressed are those of the author(s) and do not necessarily reflect the official position or policies of the U.S. Department of Justice.

24
Citizen experiences with police officers during face-to-face contacts strongly influence public
opinion in two areas explored in this study. Either personal or vicarious experience of police
abuse increases citizens’ belief that police misconduct and racially biased policing occur.
Experience has mixed effects regarding overall satisfaction with the police (it depends on the
racial group) and it does not predict support for reforms in policing. Reform preferences are
shaped by larger views of the police (such as the belief that misconduct is widespread), which
transcend one’s experiences with officers. Unlike some other research, which focuses heavily on
the role of personal experience (Tyler 1990; Tyler and Huo 2002), our findings suggest that it is
by no means the sole important factor shaping attitudes toward the police (cf. Brandl et al. 1994).
It is a fairly robust predictor, however, in two of the substantive areas examined here, and has
more mixed effects with regard to overall satisfaction with local police.
The mass media influence perceptions of the police. Repeated exposure to media reports on
police abuse (i.e., excessive force, verbal abuse, corruption) was found to be a strong predictor of
perceptions of police misconduct, racialized policing, and support for reforms. Previous studies
have documented the impact of single incidents of misconduct on coloring the image of the police
in a particular city, and our results extend this finding to persons who are exposed to recurrent
media reports over time. The role of the media has not received the attention it deserves from
policing scholars; it may be an important dimension of any comprehensive explanatory
framework of police-citizen relations.
In sum, our findings speak to the question of why race structures attitudes toward the police. As
indicated earlier, much of the literature documents race differences but does not adequately explain them. Our
data point to the role of several micro- and macro-level factors in fostering or reinforcing racial differences in
evaluations of the police. The greater tendency for blacks and Hispanics to hold critical views of the police is
largely a function of their disproportionate adverse experiences with police officers, exposure to media
This document is a research report submitted to the U.S. Department of Justice. This report has not been published by the Department. Opinions or points of view expressed are those of the author(s) and do not necessarily reflect the official position or policies of the U.S. Department of Justice.

25
reports of police abuse, and (less consistently) residence in high-crime neighborhoods where police practices
may be contentious.
Finally, we wish to comment on one aspect of the study that is particularly novel and that has
perhaps the greatest policy implications—the investigation of popular support for reforms in policing.
Almost all of the research on citizen perceptions focuses on general satisfaction or on particular policing
problems and misconduct, rather than on corrective measures that might help to reduce misconduct or to
improve policing more generally. Perhaps it is simply assumed that the public overwhelmingly favors
reforms: Who wouldn’t want to improve the police? But this is an untested assumption. Little is known
about the level of public support for specific kinds of reform or about the determinants of public
evaluations of changes in policing.
Our findings identify the kinds of reform that register the greatest public approval, which may be
useful in informing public policy. Where popular support for a specific change is widespread, this may be
symptomatic of a problem that needs to be fixed. If implemented, the reform (e.g., intensive sensitivity
training, greater monitoring, recording drivers’ race) may help to reduce the amount of police misconduct
or improve police practices more generally. Moreover, certain kinds of reforms may have a significant
impact on public trust and confidence in the police. Whether or not the reform (e.g., hiring more minority
officers) actually changes police practices, it may be symbolically important and enhance public
confidence in a police department.
Finally, certain reforms have the potential to improve the behavior of officers and citizens during
encounters. A few questions, not included in Tables 8 and 9 because they were miscellaneous, are quite
salient here. For instance, (1) 91% of whites, blacks, and Hispanics agree that the Miranda rights should be
retained; (2) between 92%-96% of the three groups agree with the statement, “When a police officer stops a
person on the street or in a car, the officer should be required to explain to the person the reason for the
stop”; and (3) 77%-88% of the three groups believe that, “When a police officer stops and searches a citizen
and his or her vehicle, and finds no evidence of a crime, the officer should be required to apologize to the
This document is a research report submitted to the U.S. Department of Justice. This report has not been published by the Department. Opinions or points of view expressed are those of the author(s) and do not necessarily reflect the official position or policies of the U.S. Department of Justice.

26
citizen for the inconvenience of the search.” Most members of all three groups strongly agree with each of
these policies. These results confirm what others (using different questions) have reported about the
importance people place on being treated fairly and with respect by officers.
These and other practices (e.g., sensitivity training) can improve police behavior during
encounters, and may increase citizens’ willingness to cooperate with the police. Although this effect on
citizen demeanor and compliance has rarely been studied, the limited data available suggest that citizen
behavior is indeed influenced by officer behavior, and when officers communicate well and treat citizens
with respect, citizens respond in kind. Police can do more to dispel beliefs that stops are racially motivated,
for example, and also prevent altercations with citizens, by offering more information to justify stops.
Citizens are much more likely to cooperate with officers when they are given a reason for the stop, and
people put a premium on officers being polite, listening to citizens, and explaining their actions (Skogan and
Hartnett 1997; Stone and Pettigrew 2000; Tyler and Huo 2002; Wiley and Hudik 1974).
This document is a research report submitted to the U.S. Department of Justice. This report has not been published by the Department. Opinions or points of view expressed are those of the author(s) and do not necessarily reflect the official position or policies of the U.S. Department of Justice.

27
REFERENCES
Baker, Lawrence, M. Kate Bundorf, Sara Singer, and Todd Wagner
2003a. “Validity of the survey of health and Internet and Knowledge Network’s panel and
sampling.” Stanford University. http://www.knowledgenetworks.com/ganp/reviewer-info.html.
2003b. “Use of the Internet and email for health care information: Results from a national
survey.” Journal of the American Medical Association 289:2400-2406.
Bayley, David and Harold Mendelsohn
1969 Minorities and the Police. New York: Free Press.
Berrens, Robert P., Alok Bohara, Hank Jenkins-Smith, Carol Silva, and David Weimer
2003 “The advent of Internet surveys for political research: A comparison of telephone and
Internet samples.” Political Analysis 11:1-22.
Bureau of Justice Statistics
1999 Criminal Victimization and Perceptions of Community Safety in 12 Cities, 1998.
Washington, DC: U.S. Department of Justice.
Brandl, Steven, James Frank, Robert Worden, and Timothy Bynum
1994 “Global and specific attitudes toward the police.” Justice Quarterly 11:119-134.
Brown, Ben, and William Benedict
2002 “Perceptions of the police.” Policing 25:543-580.
Carter, David
1985 “Hispanic perception of police performance.” Journal of Criminal Justice 13: 487-500.
Dennis, J. Michael, and Rick Li
2003 “Effects of panel attrition on survey estimates.” Paper presented at the annual meeting
of the American Association for Public Opinion Research, Nashville, TN.
Fagan, Jeffrey and Garth Davies
This document is a research report submitted to the U.S. Department of Justice. This report has not been published by the Department. Opinions or points of view expressed are those of the author(s) and do not necessarily reflect the official position or policies of the U.S. Department of Justice.

28
2000 “Street stops and broken windows: Terry, race, and disorder in New York City.” Fordham
Urban Law Journal 28:457-49.
Gallagher, Catherine, Edward Maguire, Stephen Mastrofski, and Michael Reisig
2001 The Public Image of the Police. Alexandria, VA: International Association of Chiefs of
Police.
Holmes, Malcolm
1998 “Perceptions of abusive police practices in a U.S.-Mexico border community.” Social
Science Journal 35:107-118.
Jefferson, Tony
1988 “Race, crime, and policing: Empirical, theoretical, and methodological issues.” International
Journal of the Sociology of Law 16:521-539.
Kaminski, Robert, and Eric Jefferis
1998 “The effect of a violent televised arrest on public perceptions of the police.” Policing
21:683-706.
Krosnick, Jon and Lin Chait Chang.
2001 “A comparison of random digit dialing telephone survey methodology with Internet survey
methodology as implemented by Knowledge Networks and Harris Interactive.” Paper presented
at the annual conference of the American Association for Public Opinion Research, Montreal,
Canada.
Mastrofski, Stephen, Michael Reisig, and John McCluskey
2002 “Police disrespect toward the public.” Criminology 40:519-51.
Mollen Commission
1994 Report of the Commission to Investigate Allegations of Police Corruption. New York: Mollen
Commission.
Reisig, Michael and Meghan Chandek
This document is a research report submitted to the U.S. Department of Justice. This report has not been published by the Department. Opinions or points of view expressed are those of the author(s) and do not necessarily reflect the official position or policies of the U.S. Department of Justice.

29
2001 “The effects of expectancy disconfirmation on outcome satisfaction in police-citizen
encounters.” Policing 24:88-99.
Reisig, Michael and Roger Parks
2000 “Experience, quality of life, and neighborhood context.” Justice Quarterly 17:607-29.
Sampson, Robert and Dawn Bartusch
1998 “Legal cynicism and (subcultural?) tolerance of deviance.” Law and Society Review
32:777-804.
Schuman, Howard, Charlotte Steeh, Lawrence Bobo, and Maria Krysan
1997 Racial Attitudes in America. Cambridge: Harvard University Press.
Sigelman, Lee, Susan Welch, Timothy Bledsoe, and Michael Combs
1997 “Police brutality and public perceptions of racial discrimination.” Political Research
Quarterly 50:777-791.
Skogan, Wesley and Susan Hartnett
1997 Community Policing, Chicago Style. New York: Oxford University Press.
Smith, David
1986 “The neighborhood context of crime.” Crime and Justice 8:313-41.
Stone, Vanessa and Nick Pettigrew
2000 The Views of the Public on Stops and Searches. London: Home Office.
Tuch, Steven and Ronald Weitzer
1997 “Racial differences in attitudes toward the police.” Public Opinion Quarterly 61:642-663.
Tyler, Tom
1990 Why People Obey the Law. New Haven: Yale University Press.
Tyler, Tom and Yuen Huo
2002 Trust in the Law. New York: Russell Sage.
U.S. Department of Justice
This document is a research report submitted to the U.S. Department of Justice. This report has not been published by the Department. Opinions or points of view expressed are those of the author(s) and do not necessarily reflect the official position or policies of the U.S. Department of Justice.

30
2001 Principles for Promoting Police Integrity. Washington, DC: Department of Justice.
Walker, Darlene, Richard Richardson, Oliver Williams, Thomas Denyer, and Skip McGaughey
1972 “Contact and support: An empirical assessment of public attitudes toward the police and the
courts.” North Carolina Law Review 51:43-79.
Walker, Samuel, Geoffrey Alpert, and Dennis Kenney
2001 “Early warning systems: Responding to the problem police officer.” Research in Brief.
Washington, DC: National Institute of Justice.
Weisheit, Ralph, David Falcone, and Edward Wells
1995 Crime and Policing in Rural and Small-Town America. Washington, DC: Government
Printing Office.
Weitzer, Ronald
1999 “Citizens’ perceptions of police misconduct.” Justice Quarterly 16:819-846.
2000 “Racialized policing.” Law and Society Review 34:129-155.
2002 “Incidents of police misconduct and public opinion.” Journal of Criminal Justice 30:397-
408.
Weitzer, Ronald and Steven Tuch
2002 “Perceptions of racial profiling: Race, class, and personal experience.” Criminology
40:435-456.
Wiley, Mary G. and Terry Hudik
1974 “Police-citizen encounters: A field test of exchange theory.” Social Problems 22:119-127.
Wortley, Scot, John Hagan, and Ross Macmillan
1997 “Just deserts? The racial polarization of perceptions of criminal injustice.” Law and Society
Review 31:637-676.
This document is a research report submitted to the U.S. Department of Justice. This report has not been published by the Department. Opinions or points of view expressed are those of the author(s) and do not necessarily reflect the official position or policies of the U.S. Department of Justice.

Table 1. Satisfaction with Police “In general, how satisfied or dissatisfied are you with … the police department in your
city?”** the police officers who serve your
neighborhood?”**
Whites Blacks Hispanics Whites Blacks Hispanics Very
satisfied 46% 22% 36% 48% 26% 36%
Somewhat satisfied
40 51 44 39 51 43
Somewhat dissatisfied
11 19 13 9 15 13
Very dissatisfied
3 8 7 4 8 8
N (unweighted) 615 561 605 613 556 598 ** p< .001 (chi-square)
This document is a research report submitted to the U.S. Department of Justice. This report has not been published by the Department. Opinions or points of view expressed are those of the author(s) and do not necessarily reflect the official position or policies of the U.S. Department of Justice.

Table 3. Police Misconduct Perceptions of Misconduct 1. How often do you think police officers stop people on the streets of your [neighborhood/city] without good reason?* Neighborhood City
Whites Blacks Hispanics Whites Blacks Hispanics Very Often 2% 18% 12% 5% 27% 18%
Fairly Often 5 18 15 11 27 20 On Occasion 46 46 46 62 36 51
Never 46 19 27 23 11 11 N 613 554 600 613 558 604
2. How often do you think police officers, when talking to people in your [neighborhood/city], use insulting language against them?* Neighborhood City
Whites Blacks Hispanics Whites Blacks Hispanics Very Often 3% 11% 7% 4% 17% 9%
Fairly Often 4 14 11 5 18 13 On Occasion 36 44 33 48 45 41
Never 57 31 48 43 20 37 N 609 553 592 613 553 594
3. When police officers use force against people, how often do you think they use excessive force (in other words, more force than is necessary under the circumstances) against people in your [neighborhood/city]?* Neighborhood City
Whites Blacks Hispanics Whites Blacks Hispanics Very Often 3% 15% 12% 5% 26% 16%
Fairly Often 4 15 11 8 22 13 On Occasion 38 43 38 59 43 51
Never 55 26 40 29 9 20 N 608 549 593 619 552 599
This document is a research report submitted to the U.S. Department of Justice. This report has not been published by the Department. Opinions or points of view expressed are those of the author(s) and do not necessarily reflect the official position or policies of the U.S. Department of Justice.

4. How common do you think corruption (such as taking bribes, involvement in drug trade) is in your city’s police department?* Whites Blacks Hispanics
Very common 6% 22% 9% Fairly common 11 26 20
Not very common 50 41 47 Not at all common 33 11 24
N 613 555 592 Personal Experiences 5. Have you ever been stopped by police on the street without good reason [in your own neighborhood/elsewhere in your city]?* Neighborhood City
Whites Blacks Hispanics Whites Blacks Hispanics Yes 7% 20% 16% 13% 34% 20% No 93 80 84 87 66 80
N 615 562 604 612 559 598 6. Have the police ever used insulting language towards you [in your own neighborhood/ elsewhere in your city]?* Neighborhood City
Whites Blacks Hispanics Whites Blacks Hispanics Yes 4% 13% 11% 7% 18% 18% No 96 87 89 93 83 83
N 617 561 602 614 559 597 7. Have police ever used excessive force against you [in your own neighborhood/elsewhere in your city]?* Neighborhood City
Whites Blacks Hispanics Whites Blacks Hispanics Yes 2% 7% 5% 3% 9% 9% No 98 93 95 97 91 91
N 617 561 603 613 555 600
This document is a research report submitted to the U.S. Department of Justice. This report has not been published by the Department. Opinions or points of view expressed are those of the author(s) and do not necessarily reflect the official position or policies of the U.S. Department of Justice.
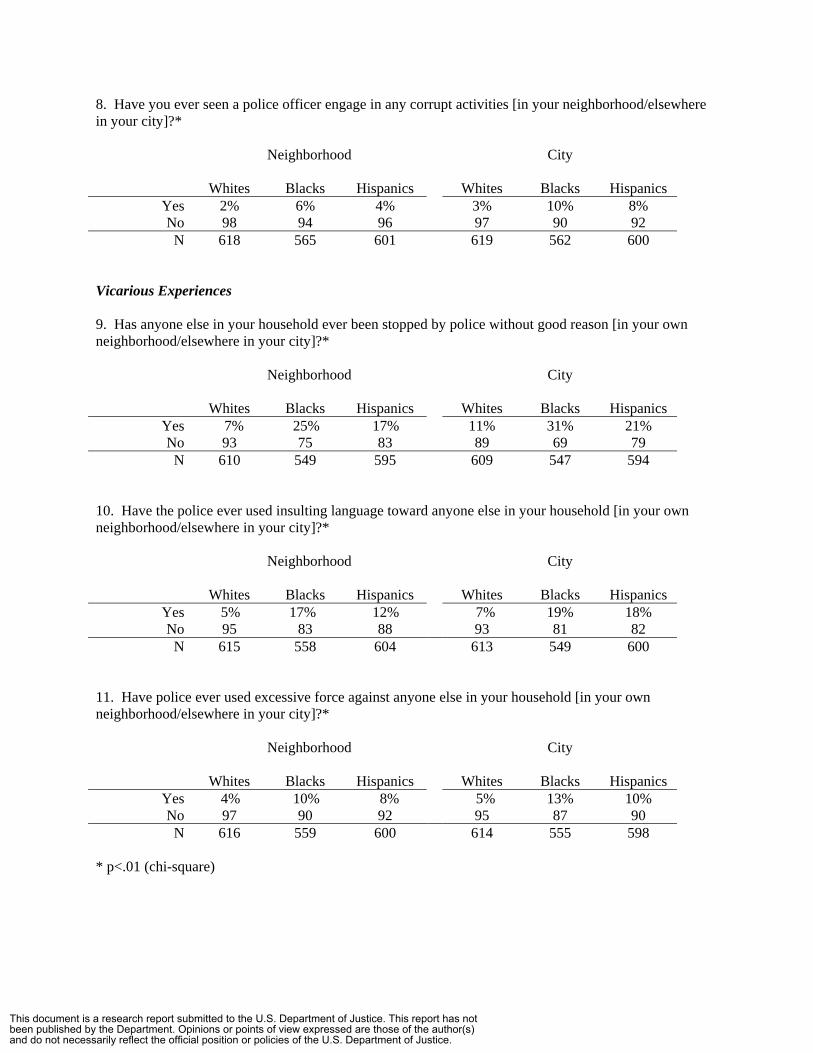
8. Have you ever seen a police officer engage in any corrupt activities [in your neighborhood/elsewhere in your city]?* Neighborhood City
Whites Blacks Hispanics Whites Blacks Hispanics Yes 2% 6% 4% 3% 10% 8% No 98 94 96 97 90 92
N 618 565 601 619 562 600 Vicarious Experiences 9. Has anyone else in your household ever been stopped by police without good reason [in your own neighborhood/elsewhere in your city]?* Neighborhood City
Whites Blacks Hispanics Whites Blacks Hispanics Yes 7% 25% 17% 11% 31% 21% No 93 75 83 89 69 79
N 610 549 595 609 547 594 10. Have the police ever used insulting language toward anyone else in your household [in your own neighborhood/elsewhere in your city]?* Neighborhood City
Whites Blacks Hispanics Whites Blacks Hispanics Yes 5% 17% 12% 7% 19% 18% No 95 83 88 93 81 82
N 615 558 604 613 549 600 11. Have police ever used excessive force against anyone else in your household [in your own neighborhood/elsewhere in your city]?* Neighborhood City
Whites Blacks Hispanics Whites Blacks Hispanics Yes 4% 10% 8% 5% 13% 10% No 97 90 92 95 87 90
N 616 559 600 614 555 598 * p<.01 (chi-square)
This document is a research report submitted to the U.S. Department of Justice. This report has not been published by the Department. Opinions or points of view expressed are those of the author(s) and do not necessarily reflect the official position or policies of the U.S. Department of Justice.

Table 6. Police Racial Bias Police Discrimination against Individuals 1. Do you think the police in your city treat whites and blacks equally, do they treat whites worse than blacks, or blacks worse than whites?** Whites Blacks Hispanics
% % % Whites worse 1.5 2.2 2.7
Equal 74.9 22.7 43.6 Blacks worse 23.7 75.1 53.6
N 608 555 593 2. Do you think the police in your neighborhood treat whites and blacks equally, do they treat whites worse than blacks, or blacks worse than whites?** Whites Blacks Hispanics
% % % Whites worse 1.4 3.3 3.1
Equal 81.6 34.9 50.9 Blacks worse 17.0 61.8 46.1
N 604 551 591 3. Do you think the police in your city treat whites and Hispanics equally, do they treat whites worse than Hispanics, or Hispanics worse than whites?** Whites Blacks Hispanics
% % % Whites worse 1.2 3.3 3.4
Equal 76.6 22.2 43.2 Hispanics
worse 22.2 74.4 53.4
N 597 546 590 4. Do you think the police in your neighborhood treat whites and Hispanics equally, do they treat whites worse than Hispanics, or Hispanics worse than whites?** Whites Blacks Hispanics
% % % Whites worse 1.2 2.2 2.7
Equal 82.3 31.9 50.2 Hispanics
worse 16.5 65.9 47.1
N 605 546 591
This document is a research report submitted to the U.S. Department of Justice. This report has not been published by the Department. Opinions or points of view expressed are those of the author(s) and do not necessarily reflect the official position or policies of the U.S. Department of Justice.

5. Do you think the police in your city treat blacks and Hispanics equally, do they treat blacks worse than Hispanics, or Hispanics worse than blacks?** Whites Blacks Hispanics
% % % Hispanics
worse 6.2 5.2 7.5
Equal 87.5 73.1 78.1 Blacks worse 6.3 21.8 14.4
N 594 545 588 6. Do you think the police in your neighborhood treat blacks and Hispanics equally, do they treat blacks worse than Hispanics, or Hispanics worse than blacks?** Whites Blacks Hispanics
% % % Hispanics
worse 4.8 3.7 7.2
Equal 90.6 74.7 79.4 Blacks worse 4.5 21.6 13.4
N 602 545 587 Differential Treatment of Neighborhoods 7. In general in the United States, do you think that police services in white neighborhoods are better, worse, or about the same as in black neighborhoods?** Whites Blacks Hispanics
% % % Worse in
white 6.8 2.9 3.7
About same 60.2 18.7 36.1 Better in white 33.1 78.4 60.2
N 609 562 596 8. In general in the United States, do you think that police services in white neighborhoods are better, worse, or about the same as in Hispanic neighborhoods?** Whites Blacks Hispanics
% % % Worse in
white 6.5 3.3 3.7
About same 59.4 20.0 35.8 Better in white 34.1 76.7 60.5
This document is a research report submitted to the U.S. Department of Justice. This report has not been published by the Department. Opinions or points of view expressed are those of the author(s) and do not necessarily reflect the official position or policies of the U.S. Department of Justice.

N 608 555 597 9. In general in the United States, do you think that police services in black neighborhoods are better, worse, or about the same as in Hispanic neighborhoods?** Whites Blacks Hispanics
% % % Worse in black 6.9 14.4 14.6
About same 85.5 80.6 77.6 Better in black 7.6 5.0 7.8
N 602 561 596 Police Prejudice 10. How common do you think racial or ethnic prejudice is among police officers throughout the United States?** Whites Blacks Hispanics
% % % Very
uncommon 6.4 3.3 2.4
Somewhat uncommon
23.7 3.3 12.2
Somewhat common
49.5 33.9 39.2
Very common 20.3 59.5 46.3 N 606 556 597
11. How common do you think racial or ethnic prejudice is among police officers who work in your city?** Whites Blacks Hispanics
% % % Very
uncommon 21.7 4.0 10.0
Somewhat uncommon
37.8 12.0 25.9
Somewhat common
32.4 38.0 35.2
Very common 8.0 46.0 29.0 N 603 554 586
12. How common do you think racial or ethnic prejudice is among police officers who work in your neighborhood?** Whites Blacks Hispanics
% % % Very 34.8 8.8 19.1
This document is a research report submitted to the U.S. Department of Justice. This report has not been published by the Department. Opinions or points of view expressed are those of the author(s) and do not necessarily reflect the official position or policies of the U.S. Department of Justice.

uncommon Somewhat
uncommon 41.6 19.7 26.0
Somewhat common
19.7 36.9 29.5
Very common 3.9 34.7 25.3 N 599 554 582
Racial Profiling 13. There have been reports that some police officers stop drivers from certain racial groups because they think members of these groups are more likely to commit crimes. This is known as “racial profiling.” Do you approve or disapprove of the use of this practice?** Whites Blacks Hispanics
% % % Approve 26.8 10.1 23.1
Disapprove 73.2 89.9 76.9 N 608 561 596
14. Suppose that studies showed that racial profiling helps to catch criminals. If this is true, would you still disapprove of racial profiling?** [asked only of those who disapprove of profiling] Whites Blacks Hispanics
% % % Yes 57.8 76.6 62.8 No 42.2 23.4 37.2
N 440 504 458 15. What if studies showed that racial profiling does not help to catch criminals? Would you still approve of racial profiling? [asked only of those who approve of profiling] Whites Blacks Hispanics
% % % Yes 40.5 40.7 49.3 No 59.5 59.3 50.7
N 166 50 135 Do you think racial profiling is widespread or not widespread… 16. …in the United States?** 17. …in your city?** Whites Blacks Hispanics Whites Blacks Hispanics
% % % % % % Yes 70.2 91.7 83.2 35.4 79.6 59.4 No 29.8 8.3 16.8 64.6 20.4 40.6
This document is a research report submitted to the U.S. Department of Justice. This report has not been published by the Department. Opinions or points of view expressed are those of the author(s) and do not necessarily reflect the official position or policies of the U.S. Department of Justice.

N 607 560 598 606 558 591 18. …in your own neighborhood?** Whites Blacks Hispanics
% % % Yes 18.3 57.0 46.4 No 81.7 43.0 53.6
N 606 551 586 19. Do you think that black drivers are more likely to be stopped by the police than white drivers for the same types of violations?** Whites Blacks Hispanics
% % % Yes 33.7 81.8 65.5 No 66.3 18.2 34.5
N 614 557 598 20. Do you think that Hispanic drivers are more likely to be stopped by the police than white drivers for the same types of violations?** Whites Blacks Hispanics
% % % Yes 33.5 79.9 64.7 No 66.5 20.1 35.3
N 612 554 596 21. Do you think that black drivers are more likely to be stopped by the police than Hispanic drivers for the same types of violations?** Whites Blacks Hispanics
% % % Yes 20.5 55.7 42.5 No 79.5 44.3 57.5
N 611 552 594 Personal and Vicarious Experience Have you ever felt you were treated unfairly by the police specifically because of your race…
22. …in your own neighborhood?** 23. …elsewhere in your city, but
outside your own neighborhood?**
This document is a research report submitted to the U.S. Department of Justice. This report has not been published by the Department. Opinions or points of view expressed are those of the author(s) and do not necessarily reflect the official position or policies of the U.S. Department of Justice.

Whites Blacks Hispanics Whites Blacks Hispanics
% % % % % % Yes 1.3 24.3 15.8 1.1 37.0 22.9 No 98.7 75.7 84.2 98.9 63.0 77.1
N 617 559 600 612 554 599 Has anyone else in your household ever felt that they were treated unfairly by the police specifically because of their race…
24. …in your own neighborhood?** 25. …elsewhere in your city, but
outside your own neighborhood?** Whites Blacks Hispanics Whites Blacks Hispanics
% % % % % % Yes 1.7 20.1 15.2 2.7 27.1 19.7 No 98.3 79.9 84.8 97.3 72.9 80.3
N 616 553 598 614 549 593 26. Have you ever felt that you were stopped by the police just because of your race or ethnic background?** Whites Blacks Hispanics
% % % Yes 3.3 43.1 26.2 No 96.7 56.9 73.8
N 614 559 601 27. Has anyone else in your household ever felt that they were stopped by the police just because of their race or ethnic background?** Whites Blacks Hispanics
% % % Yes 3.2 34.9 24.0 No 96.8 65.1 76.0
N 612 551 596 ** p<.001 (chi-square)
This document is a research report submitted to the U.S. Department of Justice. This report has not been published by the Department. Opinions or points of view expressed are those of the author(s) and do not necessarily reflect the official position or policies of the U.S. Department of Justice.

Table 8. Policing Reforms Racial Composition of Police 1. Do you think that minorities should be given preferences in hiring so that a police department will have a similar racial makeup to the racial makeup of that city?** Whites Blacks Hispanics
% % % Yes 20.8 53.6 46.7 No 79.2 46.4 53.3
N 473 386 417 Which of the following do you think would improve either the police department or police services in your city?
2. Hire more minority officers.** 3. Assign more minority officers to
minority neighborhoods.** Whites Blacks Hispanics Whites Blacks Hispanics
% % % % % % Improve a lot 8.5 34.0 28.6 17.2 36.7 30.8
Improve somewhat
27.3 40.3 47.9 32.8 40.1 37.4
Not improve much
40.2 18.3 22.8 32.4 14.6 20.8
Not improve at all
24.0 7.5 10.7 17.6 8.6 11.1
N 593 539 583 592 541 584
This document is a research report submitted to the U.S. Department of Justice. This report has not been published by the Department. Opinions or points of view expressed are those of the author(s) and do not necessarily reflect the official position or policies of the U.S. Department of Justice.
Accountability Which of the following do you think would improve either the police department or police services in your city?
4. Stronger punishment for officers who engage in misconduct against citizens.**
5. An early warning system in the police department to help identify officers who receive multiple complaints from citizens.**
Whites Blacks Hispanics Whites Blacks Hispanics
% % % % % % Improve a lot 25.5 59.9 47.5 34.5 57.8 47.6
Improve somewhat
44.2 31.2 33.8 41.6 31.3 36.8
Not improve much
20.5 4.8 10.6 16.8 6.7 9.0
Not improve at all
9.8 4.1 8.1 7.2 4.1 6.6
N 597 545 582 604 543 586
6. Install video cameras in all police cruisers to monitor officer behavior.**
Whites Blacks Hispanics
% % % Improve a lot 29.9 58.5 42.8
Improve somewhat
36.1 27.9 35.9
Not improve much
25.7 9.2 13.1
Not improve at all
8.3 4.4 8.3
N 595 552 586 7. Do you think that a police officer who is found to have used excessive force (more force than is necessary under the circumstances) against a citizen should receive some kind of punishment?* Whites Blacks Hispanics
% % % Yes 91.5 93.1 86.3 No 8.5 6.9 13.7
N 606 557 604
This document is a research report submitted to the U.S. Department of Justice. This report has not been published by the Department. Opinions or points of view expressed are those of the author(s) and do not necessarily reflect the official position or policies of the U.S. Department of Justice.

More Sensitive Policing Which of the following do you think would improve either the police department or police services in your city?
8. Give officers more sensitivity training to improve treatment of minorities.**
9. More police meetings with the community.**
Whites Blacks Hispanics Whites Blacks Hispanics
% % % % % % Improve a lot 19.0 57.0 39.0 23.9 50.2 39.6
Improve somewhat
40.9 27.4 36.2 46.0 34.9 39.9
Not improve much
25.1 10.4 14.5 22.3 10.4 13.2
Not improve at all
14.9 5.2 10.3 7.9 4.5 7.3
N 600 544 585 601 543 586
10. More police programs for school children.**
11. Require police officers in Spanish-speaking areas to learn Spanish.**
Whites Blacks Hispanics Whites Blacks Hispanics
% % % % % % Improve a lot 26.1 48.0 42.4 29.5 42.3 44.6
Improve somewhat
48.6 37.9 39.3 40.2 39.6 37.4
Not improve much
19.0 8.9 12.4 17.7 12.1 10.4
Not improve at all
6.3 5.2 5.9 12.5 6.0 7.6
N 599 548 587 599 538 584 * p<.01; ** p<.001 (chi-square)
This document is a research report submitted to the U.S. Department of Justice. This report has not been published by the Department. Opinions or points of view expressed are those of the author(s) and do not necessarily reflect the official position or policies of the U.S. Department of Justice.
This document is abeen published by and do not necessa
Ronald Weitzer, Ph.D., is a professor in the Department of Sociology at George Washington University. Steven Tuch, Ph.D., is a professor in the Department of Sociology at George WashingtonUniversity. This research was supported by the National Institute of Justice (grant #2001-IJ-CX-0016). The findings and conclusions of the research reported here are those of the authors and do not necessarily reflect the official position of the U.S. Department of Justice.
research report submitted to the U.S. Department of Justice. This report has not the Department. Opinions or points of view expressed are those of the author(s) rily reflect the official position or policies of the U.S. Department of Justice.