retesting the separability of china's rural households
TRANSCRIPT
54 China & World Economy / 54–68, Vol. 20, No. 3, 2012
©2012 The AuthorsChina & World Economy ©2012 Institute of World Economics and Politics, Chinese Academy of Social Sciences
Retesting the Separability of China’sRural Households
Cuirong Wu, Xian Xin*
AbstractThis article retests the separability of China’s rural households in light of growing doubtabout the sustainability of high economic growth in China. If a household’s productiondecisions are “separable” from the household’s consumption decisions, generally thissuggests there is no surplus labor. Many scholars aver that China’s surplus rural laborhas spurred rapid economic growth, but concerns have arisen as to whether China still hassurplus labor available. We investigate this issue using rural household panel data from1993 to 2009. The regression results confirm that households in rural China have progressedfrom being non-separable to separable. The estimation results for both the entire countryand regions reject the separability hypothesis before 2004 but fail to reject the hypothesisafter 2004 (with the exception of the central region). These results suggest that China’ssurplus labor supply is dwindling, especially in the eastern and the western regions. Thesustainability of China’s high economic growth is questionable in the absence of a largereservoir of surplus rural labor.
Key words: labor, rural China, separabilityJEL codes: J23, J43, O15, P23
I. Introduction
China’s rapid economic growth over the past three decades has attracted considerableattention, and numerous studies have been devoted to investigating the sources ofthis growth. According to the World Bank (1997) estimates, labor mobility contributed
* Cuirong Wu, PhD candidate, College of Economics and Management and Center for Rural DevelopmentPolicy, China Agricultural University, Beijing, China. Email: [email protected]; Xian Xin(corresponding author), Professor, College of Economics and Management and Center for RuralDevelopment Policy, China Agricultural University, Beijing, China. Email: [email protected]. Weacknowledge support from the International Development Research Centre/Centre for InternationalGovernance Innovation Young China Scholars Research and Policy Engagement Network.
55Retesting the Separability of China’s Rural Households
©2012 The AuthorsChina & World Economy ©2012 Institute of World Economics and Politics, Chinese Academy of Social Sciences
1.5 percentage points to the mean annual GDP growth rate of 9.4 percent over the periodbetween 1978 and 1995. Some studies also argue that the transfer of surplus rural labor fromthe agricultural to the non-agricultural sector is one of the most important sources ofeconomic growth (e.g. Chen and Li, 2004; Lin and Ren, 2007; Hu, 2009; Xin and Qin, 2011).However, uncertainty regarding the size of China’s stock of surplus rural labor has castdoubt on the sustainability of high economic growth. China’s rising wages and the increasingdifficulty of hiring workers reduce China’s competitive advantage of lower labor costs, andcast further doubt on the existence of surplus rural labor.
Some reports suggest that the stock of China’s rural migrants increased from approximately30 million in the early 1980s to between 150 and 180 million in 2007–2010 (Fan, 2009; Chen,2010; Yu et al., 2011). Accompanying this growth in rural–urban migration have been risingwages and increased difficulty of hiring workers (Li, 2011). This “labor shortage” was firstnoted in coastal cities in 2005, and has received intense media attention.1
Several studies query whether China is entering the Lewis turning point. Someresearchers argue that China has now reached the Lewis turning point (e.g. Cai et al., 2007;Park et al., 2009; Cai and Wang, 2008; Wang, 2008). Others either argue that migrant wageshave barely increased (e.g. Meng and Bai, 2008; Du and Pan, 2009), or that there is stillevidence of widespread surplus labor in rural China (e.g. Kwan, 2009; Knight et al., 2010).
One critical issue related to whether or not China still has surplus rural labor is theseparability of rural households. China’s rural households’ production and consumptiondecisions tend to be dependent on one other. In the case of complete markets wherefarmers are able to exchange land, labor and agricultural goods freely, it is expected thatfarmers make their production decisions independently from consumption decisions. Thisphenomenon is referred to as “separability”: the household’s production decisions areseparable from the household’s consumption decisions. Non-separability exists wherelabor used in agricultural production depends on consumption variables (household sizeand composition). The concepts of separability and non-separability are first raised byChayanov (1926), who emphasizes the importance of demographic composition indetermining household production behavior. Surplus labor is tightly related to non-separability and low efficiency. If surplus labor exists and there are no alternative jobopportunities, then the surplus labor will stay in agriculture and, thus, the observed laborinputs in agricultural production may exceed the optimal amount. In this case, householddemographic composition will influence labor inputs and, therefore, non-separability prevailsin rural households. If there is no surplus labor, the observed labor inputs in a household’sagricultural production will be independent of household demographic composition and,
1 See, for example, Yardley and Barboza (2005).
56 Cuirong Wu, Xian Xin / 54–68, Vol. 20, No. 3, 2012
©2012 The AuthorsChina & World Economy ©2012 Institute of World Economics and Politics, Chinese Academy of Social Sciences
therefore, separability prevails in a rural household. Testing the separability of ruralhouseholds is of central importance in determining whether the agricultural sector still hassurplus rural labor. According to the classical two-sector model of development, once thenon-agricultural sector can no longer obtain low-cost labor from the agricultural sector, thecost of production will rise, and the speed of future economic growth will decline (seeLewis, 1954).
Unfortunately, to the authors’ knowledge, studies testing China’s rural householdseparability are scarce, and only a small number of studies use rural household survey datato conduct separability tests. These studies include Feder et al. (1990), Cook (1999), Bowlusand Sicular (2003) and Carter and Yao (2002). In all these studies, the hypothesis ofseparability is rejected. For example, Cook (1999) studies the production and shadow wagesof individual farmers living in Zouping County, a rural county in Shandong Province, andfinds that the gender differentials are significant, the shadow wages between off-farm jobsand farmers are large, and there is surplus labor. Bowlus and Sicular (2003) also testseparability in Zouping County by checking the linkage between labor demand andhousehold composition. Feder et al. (1990) use a 1987 dataset to test whether ruralhouseholds’ production decisions are affected by the availability of liquidity at thebeginning of the busy seasons for the households constrained on the credit market andthose unconstrained on the credit market. Carter and Yao (2002) use a reduced form modelto test market participation and generally reject the hypothesis of separability.
Although these studies contribute to the understanding of China’s rural labor markets,they only investigate these markets either in the late 1980s and early 1990s or the early 2000s.Because of the significant changes that have taken place in China’s labor and other factormarkets during and after these studies, separability may have also changed. We will examinewhether there have been changes in separability over time using household survey datacovering 1993–2009. Our work closely follows that of Benjamin (1992) and Bowlus and Sicular(2003), who test separability in China by examining whether the labor demand in householdfarming is affected by household size and composition. Our analytical results indicate thatthe hypothesis of separability is rejected prior to 2004, but is not rejected after 2004. Wefurther check the regional differences in separability and changes in separability over time,and find that the situation of surplus labor may no longer exist in China, especially in easternand western China. These findings imply that the sustainability of China’s high economicgrowth is questionable in the future without a larger reservoir of surplus rural labor.
The rest of the paper is organized as follows. Section II presents the model to test thehypothesis of separability. In Section III, the China Health and Nutrition Survey (CHNS)data are presented and the descriptive statistics are analyzed. Section IV reports the resultsof the empirical estimationsand, finally, Section V draws conclusions.
57Retesting the Separability of China’s Rural Households
©2012 The AuthorsChina & World Economy ©2012 Institute of World Economics and Politics, Chinese Academy of Social Sciences
II. Model Specification
Agricultural household behavior under a perfectly competitive market implies separabilitybetween production and consumption decisions, and, therefore, the amount of labor usedin production is theoretically independent of household consumption and labor supplydecisions (Singh et al., 1986). Hence, when there is surplus labor in the agricultural sector,workers will seek wage jobs or self-employment in a competitive market until supply anddemand reaches equilibrium. However, if the labor market is non-competitive, surplus labormay exist, which, in turn, gives rise to non-separability.
As mentioned earlier, numerous studies are devoted to testing separability using variousapproaches and assumptions. For example, Chayanov (1926) discusses an extreme situationwith no labor market connecting household composition and labor input. In addition, Pittand Rosenzweig (1986) use household demographic characteristics as restrictions to testthe separability hypothesis, and a number of other studies use different datasets andhousehold compositions to test separability in developing countries (e.g. Anil, 1988;Benjamin, 1992; Grimard, 2000; Bowlus and Sicular, 2003). Various approaches are taken toinvestigate separability, and to examine market failures in other specific markets (e.g. Gavianand Fafchamps, 1996; Kevane, 1996; Udry, 1996; Sadoulet et al., 1998; Arcand andd’Hombres, 2006).
In the present paper, we follow the same approach applied in Benjamin (1992) andBowlus and Sicular (2003) to test the separability of China’s rural households. The approachuses a reduced form model in which the demand for labor in farm production is a functionof household size, household composition and other variables. The specification of theempirical model is as follows:
jtjk
kti jt
ijt
ijtjtjt XnnnAL εµζδδλα ++++++= ∑∑
== 110 lnlnln , (1)
j = 1, 2, ..., J; t = 1, 2, ..., T; i = 1, 2, ..., I,
where J refers to the number of households and T the number of time periods. I refers to thenumber of household composition variables; L is labor demand (total farming days perhousehold members); A is the area of cultivated land; n is household size; ni representshousehold structure variables, such as the number of female adults, children under 16 yearsand elderly above 65 years in the household; Xkt represents variables used to control forland characteristics and human capital; jµ is unobserved household characteristics thatare fixed over time; and jtε is the error term. Separability implies 0δ = iδ = 0 (for all i), whichis the null hypothesis mentioned in the proceeding sections of the present paper. If the null
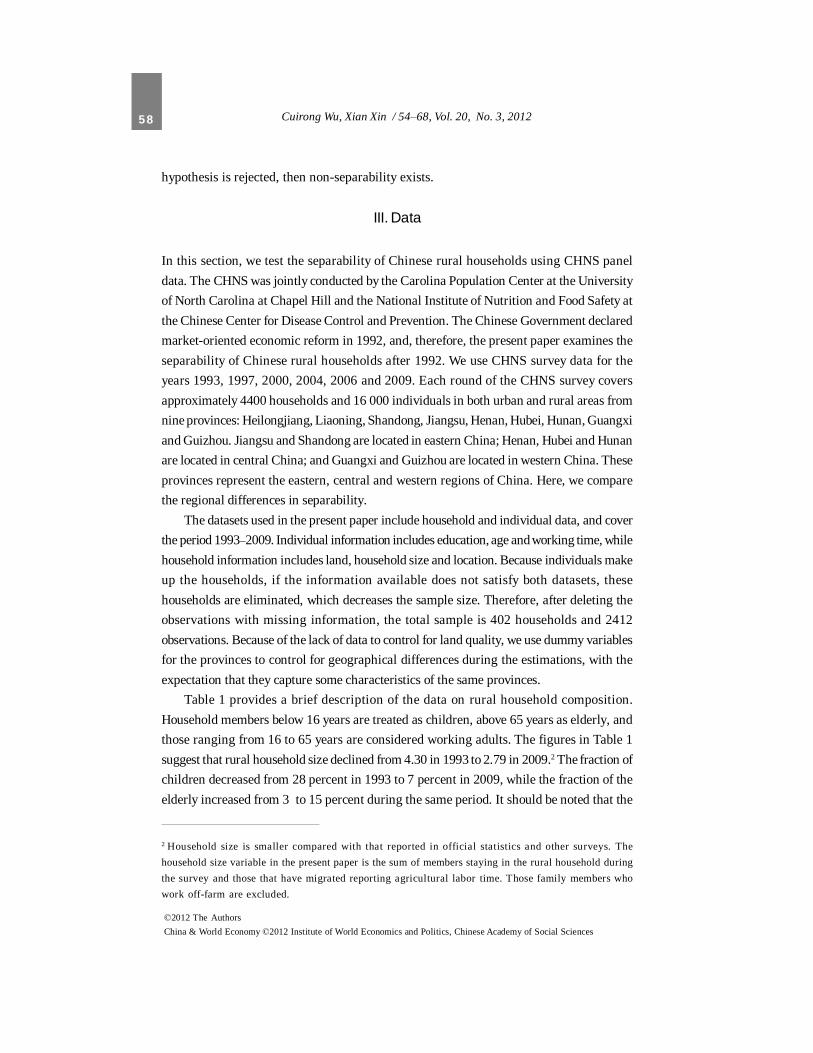
58 Cuirong Wu, Xian Xin / 54–68, Vol. 20, No. 3, 2012
©2012 The AuthorsChina & World Economy ©2012 Institute of World Economics and Politics, Chinese Academy of Social Sciences
hypothesis is rejected, then non-separability exists.
III. Data
In this section, we test the separability of Chinese rural households using CHNS paneldata. The CHNS was jointly conducted by the Carolina Population Center at the Universityof North Carolina at Chapel Hill and the National Institute of Nutrition and Food Safety atthe Chinese Center for Disease Control and Prevention. The Chinese Government declaredmarket-oriented economic reform in 1992, and, therefore, the present paper examines theseparability of Chinese rural households after 1992. We use CHNS survey data for theyears 1993, 1997, 2000, 2004, 2006 and 2009. Each round of the CHNS survey coversapproximately 4400 households and 16 000 individuals in both urban and rural areas fromnine provinces: Heilongjiang, Liaoning, Shandong, Jiangsu, Henan, Hubei, Hunan, Guangxiand Guizhou. Jiangsu and Shandong are located in eastern China; Henan, Hubei and Hunanare located in central China; and Guangxi and Guizhou are located in western China. Theseprovinces represent the eastern, central and western regions of China. Here, we comparethe regional differences in separability.
The datasets used in the present paper include household and individual data, and coverthe period 1993–2009. Individual information includes education, age and working time, whilehousehold information includes land, household size and location. Because individuals makeup the households, if the information available does not satisfy both datasets, thesehouseholds are eliminated, which decreases the sample size. Therefore, after deleting theobservations with missing information, the total sample is 402 households and 2412observations. Because of the lack of data to control for land quality, we use dummy variablesfor the provinces to control for geographical differences during the estimations, with theexpectation that they capture some characteristics of the same provinces.
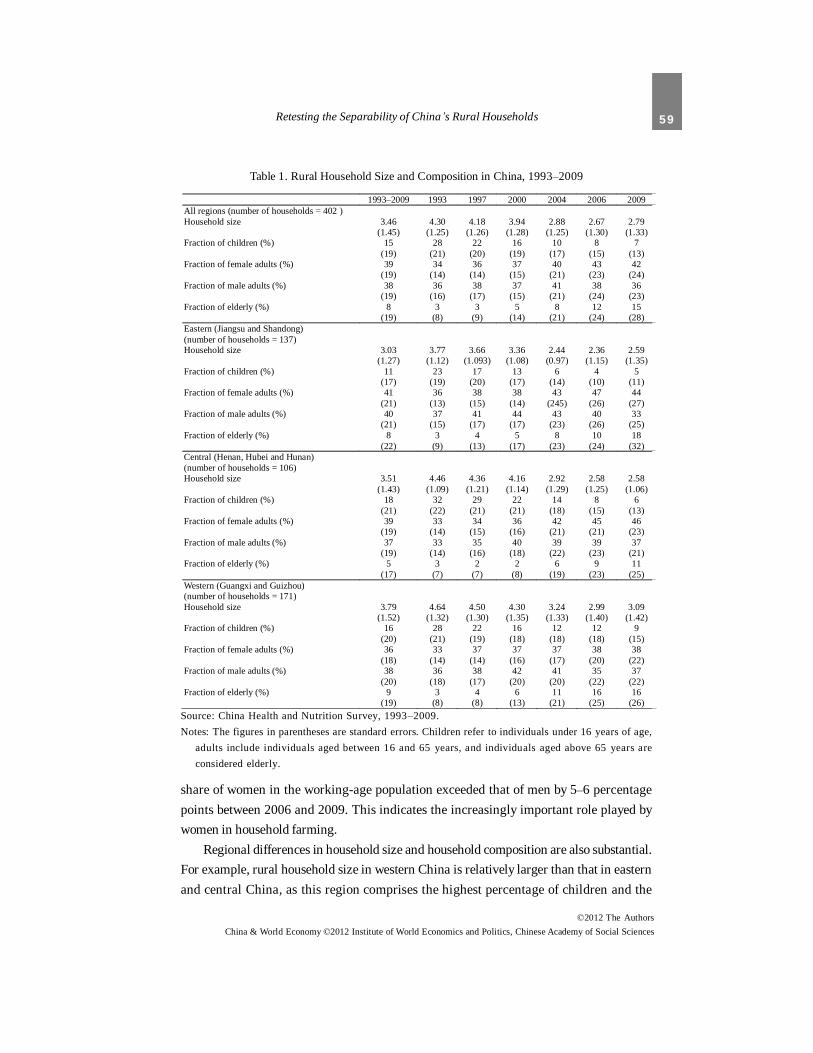
Table 1 provides a brief description of the data on rural household composition.Household members below 16 years are treated as children, above 65 years as elderly, andthose ranging from 16 to 65 years are considered working adults. The figures in Table 1suggest that rural household size declined from 4.30 in 1993 to 2.79 in 2009.2 The fraction ofchildren decreased from 28 percent in 1993 to 7 percent in 2009, while the fraction of theelderly increased from 3 to 15 percent during the same period. It should be noted that the
2 Household size is smaller compared with that reported in official statistics and other surveys. Thehousehold size variable in the present paper is the sum of members staying in the rural household duringthe survey and those that have migrated reporting agricultural labor time. Those family members whowork off-farm are excluded.
59Retesting the Separability of China’s Rural Households
©2012 The AuthorsChina & World Economy ©2012 Institute of World Economics and Politics, Chinese Academy of Social Sciences
share of women in the working-age population exceeded that of men by 5–6 percentagepoints between 2006 and 2009. This indicates the increasingly important role played bywomen in household farming.
Regional differences in household size and household composition are also substantial.For example, rural household size in western China is relatively larger than that in easternand central China, as this region comprises the highest percentage of children and the
Table 1. Rural Household Size and Composition in China, 1993–2009
Source: China Health and Nutrition Survey, 1993–2009.Notes: The figures in parentheses are standard errors. Children refer to individuals under 16 years of age,
adults include individuals aged between 16 and 65 years, and individuals aged above 65 years areconsidered elderly.
1993–2009 1993 1997 2000 2004 2006 2009 All regions (number of households = 402 ) Household size 3.46
(1.45) 4.30
(1.25) 4.18
(1.26) 3.94
(1.28) 2.88
(1.25) 2.67
(1.30) 2.79
(1.33) Fraction of children (%) 15
(19) 28
(21) 22
(20) 16
(19) 10
(17) 8
(15) 7
(13) Fraction of female adults (%) 39
(19) 34
(14) 36
(14) 37
(15) 40
(21) 43
(23) 42
(24) Fraction of male adults (%) 38
(19) 36
(16) 38
(17) 37
(15) 41
(21) 38
(24) 36
(23) Fraction of elderly (%) 8
(19) 3
(8) 3
(9) 5
(14) 8
(21) 12
(24) 15
(28) Eastern (Jiangsu and Shandong) (number of households = 137)
Household size 3.03 (1.27)
3.77 (1.12)
3.66 (1.093)
3.36 (1.08)
2.44 (0.97)
2.36 (1.15)
2.59 (1.35)
Fraction of children (%) 11 (17)
23 (19)
17 (20)
13 (17)
6 (14)
4 (10)
5 (11)
Fraction of female adults (%) 41 (21)
36 (13)
38 (15)
38 (14)
43 (245)
47 (26)
44 (27)
Fraction of male adults (%) 40 (21)
37 (15)
41 (17)
44 (17)
43 (23)
40 (26)
33 (25)
Fraction of elderly (%) 8 (22)
3 (9)
4 (13)
5 (17)
8 (23)
10 (24)
18 (32)
Central (Henan, Hubei and Hunan) (number of households = 106)
Household size 3.51 (1.43)
4.46 (1.09)
4.36 (1.21)
4.16 (1.14)
2.92 (1.29)
2.58 (1.25)
2.58 (1.06)
Fraction of children (%) 18 (21)
32 (22)
29 (21)
22 (21)
14 (18)
8 (15)
6 (13)
Fraction of female adults (%) 39 (19)
33 (14)
34 (15)
36 (16)
42 (21)
45 (21)
46 (23)
Fraction of male adults (%) 37 (19)
33 (14)
35 (16)
40 (18)
39 (22)
39 (23)
37 (21)
Fraction of elderly (%) 5 (17)
3 (7)
2 (7)
2 (8)
6 (19)
9 (23)
11 (25)
Western (Guangxi and Guizhou) (number of households = 171)
Household size 3.79 (1.52)
4.64 (1.32)
4.50 (1.30)
4.30 (1.35)
3.24 (1.33)
2.99 (1.40)
3.09 (1.42)
Fraction of children (%) 16 (20)
28 (21)
22 (19)
16 (18)
12 (18)
12 (18)
9 (15)
Fraction of female adults (%) 36 (18)
33 (14)
37 (14)
37 (16)
37 (17)
38 (20)
38 (22)
Fraction of male adults (%) 38 (20)
36 (18)
38 (17)
42 (20)
41 (20)
35 (22)
37 (22)
Fraction of elderly (%) 9 (19)
3 (8)
4 (8)
6 (13)
11 (21)
16 (25)
16 (26)
60 Cuirong Wu, Xian Xin / 54–68, Vol. 20, No. 3, 2012
©2012 The AuthorsChina & World Economy ©2012 Institute of World Economics and Politics, Chinese Academy of Social Sciences
elderly. The higher percentage of children and elderly in the two western provinces impliesthat more adults have become migrant workers, leaving the elderly and children at home.
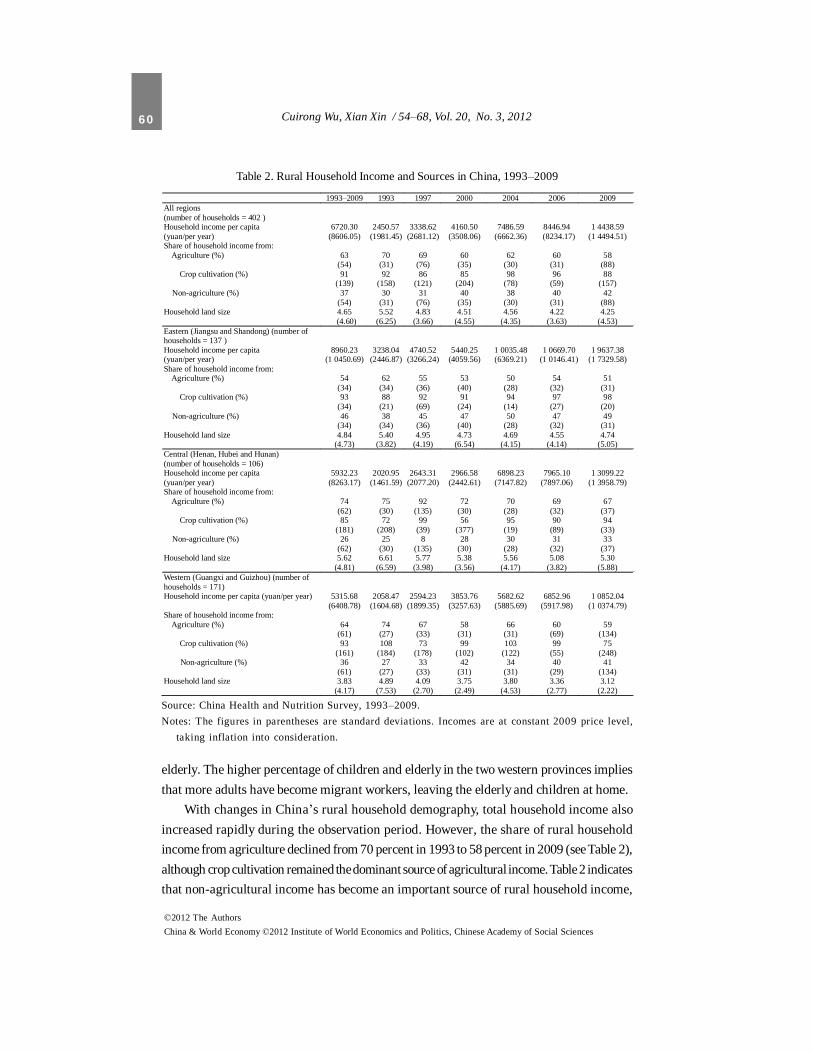
With changes in China’s rural household demography, total household income alsoincreased rapidly during the observation period. However, the share of rural householdincome from agriculture declined from 70 percent in 1993 to 58 percent in 2009 (see Table 2),although crop cultivation remained the dominant source of agricultural income. Table 2 indicatesthat non-agricultural income has become an important source of rural household income,
Table 2. Rural Household Income and Sources in China, 1993–2009
1993–2009 1993 1997 2000 2004 2006 2009 All regions (number of households = 402 )
Household income per capita (yuan/per year)
6720.30 (8606.05)
2450.57 (1981.45)
3338.62 (2681.12)
4160.50 (3508.06)
7486.59 (6662.36)
8446.94 (8234.17)
1 4438.59 (1 4494.51)
Share of household income from: Agriculture (%) 63
(54) 70
(31) 69
(76) 60
(35) 62
(30) 60
(31) 58
(88) Crop cultivation (%) 91
(139) 92
(158) 86
(121) 85
(204) 98
(78) 96
(59) 88
(157) Non-agriculture (%) 37
(54) 30
(31) 31
(76) 40
(35) 38
(30) 40
(31) 42
(88) Household land size 4.65
(4.60) 5.52
(6.25) 4.83
(3.66) 4.51
(4.55) 4.56
(4.35) 4.22
(3.63) 4.25
(4.53) Eastern (Jiangsu and Shandong) (number of households = 137 )
Household income per capita (yuan/per year)
8960.23 (1 0450.69)
3238.04 (2446.87)
4740.52 (3266.24)
5440.25 (4059.56)
1 0035.48 (6369.21)
1 0669.70 (1 0146.41)
1 9637.38 (1 7329.58)
Share of household income from: Agriculture (%) 54
(34) 62
(34) 55
(36) 53
(40) 50
(28) 54
(32) 51
(31) Crop cultivation (%) 93
(34) 88
(21) 92
(69) 91
(24) 94
(14) 97
(27) 98
(20) Non-agriculture (%) 46
(34) 38
(34) 45
(36) 47
(40) 50
(28) 47
(32) 49
(31) Household land size 4.84
(4.73) 5.40
(3.82) 4.95
(4.19) 4.73
(6.54) 4.69
(4.15) 4.55
(4.14) 4.74
(5.05) Central (Henan, Hubei and Hunan) (number of households = 106)
Household income per capita (yuan/per year)
5932.23 (8263.17)
2020.95 (1461.59)
2643.31 (2077.20)
2966.58 (2442.61)
6898.23 (7147.82)
7965.10 (7897.06)
1 3099.22 (1 3958.79)
Share of household income from: Agriculture (%) 74
(62) 75
(30) 92
(135) 72
(30) 70
(28) 69
(32) 67
(37) Crop cultivation (%) 85
(181) 72
(208) 99
(39) 56
(377) 95
(19) 90
(89) 94
(33) Non-agriculture (%) 26
(62) 25
(30) 8
(135) 28
(30) 30
(28) 31
(32) 33
(37) Household land size 5.62
(4.81) 6.61
(6.59) 5.77
(3.98) 5.38
(3.56) 5.56
(4.17) 5.08
(3.82) 5.30
(5.88) Western (Guangxi and Guizhou) (number of households = 171)
Household income per capita (yuan/per year) 5315.68 (6408.78)
2058.47 (1604.68)
2594.23 (1899.35)
3853.76 (3257.63)
5682.62 (5885.69)
6852.96 (5917.98)
1 0852.04 (1 0374.79)
Share of household income from: Agriculture (%) 64
(61) 74
(27) 67
(33) 58
(31) 66
(31) 60
(69) 59
(134) Crop cultivation (%) 93
(161) 108
(184) 73
(178) 99
(102) 103
(122) 99
(55) 75
(248) Non-agriculture (%) 36
(61) 27
(27) 33
(33) 42
(31) 34
(31) 40
(29) 41
(134) Household land size 3.83
(4.17) 4.89
(7.53) 4.09
(2.70) 3.75
(2.49) 3.80
(4.53) 3.36
(2.77) 3.12
(2.22)
Source: China Health and Nutrition Survey, 1993–2009.Notes: The figures in parentheses are standard deviations. Incomes are at constant 2009 price level,
taking inflation into consideration.
61Retesting the Separability of China’s Rural Households
©2012 The AuthorsChina & World Economy ©2012 Institute of World Economics and Politics, Chinese Academy of Social Sciences
and that rural households in the two eastern provinces of Jiangsu and Shandong enjoymuch higher income per capita than those in provinces in the relatively economicallyunderdeveloped regions of central and western China. With respect to income source, non-agricultural income accounts for nearly half of rural household income in eastern China,followed by 40 percent in western China, and approximately one-third in central China. Therising share of non-agricultural income could be attributed to the rapid development of theprivate business sector in China and the elimination of restrictions on labor migration fromthe agricultural sector.
Rural household farmland has also been generally shrinking in size. However, those incentral China cultivated much more land during the studied period compared to theircounterparts in eastern and western China.
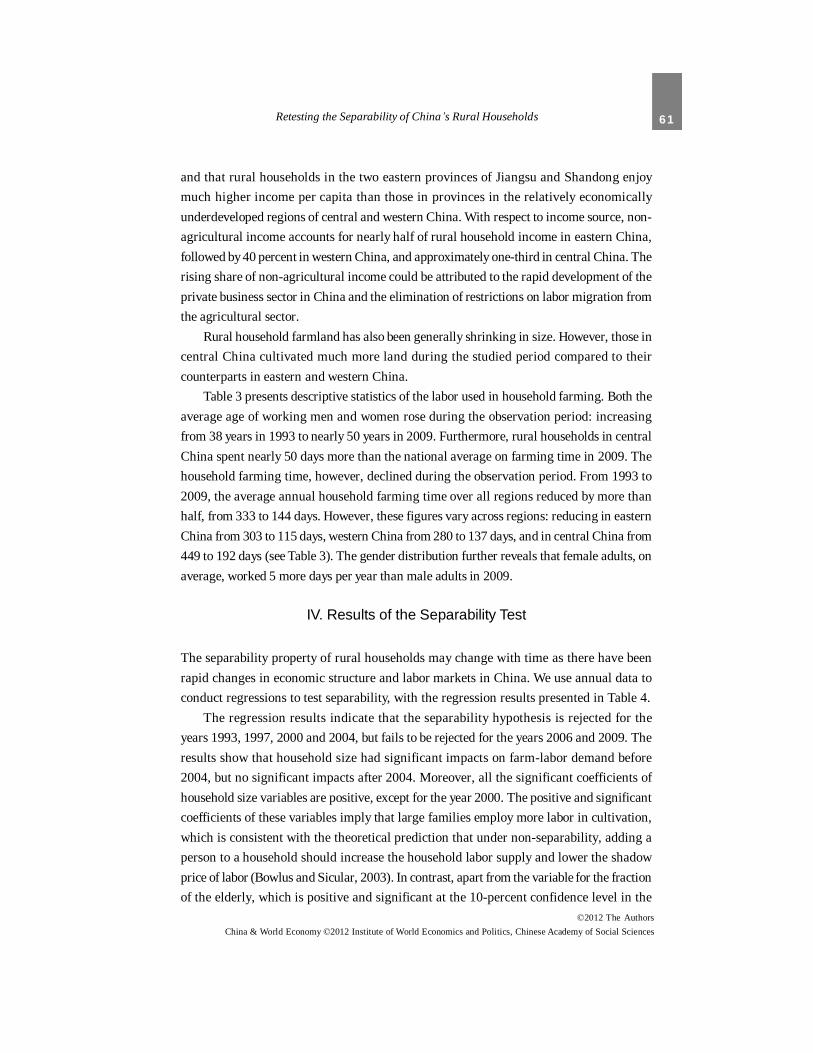
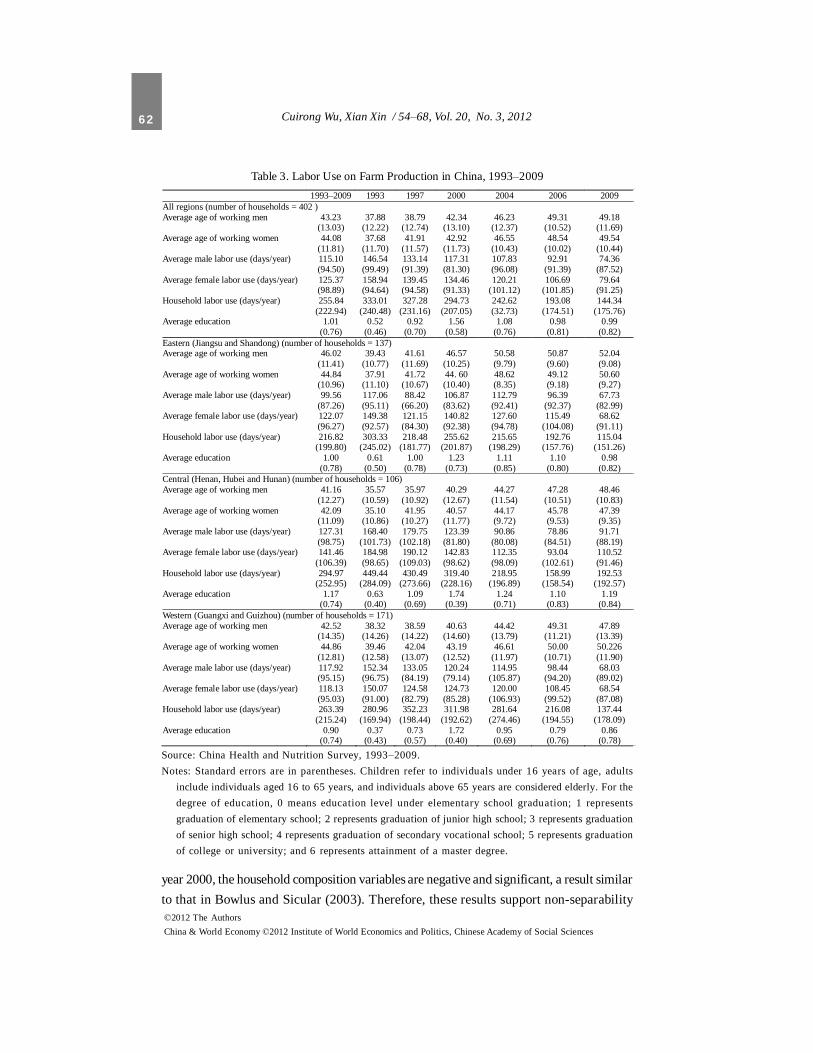
Table 3 presents descriptive statistics of the labor used in household farming. Both theaverage age of working men and women rose during the observation period: increasingfrom 38 years in 1993 to nearly 50 years in 2009. Furthermore, rural households in centralChina spent nearly 50 days more than the national average on farming time in 2009. Thehousehold farming time, however, declined during the observation period. From 1993 to2009, the average annual household farming time over all regions reduced by more thanhalf, from 333 to 144 days. However, these figures vary across regions: reducing in easternChina from 303 to 115 days, western China from 280 to 137 days, and in central China from449 to 192 days (see Table 3). The gender distribution further reveals that female adults, onaverage, worked 5 more days per year than male adults in 2009.
IV. Results of the Separability Test
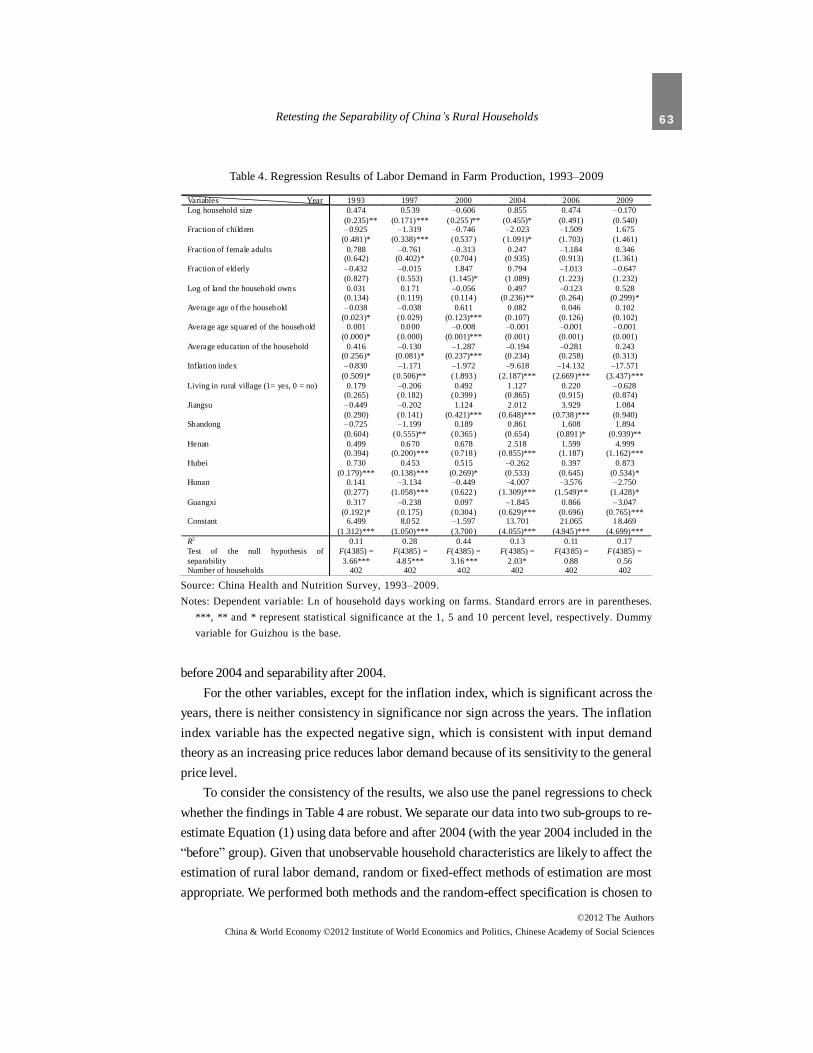
The separability property of rural households may change with time as there have beenrapid changes in economic structure and labor markets in China. We use annual data toconduct regressions to test separability, with the regression results presented in Table 4.
The regression results indicate that the separability hypothesis is rejected for theyears 1993, 1997, 2000 and 2004, but fails to be rejected for the years 2006 and 2009. Theresults show that household size had significant impacts on farm-labor demand before2004, but no significant impacts after 2004. Moreover, all the significant coefficients ofhousehold size variables are positive, except for the year 2000. The positive and significantcoefficients of these variables imply that large families employ more labor in cultivation,which is consistent with the theoretical prediction that under non-separability, adding aperson to a household should increase the household labor supply and lower the shadowprice of labor (Bowlus and Sicular, 2003). In contrast, apart from the variable for the fractionof the elderly, which is positive and significant at the 10-percent confidence level in the
62 Cuirong Wu, Xian Xin / 54–68, Vol. 20, No. 3, 2012
©2012 The AuthorsChina & World Economy ©2012 Institute of World Economics and Politics, Chinese Academy of Social Sciences
year 2000, the household composition variables are negative and significant, a result similarto that in Bowlus and Sicular (2003). Therefore, these results support non-separability
Source: China Health and Nutrition Survey, 1993–2009.Notes: Standard errors are in parentheses. Children refer to individuals under 16 years of age, adults
include individuals aged 16 to 65 years, and individuals above 65 years are considered elderly. For thedegree of education, 0 means education level under elementary school graduation; 1 representsgraduation of elementary school; 2 represents graduation of junior high school; 3 represents graduationof senior high school; 4 represents graduation of secondary vocational school; 5 represents graduationof college or university; and 6 represents attainment of a master degree.
Table 3. Labor Use on Farm Production in China, 1993–2009 1993–2009 1993 1997 2000 2004 2006 2009 All regions (number of households = 402 ) Average age of working men 43.23
(13.03) 37.88
(12.22) 38.79
(12.74) 42.34
(13.10) 46.23
(12.37) 49.31
(10.52) 49.18
(11.69) Average age of working women 44.08
(11.81) 37.68
(11.70) 41.91
(11.57) 42.92
(11.73) 46.55
(10.43) 48.54
(10.02) 49.54
(10.44) Average male labor use (days/year) 115.10
(94.50) 146.54 (99.49)
133.14 (91.39)
117.31 (81.30)
107.83 (96.08)
92.91 (91.39)
74.36 (87.52)
Average female labor use (days/year) 125.37 (98.89)
158.94 (94.64)
139.45 (94.58)
134.46 (91.33)
120.21 (101.12)
106.69 (101.85)
79.64 (91.25)
Household labor use (days/year) 255.84 (222.94)
333.01 (240.48)
327.28 (231.16)
294.73 (207.05)
242.62 (32.73)
193.08 (174.51)
144.34 (175.76)
Average education 1.01 (0.76)
0.52 (0.46)
0.92 (0.70)
1.56 (0.58)
1.08 (0.76)
0.98 (0.81)
0.99 (0.82)
Eastern (Jiangsu and Shandong) (number of households = 137) Average age of working men 46.02
(11.41) 39.43
(10.77) 41.61
(11.69) 46.57
(10.25) 50.58 (9.79)
50.87 (9.60)
52.04 (9.08)
Average age of working women 44.84 (10.96)
37.91 (11.10)
41.72 (10.67)
44. 60 (10.40)
48.62 (8.35)
49.12 (9.18)
50.60 (9.27)
Average male labor use (days/year) 99.56 (87.26)
117.06 (95.11)
88.42 (66.20)
106.87 (83.62)
112.79 (92.41)
96.39 (92.37)
67.73 (82.99)
Average female labor use (days/year) 122.07 (96.27)
149.38 (92.57)
121.15 (84.30)
140.82 (92.38)
127.60 (94.78)
115.49 (104.08)
68.62 (91.11)
Household labor use (days/year) 216.82 (199.80)
303.33 (245.02)
218.48 (181.77)
255.62 (201.87)
215.65 (198.29)
192.76 (157.76)
115.04 (151.26)
Average education 1.00 (0.78)
0.61 (0.50)
1.00 (0.78)
1.23 (0.73)
1.11 (0.85)
1.10 (0.80)
0.98 (0.82)
Central (Henan, Hubei and Hunan) (number of households = 106) Average age of working men 41.16
(12.27) 35.57
(10.59) 35.97
(10.92) 40.29
(12.67) 44.27
(11.54) 47.28
(10.51) 48.46
(10.83) Average age of working women 42.09
(11.09) 35.10
(10.86) 41.95
(10.27) 40.57
(11.77) 44.17 (9.72)
45.78 (9.53)
47.39 (9.35)
Average male labor use (days/year) 127.31 (98.75)
168.40 (101.73)
179.75 (102.18)
123.39 (81.80)
90.86 (80.08)
78.86 (84.51)
91.71 (88.19)
Average female labor use (days/year) 141.46 (106.39)
184.98 (98.65)
190.12 (109.03)
142.83 (98.62)
112.35 (98.09)
93.04 (102.61)
110.52 (91.46)
Household labor use (days/year) 294.97 (252.95)
449.44 (284.09)
430.49 (273.66)
319.40 (228.16)
218.95 (196.89)
158.99 (158.54)
192.53 (192.57)
Average education 1.17 (0.74)
0.63 (0.40)
1.09 (0.69)
1.74 (0.39)
1.24 (0.71)
1.10 (0.83)
1.19 (0.84)
Western (Guangxi and Guizhou) (number of households = 171) Average age of working men 42.52
(14.35) 38.32
(14.26) 38.59
(14.22) 40.63
(14.60) 44.42
(13.79) 49.31
(11.21) 47.89
(13.39) Average age of working women 44.86
(12.81) 39.46
(12.58) 42.04
(13.07) 43.19
(12.52) 46.61
(11.97) 50.00
(10.71) 50.226 (11.90)
Average male labor use (days/year) 117.92 (95.15)
152.34 (96.75)
133.05 (84.19)
120.24 (79.14)
114.95 (105.87)
98.44 (94.20)
68.03 (89.02)
Average female labor use (days/year) 118.13 (95.03)
150.07 (91.00)
124.58 (82.79)
124.73 (85.28)
120.00 (106.93)
108.45 (99.52)
68.54 (87.08)
Household labor use (days/year) 263.39 (215.24)
280.96 (169.94)
352.23 (198.44)
311.98 (192.62)
281.64 (274.46)
216.08 (194.55)
137.44 (178.09)
Average education 0.90 (0.74)
0.37 (0.43)
0.73 (0.57)
1.72 (0.40)
0.95 (0.69)
0.79 (0.76)
0.86 (0.78)
63Retesting the Separability of China’s Rural Households
©2012 The AuthorsChina & World Economy ©2012 Institute of World Economics and Politics, Chinese Academy of Social Sciences
before 2004 and separability after 2004.For the other variables, except for the inflation index, which is significant across the
years, there is neither consistency in significance nor sign across the years. The inflationindex variable has the expected negative sign, which is consistent with input demandtheory as an increasing price reduces labor demand because of its sensitivity to the generalprice level.
To consider the consistency of the results, we also use the panel regressions to checkwhether the findings in Table 4 are robust. We separate our data into two sub-groups to re-estimate Equation (1) using data before and after 2004 (with the year 2004 included in the“before” group). Given that unobservable household characteristics are likely to affect theestimation of rural labor demand, random or fixed-effect methods of estimation are mostappropriate. We performed both methods and the random-effect specification is chosen to
Table 4. Regression Results of Labor Demand in Farm Production, 1993–2009
Source: China Health and Nutrition Survey, 1993–2009.Notes: Dependent variable: Ln of household days working on farms. Standard errors are in parentheses.
***, ** and * represent statistical significance at the 1, 5 and 10 percent level, respectively. Dummyvariable for Guizhou is the base.
Variables Year 1993 1997 2000 2004 2006 2009 Log household size 0.474 0.539 –0.606 0 .855 0.474 –0.170 (0.235)** (0.171)*** (0.255)** (0.455)* (0.491) (0.540) Fraction of child ren –0.925 –1.319 –0.746 –2.023 –1.509 1.675 (0 .481)* (0.338)*** (0.537) (1.091)* (1.703) (1.461) Fraction of female adults 0.788 –0.761 –0.313 0 .247 –1.184 0.346 (0.642) (0.402)* (0.704) (0 .935) (0.913) (1.361) Fraction of elderly –0.432 –0.015 1.847 0 .794 –1.013 –0.647 (0.827) (0.553) (1.145)* (1 .089) (1.223) (1.232) Log of land the household owns 0.031 0.171 –0.056 0 .497 –0.123 0.528 (0.134) (0.119) (0.114) (0 .236)** (0.264) (0 .299)* Average age o f the household –0.038 –0.038 0.611 0 .082 0.046 0.102 (0 .023)* (0.029) (0.123)*** (0 .107) (0.126) (0.102) Average age squared of the household 0.001 0.000 –0.008 –0.001 –0.001 –0.001 (0 .000)* (0.000) (0.001)*** (0 .001) (0.001) (0.001) Average education of the household 0.416 –0.130 –1.287 –0.194 –0.281 0.243 (0 .256)* (0.081)* (0.237)*** (0 .234) (0.258) (0.313) Inflation index –0.830 –1.171 –1.972 –9.618 –14.132 –17.571 (0 .509)* (0.506)** (1.893) (2.187)*** (2.669)*** (3.437)*** Living in rural village (1= yes, 0 = no) 0.179 –0.206 0.492 1 .127 0.220 –0.628 (0.265) (0.182) (0.399) (0 .865) (0.915) (0.874) Jiangsu –0.449 –0.202 1.124 2 .012 3.929 1.084 (0.290) (0.141) (0.421)*** (0.648)*** (0.738)*** (0.940) Shandong –0.725 –1.199 0.189 0 .861 1.608 1.894 (0.604) (0.555)** (0.365) (0 .654) (0.891)* (0.939)** Henan 0.499 0.670 0.678 2 .518 1.599 4.999 (0.394) (0.200)*** (0.718) (0.855)*** (1.187) (1.162)*** Hubei 0.730 0.453 0.515 –0.262 0.397 0.873 (0 .179)*** (0.138)*** (0.269)* (0 .533) (0.645) (0 .534)* Hunan 0.141 –3.134 –0.449 –4.007 –3.576 –2.750 (0.277) (1.058)*** (0.622) (1.309)*** (1.549)** (1 .428)* Guangxi 0.317 –0.238 0.097 –1.845 0.866 –3.047 (0 .192)* (0.175) (0.304) (0.629)*** (0.696) (0.765)*** Constant 6.499 8.052 –1.597 13.701 21.065 18.469 (1 .312)*** (1.050)*** (3.700) (4.055)*** (4.945)*** (4.699)*** R2 0.11 0.28 0.44 0.13 0.11 0 .17 Test of the null hypothesis of separability
F(4385) = 3.66***
F(4385) = 4.85***
F(4385) = 3.16***
F(4385) = 2 .03*
F(4385) = 0.88
F(4385) = 0 .56
Number of households 402 402 402 402 402 402
64 Cuirong Wu, Xian Xin / 54–68, Vol. 20, No. 3, 2012
©2012 The AuthorsChina & World Economy ©2012 Institute of World Economics and Politics, Chinese Academy of Social Sciences
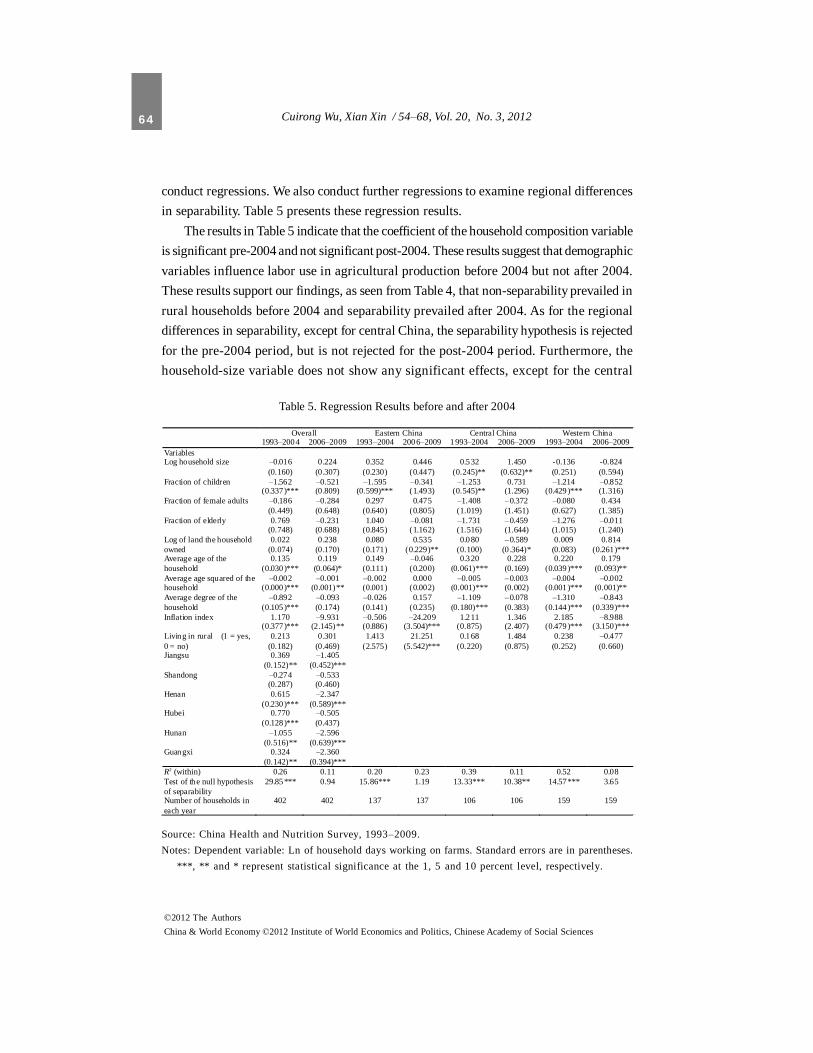
conduct regressions. We also conduct further regressions to examine regional differencesin separability. Table 5 presents these regression results.
The results in Table 5 indicate that the coefficient of the household composition variableis significant pre-2004 and not significant post-2004. These results suggest that demographicvariables influence labor use in agricultural production before 2004 but not after 2004.These results support our findings, as seen from Table 4, that non-separability prevailed inrural households before 2004 and separability prevailed after 2004. As for the regionaldifferences in separability, except for central China, the separability hypothesis is rejectedfor the pre-2004 period, but is not rejected for the post-2004 period. Furthermore, thehousehold-size variable does not show any significant effects, except for the central
Table 5. Regression Results before and after 2004
Source: China Health and Nutrition Survey, 1993–2009.Notes: Dependent variable: Ln of household days working on farms. Standard errors are in parentheses.
***, ** and * represent statistical significance at the 1, 5 and 10 percent level, respectively.
Overall Eastern China Central China Western China 1993–2004 2006–2009 1993–2004 2006–2009 1993–2004 2006–2009 1993–2004 2006–2009 Variables Log household size –0.016 0.224 0.352 0.446 0.532 1.450 -0.136 -0.824 (0.160) (0.307) (0.230) (0.447) (0.245)** (0.632)** (0.251) (0.594) Fraction of children –1.562 –0.521 –1.595 –0.341 –1.253 0.731 –1.214 –0.852 (0.337)*** (0.809) (0.599)*** (1.493) (0.545)** (1.296) (0.429)*** (1.316) Fraction of female adults –0.186 –0.284 0.297 0.475 –1.408 –0.372 –0.080 0.434 (0.449) (0.648) (0.640) (0.805) (1.019) (1.451) (0.627) (1.385) Fraction of elderly 0.769 –0.231 1.040 –0.081 –1.731 –0.459 –1.276 –0.011 (0.748) (0.688) (0.845) (1.162) (1.516) (1.644) (1.015) (1.240)
0.022 0.238 0.080 0.535 0.080 –0.589 0.009 0.814 Log of land the household owned (0.074) (0.170) (0.171) (0.229)** (0.100) (0 .364)* (0.083) (0.261)***
0.135 0.119 0.149 –0.046 0.320 0.228 0.220 0.179 Average age of the household (0.030)*** (0.064)* (0.111) (0.200) (0.061)*** (0.169) (0.039)*** (0.093)** Average age squared of the household
–0.002 (0.000)***
–0.001 (0.001)**
–0.002 (0.001)
0.000 (0.002)
–0.005 (0.001)***
–0.003 (0.002)
–0.004 (0.001)***
–0.002 (0.001)**
–0.892 –0.093 –0.026 0.157 –1.109 –0.078 –1.310 –0.843 Average degree of the household (0.105)*** (0.174) (0.141) (0.235) (0.180)*** (0.383) (0.144)*** (0.339)***
1.170 –9.931 –0.506 –24.209 1.211 1.346 2.185 –8.988 Inflation index (0.377)*** (2.145)** (0.886) (3.504)*** (0.875) (2.407) (0.479)*** (3.150)***
0.213 0.301 1.413 21.251 0.168 1.484 0.238 –0.477 Living in rural (1 = yes, 0 = no) (0.182) (0.469) (2.575) (5.542)*** (0.220) (0.875) (0.252) (0.660) Jiangsu 0.369 –1.405 (0.152)** (0.452)*** Shandong –0.274 –0.533 (0.287) (0.460) Henan 0.615 –2.347 (0.230)*** (0.589)*** Hubei 0.770 –0.505 (0.128)*** (0.437) Hunan –1.055 –2.596 (0.516)** (0.639)***
0.324 –2.360 Guangxi (0.142)** (0.394)***
R2 (within) 0.26 0.11 0.20 0.23 0.39 0.11 0.52 0.08 Test of the null hypothesis of separability
29.85*** 0.94 15.86*** 1.19 13.33*** 10.38** 14.57*** 3.65
Number of households in each year
402 402 137 137 106 106 159 159
65Retesting the Separability of China’s Rural Households
©2012 The AuthorsChina & World Economy ©2012 Institute of World Economics and Politics, Chinese Academy of Social Sciences
provinces of Henan, Hubei and Hunan, where the effects are positive and significant. Forthe other household composition variables, the pre-2004 estimation results show that thefraction-of-children variable has a negative and significant effect. This could probablyexplain the important roles rural children play in the production process. After 2004, however,the household composition variables show no significant effects, and the fraction of femaleadults and the elderly have no significant impacts on labor use in agricultural production.
The land-size variable has a significantly positive impact on labor use in eastern andwestern China after 2004. The separability hypothesis is rejected in these two areas after2004, which suggests that the surplus labor condition may no longer exist after 2004.However, for central China, where the separability hypothesis is not rejected in the post-2004 period, household land size has a significant negative impact on labor use in agriculturalproduction, which suggests that farming in these areas is not labor intensive and surpluslabor may still exist. Figures in Table 3 indicate that rural households in the eastern and thewestern regions have reduced the number of working days by more than half, andhouseholds in the central region have also reduced working days, but not as much as theireastern and western counterparts. This may support the argument that the rural labormarkets in central China remain underdeveloped and that surplus labor still exists.
The provinces of Jiangsu and Shandong in eastern China are much richer than thecentral provinces, while the western provinces are the poorest. Regression results for therichest and the poorest groups fail to reject the null hypothesis of separability, and thisimplies non-separability in the post-2004 period for groups in the central region. A possibleexplanation could be that, for the poorest regions, rural workers have to migrate to seekmore off-farm income because of poverty and lack of land, and leave their children and theelderly at home. This is evident by the highest percentages of children and elderly in thewestern region compared to the other regions. In the richest regions, the labor markets aremore developed and provide better opportunities for rural workers to obtain off-farm jobslocally. However, for the central provinces of Henan, Hubei and Hunan, rural householdshave more cultivated land and the labor markets are less developed, which may constrainlabor outmigration and lead to the creation of surplus agricultural labor. This might alsoexplain why agricultural income accounts for the highest proportion of total incomes (seeTable 2) of households in the central provinces.
V. Conclusions
In the present paper, we tested the separability of China’s rural households, regionaldifferences in separability and changes in separability over time. Controlling for factorswith unobservable effects on labor demand decisions, we use cross-sectional and panel
66 Cuirong Wu, Xian Xin / 54–68, Vol. 20, No. 3, 2012
©2012 The AuthorsChina & World Economy ©2012 Institute of World Economics and Politics, Chinese Academy of Social Sciences
specifications to perform our regressions. The regression results generally support thatrural China progressed from non-separability to separability around the year 2004. Moreover,except for the central region, the estimation results for both the entire country and regionsrejected the separability hypothesis before 2004 but failed to reject it after 2004. The findingsof the present paper imply that, before 2004, the labor market in rural China wasunderdeveloped, but became more developed after 2004 when labor became freelyexchangeable on the labor market. Failure to reject the separability hypothesis does notmean that a perfect labor market exists, but indicates whether surplus labor exists. Theseresults suggest that China’s surplus labor supply is dwindling, especially in the easternand the western regions. The sustainability of China’s high economic growth is questionablein the absence of a large reservoir of surplus rural labor. Central China may still havesurplus labor and the labor market is segmented from the national labor market. Opportunitiesfor the development of labor-intensive industries may still be available in central China. Onthe whole, to maintain sustainable economic growth, China should restructure its economyto replace labor intensive sectors with capital and knowledge intensive sectors.
References
Anil, B. Deolalikar, 1988, “Nutrition and labor productivity in agriculture: Estimates for rural southIndia,” The Review of Economics and Statistics, Vol. 70, No. 3, pp. 406–13.
Arcand, Jean-Louis and Beatrice d’Hombres, 2006, “Testing for separation in agricultural householdmodels and unobservable household-specific effects,” MPRA Paper No. 1863, Munich: MunichPersonal RePEc Archive.
Benjamin, Dwayne, 1992, “Household composition, labor markets, and labor demand: Testing forseparation in agricultural household models,” Econometrica, Vol. 60, No. 2, pp. 287–322.
Bowlus, Audra J. and Terry Sicular, 2003, “Moving toward markets? Labor allocation in ruralChina,” Journal of Development Economics, Vol. 71, No. 2, pp. 561–83.
Cai, Fang, Yang Du and Changbao Zhao, 2007, “Regional labour market integration since China’sWTO entry: Evidence from household-level data,” in Ross Garnaut and Ligang Song, eds,China: Linking Markets for Growth, Canberra: Asia Pacific Press, pp. 33–5.
Cai, Fang and Meiyan Wang, 2008, “A counterfactual analysis on unlimited surplus labor in ruralChina,” China & World Economy, Vol. 16, No. 1, pp. 51–65.
Carter, Michael and Yang Yao, 2002, “Local versus global separability in agricultural householdmodels: The factor price equalization effect of land transfer rights,” American Journal ofAgricultural Economics, Vol. 84, No. 3, pp. 702–15.
Chayanov, Alexander V., 1926, “Peasant farm organization,” in Daniel Thorner, Basile Kerblay andRobert Smith, eds, A.V. Chayanov on the Theory of Peasant Economy, Madison: University ofWisconsin Press.
67Retesting the Separability of China’s Rural Households
©2012 The AuthorsChina & World Economy ©2012 Institute of World Economics and Politics, Chinese Academy of Social Sciences
Chen, Xiwen, 2010, “Issues of China’s rural development and policies,” China Agricultural EconomicReview, Vol. 2, No. 3, pp. 233–39.
Chen, Zongsheng and Defu Li, 2004, “A growth model of dual economy with endogenous agriculturaltechnology progress ―The re-analysis of ‘East Asian Miracle’ and Chinese economy,” JingjiYanjiu (Economic Research Journal), Vol. 39, No. 11, pp. 12–27.
Cook, Sarah, 1999, “Surplus labour and productivity in Chinese agriculture: Evidence from householdsurvey data,” Journal of Development Studies, Vol. 35, No. 3, pp. 16–44.
Du, Yang and Weiguang Pan, 2009, “Minimum wage regulation in China and its application to migrantworkers in the urban labour market,” China & World Economy, Vol. 17, No. 2, pp. 79–93.
Fan, Cindy, 2009, “Flexible work, flexible household: labor migration and rural families in China,”Research in the Sociology of Work, Vol. 19, Part II, pp. 377–408.
Feder, Gershon, Lawrence J. Lau, Justin Yifu Lin and Xiaopeng Luo, 1990, “The relationshipbetween credit and productivity in Chinese agriculture: A microeconomic model ofdisequilibrium,” American Journal of Agricultural Economics, Vol. 72, No. 4, pp. 1151–7.
Gavian, Sarah and Marcel Fafchamps, 1996, “Land tenure and allocative efficiency in Niger,” AmericanJournal of Agricultural Economics, Vol. 78, No. 2, pp. 460–71.
Grimard, Franque, 2000, “Rural labor markets, household composition, and rainfall in Côte d’Ivoire,”Review of Development Economics, Vol. 4, No. 1, pp. 70–86.
Hu, Jingbei, 2009, “Intersectoral migration of agricultural labor force and business cycles in developingcountries,” Working Paper No. 402, Stanford Center for International Development, StanfordUniversity, Stanford, CA.
Kevane, Michael, 1996, “Agrarian structure and agricultural practices in western Sudan,” AmericanJournal of Agricultural Economics, Vol. 78, No. 1, pp. 236–45.
Knight, John, Quheng Deng and Shi Li, 2010, “The puzzle of migrant labor shortage and rural laborsurplus in China,” University of Oxford Discussion Paper Series No. 494, University ofOxford, Oxford.
Kwan Fung, 2009, “Agricultural labour and the incidence of surplus labour: Experience from Chinaduring reform,” Journal of Chinese Economic and Business Studies, Vol. 7, No. 3, pp. 341–61.
Lewis, W. Arthur, 1954, “Economic development with unlimited supplies of labor,” The ManchesterSchool Economic and Social Studies, Vol. 22, No. 2, pp. 139–91.
Li, Yuheng, 2011, “Urban–rural interaction in China: Historic scenario and assessment,” ChinaAgricultural Economic Review, Vol. 3, No. 3, pp. 335–49.
Lin, Justin Yifu and Ruoen Ren, 2007, “East Asian miracle debate revisited,” Jingji Yanjiu (EconomicResearch Journal), Vol. 42, No. 8, pp. 4–12.
Meng, Xin and Nansheng Bai, 2008, “How much have wages of unskilled workers in Chinaincreased?” in Ross Garnaut and Ligang Song, eds, China: Linking Markets for Growth,Canberra, Asian Pacific Press, pp. 151–75.
Park, Albert, Fang Cai and Yang Du, 2009, “Can China meet her employment challenges?” JinrongYanjiu (Journal of Financial Research), No. 8, pp. 17–34.
Pitt, Mark Martin and Mark Rosenzweig, 1986, “Agricultural prices, food consumption, and the
68 Cuirong Wu, Xian Xin / 54–68, Vol. 20, No. 3, 2012
©2012 The AuthorsChina & World Economy ©2012 Institute of World Economics and Politics, Chinese Academy of Social Sciences
health and productivity of Indonesian farmers,” in Inderjit Singh, Lyn Squire and John Strauss,eds, Agricultural Household Models: Extensions, Applications, and Policy, Baltimore MD:Johns Hopkins University Press, pp. 153–82.
Sadoulet, Elisabeth, Alain De DeJanvry and Catherine Benjamin, 1998, “Household behavior withimperfect labor market,” Industrial Relations, Vol. 37, No. 1, pp. 85–108.
Singh, Inderjit, Lyn Squire and John Strauss, 1986, Agricultural Household Models: Extensions,Applications, and Policy, Baltimore MD: Johns Hopkins University Press.
Udry, Christopher, 1996, “Gender, agricultural production, and the theory of the household,” Journalof Political Economy, Vol. 104, No. 5, pp. 1010–46.
Wang, Dewen, 2008, “Lewisian turning point: Chinese experience,” in Cai Fang, ed., Reports onChinese Population and Growth No. 9: Linking up Lewis and Kuznets Turning Points, Beijing:Social Sciences Academic Press (in Chinese).
World Bank, 1997, China 2020: Development Challenges in the New Century, Washington, DC:World Bank.
Xin, Xiangfei and Fu Qin, 2011, “Decomposition of agricultural labor productivity growth and itsregional disparity in China,” China Agricultural Economic Review, Vol. 3, No. 1, pp. 92–100.
Yardley, Jim and David Barboza, 2005, “China sees beginning of a labor shortage,” New York Times,4 April. Available from http://www.nytimes.com/2005/04/03/business/worldbusiness/03iht-yuan.html.
Yu, Kang, Xiangfei Xin, J. Alexander Nuetah and Ping Guo, 2011, “Agricultural growth dynamics anddecision mechanism in Chinese provinces: 1988–2008,” China Agricultural Economic Review,Vol. 3, No. 2, pp. 150–70.
(Edited by Zhinan Zhang)