retention of water in soil and the soil … · 4 soil water characteristic ... until the capillary...
TRANSCRIPT

SOIL WATER CHARACTERISTIC 1
RETENTION OF WATER IN SOIL AND THE SOIL WATER CHARACTERISTIC CURVE (Revised 09/13/2003)
Markus Tuller, Department of Plant, Soil & Entomological Sciences University of Idaho, Moscow, Idaho, USA
Dani Or, Department of Civil and Environmental Engineering University of Connecticut, Storrs, Connecticut, USA
Introduction A soil water characteristic (SWC) curve describes the amount of water retained in a soil (expressed as mass or volume water content, θm or θv) under equilibrium at a given matric potential. A SWC is an important hydraulic property related to size and connectedness of pore spaces; hence strongly affected by soil texture and structure, and by other constituents including organic matter. Modeling water distribution and flow in partially-saturated soils requires knowledge of the SWC, therefore plays a critical role in water management and in prediction of solute and contaminant transport in the environment. Typically a SWC is highly nonlinear and is relatively difficult to obtain accurately. Because the matric potential extends over several orders of magnitude for the range of water contents commonly encountered in practical applications, the matric potential is often plotted on a logarithmic scale. Figure 1 depicts representative SWC curves for soils of different textures, demonstrating the effects of porosity (saturated water content) and the varied slopes of the relationships resulting from variable pore size distributions.
Figure 1: Typical soil water characteristic curves for soils of different texture.

2 SOIL WATER CHARACTERISTIC
The Matric Potential
As discussed in the article on “Soil Water Potential” in this Encyclopedia, the matric potential is attributed to capillary and adsorptive forces acting between liquid, gaseous, and solid phases. Capillarity results from the surface tension of water, and its contact angle with the solid particles. Under partially saturated conditions (i.e., in the presence of the non-wetting air phase), curved liquid-vapor interfaces (menisci) form within the porous soil system. Menisci radii of curvature (R) are a function of capillary pressure (Pc) and are calculated according to the Young-Laplace equation:
R2PPP c0
σ∆ ==− (1)
where P0 is the atmospheric pressure (conventionally referenced as zero), Pc is the pressure of the soil water, and σ is the surface tension of the liquid-vapor interface. If soil pores were behaving as a bundle of capillary tubes, capillarity would be sufficient to describe the relationships between matric potential and soil pore radii. However, in addition to capillarity, the soil also exhibits adsorption, which forms hydration envelopes over the particle surfaces (Hillel, 1998). The presence of water in films is most important in clayey soils with large surface area, and is influenced by the electric double layer and the exchangeable cations present. In sandy soils, adsorption is relatively insignificant and the capillary effect predominates. In general, however, matric potential results from the combined effect of capillarity and surface adsorption. The capillary "wedges" are at a state of internal equilibrium with adsorption "films," and the two cannot be considered separately. For a more detailed discussion see Tuller et al. (1999), and articles on “Capillarity” and “Soil Water Potential” in this Encyclopedia.
The Bundle of Cylindrical Capillaries (BCC) Model
Early conceptual models for the SWC and liquid distribution in partially saturated porous media are based on the "bundle of cylindrical capillaries" (BCC) representation of pore space geometry (Millington and Quirk, 1961; Mualem, 1976). The BCC representation postulates that at a given matric potential a portion of interconnected cylindrical pores is completely liquid-filled whereas larger pores are completely empty (Fig.2). This convenient idealization of soil pore space enables a linkage between the soil pore size distribution and the SWC based on the capillary rise equation (see article on “Capillarity” in this Encyclopedia). However, such representation imposes serious limitations on the practical application of the BCC model to natural porous media as discussed in the following section, including the unrealistic underlying geometry that precludes dual water-air occupancy within the same pores, and lack of consideration of adsorbed water films.

SOIL WATER CHARACTERISTIC 3
Figure 2: Conceptual sketch showing the relationship between the BCC pore space representation and the SWC. Greater capillary rise occurs in smaller pores, which have smaller radii of meniscus curvature.
Liquid Retention and Pore Shape
Liquid retention in the porous soil matrix is highly dependent on the shape and angularity of individual pores. Inspection of thin sections or soil micrographs (Fig.3) reveals that natural pore spaces do not resemble cylindrical capillaries, as often assumed for an idealized representation. Because natural porous media are formed by aggregation of primary particles and mineral surfaces, the resulting pore space is more realistically described by angular or slit-shaped pore cross sections than by cylindrical capillaries (Li and Wardlaw, 1986; Mason and Morrow, 1991). In addition to a more realistic representation of natural pore spaces, angular pores offer other advantages over cylindrical tubes in terms of liquid behavior. When angular pores are drained, a fraction of the wetting phase remains in the pore corners (Fig.3c). This aspect of “dual occupancy” of the invaded portion of the tube (Morrow and Xie, 1998), not possible in cylindrical tubes, more realistically represents liquid configurations and mechanisms for maintaining hydraulic continuity in porous media (Dullien et al., 1986). Liquid-filled corners and crevices play an important role in displacement rates of oil (Blunt et al., 1995) and in other transport processes in partially saturated porous media.

4 SOIL WATER CHARACTERISTIC
Figure 3: Angular pore spaces in natural porous media; (a) thin section of Devonian Sandstone (Roberts and Schwartz, 1985); (b) scanning electron micrograph (SEM) of calcium-saturated montmorillonite; and (c) liquid retention in triangular and cylindrical pores.
Tuller et al. (1999) provide relationships between liquid retention and pore angularity. The water-filled cross-sectional area Awt for all regular and irregular triangles and for regular higher-order polygons is given by the following expression:
( )γFrAw 2t ⋅= (2)
where r is the radius of curvature of the liquid-vapor interface that is dependent on chemical potential (µ) or capillary pressure (pc) according to the Young-Laplace equation,
r
porr c
σρ
σµ == (3)
with σ as the surface tension of the liquid, ρ the density of the liquid, and F(γ) a shape or angularity factor dependent on angularity of the pore cross section only (Tuller and Or, 2001). Note that in this discussion we consider capillary behavior only, ignoring adsorbed liquid films that cover the flat pore surfaces.
In contrast to the piston-like filling or emptying of circular capillaries, angular pores undergo different filling stages and spontaneous displacement in the transition from dry to wet or vice versa. At relatively dry conditions (low chemical potentials) thin liquid films are adsorbed on all flat surfaces of the angular pore, and liquid accumulates in corners due to capillary forces. A further increase in chemical potential leads to further increase of film thickness and to an increase of the radius of capillary interface curvature in the corners, until the capillary corner menisci contact to form an inscribed circle. At this

SOIL WATER CHARACTERISTIC 5
critical potential, liquid fills up the central pore spontaneously (pore snap-off). The radius of interface curvature at this critical point is equal to the radius of an inscribed circle in the pore cross section (Tuller et al., 1999):
])(F[4
PP
A2rimb πγ +=
⋅= (4)
where rimb is the radius of spontaneous imbibition, A is pore cross-sectional area, and P is the perimeter of the pore cross section. For drainage, at a certain potential a liquid-vapor meniscus invades the pore and liquid is displaced from its center leaving liquid in the corners (Mason and Morrow, 1991). The radius of curvature at onset of drainage, rd, is expressed in terms of perimeter (P), and the angularity factor F(γ) (Tuller et al., 1999):
( )( ) ( )( ) ]FF[2
Prdπγππγ +⋅++⋅
= (5)
An illustrative example of the effects of pore shape (and angularity) on imbibition and drainage processes is depicted in Fig.4, showing marked differences between cylindrical and angular pores having equal pore cross sectional areas. Liquid displacement in cylindrical tubes during drainage is piston-like, leaving no liquid in the cross-section after the drainage threshold. Angular pores, on the other hand, show that liquid is displaced from the central region first (at a radius of curvature given by Eq.5), leaving some liquid in the corners. Subsequent decrease in chemical potential results in commensurate decreasing amounts of liquid in the corners ("lower" chemical potential or capillary pressure indicates more negative values, much like the terminology for the subzero temperature scale). The threshold chemical potential for different pore shapes with the same cross-sectional area increases (becomes less negative) with increasing angularity factor F(γ). The same holds for the amount of liquid held in the corners.
The conditions during imbibition are slightly different. Liquid-vapor interfaces in corners of angular pores expand with increasing chemical potential to the point of "snap-off" (Eq.4), at which time the pore completely fills up with liquid. The threshold chemical potential for "snap-off" increases with angularity F(γ), and the amount of liquid held in the corners at a given chemical potential is directly proportional to angularity. Highly angular pore shapes, such as triangular pores, retain more liquid at the same potential than squares or hexagons (Fig. 4). In the extreme case of cylindrical tubes no liquid is held prior to spontaneous filling by "snap-off" (the “empty-full” behavior).

6 SOIL WATER CHARACTERISTIC
Figure 4: Capillary phenomena (imbibition and drainage) in pores with different cross-section
shapes but identical pore cross-sectional area (see text for details).
Modeling SWC Measuring the SWC is laborious and time consuming. Measured θ −ψ pairs are often fragmentary, and usually constitute relatively few measurements over the wetness range of interest. For modeling and analysis purposes and for characterization and comparison between different soils and scenarios it is therefore beneficial to represent the SWC in a mathematically continuous form. Several approaches ranging from empirical parametric expressions, to physically based models with parameters derived from measurable medium properties, to pore network or Lattice Boltzmann simulations can be employed to represent a continuous SWC.

SOIL WATER CHARACTERISTIC 7
Empirical SWC models Key requirements for all parametric SWC expressions are parsimony (as few parameters as possible) to simplify parameter estimation, and accurate description of SWC behavior at the limits (wet and dry ends) while closely fitting the nonlinear shape of θ -ψm measurements. An effective and commonly used parametric model for relating water content or effective saturation (Θ) to the matric potential was proposed by van Genuchten (1980) and is denoted as VG:
) (+11 =
- - = n
m
m
rs
r
ψαθθθθΘ (6)
θr and θs are the residual and saturated water contents, respectively, ψm is matric potential, and α, n, and m are parameters directly dependent on the shape of the θ(ψ) curve. A common simplification is to assume that m=1-1/n. Thus the parameters required for estimation of the model are θr, θs, α, and n. θs is sometimes known and is easy to measure, leaving only the three unknown parameters θr, α and n to be estimated from the experimental data in many cases. Note that θr is sometimes taken as θ at -1.5 MPa, θair dry, or a similar meaningful value, though it is often advantageous to use it as a fitting parameter. Earlier versions of “van Genuchten type” power function models were proposed by Brutsaert (1966) and Ahuja and Swartzendruber (1972). Vogel and Císlerová (1988) and Kosugi (1994) modified Eq.6 to include the matric potential at the air entry point. Another well-established parametric model was proposed by Brooks and Corey (1964) and is denoted as BC:
bm
bmm
b
rs
r
1
= - - =
ψψΘ
ψψψψ
θθθθΘ
λ
≤=
>
(7)
where ψb is a parameter related to the soil matric potential at air entry (b represents "bubbling pressure"), and λ is related to the soil pore size distribution. Matric potentials are expressed as positive quantities (i.e., in absolute values) in both VG and BC parametric expressions. Campbell (1974) uses the same power law function as BC to express degree of saturation (S=θ/θs) as a function of the air entry potential ψb and a factor b that can be related to soil texture:
b1
m
b
s =
ψψ
θθ (8)
ψb and b are derived as functions of the geometric mean diameter and geometric
8 SOIL WATER CHARACTERISTIC
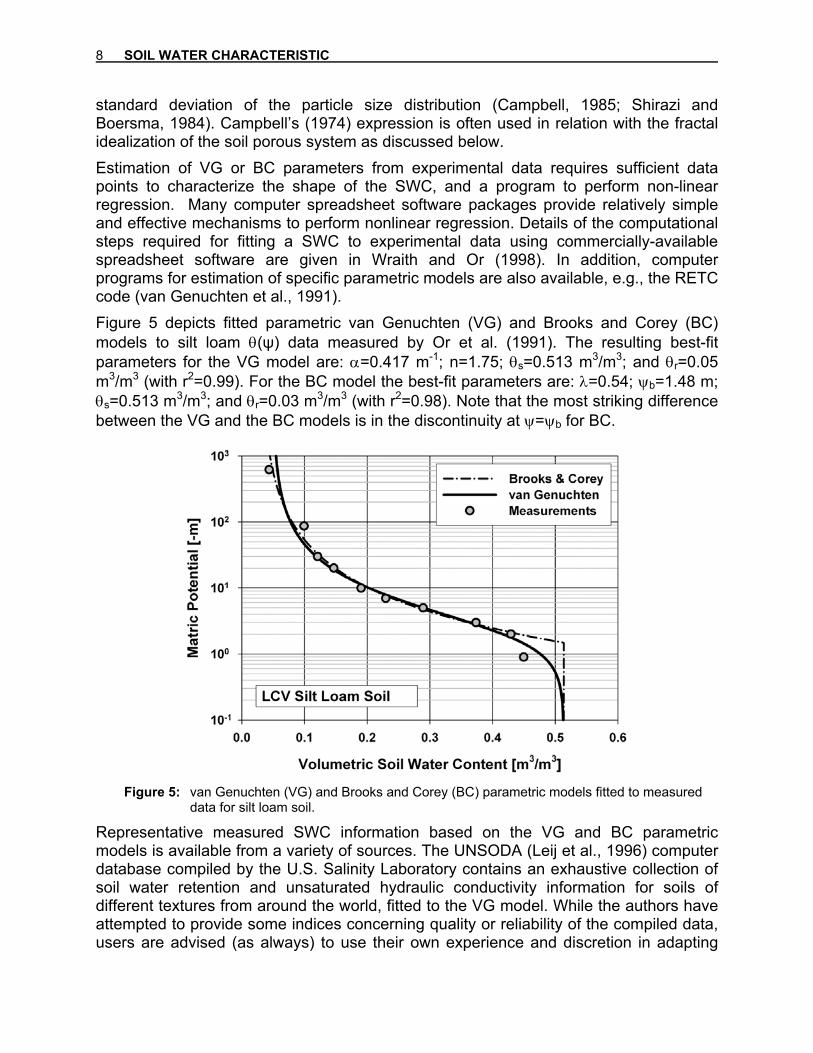
standard deviation of the particle size distribution (Campbell, 1985; Shirazi and Boersma, 1984). Campbell’s (1974) expression is often used in relation with the fractal idealization of the soil porous system as discussed below. Estimation of VG or BC parameters from experimental data requires sufficient data points to characterize the shape of the SWC, and a program to perform non-linear regression. Many computer spreadsheet software packages provide relatively simple and effective mechanisms to perform nonlinear regression. Details of the computational steps required for fitting a SWC to experimental data using commercially-available spreadsheet software are given in Wraith and Or (1998). In addition, computer programs for estimation of specific parametric models are also available, e.g., the RETC code (van Genuchten et al., 1991). Figure 5 depicts fitted parametric van Genuchten (VG) and Brooks and Corey (BC) models to silt loam θ(ψ) data measured by Or et al. (1991). The resulting best-fit parameters for the VG model are: α=0.417 m-1; n=1.75; θs=0.513 m3/m3; and θr=0.05 m3/m3 (with r2=0.99). For the BC model the best-fit parameters are: λ=0.54; ψb=1.48 m; θs=0.513 m3/m3; and θr=0.03 m3/m3 (with r2=0.98). Note that the most striking difference between the VG and the BC models is in the discontinuity at ψ=ψb for BC.
Figure 5: van Genuchten (VG) and Brooks and Corey (BC) parametric models fitted to measured
data for silt loam soil.
Representative measured SWC information based on the VG and BC parametric models is available from a variety of sources. The UNSODA (Leij et al., 1996) computer database compiled by the U.S. Salinity Laboratory contains an exhaustive collection of soil water retention and unsaturated hydraulic conductivity information for soils of different textures from around the world, fitted to the VG model. While the authors have attempted to provide some indices concerning quality or reliability of the compiled data, users are advised (as always) to use their own experience and discretion in adapting

SOIL WATER CHARACTERISTIC 9
others’ data to their own applications. Regression studies by McCuen et al. (1981) and Rawls and Brakensiek (1989) provide a wealth of information on the Brooks-Corey parameter values for many soils. These include estimation of the hydraulic parameters based on other, often more easily available soil properties. These estimates may be sufficiently accurate for some applications and could be used to obtain first-order approximations. Table 1 contains listed values for the van Genuchten parameters α and n, and the residual and saturated water contents for various soil textural classes compiled from the UNSODA database (Leij et al., 1996). Note that substantial variation in SWC relationships for given soil textural classes is to be expected.
Table1: Typical van Genuchten model parameters (α, n) including residual (θr) and saturated (θs) water contents compiled from the UNSODA database (Leij et al., 1996). N indicates the number of soils or samples of a given textural class from which the mean values are compiled.
Textural Class N θr
[cm3/cm3]
θs
[cm3/cm3] α
[1/cm] n
Sand 126 0.058 0.37 0.035 3.19 Loamy Sand 51 0.074 0.39 0.035 2.39 Sandy Loam 78 0.067 0.37 0.021 1.61 Loam 61 0.083 0.46 0.025 1.31 Silt 3 0.123 0.48 0.006 1.53 Silt Loam 101 0.061 0.43 0.012 1.39 Sandy Clay Loam 37 0.086 0.40 0.033 1.49 Clay Loam 23 0.129 0.47 0.030 1.37 Silty Clay Loam 20 0.098 0.55 0.027 1.41 Silty Clay 12 0.163 0.47 0.023 1.39 Clay 25 0.102 0.51 0.021 1.20
The models introduced so far can be categorized as empirical curve-fitting functions with free model parameters related to the specific shape of the employed mathematical function, rather than to physical properties of the porous medium. Brutsaert (1966), and more recently Kosugi (1994, 1996), established relationships between the SWC and the pore-size distribution, which can be described as a statistical log-normal distribution function. They idealized the soil porous system as a bundle of cylindrical capillaries (BCC) with log-normal distributed radii, and apply the capillary rise equation (see article on “Capillarity” in this Encyclopedia) to establish a relationship between the matric potential and effective medium saturation.
The applicability of the latter models is limited to coarse-textured soils and to conditions where capillary forces are the major contributor to the matric potential. They tend to fail in finer textured soils with high specific surface area (e.g., clay soils) where adsorptive surface forces dominate, especially under drier conditions (see article on “Soil Water Potential in this Encyclopedia).

10 SOIL WATER CHARACTERISTIC
Fractal Representation of the Soil Pore Space and the SWC Fractals are hierarchical, often highly complex, spatial or temporal systems that are generated with iterative algorithms obeying simple scaling rules. Patterns within such systems repeat themselves over a defined range of scales (self similarity). This enables the reproduction of statistical properties of a particular pattern at other length or time scales. Fractal geometry as introduced by Mandelbrot (1975) can be applied to quantitatively describe irregularity and shape of natural objects by estimating their fractal dimension. Several theoretical models have been proposed to derive the SWC from the fractal representations of the soil porous system. There are two general approaches, based on either surface or mass fractals. Surface fractal models assume that water is only present in the form of adsorbed liquid films on pore surfaces (Toledo et al., 1990), whereas mass fractal models (Ahl and Niemeyer, 1989; Tyler and Wheatcraft, 1990; Pachepsky et al., 1995; Perfect, 1999) assume that only capillary water obeying the capillary rise equation is present within the fractal system. As with the BCC approach (see above) fractal models for the SWC are based on derivation of the pore size distribution from the fractal structure under consideration, neglecting pore connectivity and topology issues. Crawford (1994) presented the following relationship between the mass-fractal dimension (Dm) and the degree of saturation (S):
( )edmD
bm = S
−
ψψ (9)
where ψm is the matric potential under consideration, ψb is the matric potential at the air entry point, and de is the embedding dimension. The embedding dimension equals 2 in two-dimensional systems and 3 in three-dimensional space. Note that the mass-fractal dimension Dm is always less than de. Due to the identical functional form, Eq.9 is commonly equated with Campbell’s (1974) version of the Brooks and Corey (1964) SWC function (Eq.8) to derive Campbell’s (1974) b-factor from the fractal dimension
( )( )em dD1b −−= . Values for the b-factor reported by Campbell (1985) are in favorable agreement with values calculated based on the mass fractal dimension obtained from bulk density data by Anderson and McBratney (1995). Bird et al. (1996), and more recently Giménez et al. (1997) pointed out that fractal approaches are limited due to the assumption that fractal scaling is valid over an infinite range of matric potentials. In reality natural porous media have lower and upper scaling limits as related to their minimum and maximum pore sizes. Perfect (1999) proposed a mass-based model for the SWC that accounts for the finite range of the matric potential. Systems that are fractal over a finite range of scales are called prefractal (Mandelbrot, 1982).
Physically Based Models for the SWC In contrast to the BCC and fractal approaches, Tuller et al. (1999) introduced an angular pore space model that accommodates both capillary and adsorptive phenomena on internal surfaces. Their basic unit pore element (Fig.6) is comprised of an angular central pore attached to slit shaped spaces, and is defined by the dimensionless slit-width and slit-length scaling parameters α and β, and the central pore length L. Variation of the cell parameters allows accommodation of a wide range soil textural and structural classes. Sandy soils for example may be represented by a relatively large

SOIL WATER CHARACTERISTIC 11
central pore length, and small values for β (i.e. small specific surface area). Fine textured soils (e.g., clays) on the other hand can be represented by relatively small L and large β to account for the high internal surface areas often observed in such soils.
Figure 6: Basic unit elements of the angular pore space model of Tuller et al. (1999)
Despite the higher complexity of the angular pore space model, it has distinct advantages over the more commonly applied BCC approach. First, angular pores more realistically represent natural porous medium pore space, and allow dual occupancy of wetting and non-wetting phases (see the section “liquid retention and pore shape” above). The potential of accommodating adsorptive surface forces leads to a more accurate derivation of the SWC for porous media with high specific surface areas as well as under dry conditions. Tuller et al. (1999) employ a modified form of the Augmented Young-Laplace equation that considers capillary and adsorptive contributions to the matric potential to calculate liquid-vapor interfaces within a cross-section of their angular pore model, and include dynamic liquid displacement mechanisms (see the section “liquid retention and pore shape” above) to derive SWC functions for imbibition or drainage at the pore-scale. Figure 7 depicts a typical transition of a unit element from dry to wet (imbibition) that includes spontaneous liquid displacement (snap-off) in slits (Fig. 7b) and in the central pore (Fig. 7d).
Figure 7: Conceptual sketch of unit element filling stages during imbibition

12 SOIL WATER CHARACTERISTIC
To represent liquid behavior at the sample scale, Or and Tuller (1999) introduced a statistical upscaling scheme using a gamma density function for the central pore length L. The gamma distribution was given preference because it resembles the commonly observed positive skewness of soil pore size distributions, and at the same time facilitates the derivation of analytical solutions for the SWC. The upscaling procedure leads to a physically based expression for the SWC, where the degree of saturation (S) defined as a function of matric potential is expressed as the sum of functions corresponding to various pore filling mechanisms and stages as depicted in Fig.7 (Or and Tuller, 1999; Tuller and Or, 2001). Fig.8 depicts a sample application for the Millville silt loam soil. Because the model calculates the configuration of liquid-vapor interfaces within pores and films, adsorptive and capillary contributions to the SWC can be separated (Fig.8a). Such separation is not possible with any of the empirical or semi-empirical approaches presented above. Another important feature of this model is the ability to predict liquid-vapor interfacial area (Fig.8b), an extremely important property for multiphase flow processes, bioremediation of contaminated soils, gas-exchange phenomena, or virus and colloid transport.
Figure 8: (a) Application of the angular pore space model for Millville silt loam soil. Note the capillary
and adsorptive contributions to the SWC. (b) Predicted liquid-vapor interfacial area using the model parameters determined for the SWC (SAe is the soil specific surface area).
Lattice Boltzmann Approach Lattice Boltzmann models (LBM) are descendants of lattice gas cellular automata, which follow the motions of individual particles and were first presented as a viable means of solving the Navier-Stokes equations in the landmark work of Frisch et al. (1986). In the most simplistic sense, LBMs work with distributions of particles at each lattice point rather than with individual particles. LBMs simulate interactions of hypothetical particles confined to a regular lattice which greatly enhances solvability of the Boltzmann equation. This has advantages for certain types of simulations in that averaging is not required to obtain smooth velocity fields. Chen and Doolen (1998) and Qian et al. (1995) reviewed application of LBMs for fluid flows. The Lattice Boltzmann method has emerged as a powerful tool for simulation of multiphase fluid systems including water and water vapor. The LBM incorporates

SOIL WATER CHARACTERISTIC 13
complex details of pore shape that characterize realistic porous media, fluid factors, and solid fluid interactions in a physically sound way, leading to realistic simulation of interfaces between different fluids or between a liquid and its vapor and adsorption of wetting films. Interfaces arise, deform, and migrate in virtually any pore geometry rather ‘naturally’ without the need for complex interface tracking algorithms. An example of LBM application to compute water retention in complex porous media is shown as insets in Figure 9, which are based on 2-dimensional imagery of a real soil. Vapor and liquid boundaries of equal pressure were applied to the top and bottom of the domain, respectively, in steps corresponding to equal increments of log(-matric potential). The matric potential is expressed in mass units per time step squared (equivalent to energy per unit volume in 3-D system). Each potential step was terminated when the relative change in fluid mass in the domain was negligibly small. The simulated liquid behavior and soil water characteristic curve show appreciable differences in fluid configurations during wetting and drying resulting from hysteresis.
Figure 9: LBM simulation of liquid distribution in complex pore system and computation of SWC
(Sukop and Or, 2003). Pore Network Models and the SWC For completeness, we mention the application of pore network modeling approaches for derivation of the SWC. Details regarding such modeling approaches are beyond the scope of this chapter. In the following we introduce the basic ideas and refer interested readers to comprehensive reviews by Celia et al. (1995) and Berkowitz and Ewing (1998), and books by Dullien (1992) and Sahimi (1995).

14 SOIL WATER CHARACTERISTIC
Network models were first developed by Fatt (1956) based on the idea that pore space may be represented as an interconnected network of capillary tubes whose radii represent the dimensions of the pores within a porous medium. For a given matric potential, liquid-vapor interfacial configurations within the network can be determined exactly based on pore-scale capillary and dynamic displacement considerations. The macroscopic SWC is then determined based on geometric volume averaging of the spatially distributed liquid within the network (Reeves and Celia, 1996). A primary advantage of pore network models is explicit consideration of pore connectivity and topology in a simplified and mathematically tractable framework. Some of the limitations involve oversimplification of pore scale physics (e.g., neglect of adsorptive pore scale processes), incomplete understanding of interface migration and routing, inference of network parameters from real samples is not well-established, and significant computational burden for detailed 3-D networks even at a core scale (>100 mm).
Hysteresis of the SWC Water content and the potential energy of soil water are not uniquely related because the amount of water present at a given matric potential is dependent on the pore size distribution and the properties of air-water-solid interfaces. A SWC relationship may be obtained by: (1) taking an initially saturated sample and applying suction or pressure to desaturate it (desorption); or by (2) gradually wetting an initially dry soil (sorption). These two pathways produce curves that in most cases are not identical; the water content in the "drying" curve is higher for a given matric potential than that in the "wetting" branch (Fig.10a). This is called "hysteresis", defined as "the phenomenon exhibited by a system in which the reaction of the system to changes is dependent upon its past reactions to change".
Figure 10: (a) Conceptual sketch showing hysteresis of the SWC. (b) The contact angle effect, and (c)
the ink bottle effect as potential mechanisms for hysteresis.

SOIL WATER CHARACTERISTIC 15
The hysteresis in SWC can be related to several phenomena, including (1) the "ink bottle" effect resulting from nonuniformity in shape and sizes of interconnected pores - drainage is governed by the smaller pore radius r, whereas wetting is dependent on the large radius R (Fig.10c); (2) different liquid-solid contact angles for advancing and receding water menisci (Fig.10b); (3) entrapped air in a newly wetted soil (e.g., pore doublet, Dullien, 1992) ; and (4) swelling and shrinking of the soil under wetting and drying. Based on early observations of the phenomenon by Haines (1930) and on more recent theories (Mualem, 1984; Kool and Parker, 1987) the role of individual factors remain unclear and are subject to ongoing research. Part of the hysteresis phenomena may be attributed to measurement artifacts, for example due to differences between tension- and pressure-induced desaturation (Chahal and Yong, 1965). A potentially important aspect of desorption methods under tension is the possibility of liquid displacement (drainage) even in the absence of a continuous gaseous phase due to cavitation initiated by entrapped gas bubbles or the liquid’s own vapor pressure (Or and Tuller, 2002). Surface heterogeneity and impurities in soil and rock water are conducive to lowering the cavitation tension threshold. Measurement of SWC Relationships A variety of methods may be used to obtain requisite θ – ψm values to estimate the SWC. Potential experimental problems include the limited functional range of the tensiometer, which is often used for in-situ measurements; inaccurate θ measurements in some cases; the difficulty in obtaining undisturbed samples for laboratory determinations; and a slow rate of equilibrium under low matric potential (i.e., dry soils). In-situ (in place) methods are preferred in characterizing SWC's, as is measuring over a wide range of ψm-θ values. An effective method to obtain simultaneous measurements of ψm and θV is by installing Time Domain Reflectometry (TDR) probes in close proximity to transducer tensiometers, with the attributes monitored during variable soil wetness. Large changes in ψm and θV are expected under highly evaporative conditions near the soil surface, or in the presence of active plant roots.
Pressure Plate Apparatus and Pressure Flow Cells The pressure plate apparatus comprises a pressure chamber enclosing a water-saturated porous plate, which allows water but not air to flow through its pores (Fig.11b). The porous plate is at atmospheric pressure at the bottom, while the top surface is at the applied pressure of the chamber. Soil samples, usually sieved to <2 mm, are placed in retaining rings in contact with the porous plate and allowed to saturate by immersion in water. The porous plate with saturated soil samples is then placed in the chamber and a known N2 or air gas pressure is applied to force water out of the soil through the plate. Water flows out of the soil until equilibrium between the force exerted by the air pressure and the force by which soil water is being held by the soil (ψm) is attained. Soil water retention at the wet end (<1 bar) is strongly influenced by the soil structure and its natural pore size distribution. Hence, "undisturbed" intact soil samples (cores) are preferred over repacked samples for this portion of the SWC. The pressure flow cell (also known as Tempe cell) can hold intact soil samples encased in metal rings (Fig.11a). The operation of the Tempe cell follows that of the pressure plate, except its pressure range is usually limited to 0 to 1 bar or 0.1 MPa. The porous ceramic plates used in pressure plates and flow cells must be completely water-saturated prior to use.

16 SOIL WATER CHARACTERISTIC
Following equilibrium between soil matric potential and the applied air pressure, the soil samples are removed from the apparatus, weighed wet, then oven dried to determine the mass water content gravimetrically. These may be converted to volume water contents through knowledge of the sample bulk densities. The water content of repacked soils at a given matric potential should not be used to infer θ of intact soils at the same ψm, due to modified pore sizes and pore geometry. Multiple pressure steps may be applied to the same soil samples when using Tempe cells. The cells may be sequentially disconnected from the pressure source, weighed to determine the change in water content from the previous step, then reconnected and the next pressure step applied. Outflow of water from the cells may be collected to calculate or confirm changes in sample water contents.
Figure 11: (a) Tempe pressure and flow cell ; and (b) pressure plate apparatus used to desaturate
soil samples to specified matric potentials.

SOIL WATER CHARACTERISTIC 17
Paired Sensors for Field SWC Measurement In spite of the importance of measuring SWCs in situ, few suitable methods are available for field or in situ application. Paired sensors may be used to measure θ and ψm in the same or closely-adjacent soil volumes, over a range of soil wetness. Examples include use of neutron moisture meter access tubes or TDR waveguides along with tensiometers. Application of paired sensors is often constrained by differences in soil volumes sampled by the respective sensors, different time constants required (e.g., many θ sensors obtain instantaneous measurements while many ψm methods require equilibrium), and the fact that few matric potential techniques function over the entire wetness range of interest. This commonly provides limited overlap in soil water retention measured using different techniques, and measurements obtained using different methods may not be consistent in the ranges of overlap. Figure 12 presents some common methods to measure or infer soil matric potential, including their respective ranges of application. Many of the available techniques have a limited range of overlap or do not overlap at all, and few of the methods are amenable to field measurements.
Figure 12: Some common SWC measurement methods and their corresponding matric potential ranges

18 SOIL WATER CHARACTERISTIC
Further Reading Ahl, C., Niemeyer, J., 1989. The fractal dimension of the pore volume inside soils. Z. Pflanzenernaehr.
Bodenkd. 152, 457–458.
Ahuja, L.R., and D. Swartzendruber, 1972. An improved form of soil-water diffusivity function. Soil Sci. Soc. Am. Proc. 36:9-14.
Anderson, A.N., and A.B. McBratney, 1995. Soil aggregates as mass fractals, Austr. J. Soil Res., 33:757-772.
Berkowitz, B., and R.P. Ewing, 1998. Percolation theory and network modeling applications in soil physics. Surveys in Geophysics 19:23-72.
Bird, N.R.A., Bartoli, F., Dexter, A.R., 1996. Water retention models for fractal soil structures. Eur. J. Soil Sci. 47:1–6.
Blunt, M., D. Zhou, and D. Fenwick, 1995. Three-phase flow and gravity drainage in porous media, Transport in porous media, 20, 77-103.
Brooks, R.H., and A.T. Corey, 1964. Hydraulic properties of porous media, Hydrology Papers, No.3, Colorado State University, Fort Collins, Colorado.
Brutsaert, W., 1966. Probability laws for pore size distributions, Soil Sci. 101:85-92.
Campbell, G.S., 1974. A simple method for determining unsaturated conductivity from moisture retention data, Soil Sci. 117(6):311-314.
Campbell, G.S., 1985. Soil Physics with BASIC: Transport Models for Soil-Plant Systems, 150 pp Elsevier, New York.
Celia, M. A., P. C. Reeves, and L. A. Ferrand, 1995. Recent advances in pore scale models for multiphase flow in porous media, U.S. Natl. Rep. Int. Union Geod. Geophys. 1991–1994, Rev. Geophys., 33:1049-1057.
Chahal, R.S., and R.N. Yong, Validity of the soil water characteristics determined with the pressure apparatus, Soil Sci., 99(2), 98-103, 1965.
Chen, S., and G.D. Doolen, 1998. Lattice Boltzmann method for fluid flows. Annu. Rev. Fluid Mech, 30, 329–364.
Crawford, J.W., 1994. The relationship between structure and the hydraulic conductivity of soil, Eur. J. Soil Sci. 45:493-502.
Dullien, F.A.L., 1992. Porous media: Fluid transport and pore structure (2nd ed.), Academic Press, San Diego.
Dullien, F.A.L., F.S.Y. Lai, and I.F. Macdonald, 1986. Hydraulic continuity of residual wetting phase in porous media, J. Colloid Interface Sci., 109(1), 201-218.
Fatt, I., 1956a. The network model of porous media, I. Capillary pressure characteristics’, Petroleum Transactions, AIME 207:144-159.
Fatt, I., 1956b. The network model of porous media, II. Dynamic properties of a single size tube network, Petroleum Transactions, AIME 207:160-163.
Fatt, I., 1956c. The network model of porous media, III. Dynamic properties of networks with tube radius distribution, Petroleum Transactions, AIME 207:164-177.
Frisch, U., B. Hasslacher, and Y. Pomeau., Lattice-gas automata for the Navier-Stokes equation, Phy. Rev. Let., 56, 1505-1508, 1986.
Giménez, D., E. Perfect, W.J. Rawls, and Y.A. Pachepsky, 1997. Fractal models for predicting soil hydraulic properties: a review. Eng. Geol. 48:161–183.
Haines, W. B. 1930. Studies in the physical properties of soil. V. The hysteresis effect in capillary

SOIL WATER CHARACTERISTIC 19
properties, and the modes of moisture distribution associated therewith, J. Agric. Sci., 20, 97-116.
Hillel, D., 1998. Environmental Soil Physics, Academic Press, San Diego.
Kool, J. B., and J. C. Parker. 1987. Development and evaluation of closed-form expressions for hysteretic soil hydraulic properties, Water Resour. Res., 23(1), 105-114.
Kosugi, K., 1994. Three-parameter lognormal distribution model for soil water retention, Water Resour. Res., 30(4), 891-901.
Kosugi, K., 1996. Lognormal distribution model for unsaturated soil hydraulic properties, Water Resour. Res., 32(9), 2697-2703.
Kutilek, M., and D. R. Nielsen. Soil hydrology. Catena Verlag, Germany.
Leij, F.J., W.J. Alves, M.Th. van Genuchten, and J.R. Williams. 1996. The UNSODA unsaturated hydraulic database. EPA/600/R-96/095, U.S. Environmental Protection Agency, Cincinnati, OH.
Li, Y., and N.C. Wardlaw, 1986. Mechanisms of nonwetting phase trapping during imbibition at slow rates. J. Colloid Interface Sci. 109, 473-486.
Mandelbrot, B.B., 1975. Les objets fractals: Forme, hasard et dimension. Flammarion, Paris, France.
Mandelbrot, B.B., 1982. The Fractal Geometry of Nature. Freeman, San Francisco, CA, 468 pp.
Mason, G., and N.R. Morrow, 1991. Capillary behavior of a perfectly wetting liquid in irregular triangular tubes, J. Colloid Interface Sci., 141(1), 262-274.
McCuen, R.H., W.J. Rawls, and D.L. Brakensiek. 1981. Statistical analysis of the Brook-Corey and Green-Ampt parameters across soil texture. Water Resour. Res. 17:1005-1013.
Milington, R.J., and J.P. Quirk, 1961. Permeability of porous media, Nature, 183, 387-388.
Morrow, N.R., and X. Xie, 1998. Surface energy and imbibition into triangular pores, In: M.Th. van Genuchten, F.J. Leij, and L. Wu (eds.), Proc. Int. Workshop on the Characterization and Measurement of the Hydraulic Properties of Unsaturated Porous Media, University of California, Riverside, CA.
Mualem, Y., 1976. A new model for predicting the hydraulic conductivity of unsaturated porous media, Water Resour. Res., 12(3):513-522.
Mualem, Y. 1984. A modified dependent domain theory of hysteresis. Soil Sci. 137:283-291.
Or, D., D. P. Groeneveld, K. Loague, and Y. Rubin. 1991. Evaluation of single and multi-parameter methods for estimating soil-water characteristic curves. Geotechnical Engineering Report No. UCB/GT/91-07, University of California, Berkeley, 54 pp.
Or, D., and M. Tuller, 1999. Liquid retention and interfacial area in variably saturated porous media: Upscaling from single-pore to sample-scale model, Water Resour. Res., 35(12):3591-3606.
Or, D., and M. Tuller, 2002. Cavitation during desaturation of porous media under tension. Water Resour. Res., Vol.38, No.5, 19.
Pachepsky, Y.A., Shcherbakov, R.A., Korsunskaya, L.P., 1995. Scaling of soil water retention using a fractal model. Soil Sci. 159, 99–104.
Perfect, E., 1999. Estimating soil mass fractal dimensions from water retention curves, Geoderma 88:221–231.
Qian, Y.H., S. Succi, S.A. Orszag, Recent advances in lattice Boltzmann computing, Ann. Rev. Comp. Phys., 30, 195-242, 1995.
Rawls, W.J., and D.L. Brakensiek. 1989. Estimation of soil water retention and hydraulic properties. p. 275-300. In H.J. Morel-Seytoux (Ed.) Unsaturated flow in hydraulic modeling theory and practice. NATO ASI Series. Series c: Mathematical and physical science. Vol. 275.
Reeves, P.C., and M.A. Celia, 1996. A functional relationship between capillary pressure, saturation, and

20 SOIL WATER CHARACTERISTIC
interfacial area as revealed by a pore-scale network model. Water Resour. Res., 32(8):2345-2358.
Roberts, J.N., and L.M. Schwartz, 1985. Grain consolidation and electrical conductivity in porous media, Physical Review B, 31(9), 5990-5997.
Sahimi, M., 1995. Flow and transport in porous media and fractured rock, VCH, Weinheim.
Shirazi, M.A., and L. Boersma, 1984. A unifying quantitative analysis of soil texture. Soil Sci. Soc. Am. J. 48:142-147.
Sukop, M., and D. Or, 2003, Lattice Boltzmann method for modeling liquid-vapor interface configurations in porous media, Water Resour. Res. (in review)
Toledo, P.G., R.A. Novy, H.T. Davis, and L.E. Scriven, 1990. Hydraulic conductivity of porous media at low water content, Soil Sci. Soc. Am. J., 54:673-679.
Tuller, M., and D. Or, 2001. Hydraulic conductivity of variably saturated porous media - Laminar film and corner flow in angular pore space. Water Resour. Res., 37(5):1257-1276.
Tuller, M., D. Or, and L.M. Dudley, 1999. Adsorption and capillary condensation in porous media -liquid retention and interfacial configurations in angular pores. Water Resour. Res., 35(7):1949-1964.
Tyler, S.W., Wheatcraft, S.W., 1990. Fractal processes in soil water retention. Water Resour. Res. 26, 1047–1054.
van Genuchten, M.Th., 1980. A closed-form equation for predicting the hydraulic conductivity of unsaturated soils, Soil Sci. Soc. Am. J., 44, 892-898.
van Genuchten, M.Th., F.J. Leij, and S.R. Yates, 1991. The RETC code for quantifying the hydraulic functions of unsaturated soils, EPA/600/2-91/065, US Environmental Protection Agency, Ada, OK.
Vogel, T., and M. Císlerová, 1988. On the reliability of unsaturated hydraulic conductivity calculated from the moisture retention curve, Transp. Porous Media, 3:1-15.
Wraith, Jon M., and Dani Or. 1998. Nonlinear parameter estimation using spreadsheet software. J. Nat. Resour. Life Sci. Educ. 27:13-19.