retail food group (asx:rfg) · retail food group (asx:rfg) 2 (1) as at 21 august 2015 (2) pre-tax...
TRANSCRIPT

Retail Food Group (ASX:RFG)
2 (1) As at 21 August 2015 (2) Pre-tax FY15 interim + final dividend divided by share price
RFG is Australia’s largest owner, developer & manager of retail food franchise systems • Network of c.2,450 outlets spanning 58 licensed global territories across 12 Brand Systems • Roaster and supplier of high quality coffee & affiliated products • Four coffee roasting facilities & 12 wholesale Brands supplying Australian & international markets
Corporate Brand Systems (Franchise)
ASX Code RFG Traditional Donut King
Index ASX200 Brumby’s Bakery
Share price(1) $4.92 Michel’s Patisserie
Shares on issue(1) 162,937,484 Coffee Retail Gloria Jean’s Coffees
Market cap(1) $801.7m It’s A Grind
Net debt(1) $192.2m bb’s Café/Esquires
Enterprise value(1) $993.9m QSR Crust Gourmet Pizza Bar
Final dividend (FY15) 11.75 cps Pizza Capers
Dividend yield(2) 6.76% Mobile Café2U
Board of Directors/Executive The Coffee Guy
Colin Archer Independent Non-executive Chairman Commercial & Wholesale (Commercial)
Anthony (Tony) Alford Managing Director Specialty Di Bella Coffee Group
Stephen Lonie Independent Non-executive Director Café Palazzo
Jessica Buchanan Independent Non-executive Director Roasted Addiqtion
Kerry Ryan (Appointed 27 Aug 15) Independent Non-executive Director Evil Child
Andre Nell CEO (Franchise) Roasting Facilities Roasting Australia (NSW)
Gary Alford CEO (Commercial) Di Bella Coffee (QLD)
Peter McGettigan CFO Evolution Roasters (NZ)
Mark Connors COO Maranatha LLC (USA)

Enviable Track Record
3
Sustained & sustainable outcomes demonstrate RFG continues to be a company in growth
(1) Underlying Results – refer Appendix 1 (2) Includes pre-tax dividends (3) Includes coffee EBITDA from franchise & wholesale (4) 1H15 + FY15 final dividend
Strong Growth Story
• Continues to deliver positive outcomes whilst reinvesting in long term acquisitive & organic growth
• Maiden FY07 dividends of 6.25cps increased c.370% to 23.25cps(4)
• Outlet population increased from c.330 to c.2,450 since Listing
• Established inaugural coffee roasting facility in 2008, with total Coffee & Allied Beverage operations now contributing 31.1% to FY15 Group EBITDA(3)
• Core of Executive Management Team has presided over entirety of growth since Listing
Historical Performance(1)
EBITDA CAGR since Listing: 27.6%
EBITDA CAGR (FY12-FY15): 20.4%
NPAT CAGR since Listing: 28.2%
NPAT CAGR (FY12-FY15): 24.6%
EPS CAGR since Listing: 17.1%
EPS CAGR (FY12-FY15): 10.5%
Dividend CAGR since Listing: 19.1%
Dividend CAGR (FY12-FY15): 10.0%
Total Shareholder Return (TSR) CAGR since Listing: 30.3%(2)
TSR CAGR (FY12-FY15): 32.9%(2)

FY15 Results
4

Record Achievements
(1) Underlying – refer Appendix 1 (2) Reported revenue less revenue associated with marketing pursuits (3) Share price change over FY15 + pre-tax dividends paid
FY15 Performance(1)
FY14 FY15 Change
Revenue(2) $128.8m $210.4m 63.4%
EBITDA $59.1m $88.8m 50.2%
NPAT $36.9m $55.1m 49.3%
Basic EPS 26.5cps 35.6cps 34.3%
Dividend (Full Year) 22.0cps 23.25cps 5.7%
Dividend Payout Ratio 75.9% 65.3%
Franchised Outlets (Global) 1,434 2,446 1,012
International Territories 9 58 49
Net Debt $57.4m $192.2m
Gearing Ratio 16.6% 33.1%
Interest Cover 12.3x 11.1x
5
Remarkable Outcomes
Transformed into genuine global enterprise with significant international footprint
Record
• EBITDA (up 50.2% to $88.8m)
• NPAT ($55.1m) consistent with guidance
• EPS of 35.6cps (34.3% increase on PCP)
• Final dividend increase to 11.75 cps (PCP: 11.25cps)
• Coffee business annualised throughput increased 4.32m kgs to 5.92m kgs
• 35% increase in Total Shareholder Return(3)
73% increase in network population (+1,012 outlets) to c.2,450 driven by acquisitions & organic new outlet commissionings
Completion of Company defining acquisitions
• Café2U (September 2014)
• Gloria Jean’s Coffees Group (December 2014)
• Di Bella Coffee (February 2015)
Business model delivering record performance & unique growth platform

Exemplary Performance & Shareholder Outcomes
0102030405060708090
100
FY09 FY10 FY11 FY12 FY13 FY14 FY15
$ M
illio
ns
EBITDA NPAT
6
EBITDA & NPAT(1) Dividends & EPS(1)
• EBITDA up 50.2% on PCP to $88.8m driven by contributions from strategic acquisitions
• EBITDA CAGR 20.4% (FY12-FY15)
• NPAT up 49.3% on PCP to $55.1m
• NPAT CAGR 24.6% (FY12-FY15)
• FY15 EBITDA conversion to cash flow ratio of 109.6%(2) (PCP: 85.8%)
• Cash flow conversion a continuing strength of Group’s business model
• Basic EPS up 34.3% on PCP to 35.6cps
• FY15 dividends increased 5.7% to 23.25cps
• 9th consecutive annual dividend increase
• Dividend payout ratio moderated to 65.3% (PCP: 75.9%)
• Continues to reward shareholders; whilst
• Supporting acquisitive & organic growth initiatives
(1) Underlying – refer Appendix 1 (2) 92.5% excluding impairment & provisioning charges
Rewarding shareholders with record earnings & dividends
0%10%20%30%40%50%60%70%80%90%
0
5
10
15
20
25
30
35
40
FY09 FY10 FY11 FY12 FY13 FY14 FY15
Cent
s pe
r Sh
are
Dividend EPS Dividend Payout Ratio (RHS)
Diversifying Platforms
7
Strength of Multi-Brand & Multi-Revenue Platforms
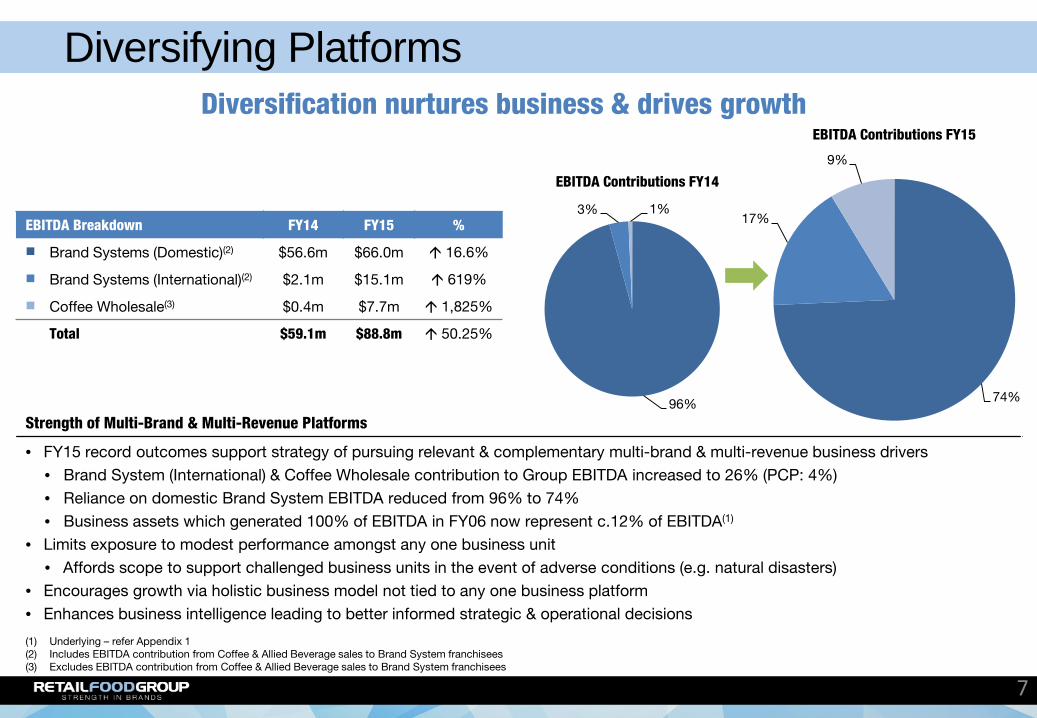
• FY15 record outcomes support strategy of pursuing relevant & complementary multi-brand & multi-revenue business drivers • Brand System (International) & Coffee Wholesale contribution to Group EBITDA increased to 26% (PCP: 4%) • Reliance on domestic Brand System EBITDA reduced from 96% to 74% • Business assets which generated 100% of EBITDA in FY06 now represent c.12% of EBITDA(1)
• Limits exposure to modest performance amongst any one business unit • Affords scope to support challenged business units in the event of adverse conditions (e.g. natural disasters)
• Encourages growth via holistic business model not tied to any one business platform • Enhances business intelligence leading to better informed strategic & operational decisions
(1) Underlying – refer Appendix 1 (2) Includes EBITDA contribution from Coffee & Allied Beverage sales to Brand System franchisees (3) Excludes EBITDA contribution from Coffee & Allied Beverage sales to Brand System franchisees
EBITDA Breakdown FY14 FY15 %
Brand Systems (Domestic)(2) $56.6m $66.0m 16.6%
Brand Systems (International)(2) $2.1m $15.1m 619%
Coffee Wholesale(3) $0.4m $7.7m 1,825%
Total $59.1m $88.8m 50.25%
96%
3% 1%
EBITDA Contributions FY14
74%
17%
9%
EBITDA Contributions FY15
Diversification nurtures business & drives growth
Brand System Highlights Healthy Franchise Network
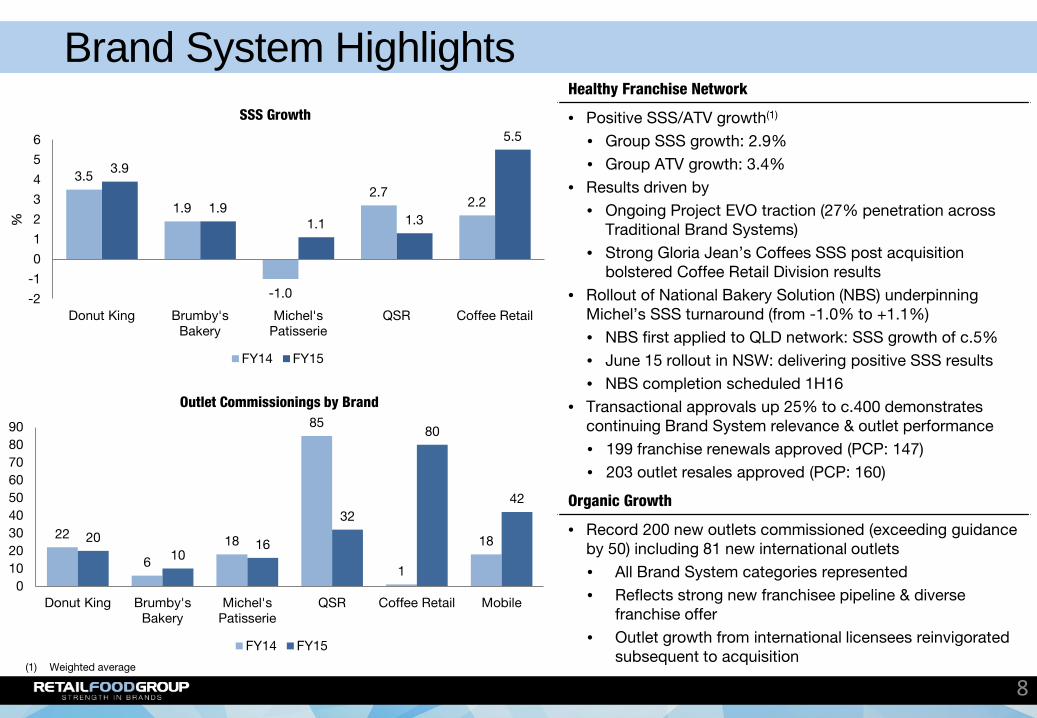
• Positive SSS/ATV growth(1)
• Group SSS growth: 2.9% • Group ATV growth: 3.4%
• Results driven by • Ongoing Project EVO traction (27% penetration across
Traditional Brand Systems) • Strong Gloria Jean’s Coffees SSS post acquisition
bolstered Coffee Retail Division results • Rollout of National Bakery Solution (NBS) underpinning
Michel’s SSS turnaround (from -1.0% to +1.1%) • NBS first applied to QLD network: SSS growth of c.5% • June 15 rollout in NSW: delivering positive SSS results • NBS completion scheduled 1H16
• Transactional approvals up 25% to c.400 demonstrates continuing Brand System relevance & outlet performance • 199 franchise renewals approved (PCP: 147) • 203 outlet resales approved (PCP: 160)
Organic Growth
• Record 200 new outlets commissioned (exceeding guidance by 50) including 81 new international outlets • All Brand System categories represented • Reflects strong new franchisee pipeline & diverse
franchise offer • Outlet growth from international licensees reinvigorated
subsequent to acquisition
8
3.5
1.9
-1.0
2.7 2.2
3.9
1.9 1.1 1.3
5.5
-2
-1
0
1
2
3
4
5
6
Donut King Brumby'sBakery
Michel'sPatisserie
QSR Coffee Retail
%
SSS Growth
FY14 FY15
22
6
18
85
1
18 20 10
16
32
80
42
0102030405060708090
Donut King Brumby'sBakery
Michel'sPatisserie
QSR Coffee Retail Mobile
Outlet Commissionings by Brand
FY14 FY15
(1) Weighted average

Brand System Results Summary - Financial Network
Sales ($m)
Gross Franchise Revenue
EBITDA ($m) Division Franchise Revenue
($m) Net Coffee
Contribution ($m) International
Contribution ($m) Total ($m)
FY15 PCP FY15 PCP FY15 PCP FY15 PCP FY15 PCP FY15 PCP
Trad
ition
al 160.5 (1.1)% 15.9 1.9% 3.4 13.3% 0.1 - 19.4 3.7% 14.8 11.3%
164.4 (11.7)% 14.2 (18.4)% 0.2 100% 0.3 - 14.7 (17.4)% 10.8 (12.9)%
161.0 (7.3)% 18.0 (8.6)% 7.1 (1.4)% 0.0 - 25.1 (6.7)% 17.5 1.2%
Total: 485.9 (6.9)% 48.1 (8.7)% 10.7 3.9% 0.4 - 59.2 (6.6)% 43.1 0.2%
Like for Like(1) 46.1 6.8%
QS
R
205.1 2.5% 19.8 (3.4)% Not Applicable - - 19.8 (3.4)% 12.9 (4.4)%
Cof
fee
241.5 582% 12.7 647% 12.2 917% 12.0 650% 36.9 720% 23.5 968%
Mob
ile
Not Applicable 2.1 2,000% 1.3 117% 1.0 150% 4.4 300% 2.2 267%
Group Total 932.5 23% 82.7 10.3% 24.2 100% 13.4 458% 120.3 34.4% 81.7 37.8%
9 (1) Includes $3m impact of new accounting policy relating to allocation of network access fees over contract life rather than FY of receipt

Brand System Results Summary - Operational Division SSS (%) ATV (%) New Outlets
Closures Net Outlets Total Outlets EVO Traction
(% of network) Like for Like Legacy & Consolidation(1)
Trad
ition
al 3.9% 3.7% 20 18 8 (6) 341 34%
1.9% 2.8% 10 21 18 (29) 250 13%
1.1% 2.3% 16 20 18 (22) 294 32%
Total: 2.4% 2.9% 46 59 44 (57) 885 27%
QS
R
1.3% 5.4% 32 16 25 (9) 333 Not Applicable
Cof
fee
5.5% 3.1% 80 6 44 810(2) 887 Not Applicable
Mob
ile
Not Applicable 42 4 6 268(3) 341 Not Applicable
Group Total 2.9% 3.4% 200 85 119 1,012 2,446
10
(1) Refer Market Presentation 2 June 2015 (2) Includes 780 outlets on acquisition of Gloria Jean’s Coffees & It’s A Grind (3) Includes 236 outlets on acquisition of Café2U
Acquisition Scorecard
11
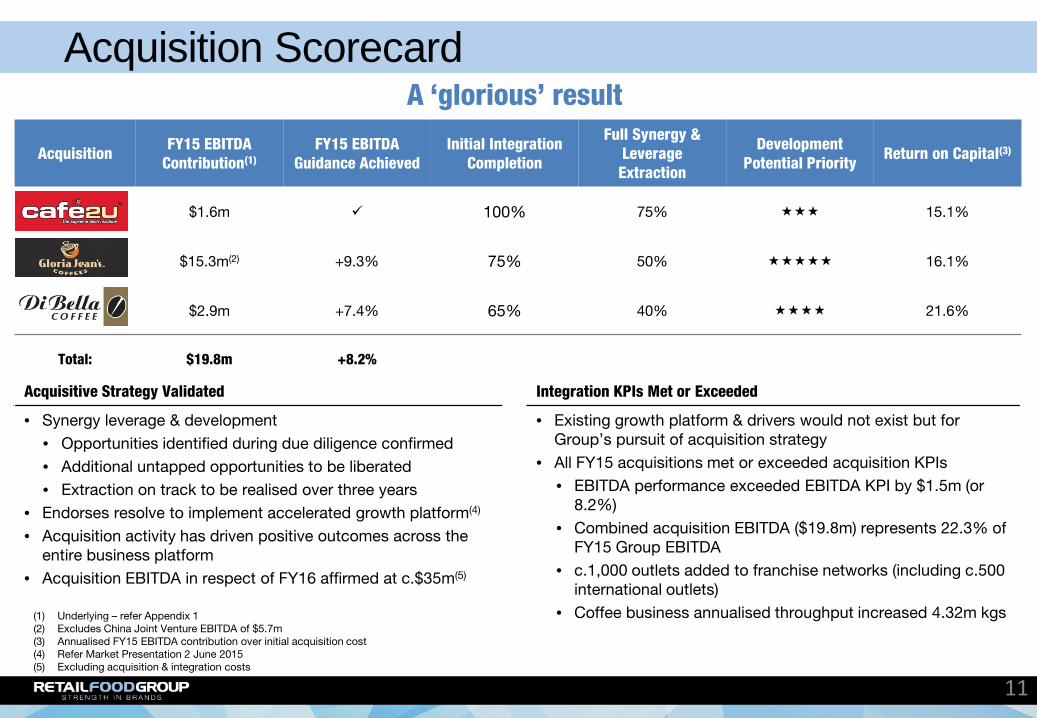
Acquisition FY15 EBITDA Contribution(1)
FY15 EBITDA Guidance Achieved
Initial Integration Completion
Full Synergy & Leverage Extraction
Development Potential Priority Return on Capital(3)
$1.6m 100% 75% 15.1%
$15.3m(2) +9.3% 75% 50% 16.1%
$2.9m +7.4% 65% 40% 21.6%
Total: $19.8m +8.2%
Acquisitive Strategy Validated Integration KPIs Met or Exceeded
• Synergy leverage & development • Opportunities identified during due diligence confirmed • Additional untapped opportunities to be liberated • Extraction on track to be realised over three years
• Endorses resolve to implement accelerated growth platform(4)
• Acquisition activity has driven positive outcomes across the entire business platform
• Acquisition EBITDA in respect of FY16 affirmed at c.$35m(5)
• Existing growth platform & drivers would not exist but for Group’s pursuit of acquisition strategy
• All FY15 acquisitions met or exceeded acquisition KPIs • EBITDA performance exceeded EBITDA KPI by $1.5m (or
8.2%) • Combined acquisition EBITDA ($19.8m) represents 22.3% of
FY15 Group EBITDA • c.1,000 outlets added to franchise networks (including c.500
international outlets) • Coffee business annualised throughput increased 4.32m kgs
A ‘glorious’ result
(1) Underlying – refer Appendix 1 (2) Excludes China Joint Venture EBITDA of $5.7m (3) Annualised FY15 EBITDA contribution over initial acquisition cost (4) Refer Market Presentation 2 June 2015 (5) Excluding acquisition & integration costs

FY15 Acquisitions – Mobile & Specialty Coffee
12
Café2U Di Bella Coffee
• Positions RFG as global mobile coffee leader • Acquired September 2014 • $1.6m contribution to FY15 EBITDA • Performance consistent with acquisition KPI • Added 236 outlets across 5 international territories
• Drove closing FY15 global mobile network to 340+ coffee vans • Strengthened organisational capability
• Experienced Café2U personnel retained & promoted to senior management roles within Mobile Division
• Post acquisition performance validates entry into mobile ‘low entry investment’ franchise segment • 42 new vans established across Mobile Division in FY15
• Awarded Best Value Franchise Model in Price Range on Australia’s ‘Today Show’ in 2015
• Australia’s pre-eminent specialty coffee brand • Acquired February 2015 • $2.9m contribution to FY15 EBITDA
• Exceeded acquisition KPI by 7.4% • FY15 vendor earn-out threshold achieved
• c.1,000 wholesale customers • International wholesale penetration significantly more
attractive than originally envisaged including launch of brand into USA
• Provided immediate & genuinely scalable footprint within specialty coffee market
• Complements Group’s Coffee & Allied Beverage strategy via establishment of tangible service platforms in franchise, ‘in-home’, contract roasting & specialty coffee markets
• Enhances organisational capability via retention of expert management team
• Research & development continuing with respect to allied coffee drinks & products
FY15 Acquisitions – Coffee Retail & Wholesale
13
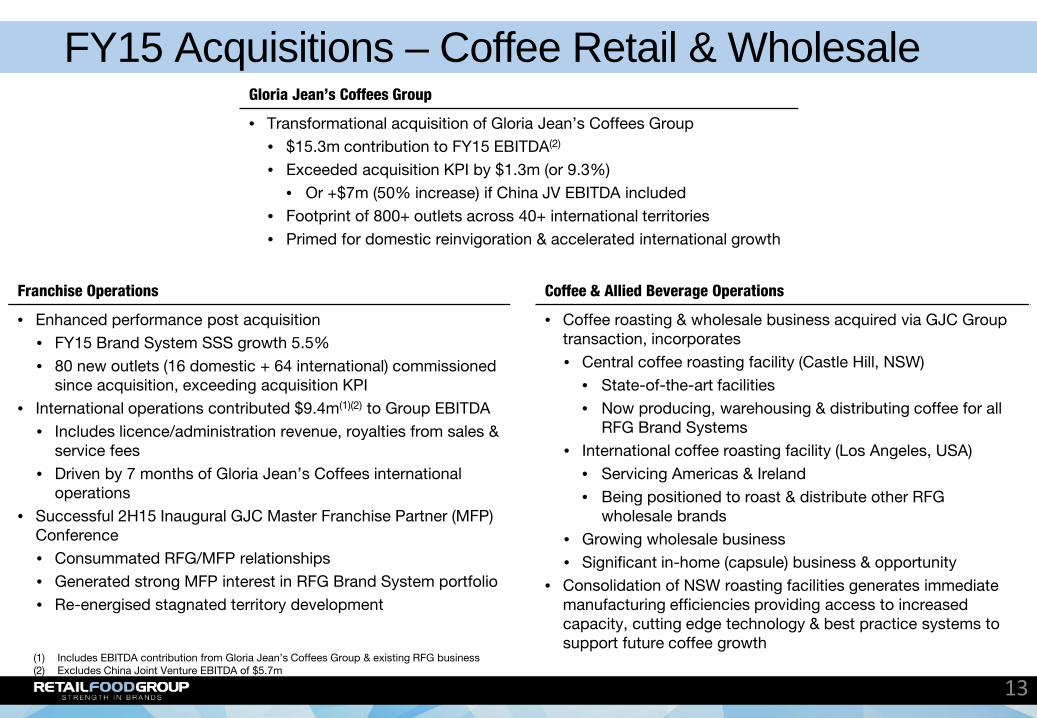
Gloria Jean’s Coffees Group
• Transformational acquisition of Gloria Jean’s Coffees Group • $15.3m contribution to FY15 EBITDA(2) • Exceeded acquisition KPI by $1.3m (or 9.3%)
• Or +$7m (50% increase) if China JV EBITDA included • Footprint of 800+ outlets across 40+ international territories • Primed for domestic reinvigoration & accelerated international growth
Franchise Operations Coffee & Allied Beverage Operations
• Enhanced performance post acquisition • FY15 Brand System SSS growth 5.5% • 80 new outlets (16 domestic + 64 international) commissioned
since acquisition, exceeding acquisition KPI • International operations contributed $9.4m(1)(2) to Group EBITDA
• Includes licence/administration revenue, royalties from sales & service fees
• Driven by 7 months of Gloria Jean’s Coffees international operations
• Successful 2H15 Inaugural GJC Master Franchise Partner (MFP) Conference • Consummated RFG/MFP relationships • Generated strong MFP interest in RFG Brand System portfolio • Re-energised stagnated territory development
• Coffee roasting & wholesale business acquired via GJC Group transaction, incorporates • Central coffee roasting facility (Castle Hill, NSW)
• State-of-the-art facilities • Now producing, warehousing & distributing coffee for all
RFG Brand Systems • International coffee roasting facility (Los Angeles, USA)
• Servicing Americas & Ireland • Being positioned to roast & distribute other RFG
wholesale brands • Growing wholesale business • Significant in-home (capsule) business & opportunity
• Consolidation of NSW roasting facilities generates immediate manufacturing efficiencies providing access to increased capacity, cutting edge technology & best practice systems to support future coffee growth
(1) Includes EBITDA contribution from Gloria Jean’s Coffees Group & existing RFG business (2) Excludes China Joint Venture EBITDA of $5.7m

Brand Systems & Coffee Wholesale: FY15 Achievements & FY16 Initiatives
14

Traditional Brand Systems FY15 Achievements
• Project EVO achieved 27% penetration across Traditional network • Donut King SSS growth continues to benefit from Project EVO • Project EVO traction in Michel’s Patisserie & Brumby’s Bakery now
evident in emerging SSS uplift • Contribution per Outlet(1) increase of $2.9k over PCP, or 6.2%
• Weighted average EBITDA contribution per Outlet 13.6% increase on PCP when new accounting policy treatment excluded(2)
• Reinvigorated promotional activity & focus on core product ranges (donuts, bread & cakes) propelled SSS & ATV • First full-year positive SSS growth for Michel’s Patisserie since FY11
• Doubled penetration of coffee within Brumby’s Bakery network • 51 outlets now serving coffee (c.20% of network)
• Michel’s Patisserie National Bakery Solution facilitating enhanced product development to capitalise on dessert & baking trends
FY16 Initiatives
• +44% Project EVO traction targeted by end of FY16 • Implementation of initiatives to drive SSS, including
• Enhanced ecommerce & digital offering for customers • Regular innovative product development including day part initiatives • Roll out product customisation platforms • Enhanced training to improve customer experience • Creative in-store & social media promotions to increase awareness,
customer engagement & loyalty
15
FY15 Highlights Donut King
Michel’s Brumby’s
SSS Growth 3.9% 1.1% 1.9%
ATV Growth 3.7% 2.3% 2.8%
Network Population 341 294 250
Contribution to Group EBITDA(1)
16.7% 19.7% 12.2%
Traditional Brand Systems Contribution to Group EBITDA(1)
48.5%
EBITDA Contribution per Outlet(1)
FY14 ($’000)
FY15 ($’000) PCP
Donut King 38.3 42.8 11.7%
Michel’s Patisserie 54.8 59.5 8.7%
Brumby’s Bakery 44.4 43.2 (2.8)%
Weighted Average 45.6 48.5 6.2%
LFL Weighted Average(2) 45.6 51.9 13.6%
(1) Underlying – Refer Appendix 1 (2) Removes $3m impact of new accounting policy relating to allocation of network access fees over contract life rather than FY of receipt

QSR Division FY15 Achievements
• Avoidance of destructive price discounting practices adopted within competitive set • ATV initiatives utilised to support SSS
• Increased digital marketing & enhanced EDM targeting strategies led to enhanced online sales results • 28.8% growth in online sales for Pizza Capers (27.6% of total sales) • 14.9% growth in online sales for Crust (36.8% of total sales)
• Customer segmented deal strategies & new product innovation contributed to ATV growth of 5.4% across Division
• Crust’s mobile activation strategy successful with Mobile Pizza Bar recording >$500k in retail sales at 2015 Australian Open • Full 1H16 calendar of events committed, including Bathurst 1000 • Three Mobile Pizza Bar outlets now in use
FY16 Initiatives
• Continued focus on digital marketing to drive online sales • QSR400 tempered by network consolidation but fortified by significant
international opportunity & interest • Pizza Capers driving customer engagement
• CRM member recruitment & offers to increase customer loyalty • Increased product innovation & ‘Limited Time Only’ offers through
introduction of ‘Capers Studio’ • Crust Gourmet Pizza Bar focussed on innovation in product & promotion
• Showcase innovative gourmet flavours brand is renowned for • Focus on local area marketing tactics in partnership with franchisees
16
FY15 Highlights
SSS Growth 1.3%
ATV Growth 5.4%
Network Population 333
Contribution to Group EBITDA(1)
14.5%
EBITDA Contribution per Outlet (1)
FY14 ($’000)
FY15 ($’000) PCP%
QSR Division 39.5 38.7 (1.9%)
(1) Underlying – Refer Appendix 1 (2) Refer Market Presentation 2 June 2015
Performance Tempered
• FY15 EBITDA decrease (4.4%) impacted by • Operation of QSR400 corporate outlets prior to
disposition • Rationalisation/conversion of Pizza Capers outlets
outside of QLD, Northern NSW & WA stronghold(2)

Coffee Retail Division FY15 Achievements
• Exceptional outcomes • SSS & ATV growth (5.5% & 3.1% respectively) • EBITDA Contribution per Outlet increase of 41.3% on PCP driven by
leverage & scale(1)
• 4Q15 coffee sales up 10.5% supported by new ‘Sereno’ smooth blend promotion
• Conversions of bb’s Café & Esquires outlets to Gloria Jean’s Coffees & Michel’s Patisserie Brand Systems underway (5 completed during FY15)
• Aligning beverage campaigns with prevailing food trends to drive category growth
• 8 new outlets opened in China during 2H15 reflects strong start to China Joint Venture
• It’s A Grind recommenced penetration outside of the USA
FY16 Initiatives
• Continued expansion into non-traditional sites (including drive thru) reducing exposure to shopping centre platform
• International outlet expansion via existing Master Franchise Partners in addition to new partner recruitment
• Launch enhanced tactical marketing campaigns driven by product innovation across food & beverage categories including day part innovation
• Project Evolution concept development to be piloted
17
FY15 Highlights
SSS Growth 5.5%
ATV Growth 3.1%
Network Population 810
Contribution to Group EBITDA(1)
26.5%
EBITDA Contribution per Outlet(1)
FY14 ($’000)
FY15 ($’000) PCP
Coffee Retail 28.6 40.4 41.3%
(1) Underlying – Refer Appendix 1

Mobile Division FY15 Achievements
• Exceptional performance • Organic growth of 42 outlets • EBITDA Contribution per Outlet 6.6% up on PCP(1)
• Consolidation of Café2U & The Coffee Guy into Mobile Division • Enhanced franchisee profitability through reduced cost of goods,
packaging & uniforms • Strengthened management team leading Division
• Consolidation of roasting, supply & distribution complete • Van rental program for The Coffee Guy commissioned • Café2U Franchisee Leadership Conference held 2H15 & attended by 192
delegates ensured seamless management transition • Mobile Division is World’s largest in terms of outlets
• The Coffee Guy market leader in New Zealand • Café2U market leader in Australia
• Utilisation of social & digital media to re-engage with customers outside of ‘coffee run’
FY16 Initiatives
• Mobile Division targeting 25+ new outlets in FY16 • Reinvigoration of international growth opportunities
• Expand ‘grab & go’ food offering with focus on enhanced quality & healthy options
• 1H16 launch of first Australian The Coffee Guy container concept outlet • Piloting of additional Brand System mobile formats & cross-pollination of
products
18
FY15 Highlights
Network Population 341
Contribution to Group EBITDA(1)
2.5%
EBITDA Contribution per Outlet(1)
FY14 ($’000)
FY15 ($’000) PCP
Mobile Division 8.2 8.8 6.6%
(1) Underlying – Refer Appendix 1

Coffee & Allied Beverage FY15 Achievements
• Annualised throughput of 5.92m kgs consistent with guidance • Integration of Roasting Australia & Di Bella Coffee
• Access to best in class equipment & facilities • Enhanced management team & expertise • Streamlined processes & procedures
• Commenced execution of key internal consolidation & synergistic projects in 2H15 • Green bean origin & purchasing platform – resulting in increased
purchasing power whilst streamlining supply & leveraging scale • Regional international distribution hubs (Project Link) • Synergistic decommissioning of excess roasters for deployment
internationally • Expansion of international roasting facilities
FY16 Initiatives
• Further technological & equipment enhancement at Castle Hill (NSW) roasting facility
• Focus on growing Di Bella Coffee domestic market share through expansion into NSW & WA
• Growing ‘in-home’ (capsule) category penetration via Roasting Australia • Expansion of wholesale/contract roasting business • Specialty wholesale & ecommerce re-launch into international territories
including Di Bella Coffee & Café Palazzo
19

Accelerated Growth Plan: FY16 & Beyond
20

Framework for Continued Success
21
Ongoing organisational, efficiency & productivity initiatives embellishing platforms for long term success & realisation of enhanced earnings
Realising EBITDA Opportunity Network Consolidation
• On track to realise c.$16m additional EBITDA over 3 years detailed in 2 June 2015 Market Presentation
• Network consolidation
• Rationalisation of sub-scale activities
• Resource consolidation/prioritisation/enhancement
• $16.3m cash investment
• $15.6m expensed during FY15
• $18.5m non-cash investment
• $14m expensed/provisioned during FY15
• Focus on optimising outlet quality & Brand System profitability
• Program execution well advanced
• Outlet rationalisation/consolidation drives increased Brand System EBITDA & Contribution per Outlet
Resource Consolidation & Prioritisation
• Granville (NSW) roasting facility decommissioned & operations relocated to Castle Hill (NSW)
• Gloria Jean’s Coffees Brisbane office closed
• Dedicated International Division established to drive growth, new master franchise/licence relationships & opportunities
• Resources being allocated to highest growth priorities
• Maximising return on investment
• Deployment aligned with strategic plan
• Accelerates outcomes & captures efficiencies
Organisational Enhancement Implemented
• Board renewal & reinvigoration
• Kerry Ryan appointed Non-Executive Director
• Recruitment of additional Non-Executive Director under consideration
• Segregation of MD/CEO functions (June 15)
• Executive Management Team expanded
• Increased & complementary skillsets
• All business pursuits/platforms represented

Franchise Initiatives Strong International Opportunities
• Transitioning one off revenue streams into recurring weekly revenue, including ‘Inspire’ franchisee training program
• Enhanced program benefits franchisee/franchisor by ensuring regular upskilling
• Launched via Traditional Brand System network
• c.200 outlets now participating
• Leveraging existing Brand System network via Group financing & equipment leasing programs
• c.$9.1m invested to date (PCP $3.2m)
• Investigating further opportunity through coffee wholesale business
• New products to substantially enlarge investment book
• Bolsters new outlet growth & franchisee adoption of Brand System initiatives (e.g. National Bakery Solution)
• Digital platform enhancement & reinvigorated loyalty programs
• RFG engaging with multiple parties regarding new licensing/master franchise opportunities
• Focus on India, Asia, UK, USA & Eastern Europe
• Partnered with leading international franchise development firm (Asia’s largest integrated franchise solution company)
Emerging Revenue Streams
• Yatala facility to be re-launched as production hub for development of drinking chocolate formulations with blending & bottling capabilities for complementary beverage & allied products (e.g. chai, syrups, toppings)
• Evaluation of commissioning additional roasting facilities internationally to
• Grow market share
• Reduce distribution costs
• Increase EBITDA
• Deliver enhanced speed to market for international partners
• Ramp up of Roasting Australia & Di Bella Coffee equipment sales & servicing platform
Revenue Drivers
22

FY16 Outlook
23
Outlook FY16 Guidance
• RFG enthusiastic regarding short & long term performance
• Proven business model
• Solid platform laid for enhanced performance, including
• Full year contributions from FY15 acquisitions
• Experienced management team driving outcomes
• Multiple levers available for driving future earnings growth
• Organic domestic opportunity
• Brand Systems
• Coffee & Allied Beverage
• Significant international opportunity
• NPAT growth c.20% on PCP (underlying)
• +250 new outlet commissionings, including
• c.130 international
M&A Central Platform for Growth
• RFG retains motivation to pursue businesses which
• Are Earnings per Share (EPS) accretive
• Are able to generate increased supply side scale, vertical integration & wider wholesale opportunity
• Enhance the number of Brand Systems & outlets under RFG stewardship
• Given successful FY15 activity, acquisition strategy now includes international opportunities
Actual Forecast
0
200
400
600
FY12 FY13 FY14 FY15 FY16 FY17 FY18
New Outlet Commissionings
Domestic International
Achieved Guidance
0
10
20
30
40
50
60
70
FY10 FY11 FY12 FY13 FY14 FY15 FY16
$m
Net Profit After Tax(1)
(1) Underlying – refer Appendix 1

Appendices
24

Appendix 1 – Earnings & Performance Reconciliation
25
FY14 FY15
Reported ($m)
Underlying LFL
Reported
EBITDA $59.1m $88.8m $86.5m $59.4m
PCP% 50.2% 46.4% 0.5%
NPAT $36.9m $55.1m $53.5m $34.2m
PCP% 49.3% 45.0% (7.2%)
EPS $26.5m 35.6cps 34.5cps 22.1cps
PCP% 34.3% 30.4% (16.6%)
EBITDA Adjustments
Reported EBITDA $59.4m
Acquisition, Integration & Restructuring Costs(1)
$29.4m
Underlying EBITDA $88.8m
China JV Licence Fee(2) ($5.7m)
Accounting Policy Adoption(3) $3.4m ($2.3m)
Like for Like (LFL) EBITDA $86.5m
(1) Refer Market Presentation 2 June 2015 (2) China JV Licence Fee net EBITDA contribution of the fee received in respect of GJC International Licence granted per Market Announcement of 21/01/15 (3) Accounting Policy Adoption in recognition of the increasing contribution to EBITDA of initial fees received for Brand System access, RFG has resolved to recognise same
over the respective agreement term as opposed to the financial year of agreement

Appendix 2 - Definitions
26
Acronym Description
GFR Franchise Revenue (inc. FSF) + net coffee contribution
FSF Franchise Service Fee
NWS Brand System Network Sales (Australia & NZ only)
SSS Same Store Sales
ATV Average Transaction Value
LFL Like for Like
QSR Pizza Capers & Crust Gourmet Pizza
Coffee Retail Gloria Jean’s Coffees, It’s A Grind, Esquires & bb’s Café
Mobile The Coffee Guy & Café2U
Coffee Wholesale/Other Evolution Coffee, Roasting Australia, Di Bella Coffee, Maranatha USA & sundry

Appendix 3 – Cash Flow Performance
27
• 28.6% increase in gross operating cash flow to $65.1m (PCP: $50.6m)
• Continuing strong cash flows – a feature of RFG’s
business model – supported by balanced investment & financing activities
• Increased conversion to EBITDA margin of 109.6%(1) (PCP: 85.8%) reflecting the positive cash generation of acquired businesses & enhanced by the non-cash expense provisions & impairment charges arising from integration & restructuring costs
• Excess free cash derived from operations, capital & debt raising used to fund
• Acquisition of businesses – Café2U, Gloria Jean’s Coffees Group & Di Bella Coffee
• FY14 final dividend (11.25cps) & 1H15 dividend (11.5cps)
• Investment in property, plant & equipment to fund QSR400 store growth
• Investment in freezers in Michel’s Patisserie stores across Australia
• Long-term funding of Marketing R&D initiatives, including EVO concepts
FY14 $’m
FY15 $’m
Receipts from customers 175.5 263.6
Payments to suppliers & employees (124.9) (198.5)
Gross operating cash flows 50.6 65.1
EBITDA 59.1 59.4
Ratio of gross operating cash flows to EBITDA 85.8% 109.6%
Interest & other costs of finance paid (5.4) (7.2) Income tax paid (15.3) (23.2)
Net operating cash inflows 29.9 34.7
Dividends paid (25.3) (24.1)
Net Debt reduction (40.0) 137.0
Acquisitions of business & intangibles (3.7) (194.7)
Acquisition of property, plant & equipment (15.4) (6.6)
Net capital raising 56.7 66.6
Funding Marketing Fund R&D initiatives (7.8) (10.1)
Other cash activities 0.3 -
(35.2) 31.9
Net (decrease) / increase in cash reserves (5.3) 2.8
Cash reserves at year end 11.6 14.4
(1) 92.5% excluding impairment & provisioning charges

Appendix 4 – Financial Position
28
• Working capital increases attributable to seasonal increases in revenues & consolidation of newly acquired businesses including • c.$15m in Trade Receivables • c.$13.5m in Inventories
• Acquisition of Café2U, Gloria Jeans Coffees Group & Di Bella Coffee intellectual property
• Total gross debt increased to $206 million, primarily attributable to acquisitions • $50 million is classified as current borrowings reflecting October
2015 maturity • $156 million as non-current borrowings reflecting September
2017 maturity
• Contingent earnout consideration attributable to acquisitions • Gloria Jean’s Coffees Group $12.7m • Di Bella Coffee Group $15.6m
• Share capital increase of $93.3m reflecting
• $40m capital raising • $15m SPP • $10.6m DRP • $13.3m DRP shortfall placement • $13m shares issued on GJC acquisition • $2.6m shares issued on Di Bella Coffee acquisition
FY14 $’m
FY15 $’m
Assets: Cash reserves 11.6 17.1
Trade receivables 23.7 43.9
Financial assets 23.9 29.6
Inventories 10.1 20.9
Plant & equipment 27.7 42.9
Intangibles 299.1 513.0
Tax receivable - 1.6
Other 2.0 11.0 398.1 680.0
Liabilities: Trade payables 8.3 29.8
Provisions 2.0 5.8
Tax payable 5.0 -
Borrowings 68.9 206.6 Other (including contingent earnout consideration)
3.9 34.0
88.1 276.2
Equity: Share capital 221.7 315.0
Reserves 0.3 1.3
Retained earnings 88.0 87.5 310.0 403.8

Appendix 5 – Debt Structure
29
• Facility headroom (including cash) at 30 June 2015 of $77.4m
• Gross debt of $206m at 30 June 2015 • $50m current borrowings reflecting October 2015
maturity • $156m non-current borrowings reflecting September
2017 maturity • Sufficient headroom within non-current facility to
accommodate debt maturity date of current borrowings
• Weighted average interest rate as at August 2015 is 4.02%
• Margin over BBSY currently 2.0%
• Compliance with all lending covenants as at 30 June 2015 comfortably maintained
• Management successfully extended term facility date to September 2017
(1) Calculated in accordance with Senior Debt Facility Agreement
Senior Debt Facility FY15
Net debt(1) $200.3m
Interest expense(1) $7.3m
Interest cover (times) (1) 11.1x
Gearing ratio (net debt / (net debt + equity) (1) 33.1%
Total Facility $278.0m
Appendix 6 – Capital Management
30
Shares Price ($) Proceeds/Value ($m)
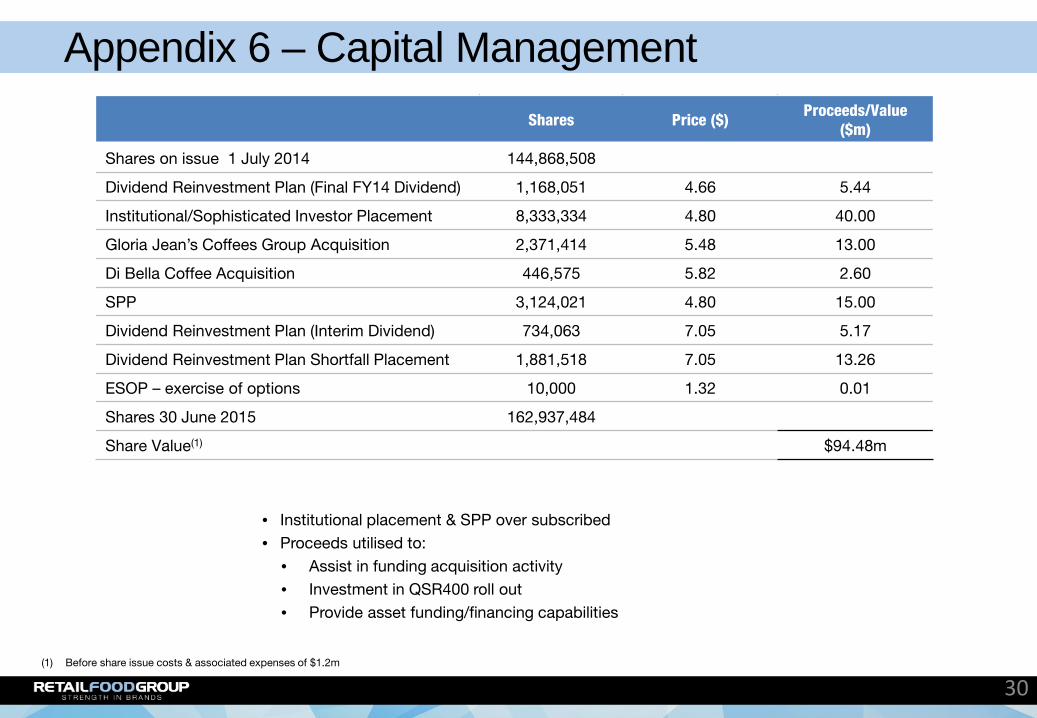
Shares on issue 1 July 2014 144,868,508
Dividend Reinvestment Plan (Final FY14 Dividend) 1,168,051 4.66 5.44
Institutional/Sophisticated Investor Placement 8,333,334 4.80 40.00
Gloria Jean’s Coffees Group Acquisition 2,371,414 5.48 13.00
Di Bella Coffee Acquisition 446,575 5.82 2.60
SPP 3,124,021 4.80 15.00
Dividend Reinvestment Plan (Interim Dividend) 734,063 7.05 5.17
Dividend Reinvestment Plan Shortfall Placement 1,881,518 7.05 13.26
ESOP – exercise of options 10,000 1.32 0.01
Shares 30 June 2015 162,937,484
Share Value(1) $94.48m
• Institutional placement & SPP over subscribed • Proceeds utilised to:
• Assist in funding acquisition activity • Investment in QSR400 roll out • Provide asset funding/financing capabilities
(1) Before share issue costs & associated expenses of $1.2m

No responsibility for contents of Presentation To the maximum extent permitted by law, Retail Food Group Limited (ABN 31 106 840 082), its officers, advisers and representatives: • make no representation, warranty or undertaking, and accept no responsibility or liability, express or implied, as to the adequacy, accuracy, completeness or
reasonableness of this Presentation or any other written or verbal communication transmitted or made available to any recipient • make no representation, warranty or undertaking, express or implied, in connection with the existing or potential turnover or financial viability of any particular
existing or potential Donut King, Michel’s Patisserie, Brumby’s Bakery, bb’s café, Esquires Coffee, Gloria Jean’s Coffee, It’s A Grind, Café2U, The Coffee Guy, Pizza Capers Gourmet Kitchen or Crust Gourmet Pizza Bar outlet. Franchisees and potential franchisees must make their own investigations and satisfy themselves as to the existing or potential turnover or financial viability of any existing or potential outlet as aforesaid (as the case may be) on the basis of their own investigations and independent legal, financial and commercial advice; and
• accept no responsibility for any errors in, or omissions from, this Presentation whether arising out of negligence or otherwise The information in this Presentation is for use by recipients who are Australian Financial Services Licensees or persons to whom an offer of securities does not require disclosure under Part 6D.2 of the Corporations Act only
Accuracy of projections and forecasts This Presentation includes certain statements, opinions, estimates, projections and forward looking statements with respect to the expected future performance of Retail Food Group Limited. These statements are based on, and are made subject to, certain assumptions which may not prove to be correct or appropriate. Actual results may be materially affected by changes in economic and other circumstances which may be beyond the control of Retail Food Group Limited. Except to the extent implied by law, no representations or warranties are made by Retail Food Group Limited, its officers, advisers or representatives as to the validity, certainty or completeness of any of the assumptions or the accuracy or completeness of the forward looking statements or that any such statement should or will be achieved. The forward looking statements should not be relied on as an indication of future value or for any other purpose No offer to sell or invitation to buy This Presentation does not, and should not be considered to, constitute or form part of any offer to sell, or solicitation of an offer to buy, any shares in Retail Food Group Limited, and no part of this Presentation forms the basis of any contract or commitment whatsoever with any person. This Presentation does not constitute an offer or solicitation in any jurisdiction in which such offer or solicitation is not permitted under applicable law. Distribution of this Presentation in or from certain jurisdictions may be restricted or prohibited by law. Recipients must inform themselves of and comply with all restrictions or prohibitions in such jurisdictions. Neither Retail Food Group Limited, its officers, advisors or representatives accept any liability to any person in relation to the distribution or possession of this Presentation from or in any jurisdiction Any advice in this Presentation is general advice only. This advice has been prepared without taking into account the objectives, financial situation and needs of the recipients of this Presentation. For that reason, recipients should consider the appropriateness of the advice having regard to their own objectives, financial situation and needs, and seek appropriate independent legal, financial and other professional advice
Disclaimer
31