retail and consumer quarterly newsletter q2 fy 2017 - … · retail and consumer quarterly...
TRANSCRIPT

Retail and Consumer Quarterly NewsletterQ2 FY 2017
www.pwc.in
December 2016


Retail and Consumer Quarterly Newsletter 3
PwC’s Retail and Consumer practice takes immense pleasure in presenting its second newsletter. As India embarks on a journey to becoming one of the biggest retail stories of the decade, we look forward to capitalising on our extensive sector knowledge, presenting our insights to our readers and keeping them updated on the latest happenings in the sector.
This quarter, we have highlighted the growth of the dairy sector in India and the resulting impact on deal activity. The second part of the newsletter highlights the deal activity in the quarter compared with that in previous quarters, along with our insights into the future of consumer and retail transactions.
Introduction

4 PwC
In 2016, India surpassed the European Union to become the largest milk producing nation in the world, producing approximately 18% of the world’s milk output. India also became the largest consumer of milk in the world, paving the way for the rise of an important industry that still has low per capita consumption and holds enormous potential.
Despite being the largest producer and consumer of milk in the world, India is expected to grow faster than the global milk market and many of its comparable peers. This was validated by the fact that even though the global dairy industry faced headwinds in 2016, India’s dairy market posted a cheery 6.3% volume growth. Strong growth prospects, driven by formalisation of the market and growth of the value-added dairy segment, will be critical to the development of the sector in the future.
The Indian dairy market is well placed amongst its peers, given its large market size, high expected growth rate and low per capita consumption.
India’s dairy industry is different from that of its developed counterparts in that it has a fragmented farmer base, low milch animal yields, high labour intensiveness and an underdeveloped supply chain network. Further development of the industry necessitates certain improvements so as to support the high demand that is expected to outstrip supply in future.
According to industry sources, India will witness supply chain investments of around 2 billion USD by 2020. This would entail investments in the milk procurement network, capacity addition and development of retailing infrastructure.
These factors have caught the attention of various domestic and global companies, which have become interested in the Indian dairy space.
Dairy in India: Milking the cash cow
India
EUUS
China
Brazil
0
100
200
300
400
-1.00% 0.00% 1.00% 2.00% 3.00% 4.00% 5.00%
Per
cap
ita c
onsu
mp
tion
(litr
es)
Expected CAGR (2014–2020 F)
The bubbles indicate the size of the dairy industry in MMT (2014). F = Forecast
Source: PwC research

Retail and Consumer Quarterly Newsletter 5
Various sources estimate the size of the Indian dairy industry to be between 4,000 billion INR and 5,000 billion INR. Although the size of the Indian dairy market has been large since a long time, it remained unattractive, as most of the milk consumption was in basic liquid form
CategoryMarket size
(billion INR) 2014Organised share %
CAGR (2014–20)
Liquid milk 2,621 20% 21%
UHT milk 26 100% 26%
Flavoured milk 13 100% 25%
Curd 216 6% 20%
Flavoured and frozen yogurt
2 100% 32%
Lassi* 12 NA 21%
Buttermilk* 14 NA 21%
Cheese 12 100% 31%
Butter 168 13% 19%
Ghee 618 18% 17%
Paneer 293 2% 24%
Skimmed milk powder
50 100% 15%
Cream* 13 NA 15%
Whey (powder) 3 100% 22%
Total 4,061 20% 20%
or, at best, in the form of ghee and butter. However, over the past years, the value-added segment has picked up momentum (value-added dairy products [VADPs] grew at a CAGR of 20% between 2008–2015) and now forms an attractive market for private players.
Value-added products have higher
(4%–5%) and require lower investment in the milk procurement network.
‘Heightened interest in VADPs has led to the emergence of players such as Milky Mist (sells VADPs only), Dairy Craft, Epigamia (Greek yogurt), and various other companies that are selling ice cream, dairy beverages (Milky Moo), etc.’
- Rajesh Vig Partner, Corporate Finance, PwC India
Source: PwC research
Indian dairy market (400 million litres per day)
Organised(17.5%)
Co-operatives40 million litres/day
Private dairies30 million litres/day
Traditional milkmen
170 million litres/day
Self-consumption(160 million litres/day)
Unorganised(82.5%)
Indian dairy product mix
Liquid milk67%
VADP33%
Traditional VADP
Non-traditional VADP
Ghee, butter, cottage cheese, buttermilk,
ice cream
Yogurt, flavoured milk, skimmed milk powder, UHT milk
Source: PwC research

6 PwC
The dairy sector in India is highly fragmented, with the organised segment accounting for approximately 20% of the overall market. The players in the organised segment can be divided on the basis of ownership (state co-operatives vs private players) and reach (regional vs national).
The industry is characterised by a fragmented farmer base with a small herd size of 1–2 cattle. However, the emergence of medium-scale farmer-owned dairy farms with a herd size of 50–300 cattle is a growing trend.
Regional players tend to focus on strengthening the distribution network and rely heavily on the selling of traditional products such as milk, curd and paneer. Urban-oriented national players focus on value-added products such as yogurt, cheese and butter.
This will make it easier for companies to procure milk from farmers without investing heavily in the procurement network and lead to a more organised structure for the industry in future.
Co-operative societies and milk marketing federations have a large market share in liquid milk and traditional VADPs such as ghee and curd.
However, private players control a large part of the non-traditional VADPs such as cheese, flavoured milk and yogurt.
Competitive scenario
Co-operative societies/milk
marketing federations
9%
Private and MNC
companies11%
Unorganised80%
Organised20%
Co-operative societies/
milk marketing federations
Private companies/
MNCs
Regional
Rajasthan Co-operative Dairy
Tirumala Milk Products
Amul
Danone
Karnataka Milk Federation
Hatsun Agro
Mother Dairy
Parag Milk Foods
Orissa State Cooperative Milk Producers Federation
Heritage Foods
Britannia
Nestle
National
Retail and Consumer Quarterly Newsletter 7
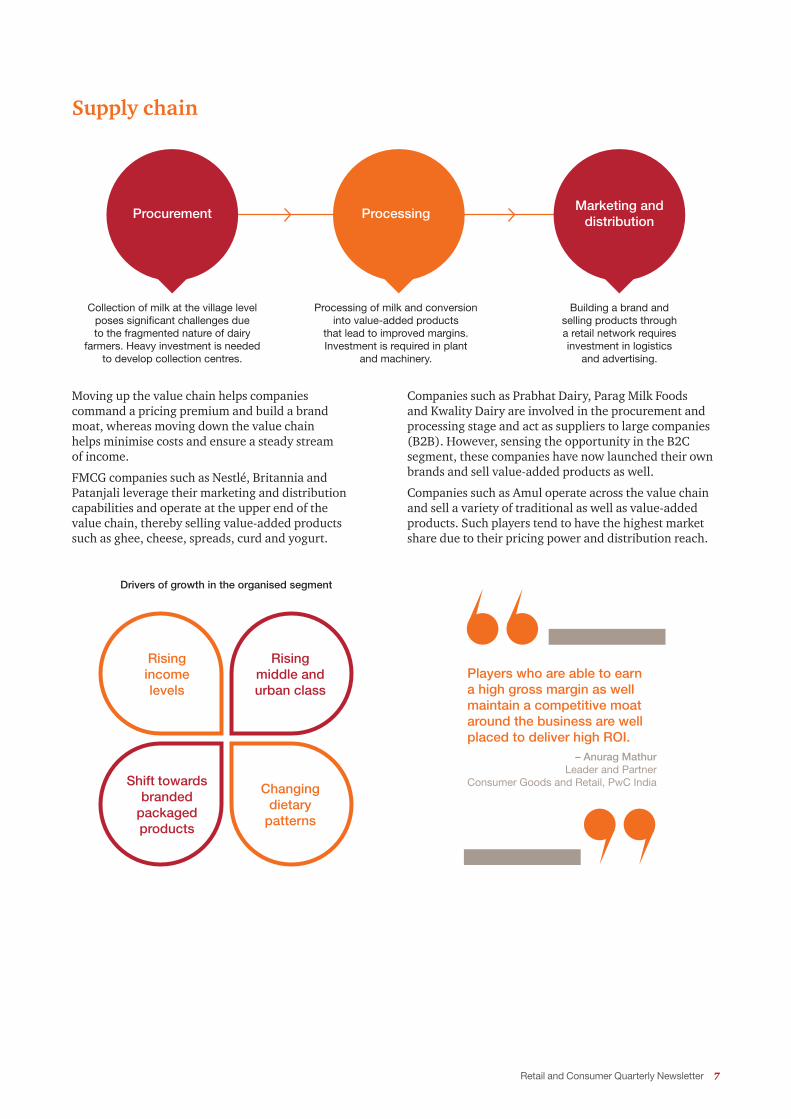
Moving up the value chain helps companies command a pricing premium and build a brand moat, whereas moving down the value chain helps minimise costs and ensure a steady stream of income.
FMCG companies such as Nestlé, Britannia and Patanjali leverage their marketing and distribution capabilities and operate at the upper end of the value chain, thereby selling value-added products such as ghee, cheese, spreads, curd and yogurt.
Companies such as Prabhat Dairy, Parag Milk Foods and Kwality Dairy are involved in the procurement and processing stage and act as suppliers to large companies (B2B). However, sensing the opportunity in the B2C segment, these companies have now launched their own brands and sell value-added products as well.
Companies such as Amul operate across the value chain and sell a variety of traditional as well as value-added products. Such players tend to have the highest market share due to their pricing power and distribution reach.
Rising income levels
Shift towards branded
packaged products
Rising middle and urban class
Changing dietary
patterns
Collection of milk at the village level poses significant challenges due to the fragmented nature of dairy
farmers. Heavy investment is needed to develop collection centres.
Processing of milk and conversion into value-added products
that lead to improved margins. Investment is required in plant
and machinery.
Building a brand and selling products through a retail network requires investment in logistics
and advertising.
Supply chain
Procurement ProcessingMarketing and
distribution
Players who are able to earn a high gross margin as well maintain a competitive moat around the business are well placed to deliver high ROI.
– Anurag Mathur Leader and Partner
Consumer Goods and Retail, PwC India
Drivers of growth in the organised segment

8 PwC
Mergers and acquisitions
Date Buyer/investor Target Key brandsDeal value (million INR)
28 Oct 16 Heritage Foods Reliance Retail (dairy business)Dairy Life, Dairy Pure
NA
07 Mar 16 Lactalis Group Anik Industries (dairy business) 4,699
21 Dec 15 Godrej Agrovet Ltd. Creamline Dairy Products Jersey 1,372
07 Jan 14 Lactalis Group Tirumala Milk Products Thirumala 16,847
30 Oct 13 Hatsun Agro Products Ltd Jyothi Dairy Pvt. Ltd. Jyothi Milk 650
Private equity deals
Date Buyer/investor Target Key brandsDeal value (million INR)
24 Oct 16 Motilal Oswal PE Dairy Classic Ice Creams Dairy Day 1,100
22 Jul 16 Verlinvest, DSG Consumer Drums Food InternationalHokey Pokey, Epigamia
444
13 Jul 16 KKR Kwality Limited Dairy Best 5,200
22 Sep 15 TVS Capital Prabhat Dairy Ltd. Prabhat 849
01 Jan 15 Eight Roads Ventures Milk Mantra Dairy Pvt. Ltd. Milky Moo 877
30 Jun 14 Westbridge Capital Hatsun Agro Products Ltd. Hatsun 360
31 Aug 13 Capvent AG Hangyo Ice Cream Hangyo 333
05 Nov 12 Cargill Ventures Dodla Dairy Ltd. Dodla Dairy 1,099
Deal activity in the dairy space
The dairy sector in India has seen an increasing number of deals in the past years.
Mergers and acquisitions (M&A) have primarily been motivated by companies looking to expand their regional footprint and gain access to a particular distribution or procurement network. As the Indian dairy sector gains prominence, international companies are expected to
Private equity (PE) deals, on the other hand, have been
interest in investing in companies that are involved in
selling VADPs such as ice creams, yogurts, cheese and curd.
traditional milk procurement networks and charge high prices for their products.
with more FMCG companies, international dairy companies and private players set to enter the industry and expand offerings. However, corresponding growth in demand will ensure ample growth opportunities for all players.

Retail and Consumer Quarterly Newsletter 9
Deal round-upDeals in the retail and consumer sector remained sluggish, with both deal value and volume showing no signs of improvement.
The decline in deal activity from Q2 FY16 can mainly be attributed to a decline in the domestic M&A market and a decline in PE funding. The decline from Q2 FY16 was mostly driven by the 10,090 million INR acquisition of United Breweries by Heineken and the 9,724 million INR investment in JBF Industries by KKR.
The largest deal of the quarter was the investment of 9,250 million INR by TA Associates into TCNS Clothing Company Pvt. Ltd. (‘W’ brand of women’s ethnic wear). The broader retail and consumer sector was driven by apparel and retail deals this quarter.
and health preferences of consumers, thus driving food and beverage and personal care spending. In addition to this, rising per capita income has led to increased spending in the jewellery, footwear and apparel sectors.
Transactions in the retail and consumer space in Q2 FY17
Deal value: The numbers (Q2 FY17)
Decrease in deal value versus Q1
FY17
16,035million INR
12%
Decrease in deal value versus Q2
FY16
64%
Decrease in deal value versus Q2 FY16
Decrease in deal volume versus Q1
FY17
31
9%
Decrease in deal volume versus Q2
FY16
46%
Retail and consumer deal value and volume
44,662 25,562 18,646 18,262 16,035
57
3942
3431
Q2 FY16 Q3 FY16 Q4 FY16 Q1 FY17 Q2 FY17
Announced deal values (million INR)
Announced deal volumes
Source: VCCEdge
Key trends and highlights• 31 retail and consumer deals were announced,
aggregating 16,035 million INR in Q2 FY17.• PE deals slowed down compared to previous quarters.• Apparel and retail deals led the market in terms
of value, whereas food and beverage deals led the market in terms of volume.
• There was also a growing trend of Indian FMCG companies making acquisitions abroad.

10 PwC
M&A market slowdownQ2 FY17 witnessed muted deal activity compared with the previous quarter. Although deal volumes improved this quarter, deal values continued to decline. This, however, is also affected by the fact that certain deal values have not been disclosed by companies.
The major reason for the fall in deal activity can be attributed to a fall in inbound M&A transactions, which are nil this quarter.
Emergence of outbound deals
An emerging trend observed over the quarters has been the rise of outbound M&A deals. Indian companies have realised potentially big markets outside their home country where they can score big gains and use India’s cost advantage. Some of the deals this quarter were the acquisition of Zhongshan Ma Er Daily Products Limited (China) by Wipro Consumer Care & Lighting and the acquisition of JoeyforLife (China) by Jaquar and Company.
PE remains the driverDeals in the market are increasingly being driven by PE players. PE deal values as a percentage of total deal values have increased from 49% in Q2 FY16 to 92% in Q2 FY17.
While total PE deal volumes have shown a declining trend over the previous quarters, total deal values have been steady. As PE and venture capital (VC) players increasingly become interested in the Indian consumer story, the share of PE deals as a percentage of total deals is expected to rise.
22,850 10,577 12,762 1,431 1,203
28
13
22
9
13
Q2 FY16 Q3 FY16 Q4 FY16 Q1 FY17 Q2 FY17Announced M&A values (million INR)Announced M&A volumes
Source: VCCEdge
249 14
4
11
11 3
2
03
3 5 32
Q2 FY16 Q3 FY16 Q4 FY16 Q1 FY17 Q2 FY17
Domestic M&A Inbound M&A Outbound M&A
Source: VCCEdge
Source: VCCEdge
21,812 14,985 5,884 16,831 14,832
2926
20
25
18
Q2 FY16 Q3 FY16 Q4 FY16 Q1 FY17 Q2 FY17
Announced PE values (million INR)Announced PE volumes
IPO activityThis quarter witnessed a 6,744 million INR initial public offering (IPO) of S.P. Apparel Limited—a manufacturer and seller of knitted garments for infants and children—based out of Tirupur. The shares were issued at an offer price of 268 INR, implying a PE ratio of 20.0x as per FY16 earnings.

Sector round-up
Sector snapshot• Deals in the consumer and retail sector were
largely driven by apparel and retail transactions, which accounted for 80% of the total transactions in Q2 FY17 by value. This was followed by consumer services, which accounted for 12% of the transactions by value.
• The largest apparel and retail transaction in Q1 FY17 was an investment of 9,250 million INR in TCNS Clothing Company Pvt. Ltd. by TA Associates.
• The personal care space also witnessed a landmark transaction this quarter with Wipro Consumer Care’s acquisition of Zhongshan Ma Er Daily Products Limited—a Chinese FMCG company with estimated revenues of 75 million USD. An increasing number of Indian FMCG companies are making acquisitions in emerging markets that are expected to follow the Indian growth story.
15 1320
10 11
42
2
3 3
21
7
9
10 10
17
17
11
11 7
Q2 FY16 Q3 FY16 Q4 FY16 Q1 FY17 Q2 FY17
Foods and beverages Personal care Apparel and retail Consumer services
Deal volume
57
3942
3431
Source: VCCEdge
Food and beverages 8%
Personal care1%
16,035million INR
Apparel and retail 80%
Consumer services 12%
Q2 FY17 (by value)
Source: VCCEdge

12 PwC
Key M&A deals in the quarter
Target Acquirer Target industryDeal value (million INR)
Stake
Zhongshan Ma Er Daily Products
Wipro Consumer Care Personal care NA 100%
Wadhawan Retail Private Limited (Sangam Direct)
Future Group Consumer durables NA 100%
Key PE deals in the quarter
Target Acquirer/investor Target industryDeal value (million INR)
Stake
TCNS Clothing Company Pvt. Ltd.
TA Associates Apparel and retail 9,250 NA
PC Jeweller Fidelity Investments Apparel and retail 2,570 NA
LaOpala RG Limited Westbridge Capital Apparel and retail 770 7.1%
Azure HospitalityGoldman Sachs PIA, Max Ventures
Consumer Services 640 22.3%
DRUMS Food International Pvt. Ltd. (Hokey Pokey, Epigamia)
Verlinvest, DSG Consumer Partners
Food and beverages 445 NA
Source: VCCEdge
Deal activity in the dairy space

Retail and Consumer Quarterly Newsletter 13
Million INR TTM
Company name Price% of 52
week high% of 52
week lowMarket
capitalisationEnterprise
valueEV/sales EV/EBITDA P/E
EBITDA %
PAT %
Foods and beverages
ITC Ltd 231.5 87.0 130.3 2,794,393 2,663,369 6.4 16.7 28.1 38.5 34.4
Nestle India Ltd 5,958.0 80.6 119.6 574,445 557,189 6.7 32.3 102.0 20.8 11.8
Britannia Industries Ltd
2,935.1 81.9 117.2 352,135 347,917 3.7 25.8 43.7 14.3 9.5
Tata Global Beverages Ltd
118.6 75.2 118.6 74,852 82,009 1.1 13.6 23.0 10.5 5.4
Manpasand Beverages Ltd
683.9 88.0 184.8 39,110 38,496 4.1 20.6 63.4 19.6 10.1
DFM Foods Ltd 1,587.9 65.3 280.9 15,881 15,902 3.8 31.1 63.4 12.2 6.5
Mean 4.3 23.3 53.9 19.3 13.0
Median 3.9 23.2 53.5 17.0 9.8
Home and personal care
Hindustan Unilever Ltd
811.7 85.1 106.0 1,756,610 1,704,906 5.6 30.7 43.0 18.4 12.5
Dabur India Ltd 276.5 86.3 119.5 486,403 487,265 5.2 28.8 38.8 19.0 15.9
Godrej Consumer Products Ltd
1,399.3 81.6 125.1 476,509 502,074 5.5 30.0 42.6 19.2 13.1
Marico Ltd 249.2 81.2 127.1 321,446 313,072 5.1 29.2 44.3 18.8 12.9
Colgate Palmolive (India)
926.9 89.7 117.7 252,090 250,565 5.2 27.8 46.7 22.8 14.0
Emami Ltd 1,086.1 86.1 120.5 246,510 252,286 8.3 31.7 68.7 28.1 12.4
Procter & Gamble Hygiene
6,500.1 89.3 125.7 210,998 200,264 7.8 31.7 49.9 24.4 17.1
Gillette India 4,349.8 88.8 114.3 141,738 136,373 7.4 47.4 71.5 15.8 10.4
Jyothy Laboratories
347.3 92.3 137.8 63,062 61,974 3.5 26.1 39.8 15.1 9.0
Bajaj Corp 375.1 79.3 115.6 55,327 52,143 6.1 19.6 28.2 15.1 9.6
Mean 6.0 30.3 47.3 19.7 12.7
Median 5.6 29.6 43.7 18.9 12.7
Dairy
Hatsun Agro Products
343.6 84.5 123.8 52,285 58,717 1.5 16.8 86.4 8.6 1.7
Kwality Ltd 120.5 75.6 153.6 28,230 42,077 0.6 10.1 15.2 6.1 2.7
Parag Milk Foods Ltd
262.6 73.5 130.1 22,084 25,614 1.6 17.2 36.3 9.1 2.9
Heritage Foods Ltd
822.0 86.0 184.9 19,068 19,506 0.5 9.5 34.4 5.6 2.5
Prabhat Dairy Ltd
99.8 59.0 140.5 9,743 11,208 1.0 10.2 35.0 9.8 2.5
Mean 1.0 12.8 41.5 7.8 2.5
Median 1.0 10.2 35.0 8.6 2.5
Trading multiples for public companies

14 PwC
Million INR TTM
Company name Price% of 52
week high% of 52
week lowMarket
capitalisationEnterprise
valueEV/sales EV/EBITDA P/E
EBITDA %
PAT %
Apparel and retail
Page Industries Ltd
13,016.6 74.8 133.5 145,185 146,049 7.6 36.0 62.4 20.5 12.6
Aditya Birla Fashion And Ret
134.7 51.1 109.6 103,555 121,851 2.2 32.9 nm 5.8 -3.3
Arvind Ltd 341.0 80.4 145.1 88,215 120,497 1.4 11.5 24.5 11.8 3.9
Trent Ltd 189.2 73.7 140.4 62,874 65,003 2.3 39.8 nm 6.0 2.7
Shoppers Stop Ltd
329.2 77.5 115.6 27,471 35,950 0.8 19.5 nm 3.7 0.7
Bombay Rayon Fashions Ltd
135.9 62.9 108.2 24,712 79,159 1.8 10.0 33.9 17.7 1.3
Future Lifestyle Fashions Ltd
115.0 77.7 165.2 21,847 27,102 0.8 7.5 61.2 11.3 1.0
Kewal Kiran Clothing Ltd
1,757.1 78.1 109.6 21,656 20,702 4.6 17.8 31.9 25.7 15.0
Indian Terrain Fashions Ltd
138.1 74.6 135.3 5,145 4,951 1.4 11.1 18.2 12.4 7.7
Maxwell Industries Ltd
47.5 63.8 163.5 3,139 4,049 2.0 19.0 nm -0.4 -9.5
Zodiac Clothing Company
183.1 62.1 109.7 3,573 4,143 1.4 100.3 nm 0.9 -2.5
Mean 2.4 27.8 38.7 10.5 2.7
Median 1.8 19.0 32.9 11.3 1.3
Consumer services
Westlife Development Ltd
179.2 67.2 105.0 27,868 27,795 3.6 nm nm 5.4 -1.4
Jubilant Foodworks Ltd
894.2 56.8 108.1 58,867 57,645 3.4 29.7 56.0 11.5 4.3
Talwalkars Better Value Fit
240.6 79.4 132.9 7,147 8,963 2.7 4.7 12.6 59.9 22.7
Speciality Restaurants Ltd
75.7 51.1 100.4 3,555 2,799 1.0 18.9 nm 3.4 -3.6
Mean 2.7 17.7 34.3 20.0 5.5
Median 3.0 18.9 34.3 8.4 1.4
Other speciality retail
Bata India Ltd 427.4 69.6 103.0 54,926 51,500 2.6 22.6 25.1 15.5 9.1
Mirza International Ltd
73.9 51.0 101.0 8,891 10,708 1.3 7.2 10.2 18.4 8.7
Titan Co Ltd 315.9 71.0 104.7 280,452 280,586 2.7 32.2 40.7 8.4 6.1
Relaxo Footwears Ltd
401.7 75.6 114.8 48,214 50,555 2.7 19.1 40.1 14.4 7.0
Liberty Shoes Ltd
134.2 59.9 107.4 2,287 3,560 0.8 8.6 22.7 9.1 2.1
Gitanjali Gems Ltd
54.5 58.2 182.0 6,465 88,414 0.6 11.6 4.1 5.3 1.1
Thanga Mayil Jewellery Ltd
183.9 55.0 110.8 2,523 3,779 0.3 8.7 23.9 3.7 1.0
Mean 1.6 15.7 23.8 10.7 5.0
Median 1.3 11.6 23.9 9.1 6.1
Source: Bloomberg as of 18 November 2016 Note: nm indicates non-meaningful

About PwC
At PwC, our purpose is to build trust in society and solve important problems. We’re a network of
assurance, advisory and tax services. Find out more and tell us what matters to you by visiting us at www.pwc.com
Kolkata, Mumbai and Pune. For more information about PwC India’s service offerings, visit www.pwc.com/in
a separate, independent and distinct legal entity in separate lines of service. Please see www.pwc.com/structure for further details.
©2016 PwC. All rights reserved.
Anurag Mathur Leader and PartnerConsumer Goods and [email protected]: +919811015180
Rajesh VigPartner, Corporate FinanceConsumer Goods and [email protected] Mob: +919920433831
Vineet SatijaAssociate Director, Corporate [email protected]: +919916056577
This report was researched and written by:
Peeyush MittalAnalyst, Corporate [email protected]: +919958496813
Contacts

pwc.inData Classification: DC0
This document does not constitute professional advice. The information in this document has been obtained or derived from sources believed by PricewaterhouseCoopers Private Limited (PwCPL) to be reliable but PwCPL does not represent that this information is accurate or complete. Any opinions or estimates contained in this document represent the judgment of PwCPL at this time and are subject to change without notice. Readers of this publication are advised to seek their own professional advice before taking any course of action or decision, for which they are entirely responsible, based on the contents of this publication. PwCPL neither accepts or assumes any responsibility or liability to any reader of this publication in respect of the information contained within it or for any decisions readers may take or decide not to or fail to take.
© 2016 PricewaterhouseCoopers Private Limited. All rights reserved. In this document, “PwC” refers to PricewaterhouseCoopers Private Limited (a limited liability company in India having Corporate Identity Number or CIN : U74140WB1983PTC036093), which is a member firm of PricewaterhouseCoopers International Limited (PwCIL), each member firm of which is a separate legal entity.
SUS/December2016-8183