resurrecting the role of the product market wedge in ...klenow.com/laborwedge_bkm.pdf ·...
TRANSCRIPT

American Economic Review 2018, 108(4-5): 1118–1146 https://doi.org/10.1257/aer.20151260
1118
* Bils: Department of Economics, Harkness Hall, University of Rochester, Rochester, NY 14627 (email: [email protected]); Klenow: Department of Economics, Stanford University, 579 Serra Mall, Stanford, CA 94305-6072 (email: [email protected]); Malin: Federal Reserve Bank of Minneapolis, 90 Hennepin Avenue, Minneapolis, MN 55401 (email: [email protected]). This paper was accepted to the AER under the guidance of John Leahy, Coeditor. We are grateful to Susanto Basu, Robert Hall, Julio Rotemberg, Raphael Schoenle, and the referees for constructive comments. Corina Boar, Cian Ruane, and Zoe Xie provided excellent research assistance. The views expressed herein are those of the authors and not necessarily those of the Federal Reserve Bank of Minneapolis or the Federal Reserve System. The authors declare that they have no relevant or material financial interests that relate to the research described in this paper.
† Go to https://doi.org/10.1257/aer.20151260 to visit the article page for additional materials and author disclo-sure statement(s).
Resurrecting the Role of the Product Market Wedge in Recessions†
By Mark Bils, Peter J. Klenow, and Benjamin A. Malin*
Employment and hours are more cyclical than dictated by productiv-ity and consumption. This intratemporal labor wedge can arise from product or labor market distortions. Based on employee wages, the literature has attributed the intratemporal wedge almost entirely to labor market distortions. Because wages may be smoothed versions of labor's true cyclical price, we instead examine the self-employed and intermediate inputs, respectively. For recent decades in the United States, we find price markup movements are at least as cycli-cal as wage markup movements. Thus, countercyclical price mark-ups deserve a central place in business-cycle research, alongside sticky wages and matching frictions. (JEL E24, E32, E63, J31, J41)
Employment and hours are more cyclical than can be explained by real labor pro-ductivity under conventional preferences for consumption and leisure. See Hall (1997); Mulligan (2002); and Chari, Kehoe, and McGrattan (2007), among others. This “labor wedge” could reflect either a gap between the marginal product and price of labor (i.e., a price markup) or a gap between the price of labor and the opportunity cost of sup-plying labor (i.e., a wage markup). The decomposition matters for both stabilization policy and understanding the nature of business cycles. Recently, a growing consensus argues that the wage markup plays a dominant role: see, for example, Galí, Gertler, and López-Salido (2007); Shimer (2009); Hall (2009); and Karabarbounis (2014a).
The consensus that the labor wedge reflects labor market distortions is based on measuring the price of labor using average hourly earnings. The gap between aver-age hourly earnings and labor productivity is acyclical, suggesting that price markup movements are not cyclical. But it is not clear whether the marginal cost of labor to firms is well measured by average hourly earnings. Employee wages may not reflect the true marginal cost of labor to the firm. Wages may be smoothed versions of the shadow cost due to implicit contracting (e.g., for salaried workers). One obtains a

1119BILS ET AL.: THE PRODUCT MARKET WEDGE IN RECESSIONSVOL. 108 NO. 4-5
very different picture of the cyclical price of labor using the wages of new hires, as measured by Pissarides (2009) and Haefke, Sonntag, and van Rens (2013), or from the user cost of labor, as measured by Kudlyak (2014).
In this paper, we seek evidence on cyclical distortions in the product market that does not rely on wage data for workers. First, we estimate the labor wedge for the self-employed. If we observe significant cyclicality in the labor wedge for the self-employed, we presume it cannot be ascribed to wage rigidities or other labor market frictions. Second, we estimate the price markup from intermediate inputs (energy, materials, and services). Intermediate prices should provide a truer measure of that input’s cyclical price than do average hourly earnings for labor.
Our evidence is for the United States from 1987 onward. A benefit of using two distinct approaches is that they rely on different data sources. For the self-em-ployed, we look at household data from the Current Population Survey (CPS) and the Consumer Expenditure Survey (CE), both conducted by the Bureau of Labor Statistics (BLS). For intermediates, we use the BLS Multifactor Productivity Database covering 60 industries. Our consistent finding is that, contrary to the emerging consensus, product market distortions are at least as important as labor market distortions in recent recessions.
The countercyclical price markup we estimate is compatible with prices being sticky (too high) in recessions, serving as a constraint on firm sales. Given its strong persistence, it is also consistent with firms purposefully choosing a higher price markup in recessions. As a recent example, Gilchrist et al. (2017) find that finan-cially constrained firms chose higher markups at the expense of future market share during the Great Recession. Any model where expanding production has a compo-nent of investment (e.g., learning-by-doing) should have similar implications. The countercyclical price markup could also reflect greater uncertainty (or aversion to uncertainty) in recessions as in Arellano, Bai, and Kehoe (2012).
Our study is related to several earlier efforts. Bils (1987), Rotemberg and Woodford (1999), Bils, Klenow, and Malin (2013), and Nekarda and Ramey (2013) rely on measured earnings to estimate the marginal price of labor and thereby the cyclicality of the markup. Other studies infer the cyclicality of price markups from the cyclicality of investment (Galeotti and Schiantarelli 1998), final goods inven-tories (Bils and Kahn 2000; Kryvtsov and Midrigan 2013), and advertising (Hall 2014). While our results for intermediates have antecedents in the literature (e.g., Basu 1995), our analysis is the first to examine plant-level compositional biases in manufacturing, to look beyond manufacturing, and to address the cyclicality of the price markup versus the wage markup.
The paper proceeds as follows. Section I revisits the conventional labor wedge decomposition using wages, doing so for both the extensive and intensive margins. Section II looks at the self-employed. Section III investigates intermediate input use. Section IV relates our work to other efforts at measuring the cyclicality of markups. Section V concludes.
I. The Aggregate Labor Wedge
We begin by constructing the standard representative-agent labor wedge (RAW), defined as the ratio of the marginal product of labor ( mpn ) to the tax-adjusted

1120 THE AMERICAN ECONOMIC REVIEW APRIL 2018
marginal rate of substitution of consumption for leisure ( mrs ). Constructing the wedge requires assumptions on preferences and technology; our baseline case fol-lows Hall (1997) and Galí, Gertler, and López-Salido (2007). Production features a constant elasticity of output with respect to hours.1 Preferences are separable in consumption and hours and, over time, with a constant intertemporal elasticity for consumption and a constant Frisch elasticity of labor supply.2 These assumptions yield a log-linear labor wedge
(1) R A W t ≡ ln (mp n t ) + ln (1 − τ t ) − ln (mr s t )
= ln ( y t __ n t ) + ln (1 − τ t ) − [ 1 __ σ ln ( c t ) + 1 __ η ln ( n t )] ,
where y t / n t is output per hour, c t is nondurables and services consumption per adult
equivalent, n t is hours per capita, and τ t ≡ τ t c + τ t n ____
1 + τ t c is a combination of average mar-
ginal tax rates on consumption and labor. See the online Appendix for a precise description of all variables used.
For our baseline case, we use an intertemporal elasticity of substitution (IES) of σ = 0.5 , following Hall (2009), and a Frisch elasticity of labor supply of η = 1.0 , based on Chang et al. (2014). The latter argue, based on a heterogeneous-agent model with both intensive and extensive labor margins, that a representative-agent Frisch elasticity of 1 (or slightly higher) is reasonable.
To gauge the cyclicality of the RAW, we project it on real GDP and hours worked. (All variables are in logs and HP-filtered.) We use quarterly data from 1987 through 2012. Table 1 reports the cyclical elasticity of the wedge and its components: labor productivity, hours worked, consumption, and taxes. The wedge is strongly counter-cyclical (elasticity with respect to GDP: −2.69), reflecting mildly countercyclical productivity (−0.10), procyclical consumption (0.61), and highly procyclical hours (1.40). In recessions, the RAW increases as the mrs plummets but the mpn changes little. Using equation (1) and the results in Table 1, it is straightforward for the reader to recalculate the wedge’s cyclicality for alternative calibrations of σ and η .
1 We later entertain constant elasticity of substitution (CES) production in capital, labor, and intermediate inputs. 2 Nonseparable utility in consumption and leisure would not alter our results significantly. Shimer (2009) and
Karabarbounis (2014a) found this as well. We find the same if we calibrate the nonseparability to how consumption responds to retirement (Aguiar and Hurst 2013) or unemployment (Saporta-Eksten 2014).
Table 1—Representative Agent Wedge
Elasticity w.r.t.
GDP Total hours
Representative agent wedge −2.69 (0.20) −2.00 (0.06) Labor productivity −0.10 (0.08) −0.28 (0.04) Hours per capita 1.40 (0.07) 0.99 (0.01) Consumption per capita 0.61 (0.03) 0.36 (0.02) Tax rates 0.02 (0.07) −0.01 (0.04)
Notes: Each entry is from a separate regression. Sample covers 1987:I–2012:IV. All vari-ables are in logs and HP-filtered. The wedge calculation follows equation (1) with σ = 0.5 and η = 1.0.

1121BILS ET AL.: THE PRODUCT MARKET WEDGE IN RECESSIONSVOL. 108 NO. 4-5
Because the cyclical elasticity will be a key statistic summarizing wedge behav-ior throughout the paper, we point out a few other aspects of Table 1. First, the contribution of marginal tax rates to the cyclicality of the RAW is small. Because our tax measures have little impact on our results, we drop them in the remainder of the paper.3 Second, we have detrended our series with an HP-filter in order to focus on cyclical, rather than low-frequency, fluctuations in the wedge. Hamilton (forth-coming) has recently pointed out drawbacks of using the HP-filter and suggested an alternative method. In the online Appendix, we show that our main findings are robust to using Hamilton’s method.
Before proceeding, it is useful to take a step back and consider exactly what the “labor wedge” is. It measures the gap between the social cost and social benefit of a marginal unit of market labor under a given set of assumptions. It implies a devi-ation between hours worked in the data and what a social planner would choose. In practice, the measured gap will also reflect any mismeasurement in the data and/or misspecification of the social planner’s problem. Thus, it is worthwhile to consider possible mismeasurements and misspecifications and how they might affect our results.
The Table 1 calculations ignore fluctuations in the quality of the workforce and a role for overhead labor.4 We calculate that declining average workforce quality in expansions leads us to understate the cyclical elasticity of labor’s marginal product by perhaps 0.1 to 0.2 percent, and in turn overstate the cyclicality of the wedge. Ignoring overhead labor, conversely, overstates the procyclicality of labor’s mar-ginal product (Rotemberg and Woodford 1999). For an overhead labor component of the magnitude suggested by Nekarda and Ramey (2013)—10 to 20 percent of employment—the effects of composition and overhead labor on the cyclicality of labor’s marginal versus average product (and on the estimated labor wedge) should approximately offset.
A representative agent requires not only workers of equal quality but also perfect consumption sharing. To the extent this is not true, the cyclicality of the wedge may be overstated. In the online Appendix we calculate that the consumption of those who are continuously employed does not move as much as per capita consumption (cyclical elasticity with respect to GDP of 0.52 for the employed versus 0.61 per capita), which implies a slightly less countercyclical wedge (elasticity of −2.51 instead of the −2.69 in Table 1).
3 Mulligan (2012) contends that changes in effective marginal tax rates influenced labor market behavior during the Great Recession. His focus is on how lower-income workers have been affected by the expansion of means-tested assistance programs.
4 The calculations also ignore home production, which Karabarbounis (2014b) suggests can explain part of the cyclicality in the labor wedge. Countercyclical hours worked at home imply smaller cyclical movements in effective leisure, whereas countercyclical consumption of home-produced goods implies smaller movements in effective consumption. Note, however, that our intertemporal and Frisch elasticities are calibrated to a literature that esti-mates models without home production. Matching the same empirical moments in a model with home production would therefore require lower intertemporal and Frisch elasticities. These lower elasticities would (at least partly) offset the impact of the smaller movements in effective leisure and consumption on the labor wedge.
1122 THE AMERICAN ECONOMIC REVIEW APRIL 2018
A. Extensive and Intensive Margin Wedges
We next depart from the representative agent framework by constructing separate wedges on the extensive margin (EMW) and the intensive margin (IMW). These wedges distinguish between the two components of hours worked (employment and hours per worker) but still measure gaps between the social benefit and social cost of additional labor, either in the form of an additional employee or an additional hour per worker. They will also be useful for decomposing the labor wedge into product and labor market components for three reasons.5 First, we can calibrate the Frisch elasticity of labor supply to micro estimates at the hours margin. Second, we can compare the intensive margin here with the intensive margin for the self-employed (in Section II). Third, product market distortions should have an impact on the wedge on both margins. So, if the labor wedge is important at only one margin, that would be suggestive that the price markup has little cyclical importance.6
To analyze the extensive margin, we make some additional assumptions. We con-sider a representative household that consists of many members. Consumption is perfectly shared across members, and labor supply decisions are made on both the extensive and intensive margins. Preferences are
E 0 ∑ t=0
∞
β t { c t 1−1/σ ______
1 − 1 / σ − ν ( h t 1+1/η ______ 1 + 1 / η + ψ) e t } ,
where c t denotes consumption per adult equivalent, e t employment, and h t hours worked per employee. The variable ψ is a fixed cost of employment, which guar-antees an interior solution for hours versus employment. The marginal disutility of
employment is ν ( h t 1+1/η _____ 1 + 1 / η + ψ) ≡ ν Ω t h t , while the marginal disutility of an extra
hour per worker is ν h t 1/η e t .For firms we assume (i) a constant output elasticity with respect to labor, and (ii)
employment and hours per worker are perfect substitutes (i.e., production depends on total hours, n t = e t h t ). The marginal product of labor is thus proportional to output per hour y t / n t , while the marginal product of employment is mp n t ext ∝ y t __ n t h t and the marginal product of hours per worker is mp n t int ∝ y t __ n t e t .
Adding employment involves frictions. Firms post vacancies at the beginning of the period, while matches form and produce during the period.7 The matching tech-nology is m t = v t ϕ f ( u t ) , where m t are matches, v t vacancies, and u t unemployment. Let the variable κ denote the opportunity cost of creating a vacancy, expressed in labor input as a fraction of the steady-state workweek h . Let δ be the per-period
5 The EMW is also interesting in its own right and, to our knowledge, it has not been constructed empirically (though it appears in many theoretical models).
6 Some labor market distortions may hit both margins proportionally. Thus, finding equally important wedges at both margins does not rule for the price markup. But if we find the wedge is only important at one margin, this is indirect evidence against product market distortions.
7 Blanchard and Galí (2010) and Galí (2011) use this timing, although it is more conventional for matches to start producing in the following period. The former timing gives cleaner results, but it could be altered without changing our analysis substantially.

1123BILS ET AL.: THE PRODUCT MARKET WEDGE IN RECESSIONSVOL. 108 NO. 4-5
separation rate, and γ the fraction of the initial period of employment devoted to training.8
In this environment, the intensive margin wedge is given by
(2) IM W t ≡ ln (mp n t int ) − ln (mr s t int ) = ln ( y t __ n t ) − [ 1 __ σ ln ( c t ) + 1 __ η ln ( h t )] .
The IMW in (2) differs from the standard RAW in equation (1) in two ways: hours per worker h t replaces hours per capita n t , and we calibrate η = 0.5 . A lower η is appropriate given that it now reflects the Frisch elasticity only at the intensive (hours) margin (Chetty et al. 2013).
On the extensive margin, consider creating one more vacancy in period t and reducing vacancies in t + 1 by just enough to keep employment unaffected from t + 1 forward. Spending κh y t __ n t to create an additional vacancy generates ϕ m t / v t addi-tional matches, of which (1 − δ ) survive to t + 1 . This perturbation requires lower
spending on vacancies at t + 1 by (1 − δ ) κh y t+1 ___ n t+1 m t / v t ______ m t+1 / v t+1
. A social planner would set
(3) ϕ m t ____ v t [ u ′ ( c t ) (1 − γ h __ h t ) h t
y t __ n t − Ω t h t ] − u ′ ( c t )κh y t __ n t
+ β(1 − δ ) E t { u ′ ( c t+1 ) (κh y t+1 ____ n t+1 m t / v t ________ m t+1 / v t+1
+ ϕ m t ____ v t γh y t+1 ____ n t+1 ) } = 0.
The marginal benefit of an extra vacancy (utility from consuming increased output today) equals its marginal cost (disutility of employment plus the cost of creating an added vacancy today less the resource savings from creating fewer future vacan-cies). Rearranging (3) to get a (log) ratio of the marginal benefit to the marginal cost of additional employment, we have
(4) EM W t = ln ( y t __ n t ) − [
1 __ σ ln ( c t ) + ln ( Ω t ) ] − S t ,
S t ≈ h __ h t (
κv ___ ϕm v t __ v __ m t __ m [1 − β(1 − δ ) E t { u ′ ( c t+1 ) _____ u ′ ( c t )
y t+1 ___ n t+1 ___ y t __ n t
v t+1 ___ v t ___ m t+1 ___ m t
} ] + γ [1 − β(1 − δ ) E t { u ′ ( c t+1 ) _____ u ′ ( c t )
y t+1 ___ n t+1 ___ y t __ n t } ]
) _______________________________________________________
1 − [1 − β(1 − δ )] [ κv ___ ϕm
+ γ] ,
where Ω t is the marginal disutility of employment (per hour worked).9The EMW, like the IMW, reflects movements in labor productivity, ln ( y t __ n t ) , and
the marginal utility of consumption, 1 __ σ ln ( c t ) . But the EMW also differs from the IMW. Whereas the IMW reflects the marginal disutility of an extra hour, which is highly procyclical for reasonable Frisch elasticities, the extensive margin reflects
8 The assumptions that κ , δ , and γ are constant over time (and thus exogenous) are not necessary for the deriva-tion of the EMW but do simplify the data needed for its construction.
9 The approximation stems from our use of several first-order Taylor series approximations. The online Appendix provides more details on the EMW (and IMW) construction.

1124 THE AMERICAN ECONOMIC REVIEW APRIL 2018
the average disutility of adding a worker. We find this average disutility to be nearly acyclical. In addition, the term S t , which is specific to the EMW, reflects the efficacy of spending on vacancies. In recessions, S t declines as vacancies are more likely to yield a match. This lends a countercyclical component to the EMW. The cyclicality of the EMW vis-à-vis the IMW essentially reduces to whether cyclicality in the hiring term S t exceeds that in the marginal disutility of working a longer workweek.
It is well established that cyclical movements in total hours are primarily driven by employment fluctuations. That holds true for our 1987 to 2012 period, where cyclical employment fluctuations (with respect to real GDP or total hours) are about four times larger than in the workweek. One might jump to the conclusion that cyclicality in the extensive (employment) margin wedge would similarly dominate cyclicality in the intensive (workweek) margin wedge. That jump would be unwar-ranted, however. Important components of the wedge, labor’s marginal product and consumption’s marginal utility, display the same cyclicality with respect to both margins. Any wedge differences, as just discussed, reduce to cyclicality in the hir-ing term S t versus that in the marginal disutility of working a longer workweek. Although employment fluctuations are larger than those in the workweek, the elas-ticity of the marginal disutility in response to the workweek may exceed that of the hiring cost S t to employment.
We treat the elasticity of labor supply at the intensive margin as reflecting curva-ture in preferences, while that at the extensive margin reflects the impact of adjust-ment costs. Of course, a more general calculation might allow for adjustments costs at the intensive margin as well, or allow for upward-sloping labor supply at the extensive margin, beyond that generated by adjustment costs. For instance, con-sider heterogeneity in worker productivity. This introduces comparative advantage in labor supply. Ignoring search costs, the social planner would select the most pro-ductive workers for employment first. If expanding employment requires adding a worker with less market comparative advantage in a boom than in a bust, then this should act to stabilize employment. So by ignoring comparative advantage, we may understate the cyclicality of the wedge at the extensive margin.10
To construct the EMW, we use the same variables required by the IMW, plus vacancies ( v t ), matches ( m t ), and additional parameters. A quarterly separation rate of δ = 0.105 matches the average rate of quits, layoffs, and discharges in the BLS Job Openings and Labor Turnover Survey. The discount factor β = 0.996 implies a steady-state annual real interest rate of 1.6 percent, the average of the three-month T-bill rate less core PCE inflation over our sample. Hiring costs per match, κv/m , are set to 0.4 quarters of output, and training costs to γ = 0.16 , consistent with estimates by Barron, Berger, and Black (1999). Finally, the elasticity of matches to vacancies is set to ϕ = 0.5 . These parameter values imply a steady-state ratio of mrs to mpn on the extensive margin of about 0.90.
We find that the EMW and IMW elasticities are quite similar. Figure 1 shows the unfiltered extensive and intensive margin wedges from 1987 to 2012. Table 2 reports their cyclical elasticities with respect to real GDP and hours worked. The
10 Heterogeneity in preferences through Ω t acts similarly, as comparative advantage is then dictated by a work-er’s productivity relative to Ω t .

1125BILS ET AL.: THE PRODUCT MARKET WEDGE IN RECESSIONSVOL. 108 NO. 4-5
elasticities of EMW and IMW with respect to GDP are −1.99 (0.26) and −1.91 (0.13), respectively.11
B. Decomposing the Wedge
We now empirically decompose the labor wedge into product market and labor market components (or, equivalently, price and wage markups). This requires a measure of the marginal cost of labor to firms. As stressed by Galí, Gertler, and López-Salido (2007), the assumption that any particular wage measure reflects labor’s true marginal cost is controversial. We will show that alternative wage mea-sures lead to vastly different conclusions about the relative importance of the price markup versus wage markup. This motivates our subsequent analysis, which decom-poses the labor wedge without using wage data.
11 EMW and IMW elasticities are smaller than for the RAW; an aggregate Frisch elasticity of 2.3 would make the RAW behave similarly to the EMW and IMW.
1987
−0.2
−0.1
0.1
0.2
0
1989
1991
1993
1995
1997
1999
In lo
gs
2001
2003
2005
2007
2009
2011
EMW (based on VAR)IMW
Figure 1. EMW versus IMW (Unfiltered)
Table 2—Extensive and Intensive Margin Wedges
Elasticity w.r.t.
GDP Total hours
Extensive margin wedge −1.99 (0.26) −1.55 (0.14)Intensive margin wedge −1.91 (0.13) −1.38 (0.05)
Notes: Each entry is from a separate regression. Sample covers 1987:I–2012:IV. All variables are in logs and HP-filtered. Wedge calculations, equations (2) and (4), use σ = 0.5 and η = 0.5, and EMW expectation terms are constructed by a VAR.

1126 THE AMERICAN ECONOMIC REVIEW APRIL 2018
The IMW decomposition is standard and given by
(5) IM W t = [ln ( y t __ n t ) − ln ( w t ___ p t ) ] + [ln ( w t ___ p t ) − 1 __ σ ln ( c t ) − 1 __ η ln ( h t )]
= μ t p, int + μ t w, int ,
where w t / p t is the (real) marginal cost of labor to firms. The price markup based on the intensive margin ( μ p, int ) is the gap between the firm’s marginal product and marginal cost of labor. The wage markup based on the intensive margin ( μ w, int ) is the gap between the firm’s marginal cost and the household’s cost of providing an additional hour.
The EMW decomposition is
(6) EM W t = [ln ( y t __ n t ) − S ̃ t − ln ( w t ___ p t ) ] + [ln ( w t ___ p t ) + S ̃ t − S t − 1 __ σ ln ( c t ) − ln ( Ω t )]
= μ t p, ext + μ t w, ext ,
where S ̃ t takes the same form as S t in equation (4) but with ϕ = 1 . The presence of S ̃ t rather than S t reflects the fact that firms do not internalize the congestion effects of their decision to post another vacancy; each firm views the probability of filling a vacancy as m/v , whereas the social planner knows one more vacancy generates ϕm/v additional matches. For intuition, momentarily consider S ̃ t = S t in equation (6). Doing so, it is apparent that the wage markup on the extensive margin ( μ w, ext ) mirrors that on the intensive margin ( μ w, int ), but with the household’s mrs calculated at the employment margin. For the price markup on the extensive margin ( μ p, ext ), an
additional employee produces ln ( y t __ n t ) − S t because firms pay the vacancy cost ( S t ).Table 3 decomposes the EMW and IMW into the price markup and wage markup
using average hourly earnings (AHE) as the measure of the firm’s marginal cost of labor ( w t ). This wage measure is conventional and would reflect the true mar-ginal cost if all workers were employed in spot markets. Here the price markup ln ( y t __ n t ) − ln ( w t __ p t ) is simply the (log) inverse labor share. Using AHE, the price markup accounts for only 2 to 6 percent of the cyclicality of the labor wedge on the intensive margin, and between 16 and 23 percent on the extensive margin. These results are in line with Karabarbounis’s (2014a) conclusion that the price markup is relatively unimportant.
Table 3—Wedge Decomposition: Average Hourly Earnings (AHE)
Elasticity w.r.t.
GDP Total hours
Extensive margin wedge −1.99 (0.26) −1.55 (0.14) Price markup (AHE) −0.32 (0.14) −0.35 (0.09)Intensive margin wedge −1.91 (0.13) −1.38 (0.05) Price markup (AHE) −0.04 (0.08) −0.08 (0.05)
Notes: Each entry is from a separate regression. Sample covers 1987:I–2012:IV. All variables are in logs and HP-filtered. Expectation terms in the EMW are constructed using a VAR. The price markup inferred from the extensive margin ( μ p,ext ) follows equation (6), and the price markup from the intensive margin ( μ p,int ) follows (5).

1127BILS ET AL.: THE PRODUCT MARKET WEDGE IN RECESSIONSVOL. 108 NO. 4-5
Alternative frameworks for understanding the labor market, however, empha-size the durable nature of the firm-worker relationship and imply that the contemporaneous wage plays no allocative role. For example, in matching models with search frictions, what matters is the expected surplus generated over the life of the match and not the wage payment at any one time. Implicit contracting mod-els similarly imply that the flow wage payment is not allocative. Barro (1977) and Rosen (1985) forcefully drive home that an acyclical wage, or even a countercycli-cal wage, can coincide with a highly procyclical true price of labor (see also Basu and House 2016). Recent examples of empirical support for implicit contracting include Ham and Reilly (2013) and Bellou and Kaymak (2012).
In Table 4 we examine how cyclicality in two alternative measures of the mar-ginal cost of labor affect the wedge decomposition. We use cyclicality for the wages of new hires (NH) and the user cost of labor (UC) as reported by Kudlyak (2014) (please see online Appendix). Both are arguably more relevant for job formation.12 We therefore focus on the extensive margin. We find that, depending on the wage measure used, the price markup can account for almost none or essentially all of the EMW, from 16 percent using average hourly earnings to 109 percent using user cost. (Using the user cost of labor, the price markup also accounts for all cyclicality in the intensive margin wedge from Table 3.)
II. The Self-Employed Wedge
Given the ambiguity of the decomposition results just presented, it is useful to explore decompositions of the labor wedge that do not depend on wage data. In the online Appendix we present a static decision problem of individuals choosing whether to work for others, work for themselves as sole proprietors, or work for themselves with employees. Talent draws (or occupation-specific human capital) determine which of these choices maximize utility. Whether a self-employed person has employees or not, they choose how many hours to work, leading to a first-or-der condition on the intensive margin. In this first-order condition, their marginal self-employed earnings are proportional to their average self-employed earnings per
12 See Pissarides (2009); Haefke, Sonntag, and van Rens (2013); and Kudlyak (2014). Kudlyak finds that the new hire wage falls 1.2 percent relative to all workers’ wages for each percentage point rise in the unemployment rate, whereas the relative fall in the user cost of labor is 3.4 percent.
Table 4—Wedge Decomposition: Alternative Wage Measures
Elasticity w.r.t.
GDP Total hours
Extensive margin wedge −1.99 (0.26) −1.55 (0.14) Price markup (AHE) −0.32 (0.14) −0.35 (0.09) Price markup (NH) −0.98 (0.16) −0.81 (0.09) Price markup (UC) −2.17 (0.21) −1.65 (0.09)
Notes: Each entry is from a separate regression. Sample covers 1987:I–2012:IV. All variables are in logs and HP-filtered. Expectation terms in the EMW are constructed using a vector autoregression (VAR). The price markup follows equation (6). See the online Appendix for details on construction of NH and UC.

1128 THE AMERICAN ECONOMIC REVIEW APRIL 2018
hour. This leads to a familiar labor wedge for the self-employed with the usual decomposition:
μ SE = ln (mpn) SE − ln ( w __ p ) SE
μ SE p
+ ln ( w __ p ) SE
− ln (mrs) SE
μ SE w
.
We assume μ SE w = 0 . That is, for the self-employed, we assume that their marginal earnings, i.e., the marginal price of their own labor ( w __ p ) SE
, is equal to their mrs because no wage rigidities or other labor market distortions impinge on their deci-sion to supply labor to their own business. This implies that any labor wedge for the self-employed must be due to the price markup:
μ SE = ln (mpn) SE − ln (mrs) SE
μ SE p .
.
Note that, by assuming μ SE w = 0 , we can use mr s SE as our measure of the unob-served shadow wage for the self-employed ( w __ p ) SE
.
We maintain our Section I assumptions on preferences. For technology, unlike in Section I, where we implicitly assumed employee and self-employed hours were perfect substitutes, here we assume that self-employed hours enter production alone with a constant elasticity. The resulting μ SE takes the same form as equation (2), though we must now measure hours worked, productivity, and consumption for the self-employed. To do so, we turn to the CPS and CES. We first document the cycli-cal behavior of self-employed hours worked and then check whether movements in productivity and consumption can explain these fluctuations.
As a starting point, we note that self-employment has been just as cyclical as total employment. The share of self-employed in nonagricultural industries declined slightly during each of the past two NBER-defined recessions: from 10.1 to 10.0 percent during 2001 and from 10.5 to 10.4 percent from 2007 to 2009.13 The self-employment share exhibits lower frequency fluctuations, but if we HP-filter, the resulting series is completely acyclical with respect to GDP or aggregate hours. Becoming self-employed requires starting a business, so fluctuations in self-employment could be affected by financing costs and constraints. In particu-lar, the decline in self-employment during the Great Recession may partly reflect financing constraints. Going forward, we thus focus on the intensive (hours) margin for the self-employed.
13 Hipple (2010) reports annual rates of self-employment in the United States for 1994 to 2009 based on the monthly CPS, and these series are extended through 2012 (based on Hipple input) by Heim (2014). The Hipple series includes both incorporated and unincorporated self-employed. Incorporated self-employed constitute about one-third of total self-employed. The numbers reported here are for non-agriculture, which represents 94 percent of the self-employed. For agriculture, self-employment (again from Hipple) is acyclical. We focus on non-agriculture workers because top- and bottom-coding of income in the CPS is extreme for farmers. For farmers, it is also implau-sible to treat realized income as known at the time that labor input is chosen, an assumption implicit in calculations of the labor wedge.

1129BILS ET AL.: THE PRODUCT MARKET WEDGE IN RECESSIONSVOL. 108 NO. 4-5
We base our analysis on the Annual Social and Economic supplements to the CPS, typically referred to as the March CPS. In the March supplement, household mem-bers report their hours and income for the previous calendar year. They also report the income and class of workers at their primary job, the job held longest during the prior year. The class-of-worker variable allows us to distinguish the self-employed separately for agriculture and non-agriculture. We begin our sample in 1987, the first year that data on primary-job income are available. Advantages of the March supplement are: (i) it is large; (ii) its top-coding of income is less extreme than in the monthly surveys; and (iii) some households can be matched across two consec-utive March surveys, allowing us to examine year-over-year changes for a given set of workers. Our unmatched sample contains 197,723 self-employed individuals for 1987 to 2012 (as well as 1,901,936 wage earners).14
Figure 2 reports usual weekly hours and total annual hours worked separately for the self-employed (nonagricultural) and for those earning wages and salaries for 1987 to 2012. The intensive margin is clearly more cyclical for the self-employed. If we regress hours per week on real GDP (both series are in logs and HP-filtered), the elasticity for the self-employed (0.37, standard error 0.13) is nearly twice that for wage earners (0.20, s.e. 0.02). During the Great Recession (2007–2009), the work-week for the self-employed declined by 4.9 percent (two full hours) compared with only 1.7 percent for wage earners. Similarly, annual hours declined by 6.9 percent for the self-employed, compared with 3.2 percent for wage earners.
Figure 2 might be influenced by composition bias. For example, if workers becom-ing self-employed in expansions work more hours than the typical self-employed,
14 We require that workers be between ages 20 and 70 and work at least 10 hours per week and at least 10 weeks during the year. Some income and hours responses are top-coded. In each year we trim the top and bottom 9.6 percent of observations by income on primary job; 9.6 percent is just large enough to remove the top-coding of business income for the self-employed in all 26 years. We trim the bottom for symmetry; this also serves to remove all negative income entries. Usual hours are top-coded at 99 per week. We trim the top 1.2 percent of workers by weekly hours. This is the minimal trimming that removes top-coded hours for all years. We also report results below making the minimal trims necessary in each year of matched data. This reduces the average sample share trimmed by top coding of earnings from 9.6 to 4.9 percent, and for the workweek from 1.2 to 0.5 percent. (We still trim the bottom of earnings distribution symmetrically.) Our results are essentially unaffected.
1,880
1,920
1,960
2,000
2,040
2,080
2,120
2,160
44
43
42
41
40
3988 90 92 94 9896 00 0806
Annual hoursW
eekl
y ho
urs
Wage-earners weekly hours
Wage-earnersannual hours
Self-employed weekly hours
Self-employedannual hours
10 1202 04
Figure 2. Hours for the Self-Employed versus Wage Earners

1130 THE AMERICAN ECONOMIC REVIEW APRIL 2018
then hours in Figure 2 will have a procyclical bias. For this reason, we match self-employed individuals across consecutive March supplements, constructing growth rates for their hours and income.15 Using these growth rates, we express hours and income relative to 1987. We are not able to match across 1994 and 1995 calendar years because of a CPS sample redesign. For 1994–1995 we impute to each series its mean growth rate. We then create a level series indexed to 1987. In all sub-sequent statistics, we exclude years 1994 and 1995. Our matched sample includes 39,306 self-employed individuals, prior to trimming to deal with top-coding.16
When we compare these hours indices for the self-employed and wage earners, we see that the workweek is more cyclical for the self-employed. The elasticity of the workweek with respect to real GDP (both variables are HP-filtered) is 0.28 (s.e. 0.07) for the self-employed versus 0.17 (s.e. 0.03) for wage earners. Annual hours are slightly more cyclical for wage earners, with an elasticity with respect to real GDP of 0.57 (s.e. 0.08) compared with 0.54 (s.e. 0.13) for the self-employed. Similar remarks apply if we measure the cycle by aggregate hours.
In Table 5 we report the cyclicality of the intensive margin labor wedge. The first column is estimated for all workers, not just the self-employed. It repeats the analysis from equation (2), but uses workweek fluctuations constructed from the matched-CPS surveys.17 It is also annual rather than quarterly and excludes 1994 and 1995 because we cannot match those years in the CPS. It dispenses with the tax wedge, which we found to have little impact. As in Section I, we find a strongly countercyclical wedge. The elasticities of the wedge with respect to real GDP and aggregate hours, −1.87 and −1.20, are modestly smaller than reported in Table 2 (estimates there being −1.91 and −1.38), with the difference reflecting a slightly less procyclical workweek.
Columns 2–4 of Table 5 show how the wedge’s cyclicality changes as we sequen-tially replace the estimates of cyclicality in hours, productivity, and consumption for
15 We follow standard matching procedures for the March CPS. Respondents are matched across years based on household and person identifiers and conformity of each respondent’s sex, race, and age.
16 The March CPS responses for weeks worked and usual hours per week are for all prior-year jobs, whereas class of worker and income refer to the primary (longest-held) job. To achieve an income-compatible measure of hours growth, we restrict our self-employed sample to those who received at least 95 percent of income from their primary self-employed job. (The average of that income share across the two years must be at least 0.95.)
17 Because the wedge is constructed using hours of continuously employed workers, one could argue for using continuously employed consumption rather than per capita consumption. As discussed in Section I, the former is a bit less procyclical, which implies the resulting wedge would be somewhat less countercyclical.
Table 5—Cyclicality of the Labor Wedge, All Workers versus Self-Employed
(1) (2) (3) (4)
Elasticity w.r.t.Real GDP −1.87 (0.09) −2.06 (0.15) −1.97 (0.21) −3.23 (0.96)Total hours −1.20 (0.05) −1.41 (0.09) −1.29 (0.14) −1.91 (0.63)
Hours All workers SE SE SEMPN Agg. y/n Agg. y/n SE inc/hr SE inc/hrConsumption NIPA PCE NIPA PCE NIPA PCE + CE Adj.
Notes: The labor wedge is constructed according to equation (2). Sample is based on matched March CPS self-employed outside government and agriculture. CPS observations are weighted. Each cell represents a separate regression. Regressions have 24 annual observations, 1987–1993 and 1996–2012. Newey-West standard errors are in parentheses. Hours are weekly. NIPA PCE refers to aggregate real expenditures on nondurables and services. CE adjustment incor-porates consumption for the self-employed versus all persons from the Consumer Expenditure Surveys.

1131BILS ET AL.: THE PRODUCT MARKET WEDGE IN RECESSIONSVOL. 108 NO. 4-5
all workers with estimates for the self-employed. Column 2 constructs the wedge using fluctuations in the workweek just for the self-employed, maintaining the same aggregate series for productivity and consumption. Not surprisingly, given the greater cyclicality of the workweek for the self-employed described previously, this results in a modestly more cyclical labor wedge. The elasticity with respect to real GDP goes from −1.87 (s.e. 0.09) to −2.06 (s.e. 0.15).
We next replace aggregate labor productivity with a measure of productivity spe-cific to the self-employed. Our measure is self-employed annual business income divided by their annual hours worked.18 Self-employed business income per hour is proportional to the marginal product of self-employed labor assuming: (i) a con-stant elasticity of output with respect to self-employed labor, and (ii) self-employed income is proportional to business output. This second assumption is likely to be vio-lated: self-employed income probably includes some returns to equity in the business, not just self-employed labor. This should lead us to overstate the procyclicality of the marginal product of labor for the self-employed, because their residual equity claim on business revenue is likely to be more procyclical than business output. This means we probably understate the countercyclicality of the self-employed labor wedge.
An additional factor that works to understate the countercyclicality of the labor wedge is that our self-employed productivity measure ignores any overhead compo-nent of self-employed labor. This could be especially important given the small scale of operations for much self-employed production. A final concern is that reported income could misstate actual income. The self-employed tend to understate income. Hurst, Li, and Pugsley (2014) find the ratio of consumption to income is higher for the self-employed, consistent with the self-employed understating income. The con-cern for us would be if the self-employed underreport at a lower rate in recessions.
Going from column 2 to 3 of Table 5, we replace aggregate labor productivity with self-employed business income per hour. Aggregate labor productivity has been modestly countercyclical since 1987, with an elasticity with respect to real GDP of −0.21 (s.e. 0.05). Self-employed business income per hour has been less cyclical (elasticity −0.13, s.e. 0.16). Thus, the estimated labor wedge becomes slightly less countercyclical, with an elasticity of −1.97 (s.e. 0.21) with respect to real GDP. In summary, the wedge calculated with measured productivity and hours for the self-employed is just as cyclical as that for all workers. Figure 3 plots the time series of these two wedges.19
We have assumed the cyclicality of consumption for the self-employed is the same as for consumption per capita. For robustness, we estimate self-employed consump-tion relative to aggregate consumption based on quarterly growth rates in household spending on nondurables and services in the Consumer Expenditure Surveys (CE). We add these estimates of relative consumption to aggregate consumption to obtain an estimate of consumption for the self-employed.
18 We deflate business income by the nondurables and services PCE deflator. We calculate the percentage change in self-employed income across matched years by the midpoint formula. This avoids extreme values for individuals with very low income in one of the years.
19 We reestimate for column 3 making the minimal trims necessary to remove top-coding in any given matched year of CPS data, rather than trimming the same shares in all years. This yields a trimmed share that averages about 10 percent. Our results are little affected. The elasticity of the self-employed wedge with respect to real GDP goes from coefficient −1.97 to −1.96 (s.e. 0.25). The elasticity with respect to total hours goes from −1.29 to −1.20 (s.e. 0.14).
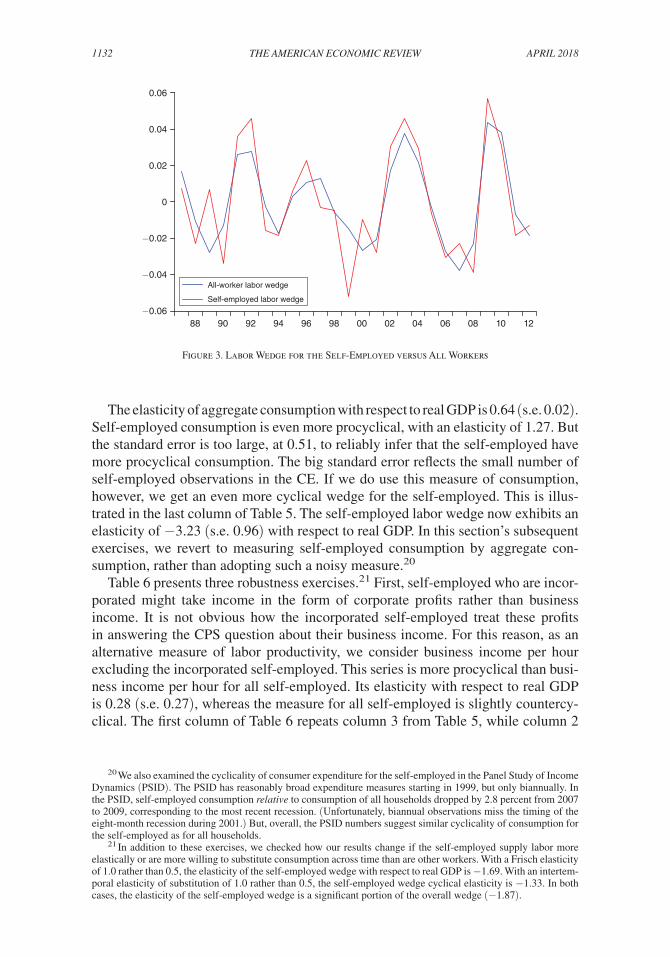
1132 THE AMERICAN ECONOMIC REVIEW APRIL 2018
The elasticity of aggregate consumption with respect to real GDP is 0.64 (s.e. 0.02). Self-employed consumption is even more procyclical, with an elasticity of 1.27. But the standard error is too large, at 0.51, to reliably infer that the self-employed have more procyclical consumption. The big standard error reflects the small number of self-employed observations in the CE. If we do use this measure of consumption, however, we get an even more cyclical wedge for the self-employed. This is illus-trated in the last column of Table 5. The self-employed labor wedge now exhibits an elasticity of −3.23 (s.e. 0.96) with respect to real GDP. In this section’s subsequent exercises, we revert to measuring self-employed consumption by aggregate con-sumption, rather than adopting such a noisy measure.20
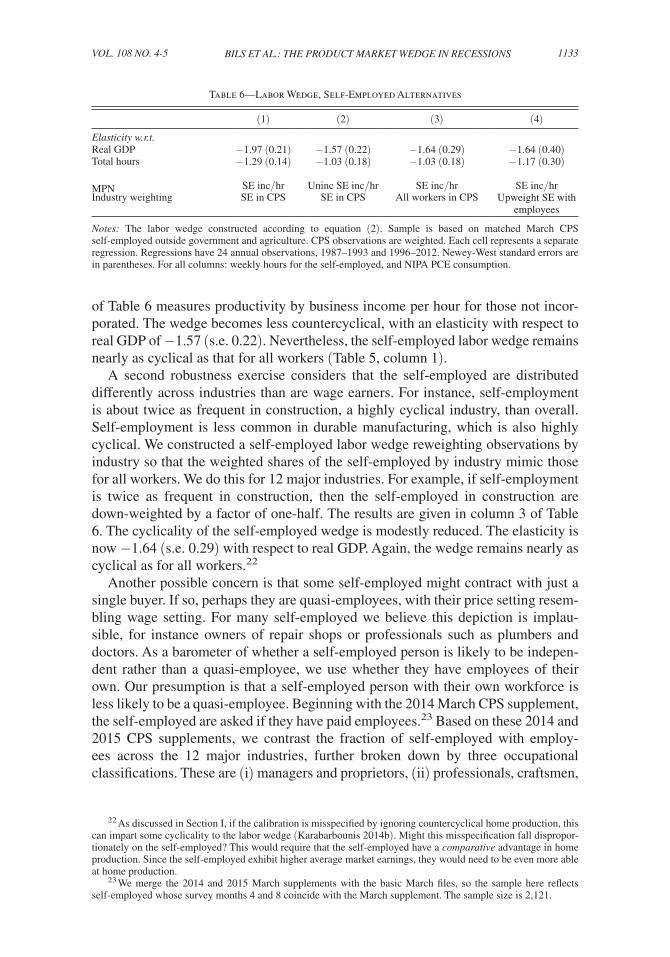
Table 6 presents three robustness exercises.21 First, self-employed who are incor-porated might take income in the form of corporate profits rather than business income. It is not obvious how the incorporated self-employed treat these profits in answering the CPS question about their business income. For this reason, as an alternative measure of labor productivity, we consider business income per hour excluding the incorporated self-employed. This series is more procyclical than busi-ness income per hour for all self-employed. Its elasticity with respect to real GDP is 0.28 (s.e. 0.27), whereas the measure for all self-employed is slightly countercy-clical. The first column of Table 6 repeats column 3 from Table 5, while column 2
20 We also examined the cyclicality of consumer expenditure for the self-employed in the Panel Study of Income Dynamics (PSID). The PSID has reasonably broad expenditure measures starting in 1999, but only biannually. In the PSID, self-employed consumption relative to consumption of all households dropped by 2.8 percent from 2007 to 2009, corresponding to the most recent recession. (Unfortunately, biannual observations miss the timing of the eight-month recession during 2001.) But, overall, the PSID numbers suggest similar cyclicality of consumption for the self-employed as for all households.
21 In addition to these exercises, we checked how our results change if the self-employed supply labor more elastically or are more willing to substitute consumption across time than are other workers. With a Frisch elasticity of 1.0 rather than 0.5, the elasticity of the self-employed wedge with respect to real GDP is −1.69. With an intertem-poral elasticity of substitution of 1.0 rather than 0.5, the self-employed wedge cyclical elasticity is −1.33. In both cases, the elasticity of the self-employed wedge is a significant portion of the overall wedge (−1.87).
88−0.06
−0.04
−0.02
0
0.02
0.04
0.06
90 92 94 9896 00 0806 10 1202 04
All-worker labor wedge
Self-employed labor wedge
Figure 3. Labor Wedge for the Self-Employed versus All Workers
1133BILS ET AL.: THE PRODUCT MARKET WEDGE IN RECESSIONSVOL. 108 NO. 4-5
of Table 6 measures productivity by business income per hour for those not incor-porated. The wedge becomes less countercyclical, with an elasticity with respect to real GDP of −1.57 (s.e. 0.22). Nevertheless, the self-employed labor wedge remains nearly as cyclical as that for all workers (Table 5, column 1).
A second robustness exercise considers that the self-employed are distributed differently across industries than are wage earners. For instance, self-employment is about twice as frequent in construction, a highly cyclical industry, than overall. Self-employment is less common in durable manufacturing, which is also highly cyclical. We constructed a self-employed labor wedge reweighting observations by industry so that the weighted shares of the self-employed by industry mimic those for all workers. We do this for 12 major industries. For example, if self-employment is twice as frequent in construction, then the self-employed in construction are down-weighted by a factor of one-half. The results are given in column 3 of Table 6. The cyclicality of the self-employed wedge is modestly reduced. The elasticity is now −1.64 (s.e. 0.29) with respect to real GDP. Again, the wedge remains nearly as cyclical as for all workers.22
Another possible concern is that some self-employed might contract with just a single buyer. If so, perhaps they are quasi-employees, with their price setting resem-bling wage setting. For many self-employed we believe this depiction is implau-sible, for instance owners of repair shops or professionals such as plumbers and doctors. As a barometer of whether a self-employed person is likely to be indepen-dent rather than a quasi-employee, we use whether they have employees of their own. Our presumption is that a self-employed person with their own workforce is less likely to be a quasi-employee. Beginning with the 2014 March CPS supplement, the self-employed are asked if they have paid employees.23 Based on these 2014 and 2015 CPS supplements, we contrast the fraction of self-employed with employ-ees across the 12 major industries, further broken down by three occupational classifications. These are (i) managers and proprietors, (ii) professionals, craftsmen,
22 As discussed in Section I, if the calibration is misspecified by ignoring countercyclical home production, this can impart some cyclicality to the labor wedge (Karabarbounis 2014b). Might this misspecification fall dispropor-tionately on the self-employed? This would require that the self-employed have a comparative advantage in home production. Since the self-employed exhibit higher average market earnings, they would need to be even more able at home production.
23 We merge the 2014 and 2015 March supplements with the basic March files, so the sample here reflects self-employed whose survey months 4 and 8 coincide with the March supplement. The sample size is 2,121.
Table 6—Labor Wedge, Self-Employed Alternatives
(1) (2) (3) (4)
Elasticity w.r.t.Real GDP −1.97 (0.21) −1.57 (0.22) −1.64 (0.29) −1.64 (0.40)Total hours −1.29 (0.14) −1.03 (0.18) −1.03 (0.18) −1.17 (0.30)
MPN SE inc/hr Uninc SE inc/hr SE inc/hr SE inc/hrIndustry weighting SE in CPS SE in CPS All workers in CPS Upweight SE with
employees
Notes: The labor wedge constructed according to equation (2). Sample is based on matched March CPS self-employed outside government and agriculture. CPS observations are weighted. Each cell represents a separate regression. Regressions have 24 annual observations, 1987–1993 and 1996–2012. Newey-West standard errors are in parentheses. For all columns: weekly hours for the self-employed, and NIPA PCE consumption.

1134 THE AMERICAN ECONOMIC REVIEW APRIL 2018
and operatives, and (iii) clerical, sales, service workers, and laborers. Overall, 27 percent of the self-employed report having employees. It is highest in retailing at 47 percent. (Across industry/occupations, it varies from 7 percent to 70 percent.)
For the last column of Table 6, we reweight the self-employed for our 1987 to 2012 sample, based on their industry/occupation cell, by the share of self-employed with employees in those cells in the 2014–2015 March supplements. That is, we weight observations only to the extent they reflect industries/occupations where the self-employed employ workers. The cyclicality of the self-employed wedge is reduced, but quite modestly. The elasticity is −1.64 (s.e. 0.40) with respect to real GDP, nearly as cyclical as for all workers from Table 5.
We conclude that the self-employed exhibit a highly countercyclical labor wedge.24 Depending on the specification, it is either as cyclical as the wedge for all workers or nearly so. Because this wedge is presumably not driven by wage or other labor market distortions, it is evidence of highly countercyclical price markups. By extension, we find it suggestive of countercyclical price markups for the overall economy, assuming the cyclicality of price markups is similar for owner/operators as for other firms.
III. Intermediate Inputs
The conventional way to estimate price markups ( μ p ) is based on the inverse labor share of income, such as Karabarbounis (2014a). But any input with a well-measured marginal product and marginal price can be used to infer marginal cost and thus price markups. Here we investigate intermediate inputs: materials, energy, and services.
Intermediate inputs are promising for several reasons. First, intermediates are used by all industries. Second, adjustment costs for intermediates are believed to be low relative to adjustment costs for capital or even labor (see Basu 1995; Levinsohn and Petrin 2003; and De Loecker and Warzynski 2012). Third, the assumption of no overhead component seems more defensible for intermediates than for labor.25
One question is whether intermediate prices reflect the marginal cost of interme-diate inputs. Long-term relationships between firms and suppliers could raise the same implicit contracting issues that arise with labor. Still, intermediates offer an independent piece of evidence vis-à-vis labor. And, as with labor, one would expect price smoothing relative to true input costs to impart a procyclical bias to the esti-mated μ p . See Carlton (1986) for evidence and arguments along this line.
A. Technology for Gross Output
We assume a CES production function for gross output in an industry:
y = [θ m 1− 1 _ ε + (1 − θ ) [ z v [α k 1− 1 __ ω + (1 − α ) ( z n n ) 1− 1 __ ω ] ω ___ ω−1
] 1− 1 _ ε
]
ε ___ ε−1
24 As shown in the online Appendix, this finding is robust to detrending our data using Hamilton’s (forthcom-ing) method rather than the HP-filter.
25 In any case, an overhead component of intermediates would actually reinforce our findings, just like overhead labor would do. With overhead inputs, variable inputs are more procyclical than total inputs, so that marginal cost is more procyclical than suggested by total inputs, and price markups, in turn, are more countercyclical.

1135BILS ET AL.: THE PRODUCT MARKET WEDGE IN RECESSIONSVOL. 108 NO. 4-5
where y denotes gross output, m intermediate inputs, k capital, and n labor. Technology shocks can be specific to value added ( z v ) or labor ( z n ). The elasticity of substitution between intermediates and value added is ε , and the elasticity of substi-tution between capital and labor within value added is ω .
With this technology, the marginal product of intermediates is
∂ y ___ ∂ m = θ ( y __ m ) 1 _ ε .
Based on this marginal product, we can estimate price markups as
(7) μ p = p ______ p m / ∂ y ___ ∂ m
= pθ ( y __ m )
1 _ ε _______ p m .
In the special case of Cobb-Douglas aggregation of intermediates and value added ( ε = 1 ), the price markup is the inverse of intermediates’ share:
μ p = θpy ____ p m m .
A higher price-cost markup boosts gross output relative to spending on inter-mediates. This is analogous to using inverse labor’s share to measure price markup movements. Note, one must assume Cobb-Douglas production in labor and inter-mediates to estimate markups from the inverse labor share in value added, as we did in Section I. If production is Cobb-Douglas in intermediates and value added, then a countercyclical markup would show up as a procyclical intermediate inputs share.
Although an overhead component to intermediates is unlikely, one may still be concerned about fixed costs of production. Suppose y t = f t − Γ , where f t is our CES production function and Γ is a fixed cost. In the Cobb-Douglas case, this would
imply μ t p = θ p t y t ____ p mt m t (1 + Γ __ y t ) . Thus, if fixed costs are important, our estimates will
understate the countercyclicality of price markups.
B. Evidence on the Cyclicality of Intermediate Inputs
We use the BLS Multifactor Productivity Database on industry gross output and KLEMS inputs (capital, labor, energy, materials, and services). The KLEMS dataset is annual from 1987 to 2012, covering 60 industries, including 42 outside of manu-facturing. Other studies of the cyclicality of intermediates (Basu 1995; Vaona 2016; and Kim 2015) have focused on manufacturing, but manufacturing constitutes only about 12 percent of US GDP. Furthermore, the KLEMS data reflect significant revis-ing of industry GDP accounts by the Bureau of Economic Analysis (BEA), starting about a decade ago, to much more reliably divide industry output between value added and intermediate purchases.26
26 The KLEMS dataset incorporates data from a number of BLS and BEA programs. See BLS Handbook of Methods, chapter 11 (http://www.bls.gov/opub/hom/pdf/homch11.pdf) for a description of methodology. Thanks to improvements in census data collection on output and intermediates, in August 2010 KLEMS data became available beyond manufacturing. See Harper et al. (2010) for details. The comprehensive revision of BEA methods, improving measures of intermediates, is outlined in Moyer et al. (2004). These improvements are not captured

1136 THE AMERICAN ECONOMIC REVIEW APRIL 2018
Figure 4 plots the weighted-average KLEMS industry intermediate share from 1987 to 2012. It fluctuates but exhibits no clear trend. If the production elasticity for intermediates is stable, this is consistent with no trend in the price-cost markup. This is somewhat surprising in light of De Loecker and Eeckhout (2017), who infer sharply rising markups in recent decades. Their sample is Compustat firms, whereas KLEMS is based on listed and unlisted firms alike. Moreover, our evidence is for intermediate share alone, whereas theirs is for a combination of labor and interme-diate share (cost of goods sold).
Figure 5 plots the weighted-average KLEMS industry intermediate share against GDP, where both variables are in logs and HP-filtered. As shown, spending on intermediates relative to gross output is highly procyclical in the KLEMS data. In the Cobb-Douglas case of ε = 1 , a procyclical intermediate share implies a countercyclical markup.
To explore the cyclicality of markups more systematically, we next run regres-sions of the intermediate-based price markup on the cycle. Based on equation (7), the specification is
log ( p it ____ p mit ( y it ___ m it ) 1 _ ε ) = α i + β p log (cy c t ) + ε it ,
where cy c t is either real GDP or hours worked, and all variables are HP-filtered. The industry fixed effects ( α i ) should take out changes in the aggregate share due to shifting industry composition over the cycle. We weight industries by the average share of their value added in all industry value added from 1987 to 2012. Standard errors are clustered by year.
in data based solely on the Annual Surveys of Manufacturing (ASM), employed in a number of papers. KLEMS is also preferred to ASM because its division of gross output between value added and intermediates adjusts for intra-industry purchases and better reflects accumulation of inventories.
2010200520001995
Agg
rega
te in
term
edia
te s
hare
(per
cent
)
19901985
44
45
46
47
48
Figure 4. Aggregate Intermediate Share

1137BILS ET AL.: THE PRODUCT MARKET WEDGE IN RECESSIONSVOL. 108 NO. 4-5
Table 7 presents the results. Consider first the case of ε = 1 , for which production is Cobb-Douglas in intermediates and value added. The price markup is estimated to be highly countercyclical. This is true for both measures of the cycle (based on GDP or total hours worked), for all industries together, and separately for manufacturing and nonmanufacturing industries. Though not reported in the table, it is also true if we weight by annual Tornqvist value-added shares rather than shares over the entire sample, and if we use growth rates rather than HP-filtered series.
For manufacturing, we can break intermediate inputs into materials, energy, and services. As Table 7 shows, the inverse shares for materials and energy are both countercyclical, and significantly so. In contrast, the inverse share of spending on services is procyclical, perhaps because services are contracted less in spot markets than materials or energy.27
27 Outside manufacturing, we can only break intermediates into these components for the period 1997–2012. For all industries together, the inverse services share is acyclical, whereas the inverse shares of materials and energy are countercyclical.
Table 7—Cyclicality of Price Markups Using Intermediates
ε = 1 ε = 0.75
Elasticity w.r.t. → GDP Hours GDP Hours
All industries −0.94 (0.24) −0.59 (0.15) −1.20 (0.31) −0.75 (0.19)Nonmanufacturing −0.94 (0.24) −0.57 (0.16) −1.24 (0.32) −0.76 (0.21)Manufacturing −0.95 (0.32) −0.65 (0.20) −1.04 (0.39) −0.71 (0.24) Materials −1.56 (0.52) −1.03 (0.32) −1.78 (0.63) −1.15 (0.40) Services 1.49 (0.68) 0.93 (0.43) 1.90 (0.87) 1.16 (0.56) Energy −1.97 (1.05) −1.58 (0.69) −2.38 (1.42) −1.98 (0.90)
Notes: Each entry is from a separate regression. Annual data are from 1987 to 2012 for 60 industries (1,560 industry-year observations): 18 manufacturing and 42 nonmanufacturing. All variables are in logs and HP-filtered. Regressions include industry fixed effects and use industry average value-added shares as weights. Standard errors are clustered by year.
2007 2011200319991995
HP
-�lte
red
logs
19911987
−0.04
0.04
−0.02
0.02
0
Intermediate share
GDP
Figure 5. Cyclicalty of Intermediate Share
1138 THE AMERICAN ECONOMIC REVIEW APRIL 2018
It is often argued that it is tough to substitute between intermediates and value added. Bruno (1984) and Rotemberg and Woodford (1996) estimate elasticities of 0.45 and 0.69, respectively, for US manufacturing. Oberfield and Raval (2014) obtain estimates ranging from 0.63 to 0.90 by looking across regions in US manu-facturing, while Atalay (2017) estimates an elasticity of 0.5, but with large standard errors. We therefore report results using ε = 3/4 in Table 7. A smaller elasticity makes the μ p based on intermediates more countercyclical. Because firms shift toward intermediates in booms, the marginal product of intermediates falls faster if substitutability is limited, making marginal cost more procyclical. Thus, the price-cost markup implied by intermediate inputs becomes more countercyclical.
In the KLEMS data, both the price and quantity of intermediates are procycli-cal relative to labor, if one uses average hourly earnings (AHE) as the price of labor. The elasticity of p m /w with respect to real GDP is 0.65 (s.e. 0.16), while the elasticity of m/n with respect to real GDP is 1.19 (s.e. 0.37). Why do firms shift toward intermediates over labor in booms, if intermediates become relatively expen-sive? One answer is that AHE understates cyclicality in the price of labor, perhaps because of wage smoothing, with labor’s price even more procyclical than that of intermediates. That implies a much more procyclical marginal cost and, in turn, a much more countercyclical markup than judged by AHE.
What share of the labor wedge might be accounted for by the μ p we obtain from intermediates? To answer this, we construct an industry-specific labor wedge that is consistent with our gross output production function. We replace aggregate labor productivity (v/n) with nominal gross output per hour in each KLEMS industry (relative to the consumption deflator). We also consider preferences that allow for an industry-specific marginal rate of substitution.28 The industry- i (intensive margin) labor wedge is thus
ln ( μ i int ) = ln ( p i mp n i int ________ p mr s i int
) = ln ( p i
v i __ n i ___ p v _ n
) + ln ( y i __ v i ) − 1 __ η ln ( h i __ h ) + ln ( mp n int ______
mr s int ) .
This industry labor wedge differs from the aggregate labor wedge in three possible ways. Value added per hour could be more or less cyclical in the KLEMS industries than GDP per hour (the first term on the right side). The cyclicality of gross output may differ from value added (the second term). Finally, hours worked per worker, and thus the mrs , could be more (or less) cyclical for the KLEMS industries than for all industries (the third term).
Table 8 presents the cyclical elasticities. The KLEMS industry wedge has a smaller elasticity (−0.89 with respect to GDP) than the aggregate IMW (−1.91) from Section I. Why? Nominal value-added labor productivity is more procyclical in the KLEMS industries than GDP per hour (cyclical elasticity with respect to GDP of 0.33), and gross output is more procyclical than value added (cyclical elasticity of y/v with respect to GDP of 0.49). Workweeks, which are industry-specific and thus
28 Preferences are E 0 ∑ t=0 ∞ β t { c t 1−1/σ _____
1 − 1/ σ − ∑ i [ν ( h it 1+1/η _____ 1 + 1/ η + ψ) e it ] } and thus ln ( mr s it int _____
mr s t int ) = 1 __ η ln ( h it __ h t
) + ln ( e it __ e t ) .
In the online Appendix we consider alternative preferences, alternative technology (e.g., ε ≠ 1 ), and the extensive margin.

1139BILS ET AL.: THE PRODUCT MARKET WEDGE IN RECESSIONSVOL. 108 NO. 4-5
affect the all-industry, manufacturing, and nonmanufacturing wedges in different ways, account for the remainder.29
Comparing Tables 7 and 8, the intermediates-based μ p accounts for essentially all of the cyclical labor wedge.30 Figure 6 provides visual corroboration by plotting the weighted-average industry (inverse) intermediate share against the labor wedge, constructed for ε = 1 .31
When we consider ε = 0.75 , μ p becomes more countercyclical in Table 7. At the same time, a smaller ε makes the labor wedge less countercyclical because firms shift away from value added (labor) in booms. Thus, price-cost markups loom even larger relative to the labor wedge if intermediates and value added have more limited substitutability.
The results above are at the level of 60 industries, reflecting the industry makeup of the KLEMS dataset. We see the KLEMS data as the preferred source for examin-ing the cyclicality of intermediates because they extend beyond manufacturing and incorporate the highest quality industry information, especially on intermediates. One question that arises is whether the strong cyclicality in the intermediate share occurs at the plant level, or instead reflects a compositional shift of output toward plants with high intermediate shares during booms. For manufacturing, plant-level statistics from the US Longitudinal Research Database (LRD), which is based on the Census of Manufacturing and Annual Survey of Manufacturing, are reported in Garcia-Macia, Hsieh, and Klenow (2016). Though not directly comparable to KLEMS, one can check whether high intermediate share plants are more cyclical in the LRD moments.
Across plants j within each industry i , one can construct the standard intermedi-ate share as
s it = ∑ j∈i p mjt m jt ________ ∑ j∈i p yjt y jt
= ∑ j∈i
p yjt y jt _____ p yit y it ⋅
p mjt m jt ______ p yjt y jt .
29 Because some of our industries only have workweek data starting in 1990, we use the aggregate average workweek from 1987 through 2012, which had an elasticity with respect to GDP of 0.32 (s.e. 0.03), adjusted by the relative elasticity of industry-specific workweeks to the aggregate from 1990 through 2012. These elasticities are 0.32 (s.e. 0.03) for the aggregate, 0.22 (s.e. 0.04) for all KLEMS industries, 0.41 (0.08) for manufacturing KLEMS industries, and 0.16 (0.04) for nonmanufacturing KLEMS industries. Online Appendix Table A1 reports the cyclicality of the labor wedge using a common workweek for all industries (i.e., omitting the industry-specific adjustments).
30 As shown in the online Appendix, this finding is robust to detrending our data using Hamilton’s (forthcom-ing) method rather than the HP-filter.
31 The labor wedge in Figure 6 is constructed using the aggregate average workweek. Using industry-specific workweeks produces similar plots beginning in 1990 rather than 1987.
Table 8—Cyclicality of the Intensive Margin Labor Wedge
Elasticity w.r.t.
GDP Total hours
All industries −0.89 (0.26) −0.59 (0.13)Manufacturing −0.72 (0.39) −0.39 (0.20)Nonmanufacturing −0.93 (0.24) −0.65 (0.12)
Notes: Each entry is from a separate regression. Annual data are from 1987 to 2012 for 60 industries (1,560 industry-year observations): 18 manufacturing and 42 nonmanufacturing. All variables are in logs and HP-filtered. Regressions include industry fixed effects and use indus-try average value-added shares as weights. Standard errors are clustered by year.

1140 THE AMERICAN ECONOMIC REVIEW APRIL 2018
For contrast, one can construct a fixed-composition intermediate share as
s ̅ it = ∑ j∈i
p yjt y jt _____ p yit y it ⋅ s ̅ jC ,
where s ̅ jC denotes the average intermediate share for plant j across the census years in which it operates. Note that s ̅ jC only uses the most reliable LRD components, namely intermediates in census years and gross output in all years.32 If gross output shares are no more cyclical for high intermediate share plants, then s ̅ it should not project on the business cycle.
The LRD moments for 1987–2010 include s ̅ it for 17 industries that closely cor-respond to KLEMS industries. A regression of s ̅ it on the cyclical component of log GDP, controlling for industry effects, shows that the fixed composition intermediate shares are indeed procyclical. Comparing these estimates to Table 7, about one-third of the procyclical intermediate share at the industry level in manufacturing reflects plant composition, and the remaining two-thirds can be attributed to within-plant movements. If we remove this compositional component, we still find that the lion’s share of cyclicality in the labor wedge for manufacturing can be ascribed to price markups.
IV. Discussion and Relationship to Literature
How does our work relate to other attempts at measuring the cyclicality of price markups? The challenge is capturing cyclicality in the marginal cost of production. Researchers must make assumptions about firm production functions in order to infer marginal cost from quantities and prices of inputs and output. Marginal cost
32 Other than the census years 1992, 1997, 2002, and 2007, LRD coverage of intermediate inputs does not include purchased services. Identification of intermediate inputs in non-census years is considered sparse and of lower quality (Moyer et al. 2004).
2011200720031995 199919911987
−0.04
0.04
−0.02
0.02
0
HP
-�lte
red
logs
Product market wedge
Total wedge (common MRS)
Figure 6. Intermediates-Based μ p versus the Labor Wedge
1141BILS ET AL.: THE PRODUCT MARKET WEDGE IN RECESSIONSVOL. 108 NO. 4-5
should be equated across input margins, so one can consider the cost of increasing output via any input. Many studies have focused on labor: for example, Bils (1987); Rotemberg and Woodford (1999); and Nekarda and Ramey (2013).
Labor’s share of income, the average price of labor divided by its average prod-uct, often serves as the baseline measure of marginal cost, with corrections made to address concerns that average prices and products may not equal marginal ones. We argued in Section I that using wage data to infer the marginal price of labor may be especially fraught with difficulty, and subsequently eschewed wage data altogether by examining self-employed labor as well as intermediate inputs.
Rotemberg and Woodford (1999) pointed out that one could use intermediate inputs to infer markups. Basu (1995) found that quantities of intermediate inputs rose relative to real output in expansions, but did not explore relative price move-ments. The work of Murphy, Shleifer, and Vishny (1989) on relative price move-ments for broad categories suggested the relative price of intermediates was likely to be procyclical. By looking at the intermediate share of income, we combine quanti-ties and prices to obtain a measure of marginal cost in Section III. We also consider a more recent sample and more disaggregated industries.
Like us, Vaona (2016) uses total intermediate inputs to estimate markups. His sample is 1959–1996 US manufacturing industries, and he estimates the marginal product of intermediates nonparametrically. He emphasizes the response of indus-try markups to the industry cycle. Our focus is on how average industry markups respond to the aggregate cycle. We provide evidence beyond manufacturing, adjust for the composition of industries (and even plants within manufacturing), and com-pare it to the overall labor wedge quantitatively.
Kim (2015) estimates markup fluctuations from 1958 to 2009 for manufacturing industries from spending on energy intermediates. Energy is a fairly small com-ponent of our KLEMS intermediates: for 2010, it constituted only 4.4 percent of total intermediate spending in manufacturing, 6.2 percent in other industries. For his sample, Kim estimates that markups increase with the industry cycle. He includes year fixed effects, so his results are silent on the movement of markups over the aggregate cycle. If we similarly consider only energy spending in manufacturing, for our 1987–2012 sample we find energy’s share of gross output is procyclical and estimate a countercyclical price markup across a wide range of elasticities of substitution.
Other researchers have also used approaches that do not require wage data. Galeotti and Schiantarelli (1998) measure marginal cost using capital inputs. Like our approach, this requires assumptions on the production function to infer a mar-ginal product (of capital, in this case). In addition, they must take a stand on the stochastic discount factor, because the marginal price (i.e., rental rate) of capital is not directly observable but depends on both today’s acquisition price of capital and tomorrow’s expected discounted price.33 They find evidence of countercyclical markups.
Hall (2014) considers a model in which advertising shifts the static demand curve faced by a firm. If the markup is high, then the firm will want to advertise more. The
33 They incorporate adjustment costs, requiring a further functional form assumption.

1142 THE AMERICAN ECONOMIC REVIEW APRIL 2018
model implies that the ratio of advertising expenditures to revenue is proportional to the markup. Since the advertising expenditure share is acyclical in the data, Hall concludes that markups are also acyclical.
Alternative models of advertising will have different implications for markups. In the online Appendix we show that, if advertising affects consumer reservation prices rather than shifting quantity demanded, then changes to the price elasticity of demand have no effect on the advertising expenditure share, but do cause markup changes. A second alteration that breaks the tight contemporaneous link between advertising expenditures and markups is when advertising affects future demand (e.g., Bagwell 2007). Some evidence that advertising is a durable investment is pro-vided by Campello, Graham, and Harvey (2010). They report that planned marketing expenditures fell much more for financially constrained firms than for unconstrained firms during the Great Recession.34
Another approach, pursued by Bils and Kahn (2000) and Kryvtsov and Midrigan (2013), exploits the close theoretical relationship between markups and finished goods inventories. Consider a firm’s decision to add a unit of finished inventories. If the additional unit is sold in the current period, the net benefit is the markup of price over marginal cost. If the additional unit is not sold, the net benefit is the expected discounted ratio of future to current real marginal cost (the firm will not have to produce as much in the future). If the markup is low, holding all else equal, the benefit of holding inventories is smaller and the firm will reduce its inventories relative to sales.
Note, however, that empirically all else might not be equal. In particular, both papers must proxy for how firms’ discount rates vary over the cycle. It also nec-essary to capture any cyclicality in the elasticity of sales with respect to inven-
tories. Importantly, both studies assume ∂ sales _________ ∂ inventories is a time-invariant function of
the sales-to-inventory ratio.35 Given their assumptions and a highly procyclical sales-to-inventory ratio in the data, both studies conclude that markups must be countercyclical.
In the online Appendix we consider work-in-process (WIP) inventories and again infer countercyclical markups. The intuition for the relationship between inventories and markups is similar to that described above. If markups are high (i.e., real mar-ginal costs low) relative to the future, a firm should shift production from tomorrow to today and increase its stock of WIP inventories. The WIP framework is some-what simpler than that for finished goods: only the relative (intertemporal) markup appears rather than both the relative markup and the level of the markup. Also, one does not need to take a stand on how inventories affect sales, but instead on how WIP inventories enter the production function.
In summary, these other nonwage approaches to measuring price markups, with the possible exception of Hall (2014), yield results broadly consistent with our own: namely, countercyclical markups. However, they all involve dynamics, requiring one
34 Hall (2014) does consider a dynamic model, with an annual depreciation rate of 60 percent for advertising. Because he maintains a constant discount factor, however, there is no channel from high discounting to reduced advertising during the Great Recession.
35 Bils and Kahn (2000) assume the elasticity of sales to inventories is constant, whereas in Kryvtsov and Midrigan’s (2013) model, which features demand uncertainty, the probability of a stock-out is a constant function of the ratio of inventories to expected demand.

1143BILS ET AL.: THE PRODUCT MARKET WEDGE IN RECESSIONSVOL. 108 NO. 4-5
to measure any adjustment costs and the stochastic discount factor. Our self-employed and intermediates approaches, on the other hand, require only static measurements.
V. Conclusion
Hours worked fall more in recessions than can be explained by optimal changes in labor supply in response to real labor productivity. This labor wedge could reflect distortions in the labor market (e.g., sticky wages) and/or distortions in the product market (e.g., sticky prices).
Research has increasingly focused on problems in labor markets, in particular for firms hiring workers. Using average hourly earnings, the labor wedge seems to arise between the cost of labor to firms and the value of jobs to workers. But this inference could be mistaken if the true cost of labor to firms is more cyclical than average hourly earnings. If labor’s price is measured instead by the wages of new hires or the user cost of labor, then the resulting labor wedge occurs mostly between the cost of labor and real labor productivity.
To bring new evidence to bear on this debate, we estimated the product mar-ket component of the labor wedge without relying on workers’ wages. First, we looked at the self-employed. The labor wedge appears nearly as cyclical for the self-employed as for wage earners, even though sticky wages and matching frictions should not be barriers to the self-employed working more hours. The hours of the self-employed appear to fall in recessions because of difficulty, or reluctance, in selling their output (for example, because of sticky prices). Second, we presented evidence on intermediate inputs. In recent recessions, prices rise relative to the level of marginal cost we infer from intermediate prices and quantities. Again, this sug-gests that firms face difficulty in converting production into revenue during reces-sions. We stress that these two approaches rely on completely different data sources (households versus industries).
Our point estimates imply that the labor wedge’s cyclical variation reflects prod-uct market distortions as opposed to labor market distortions. We cannot reject that labor market distortions matter, though they appear less important than has been inferred using data on average hourly earnings. Our evidence is consistent with a price of labor that is at least as cyclical as the new hire wage.
Our evidence does not determine the exact nature of these product market distortions, which is critical for informing stabilization policy. One explanation would be price stickiness that constrains sales. Another would be countercyclical desired markups (see Rotemberg and Woodford 1999 for a review). If producing has an investment component (e.g., the customer base model in Gilchrist et al. 2017), then tightening financial constraints could make firms raise prices relative to marginal cost in recessions as they cut such investments. Our evidence is also consistent with models where expanding production puts firms in a riskier posi-tion, and risk (or risk avoidance) heightens during recessions (e.g., Arellano, Bai, and Kehoe 2012).
Our findings are also relevant for the puzzle of unemployment’s high cyclicality relative to labor productivity, the Shimer (2005) puzzle. A highly countercyclical price markup translates into strongly procyclical labor demand, beyond what might be attributed to labor productivity. It provides a rationale for firms to create less

1144 THE AMERICAN ECONOMIC REVIEW APRIL 2018
employment in recessions without a decline in productivity, and even absent import-ant wage stickiness.
REFERENCES
Aguiar, Mark, and Erik Hurst. 2013. “Deconstructing Lifecycle Expenditure.” Journal of Political Economy 121 (3): 437–92.
Arellano, Cristina, Yan Bai, and Patrick Kehoe. 2012. “Financial Markets and Fluctuations in Volatil-ity.” Federal Reserve Bank of Minneapolis Staff Report 466.
Atalay, Enghin. 2017. “How Important Are Sectoral Shocks?” American Economic Journal: Macro-economics 9 (4): 254–80.
Bagwell, Kyle. 2007. “The Economic Analysis of Advertising.” In Handbook of Industrial Organiza-tion, Vol. 3, edited by Mark Armstrong and Robert Porter, 1701–1844. Amsterdam: Elsevier-North Holland.
Barro, Robert. 1977. “Long-Term Contracting, Sticky Prices, and Monetary Policy.” Journal of Mon-etary Economics 3 (3): 305–16.
Barron, John M., Mark C. Berger, and Dan A. Black. 1999. “Do Workers Pay for On-the-Job Train-ing?” Journal of Human Resources 34 (2): 235–52.
Basu, Susanto. 1995. “Intermediate Goods and Business Cycles: Implications for Productivity and Welfare.” American Economic Review 85 (3): 512–31.
Basu, Susanto, and Christopher L. House. 2016. “Allocative and Remitted Wages: New Facts and Challenges for Keynesian Models.” In Handbook of Macroeconomics, Vol. 2, edited by John B. Taylor and Harald Uhlig, 297–354. Amsterdam: Elsevier-North Holland.
Bellou, Andriana, and Baris Kaymak. 2012. “Real Wage Growth over the Business Cycle: Contractual versus Spot Markets.” Unpublished.
Bils, Mark. 1987. “The Cyclical Behavior of Marginal Cost and Price.” American Economic Review 77 (5): 838–55.
Bils, Mark, and James A. Kahn. 2000. “What Inventory Behavior Tells Us about Business Cycles.” American Economic Review 90 (3): 458–481.
Bils, Mark, Peter J. Klenow, and Benjamin A. Malin. 2013. “Testing for Keynesian Labor Demand.” In NBER Macroeconomics Annual 2012, Vol. 27, edited by Daron Acemoglu, Michael Woodford, and Jonathan Parker, 311–49. Chicago: University of Chicago Press.
Bils, Mark, Peter J. Klenow, and Benjamin A. Malin. 2018. “Resurrecting the Role of the Product Market Wedge in Recessions: Dataset.” American Economic Review. https://doi.org/10.1257/aer.20151260.
Blanchard, Olivier J., and Jordi Galí. 2010. “Labor Markets and Monetary Policy: A New Keynesian Model with Unemployment.” American Economic Journal: Macroeconomics 2 (2): 1–30.
Bruno, Michael. 1984. “Raw Materials, Profits and the Productivity Slowdown.” Quarterly Journal of Economics 99 (1): 1–30.
Campello, Murillo, John R. Graham, and Campbell R. Harvey. 2010. “The Real Effects of Financial Constraints: Evidence from a Financial Crisis.” Journal of Financial Economics 97 (3): 470–87.
Carlton, Dennis W. 1986. “The Rigidity of Prices.” American Economic Review 76 (4): 637–58.Chang, Yongsung, Sun-Bin Kim, Kyooho Kwon, and Richard Rogerson. 2014. “Individual and Aggre-
gate Labor Supply in a Heterogeneous Agent Economy with Intensive and Extensive Margins.” Unpublished.
Chari, V. V., Patrick J. Kehoe, and Ellen R. McGrattan. 2007. “Business Cycle Accounting.” Econo-metrica 75 (3): 781–836.
Chetty, Raj, Adam Guren, Day Manoli, and Andrea Weber. 2013. “Does Indivisible Labor Explain the Difference between Micro and Macro Elasticities? A Meta-Analysis of Extensive Margin Elastici-ties.” In NBER Macroeconomics Annual 2012, Vol. 27, edited by Daron Acemoglu, Michael Wood-ford, and Jonathan Parker, 1–56. Chicago: University of Chicago Press.
De Loecker, Jan and Jan Eeckhout. 2017. “The Rise of Market Power and the Macroeconomic Impli-cations.” National Bureau of Economic Research Working Paper 23687.
De Loecker, Jan, and Frederic Warzynski. 2012. “Markups and Firm-Level Export Status.” American Economic Review 102 (6): 2437–471.
Galeotti, Marzio and Fabio Schiantarelli. 1998. “The Cyclicality of Markups in a Model with Adjust-ment Costs: Econometric Evidence for US Industry.” Oxford Bulletin of Economics and Statistics 60 (2): 121–42.
Galí, Jordi. 2011. “Monetary Policy and Unemployment.” In Handbook of Monetary Economics, Vol. 3A, edited by B. M. Friedman and M. Woodford, 487–546. Amsterdam: North Holland.

1145BILS ET AL.: THE PRODUCT MARKET WEDGE IN RECESSIONSVOL. 108 NO. 4-5
Galí, Jordi, Mark Gertler, and J. David López-Salido. 2007. “Markups, Gaps, and the Welfare Costs of Business Fluctuations.” Review of Economics and Statistics 89 (1): 44–59.
Garcia-Macia, Daniel, Chang-Tai Hsieh, and Peter J. Klenow. 2016. “How Destructive Is Innovation?” NBER Working Paper 22953.
Gilchrist, Simon, Raphael Schoenle, Jae Sim, and Egon Zakrajšek. 2017. “Inflation Dynamics During the Financial Crisis.” American Economic Review 107 (3): 785–823.
Haefke, Christian, Marcus Sonntag, and Thijs van Rens. 2013. “Wage Rigidity and Job Creation.” Journal of Monetary Economics 60 (8): 887–99.
Hall, Robert E. 1997. “Macroeconomic Fluctuations and the Allocation of Time.” Journal of Labor Economics 15 (1): S223–250.
Hall, Robert E. 2009. “Reconciling Cyclical Movements in the Marginal Value of Time and the Mar-ginal Product of Labor.” Journal of Political Economy 117 (2): 281–323.
Hall, Robert E. 2014. “What the Cyclical Response of Advertising Reveals about Markups and Other Macroeconomic Wedges.” Unpublished.
Ham, John C., and Kevin T. Reilly. 2013. “Implicit Contracts, Life Cycle Labor Supply, and Intertem-poral Substitution.” International Economic Review 54 (4): 1133–1158.
Hamilton, James D. Forthcoming. “Why You Should Never Use the Hodrick-Prescott Filter.” Review of Economics and Statistics. https://doi.org/10.1162/REST_a_00706.
Harper, Michael J., Bhavani Khandrika, Randal Kinoshita, and Steven Rosenthal. 2010. “Nonmanu-facturing Industry Contributions to Multifactor Productivity, 1987–2006.” Monthly Labor Review 133 (6): 16–31.
Heim, Bradley T. 2014. “Understanding Self-Employment Dynamics among Individuals Near Retire-ment.” Unpublished.
Hipple, Steven F. 2010. “Self-Employment in the United States.” BLS Monthly Labor Review 133 (9): 17–32.
Hurst, Erik, Geng Li, and Benjamin Pugsley. 2014. “Are Household Surveys Like Tax Forms? Evi-dence from Income Underreporting of the Self Employed.” Review of Economics and Statistics 96 (1): 19–33.
Karabarbounis, Loukas. 2014a. “The Labor Wedge: MRS vs. MPN.” Review of Economic Dynamics 17 (2): 206–23.
Karabarbounis, Loukas. 2014b. “Home Production, Labor Wedges, and International Business Cycles.” Journal of Monetary Economics 64: 68–84.
Kim, Ryan. 2015. “Price-Cost Markup Cyclicality: New Evidence and Implications.” Unpublished.Kryvtsov, Oleksiy, and Virgiliu Midrigan. 2013. “Inventories, Markups, and Real Rigidities in Menu
Cost Models.” Review of Economic Studies 80 (1): 249–276.Kudlyak, Marianna. 2014. “The Cyclicality of the User Cost of Labor.” Journal of Monetary Econom-
ics 68: 53–67.Levinsohn, James, and Amil Petrin. 2003. “Estimating Production Functions Using Inputs to Control
for Unobservables.” Review of Economic Studies 70 (2): 317–41.Moyer, Brian C., Mark A. Planting, Mahnaz Fahim-Nader, and Sherlene K. S. Lum. 2004. “Preview of
the Comprehensive Revision of the Annual Industry Accounts: Integrating Input-Output Accounts and Gross-Domestic-Product-by-Industry Accounts.” Survey of Current Business 84 (3): 38–51.
Mulligan, Casey B. 2002. “A Century of Labor-Leisure Distortions.” National Bureau of Economic Research Working Paper 8774.
Mulligan, Casey B. 2012. The Redistribution Recession: How Labor Market Distortions Contracted the Economy. Oxford: Oxford University Press.
Murphy, Kevin M., Andrei Shleifer, and Robert W. Vishny. 1989. “Building Blocks of Market Clearing Business Cycle Models.” In NBER Macroeconomics Annual 1989, edited by Olivier J. Blanchard and Stanley Fischer, 247–302. Cambridge, MA: MIT Press.
Nekarda, Christopher J., and Valerie A. Ramey. 2013.“The Cyclical Behavior of the Price-Cost Markup.” National Bureau of Economic Research Working Paper 19099.
Oberfield, Ezra, and Devesh Raval. 2014. “Micro Data and Macro Technology.” Federal Reserve Bank of Chicago Working Paper 2012-11.
Pissarides, Christopher A. 2009. “The Unemployment Volatility Puzzle: Is Wage Stickiness the Answer?” Econometrica 77 (5): 1339–69.
Rosen, Sherwin. 1985. “Implicit Contracts: A Survey.” Journal of Economic Literature 23 (3): 1144–75.Rotemberg, Julio J., and Michael Woodford. 1996. “Imperfect Competition and the Effects of Energy
Price Increases on Economic Activity.” Journal of Money, Credit, and Banking 28 (4): 550–77.Rotemberg, Julio J., and Michael Woodford. 1999. “The Cyclical Behavior of Prices and Costs.” In
Handbook of Macroeconomics, Vol. 1B, edited by John B. Taylor and Michael Woodford, 1051–1135. Amsterdam: North-Holland.

1146 THE AMERICAN ECONOMIC REVIEW APRIL 2018
Saporta-Eksten, Itay. 2014. “Job Loss, Consumption and Unemployment Insurance.” Unpublished.Shimer, Robert. 2005. “The Cyclical Behavior of Equilibrium Unemployment and Vacancies.” Amer-
ican Economic Review 95 (1): 25–49.Shimer, Robert. 2009. “Convergence in Macroeconomics: The Labor Wedge.” American Economic
Journal: Macroeconomics 1 (1): 280–97.Vaona, Andrea. 2016. “A Nonparametric Panel Data Approach to the Cyclical Dynamics of Price-Cost
Margins in the Fourth Kondratieff Wave.” Eurasian Business Review 6 (2): 155–70.